


This article analyses the Genoese financial market in Andalusia at the end of the fifteenth and beginning of the sixteenth century, illuminated by certain archival realities observed after evaluating over three thousand notarial deeds from southern Andalusia. The focus is on the financial mechanisms of clearing and settling payments, pooling resources and transferring economic resources through time and space. The surviving sources clarify the absence of substantial company constitution contracts and legal disputes that could reveal their existence. Instead, there is an overwhelming volume of different instruments and practices aimed at pooling resources, distinct from corporate practices. Therefore, this article systematically and quantitatively studies the various functional aspects of the financial market and the Genoese dynamics within it, to coherently describe and explain its operation during this crucial period, which set the stage for the opening of the Atlantic world and the Middle Passage.
This article focuses on Genoese merchants and their financial environment for two main reasons. First, from a historiographical perspective, there is a significant gap in the study of the fifteenth century, particularly in economic and social history. This gap is especially pronounced concerning the opening of the Atlantic world and the financial phenomena surrounding the mercantile and slave-trading enterprises in this region. Therefore, I have chosen to examine a prominent and representative community with a rich tradition in medieval economic history and significant influence on the economic phenomena of the time and place. Second, the primary objective of this article is to lay the foundation for subsequent research into the financial mechanisms that facilitated the opening of the Atlantic slave trade. Historiography acknowledges that the Atlantic slave trade began well before 1492 (Guidi Bruscoli Reference Guidi Bruscoli2014). However, the impact, growth, and substantial profits of the trade during the fifteenth century, in the absence of chartered companies, still require further exploration. Thus, this article establishes the theoretical framework within which researchers can later evaluate and describe the financial backdrop of the Atlantic slave trade.
As the scope of the research centres on Andalusia, it focuses on the main southern Castilian notarial archives located in Seville, Jerez de la Frontera, and Malaga. Unfortunately, the notarial archives in Cadiz were destroyed by the English in 1587 during the Anglo-Spanish War. The research has also been extended to the Canaries and Valencia to trace networks, routes, and instruments. Additionally, there have been explorations of the central Spanish archive in Simancas and the Chancillería in Granada.Footnote 1 This article aims to study the financial market by analysing exchange and trade records preserved in notarial deeds. In reality, notarial deeds recorded a variety of instruments, providing access to all possible functions of the financial market: methods of clearing and settling payments, mechanisms for pooling resources, and transferring resources through time and space. This was achieved through the recording of debts and payments and the establishment of association contracts, which also provided a venue for conflict resolution. Furthermore, notaries operated in public spaces, and their records were used to corroborate information related to trades and contractual conditions.
Therefore, this article primarily focuses on the economic functions rather than the actual instruments documented in notarial archives. One might wonder why it emphasises deeds over account books; this choice stems from the absence of such sources for Genoese merchants in the relevant period and geography. The article will explore the feasibility of using exchange market sources alone, without cross-examination with accounting sources, to trace and understand financial instruments. This approach contrasts with similar studies that utilised accounting sources to analyse both exchange and financial markets (Bolton and Guidi Bruscoli Reference Bolton and Guidi Bruscoli2008; Goldthwaite Reference Goldthwaite2015; Matringe Reference Matringe2017). As the article will demonstrate, the surviving evidence enables the tracing of commodity trade, existing accounts, factual exchanges, and some business partnerships. However, it presents significant challenges in aspects such as the duration of partnerships or the tracing of partners’ equity and profit–loss without access to comprehensive association contracts or ledgers. These issues will be explored in more detail later, highlighting the unique challenges faced by this research, even with the use of ledgers.
The state of the art regarding medieval financial functions is broad and heterogeneous. Most studies have focused on credit systems and the role of banking, medieval goods exchange markets, or money and currency exchange. For example, Raymond de Roover’s work has been foundational in this field, particularly his research on medieval banking families like the Medici and the techniques they employed, including letters of credit and double-entry bookkeeping (De Roover Reference De Roover1953, Reference De Roover1963). Scholars such as Peter Spufford have emphasised the importance of these fairs, arguing that they were not only centres of trade but also of finance (Spufford Reference Spufford1989). The development of ledger-based systems to track debts and credits at these fairs prefigured modern financial clearinghouses. Similarly, Carlo M. Cipolla explored how money changers operated, particularly in the Mediterranean and the major trade hubs of Europe (Cipolla Reference Cipolla1963). Studies of Castilian history often begin with Ramón Carande’s Carlos V y sus banqueros (Carande Reference Carande2004), which examines the economic strategies employed by Emperor Charles V and his bankers, some of whom were Genoese, during the sixteenth century. However, most academic studies have concentrated on trade dynamics, such as the work of David Igual Luis and Germán Navarro Espinach (Igual Luis Reference Igual Luis1992; Igual Luis and Navarro Espinach Reference Igual Luis and Navarro Espinach1997), which explored the Genoese significance in the silk trade and their broader market presence in Valencia. Therefore, this article aims to establish common ground with trade and other economic studies, where scholars can reach a consensus on the financial structure for commercial operations in Andalusia at the end of the fifteenth century for the Genoese. Furthermore, the article’s functional approach intends to provide a descriptive narrative of financial operations and a better understanding of financial dynamics, which has not been done before.
The recent years have seen highly productive studies about the Genoese. Scholars like Giovanni Ceccarelli have focused on how narratives about risk influenced the development of risk management tools in early modern Europe, particularly focusing on the practice of General Average in maritime trade (Ceccarelli Reference Ceccarelli, Fusaro, Addobbati and Piccinno2023). Sergio Tognetti, in his research on the interactions between Genoa, Pisa and Catalonia, argues that these regions were central to the medieval Mediterranean’s proto-globalisation, fostering interconnected trade networks and institutions that enabled economic integration. He highlights their innovative financial strategies, including maritime insurance, credit systems, and partnerships, which mitigated risks and maximised returns in diverse and volatile markets (Tognetti Reference Tognetti, Cisci, Martorelli and Serreli2023). Others, like Elena Maccioni and Carlo Taviani, have aimed to conduct integrated economic and political histories, evaluating the impact of war on Genoese economic endeavours. Maccioni (Reference Maccioni2022) examines the exchange market and the role of businessmen in Barcelona during the mid fifteenth century, focusing on the period when Alfonso V of Aragon was engaged in wars against Florence, Milan, Genoa, and Venice. This study sheds light on the strategies and key figures involved in the movement of mercantile and financial capital between Italy and the Catalan-Aragonese Commonwealth during Alfonso V’s reign, particularly during the conflict with Florence. Taviani (Reference Taviani2024) studies the interplay between Genoese merchant networks and political factions during the late fifteenth and early sixteenth centuries, highlighting how global trade, the Italian Wars and internal political conflicts influenced each other. Giuseppe Felloni (Reference Felloni2016) argues that Genoa’s financial capitalism evolved through innovative credit mechanisms, partnerships and maritime insurance, enabling the city to dominate Mediterranean and Atlantic trade. He emphasises strategies like commenda contracts, public debt management through luoghi, and the Casa di San Giorgio’s role in stabilising Genoa’s financial and political structures. It is important to highlight that although previous studies agree and corroborate different aspects of this article, particularly those relating to private dynamics and association practices, their reliance on qualitative analysis limits the ability to rigorously test or support these arguments.
The article is organised into four subsections. Section I addresses the clearing and settling of payments, focusing on the use of ghost money, credit and powers of attorney. Section II concentrates on the transfer of economic resources through time and space, centring on the importance of bills of exchange, loans and insurance. Section III explores the pooling of resources, presenting the use of book debt as a mechanism for aggregating capital within financial enterprises. Finally, Section IV provides concluding remarks.
It is important to contextualise that the Ligurian presence in southern Castile began in the thirteenth century when the Genoese first received a set of privileges in 1248 to trade and settle in Seville. This event was part of a broader migration of Genoese to various parts of the world (González Gallego Reference González Gallego1974). For a long time, the Castilian markets offered access to primary goods such as grains and dates, but most notably to olive oil, leather and low-quality cloth. The neighbouring kingdoms of Granada and Aragon also hosted significant Ligurian business activities. However, due to conflicts and political instability, Castile emerged as the most prosperous option (Igual Luis Reference Igual Luis1992; Igual Luis and Navarro Espinach Reference Igual Luis and Navarro Espinach1997). The privileges granted included primarily tax exemptions, a promise from the monarch to allow them to control judicial matters among members of the Genoese nation, and permission to construct their own place of worship. These privileges enabled the Genoese to ensure access to conflict resolution, enhance travel and storage safety, access information, and slightly manipulate the market in their favour. Nonetheless, the whims of the monarch still posed a challenge, but their strong sense of community provided a certain level of security, albeit theoretically.
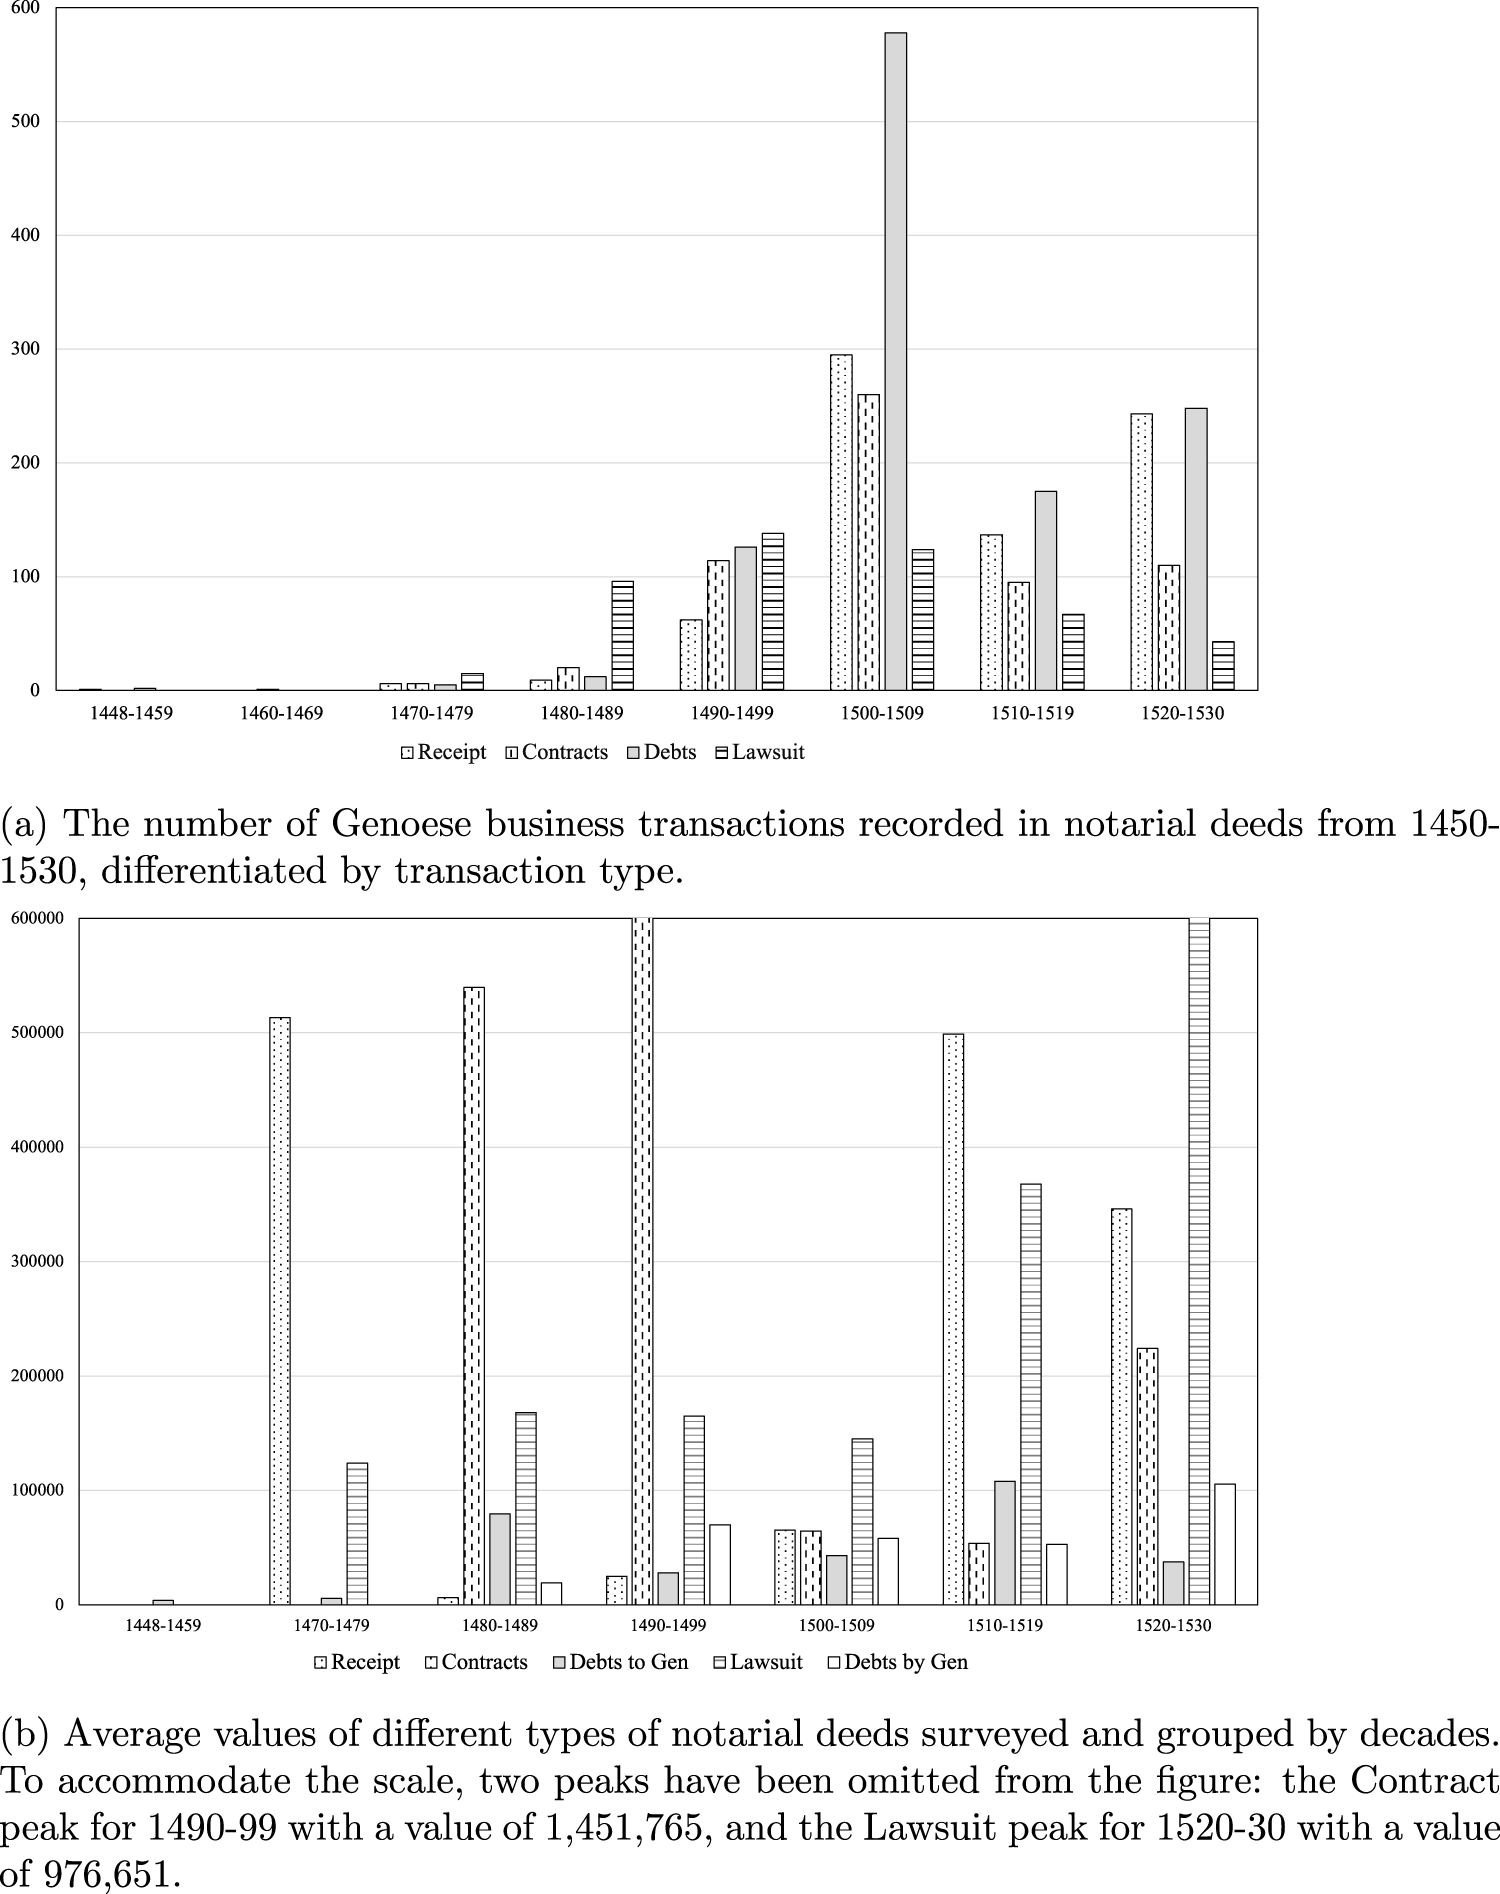
The history of Genoese exchanges and financial manoeuvres is preserved in notarial archives. In Castile, as in the rest of Europe, notaries played a crucial role. They recorded and authenticated a wide range of documents, including contracts, wills, financial transactions, property deeds and lawsuits. Their record-keeping was instrumental in facilitating economic activities by ensuring the legitimacy and enforceability of agreements. This reduced information asymmetries and conflicts in medieval markets. The work of notaries served as a cornerstone of legal security and continuity at a time when written records were scarce and often depended on the expertise and integrity of these individuals. The importance of notary books in facilitating the trade of securities will be further elucidated in the following sections. While there is no certainty regarding the volume of private trade in southern Andalusia, it is undeniable that in any dispute in Castile, there was almost always a note or reference to a notary’s account or testimony. Furthermore, as evidenced in Figure 1, several assumptions about notarial archives and economic dynamics fall short for the Genoese in the Andalusian case.
Analysis of Genoese business transactions and average values recorded in notarial deeds, 1450–1530

First, there are a significant number of receipts (annotations of fulfilment or debt cancellations), constituting 24.9 per cent of the total notarial deeds surveyed. Additionally, the average values of these receipts are generally high. For the first peak in the 1470s, the crest corresponds to archival reality, with only eight deeds present, six of which are valued over 500,000 maravedís (mrs). However, the situation in the 1510s and 1520s differs significantly; in both decades, the number of deeds exceeds 130, and one can be confident that their average value is indicative of market conditions beyond any recorded history. This research suggests that the increase in receipt recording between 1510 and 1520 resulted from generational renewal among the Genoese and the need to establish trust-building practices amid growing Atlantic commerce. Most of the generation that funded Columbus’s voyages had passed away by 1515, leading to new significant figures emerging in the archives (Mesa Reference Mesa2023b). The choice to report debt payments through notary offices aligns with the public nature of these offices, the emergence of new market opportunities and new players. The extra cost of reporting or cancelling a debt at the notary office meant that other merchants would be aware, the account would be legally closed, and reputation could be built around these successful practices.
I
Transactions of any kind are costly and risky for any enterprise. In medieval and early modern times, transaction risks and costs arose from more sources than merely the risk of failing to deliver goods or establish monetary compensation. Coins and mechanisms to secure payments could sometimes be scarce, unnecessarily complex or expensive, thus jeopardising market operations. The limited availability of currency and reliance on bartering or alternative payment methods made even those attempting the most routine transactions resort to secondary mechanisms for completion. Consequently, access to money was the primary challenge faced by individuals and companies engaged in any financial market. In Castile, as in many other regions towards the end of the Middle Ages, the availability of coins was a critical factor in determining market and exchange relationships (Carande Reference Carande2004, pp. 147–80). The crown itself relied heavily on various forms of credit. Common practices, such as the auctioning of alcabala tax privileges to nobles or merchants, allowed the kings to receive money in advance and shifted the challenges of collection and tax evasion to third parties (Ladero Quesada Reference Ladero Quesada1967, Reference Ladero Quesada1991).
Figure 1 depicts, in very general terms, the various notarial deeds examined in this research. Two assertions can be made: first, there was a substantial operation of credit and debts in southern Andalusia during 1450–1530. Second, the currency predominantly recorded in these documents is account money, specifically maravedís. The prevalent use of maravedís in the figures primarily reflects their widespread use rather than a standardisation of different coins for coherent analysis. Specifically, of the 3,000 notarial deeds examined, only 7.4 per cent document actual coins such as ducats, castellanos, pesos or florins. Moreover, among the deeds that recorded other currencies, most were bills of exchange, which accounted for 7 per cent of the total deeds examined.
The use of maravedís by the Genoese is almost exclusive. Ninety-seven per cent of the contracts and transactions they engaged in were denominated in this unit of account. It provided a stable reference value for transactions and exchange rates, as accounts could be maintained in a constant currency. Scholars argue that the use of this ‘ghost’ currency enabled transactions and payments to be executed at will, while conserving coins for other occasions (Gelderblom and Jonker Reference Gelderblom, Jonker, van der Spek and van Leeuwen2018, p. 230). Merchants, bankers and money changers relied heavily on this financial instrument to theoretically extend credit and settle accounts. Therefore, the primary financial instrument in the toolkit of any Genoese merchant was indeed money. Various scenarios and circumstances expanded the usage and prevalence of more sophisticated instruments, such as bills of exchange and powers of attorney.
The abundance of notarial records documenting transactions in ghost money highlights two key realities: first, that credit was a vital aspect of life across all societal strata (Figure 1b); and second, the existence of a network supporting the exchange of such currencies independently of any monarchy’s legal protections. As previously mentioned, credit, akin to other commodities, provided opportunities for conducting business transactions. Merchants made decisions based on future expectations, the advantages of different markets, and social relationships. For the Genoese, several significant instruments and commodities facilitated the use of credit in transactions, including bills of exchange, powers of attorney, ‘I owe you’ contracts (IOUs) and sugar.
The nature of debts and contracts, along with their value, offers a complementary perspective on the market’s effects on business and the Genoese success in Andalusia. The results depicted in Figure 1b demonstrate that credit was essential in this late medieval market. However, Genoese credit did not represent an unlimited purse or extravagant expenses. It is important to remind the reader that the Genoese population in Andalusia, numbering in the hundreds, was not typically organised for the majority of their enterprises, as will be further explained in Section III. The average value of credit operations remained quite consistent over time (Figure 1b), and the goods traded were primarily traditional primary goods and fabrics (Figure 2). Thus, the exchange market facilitated a financial system that underpinned the exploration enterprises, appearing robust and reliable due to its dynamism and relatively low number of lawsuits compared to other notarial operations. Additionally, the results highlight the significance of America and the slave trade, as well as the drastic changes that occurred in business practices once commerce with the Atlantic territories was organised.
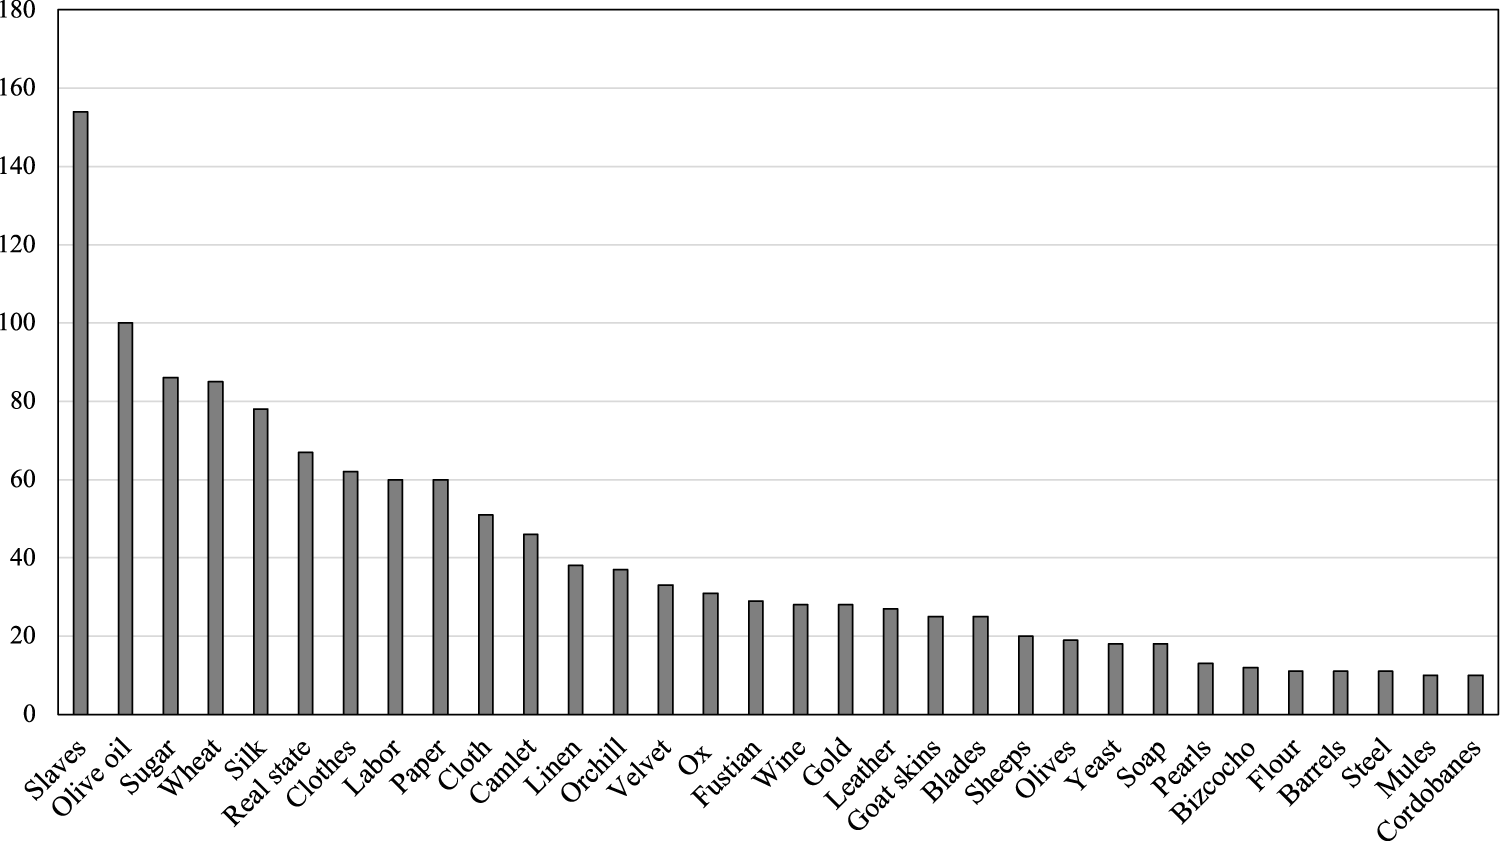
Top traded goods by Genoese merchants in Andalusia, 1450–1530. The figure illustrates goods that appear in at least ten different notarial deeds, representing 9.7 per cent of all the various goods recorded in the notarial deeds.

In its conception, the power of attorney was designed to reduce information asymmetries, granting authority to individuals better positioned to mitigate the risks associated with lack of knowledge. However, its most significant role in this study is facilitating transaction settlements. The legal structure of a power of attorney extends beyond its original intent. In the archives, these documents, like all notarial deeds, adhere to a common juridical format. Their standardised form and repetitive nature simplify comprehension and usage in business dealings. Each document starts with the date and place of its creation, followed by a description of the involved parties, including their place of domicile, residency status and origin. For Genoese merchants with common names, the Ligurian patronymic was often added (e.g. Angelo Cattaneo di Cattaneo).Footnote 2 It then details the nature of the duties assigned to the agent and the territories where these duties may be executed. However, most powers of attorney feature broad and vague descriptions of tasks without territorial limits. This generality opens a multitude of possibilities. Therefore, the mere existence of a power of attorney should not be construed as indicating a partnership akin to a corporate bond. Yet its versatility explains why such contracts are prevalent in the archives. These contracts enable the collection and exchange of debts, thus establishing the groundwork for what can be described as a securities market.
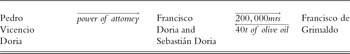
An example illustrating the Genoese use of powers of attorney in conjunction with IOUs raises questions about whether these contracts signified associative bonds between merchants. For instance, Francisco and Sebastián Doria were granted the power to collect 40 tons of oil from Francisco de Grimaldo as a means to settle a debt of 200,000 maravedís that Grimaldo owed to Pedro Vicencio Doria. This scenario highlights the role of such contracts in facilitating the clearance of credit and the transfer of resources within a fundamental exchange (Table 1).Footnote 3
Exchange diagram between the Dorias and Grimaldo

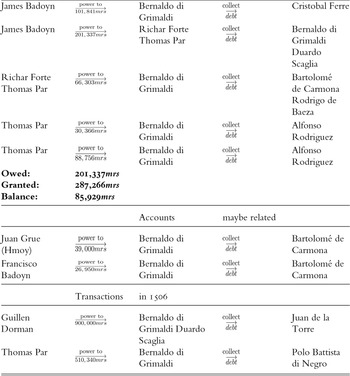
The market facilitated complex operations involving multiple parties, where goods were exchanged and debts settled without the actual transfer of coins. Transactions were often only partially monetised, tailored to the specific needs or interests of the merchants involved. In this context, monetary restrictions impacted merchants and ordinary people differently. For example, when drafting a bill of exchange or a loan contract, a merchant was not required to hold all or part of the value in coin form. In theory, such financial manoeuvres could benefit all parties involved. In the sixteenth century, the Salviati in Lyon would automatically generate loans or conduct exchanges on unbalanced money at the conclusion of various fairs (Matringe Reference Matringe2017, pp. 289–90). This simple operation allowed the value of the money to appreciate in the exchange market through regular accrual of interest. Consider Bernaldo di Grimaldi, a prominent Genoese merchant in late fifteenth-century Seville. He appeared in 14 per cent of the notarial deeds, with his activities referenced in Castilian sources from the 1470s to 1510s, averaging a contract value of 94,640 maravedís. His operations spanned trade to financial manoeuvres, and his reputation enabled dealings with both international and local merchants. Evidence of his olive oil trade with English merchants (Table 2) indicates that Grimaldi incurred debts that extended beyond his immediate network, without the immediate need for repayment. This leads to questions about the necessity of formal association contracts among these merchants when a system based on reputation facilitated swift exchanges.
Exchange diagram between Grimaldi and English merchants. Balance calculated as if Bernaldo di Grimaldi’s business

As shown in Table 2, the financial accounts favour Grimaldi in the year 1504, extending for two months from 2 April to 22 May. First, Grimaldi receives a power of attorney to collect a debt between James Badoyn and Cristobal Ferre for the purchase of clothes.Footnote 4 Then, he and Duardo Scaglia are referenced as debtors in a contract granted to Forte and Par to collect debts in the name of the aforementioned Badoyn.Footnote 5 The exchange evolved with the English using IOUs, revealing accounts up to two years old.Footnote 6 Likewise, in the years that followed, Grimaldi and other Genoese appeared to collect other debts through the power of attorney.Footnote 7 However, the nature of those accounts seems to correspond to a different line of business as they are for twice, even four times the value of the debts recorded in 1504. The only reference to why Grimaldi was receiving these powers to collect from third parties appears in one of the April contracts, in which the transfer of debt was again justified by the debt of some olive oil.Footnote 8
The previous example of trade depicted in Table 2 is identified as an exchange of securities and forms of settling payments. This classification arises because these IOU contracts were being traded as commodities. Essentially, Grimaldi capitalised on the credit of English merchants to actively generate profit. He accepted debts that were profitable for him to collect in retribution for some other pending resource. Remarkably, he could settle accounts, most likely with a profit, without ever receiving coins or goods. This practice prompts questions about the actual existence of money (Gelderblom and Jonker Reference Gelderblom, Jonker, van der Spek and van Leeuwen2018, pp. 230–1). In this context, merchants effectively created credit, with coins or goods promised for exchange multiple times. Credit, in turn, engendered money, whose value was theoretically contingent upon the eventual exchange of a good. This process involved the parties’ agreement on the goods’ value and their awareness of prices and availability. However, once a notarial deed was executed, money materialised without the immediate necessity for metal coins or tangible goods as backing. More exchange and wealth could be generated from the initial credit transaction, fostering a complex financial architecture. Recently, scholars such as Safley (Reference Safley2019), Puttevils (Reference Puttevils2021), Drelichman and Voth (Reference Drelichman and Voth2011) and Gelderblom and Jonker (Reference Gelderblom, Jonker, van der Spek and van Leeuwen2018) have explored the nuances of bankruptcy, the stability of this intricate financial system and the conditions that precipitated its eventual collapse.
Notarial deeds do not shed light on whether Genoese merchants conducted credit history checks on individuals before engaging in business transactions. Typically, notaries documented names, professions, spouses and places of residence. In cases of protested bills of exchange, it was sometimes explicitly noted that there was no prior knowledge of the drawer of the bill. For instance, an archival record states, ‘Jerónimo Bonensene declared he owed nothing to the aforementioned Tomas Colon, nor did he know him, nor was he aware of his identity.’Footnote 9 In IOU transactions, the value of the IOUs typically corresponded to the value of goods or services, serving as collateral inherent to the transaction itself. Under the law, individuals were subject to the seizure of goods for unfulfilled contracts, a rule that also applied to Genoese merchants. For example, in 1495, Nairone settled the debts of Juan and Pedro Fernández de la Alcoba to recover seized goods.Footnote 10 IOU-based loans thus relied on tangible securities such as goods, services or contracts that clearly defined the conditions of the financial transaction. Nevertheless, bills of exchange do indicate the existence of credit networks that extended beyond mere familial ties.
II
The transfer of resources across both time and space has been a linchpin of financial evolution. The importance of Genoese merchants in medieval and early modern times is often limited to the movement of wealth, commodities and capital across geographical boundaries and temporal horizons. However, their greatest triumph lies in their ability to manage financial instruments and mechanisms that enabled this resource flow. Bills of exchange, loans and insurance were not merely financial tools but the lifeblood of economic activity during the period under study. This section explores the significance of these mechanisms, examining how they facilitated the transfer of economic resources, and, more importantly, how they were adapted to meet the demands of ever-changing circumstances.
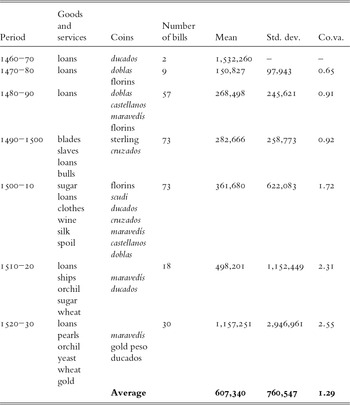
The regular use of bills of exchange is evident in the movement of funds between cities (Table 3). Bills were essential for most Genoese businesses involving significant volumes of trade, including the movement of grain, sugar, slaves, olive oil, dyes, gold, silver, wine and fabrics. However, there was also a movement of funds that appeared purely financial or was difficult to identify without account books. This challenge arises from the fact that Genoese merchants primarily operated individually, maintaining numerous accounts over many years, which each merchant could balance in as many ways as business permitted.
Selected bills of exchange by decades (mean and standard deviation in maravedís, and coefficient of variation)

The data reveal a significant increase in the use of bills of exchange for loans from 1460 to 1530. The mean value of bills employed for loans surged from 150,827 in 1470–80 to 1,157,251 in 1520–30, representing a remarkable growth of over 700 per cent during this period. Simultaneously, the standard deviation of bills used for loans also expanded, from 97,943 in 1470–80 to 2,946,961 in 1520–30, indicating an increasingly dispersed distribution of bill values. Furthermore, the coefficient of variability, a measure of relative dispersion, experienced a substantial rise throughout the period, ascending from 0.65 in 1470–80 to 2.5 in 1520–30. This implies that the variation in bill values increased relative to the mean value. This variability could be attributed to the parallel surge in the utilisation of bills of exchange for various other purposes, encompassing trade in blades, slaves, papal bulls, sugar, clothes, wine, silk, ships, orchill, wheat, pearls and yeast. Collectively, the data underscore the growing significance of bills of exchange as pivotal financial instruments from 1460 to 1530. This transformation can be attributed to several factors, including the expansion of trade and commerce, the rise of merchant banking and the increasing sophistication of financial markets.
At the end of the fifteenth century, bill movements primarily revolved around the most prominent merchants. This research argues that, for Genoese merchants, reputation was more important in attracting business than family bonds, a conclusion supported by the rise in the coefficient of variability found in Table 3. A surviving record from 1495 in the notarial archives of Seville reveals an account balance between Bernaldo Pineli, acting on behalf of Tadeo and Clerigo di Negro, Genoese residents, and Francesco di Negro.Footnote 11 Francesco was the brother of Tadeo and Clerigo; however, the legal representation of Tadeo and Clerigo’s interests in Seville was vested in Bernaldo Pineli. This authority was granted through a power of attorney – ‘y por virtud de una carta de poder, escrita en latín de letra genovesca y declarada en romance’. Nonetheless, this did not imply the absence of dealings between Francesco and his brothers. The document depicts a world of exchange where the balancing of accounts involved numerous merchants and businesses. The family bond was flexible, serving the purpose of debt settlement when necessary. Furthermore, the accounts were not joint between Tadeo and Clerigo, as each conducted their own business.
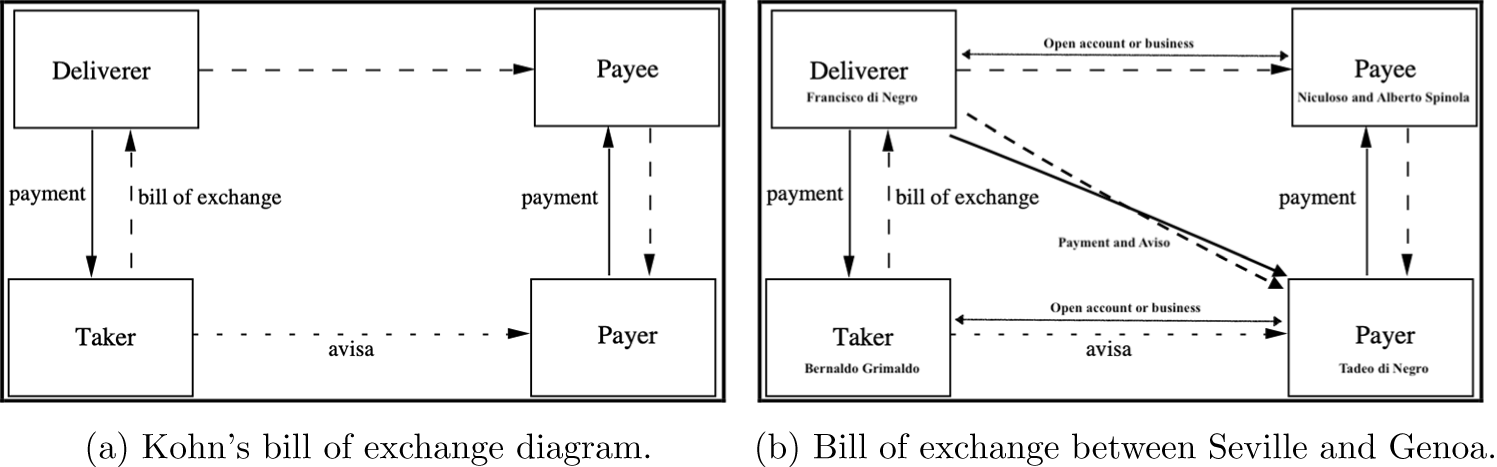
Francesco paid his brother Tadeo 87,700 mrs from a bill of exchange sent to Genoa, which was paid to Niculoso and Alberto Spinola.Footnote 12 However, the taker of the bill in Seville was Bernaldo Grimaldi, previously mentioned. Thus, the payer of the bill was Tadeo di Negro. Francesco’s payment represented only a fraction of the bill, as its total cost was 1,000 doblas, to be paid in Castellano, with each dobla valued at 420 mrs. The remainder of the bill’s value had been paid earlier, as Pineli states that all debts had been cleared by this time. From this example (Figure 3), it is evident how flexible and variable these financial instruments could be (Kohn Reference Kohn1999, p. 2; Bolton and Guidi-Bruscoli Reference Bolton and Guidi-Bruscoli2021). However, the nature of the business dealings between Grimaldi and Di Negro, or with Spinola, remains unclear. What is evident is that the market was characterised by great complexity and dynamism.
The use of bills of exchange diagram

The previous example illustrates the movement of funds, independent of bullion or goods. This does not imply the absence of connections to tangible goods; rather, it highlights that notarial evidence allows us to trace financial operations beyond theoretical models. However, transactions involving physical goods or remittances are not sufficiently documented without surviving account books. In such instances, the records of at least three parties would be required to fully understand the scope of business relationships. In essence, this example offers insights into the monetisation of goods and services, as well as their exchange on credit terms. Moreover, it demonstrates that Genoese merchants were willing to bear the costs associated with credit operations, benefiting socially and economically through swift exchanges and increased market dynamism.
The record of Francesco and his brother Clerigo’s business presents a contrast to the previous example. Clerigo’s business can be divided into two parts. First, there appears to be a previous commenda contract, under which Francesco received 1,514 blades, three bristle spools, and eight steel balls. In total, Francesco returned 132,095 mrs to his brother from the sale of these goods.Footnote 13 Additionally, there was another shipment of 2,073 blades that arrived in Seville via Cadiz, transported by Francisco Cattaneo, costing 358,938 mrs.Footnote 14
The second part involves a bill of exchange from Seville to Genoa, again for 1,000 doblas, to be paid in Castellanos, each valued at 420 mrs. Francesco appears as the deliverer, and Clerigo is the payer. In this case, the taker in Seville was Juan Lomellini, and the payee in Genoa was Marco Centurion. What is particularly intriguing about this case is that the origin of this transaction dates back to a previous bill of exchange. Unfortunately, the original bill does not survive in the archive’s file. The notarial deed records that Clerigo had sent a bill from Genoa to Francesco to be paid by Geronimo and Pedro Vicencio Doria in Seville. However, payment was never made, and the bill was returned to Genoa with interest, increasing its value to 91,156 mrs.
As observed in Table 3, there is a consistent evolution in the number and statistics of bills of exchange in the Southern Andalusian market. The prevalence of transactions where no actual coins changed hands steadily increased over time. This market facilitated the avoidance of cash payments, a practice widely recognised by scholars across Europe (Kohn Reference Kohn1999; Van der Wee Reference Van der Wee2013; Bettarini Reference Bettarini2015; Gelderblom and Jonker Reference Gelderblom, Jonker, van der Spek and van Leeuwen2018; Bolton and Guidi-Bruscoli Reference Bolton and Guidi-Bruscoli2021). Gelderblom and Jonker argued that cultural or social values may have incentivised these practices. This approach to credit, where individuals sought out the most prominent financiers for credit operations, regardless of asymmetric relations, was likely to have been appealing to the parties involved, creating a form of social capital that transcended kinship ties (Gelderblom and Jonker Reference Gelderblom, Jonker, van der Spek and van Leeuwen2018, p. 233).
Although the previous cases exemplify the market dynamics concerning the movement of bills of exchange, they demonstrate that the interconnection between individuals in bills of exchange goes beyond the traditional supposition of family or corporate dominance over such instruments. There is another way to study the evidence collected to further argue in favour of these private and dynamic enterprises. The complete set of bills contains two distinct networks: one of association and another of transactions. In other words, the association network (Figure 4b) means that each edge represents the existence of a taker–payer or deliverer–payee relationship, which can be corporate or related to credit. The transaction network (Figure 4a) means that each edge represents the presence of a taker/payer-to-deliverer/payee relationship evidenced in each bill of exchange.
The network of bills of exchange in southern Castile, 1460–1530. The network consists of 262 bills in the analysed set. (a) Degree Centrality: Mean of 0.0106 and Max of 0.1228; Betweenness Centrality: Mean of 0.0011 and Max of 0.0512; Closeness Centrality: Mean of 0.0442 and Max of 0.0987. (b) Degree Centrality: Mean of 0.0082 and Max of 0.0793; Betweenness Centrality: Mean of 0.0001 and Max of 0.0054; Closeness Centrality: Mean of 0.0095 and Max of 0.0793. For full details, click on the name for the hyperlink.

Although the graphics may illustrate two different networks, the smaller orbiting networks, whether single pairs or triangles in both graphs, correspond to low-frequency transactions or associations. The higher number of independent clusters in Figure 4b, can be attributed to two factors: first, the sporadic use of bills of exchange, and second, the atypical destinations for the collection of the bill. Of the complete set of bills (262), one finds that the difference in the number of edges between both networks is less than one hundred (579 vs 493). Therefore, there are no clearly dominant relationships between taker–payer or deliverer–payee, which the traditional understanding would suggest as long-standing partnerships or roles within a broader economic structure. One might expect that, since these relationships can be more stable and occur less frequently, the difference would be greater if the financial dynamics were dominated by family bonds or corporate interests.
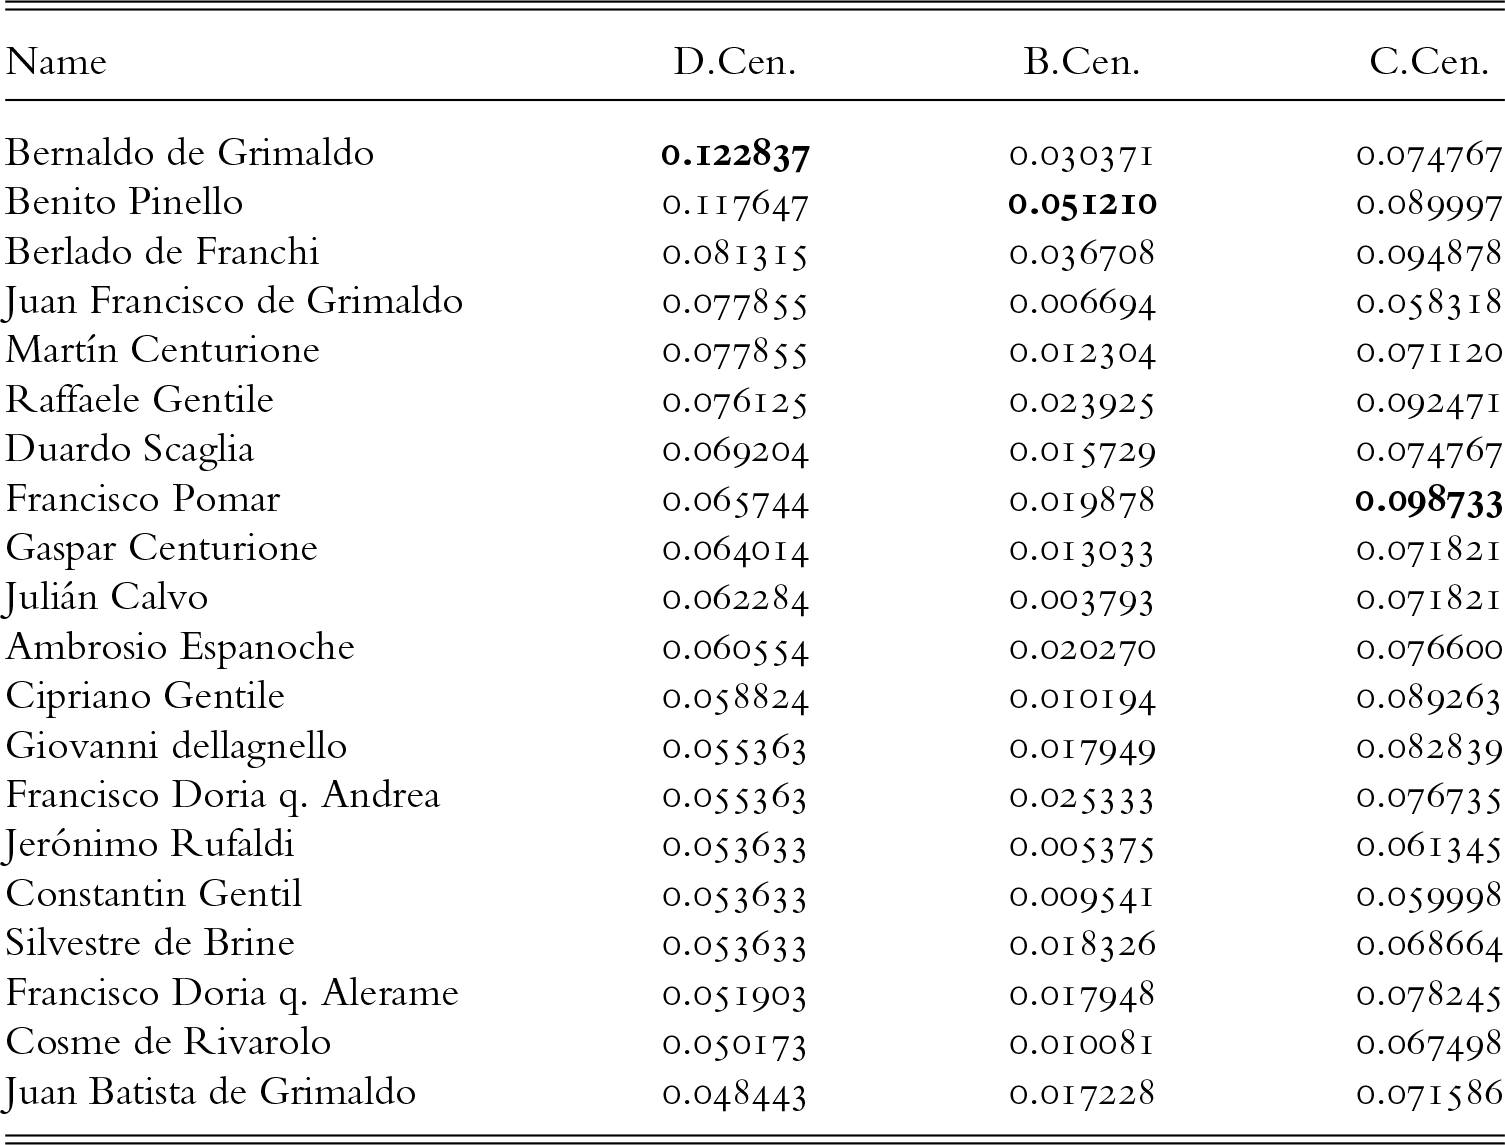
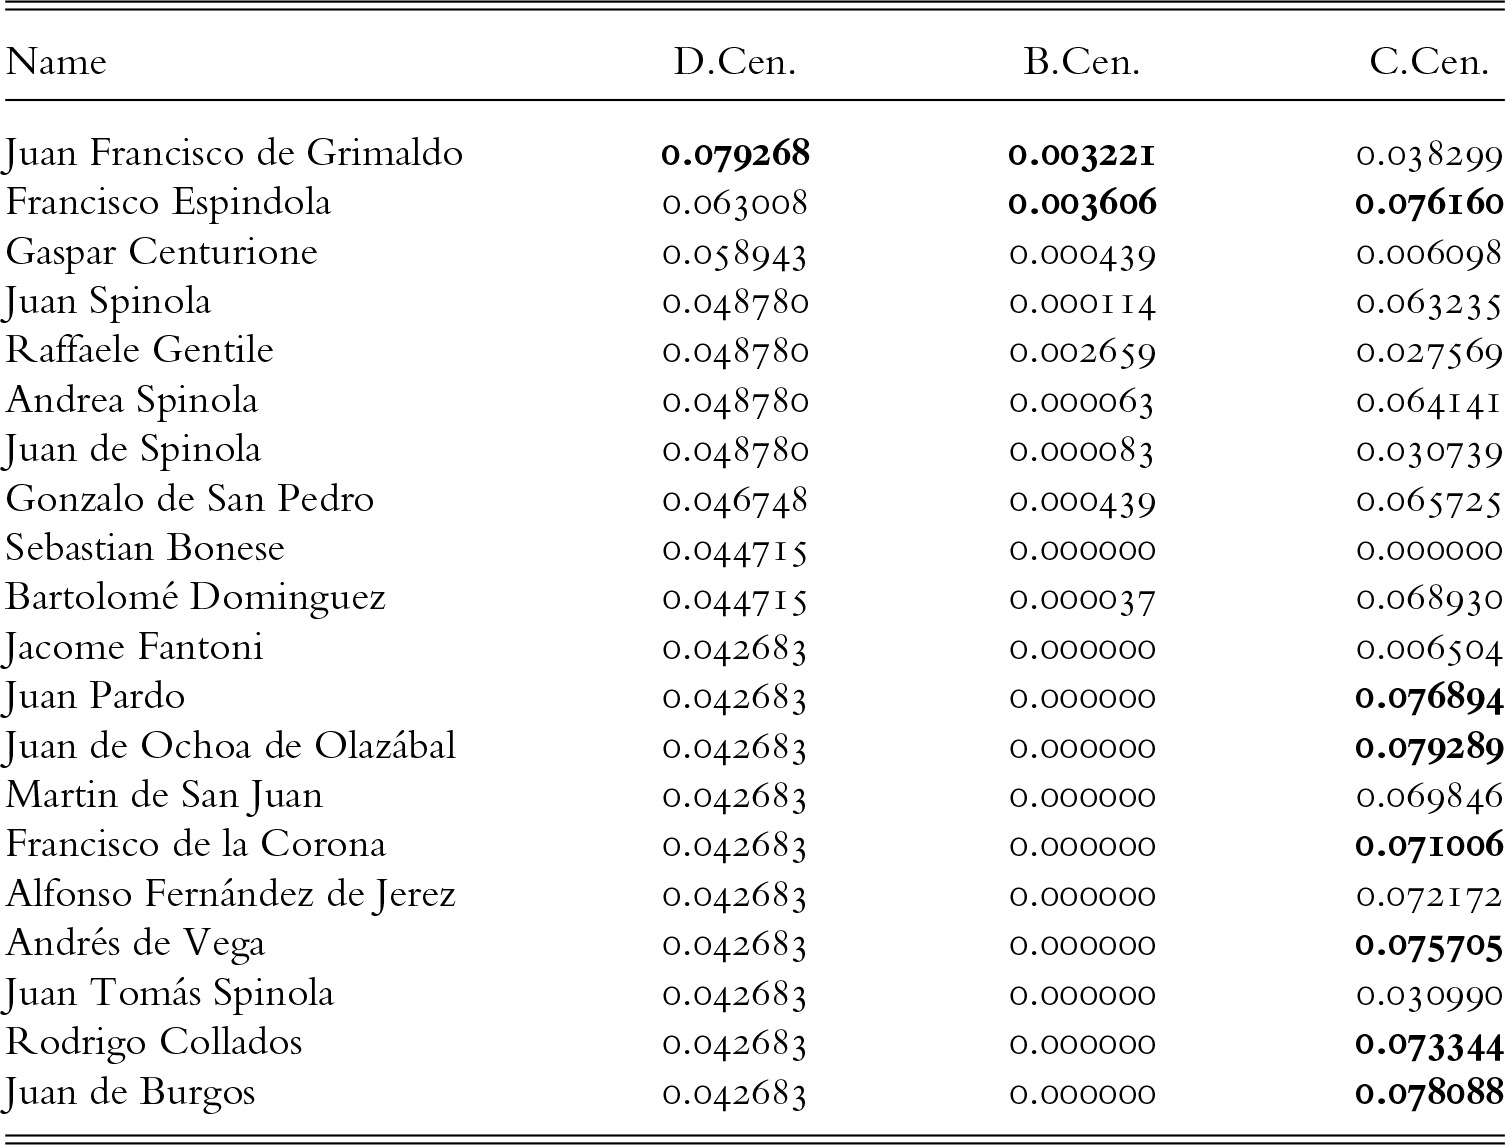
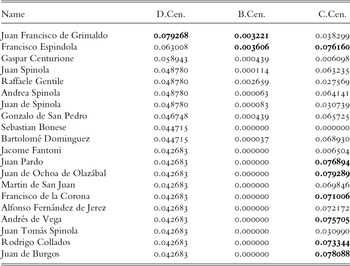
The analysis of individuals further confirms the arguments presented here. The top-scoring individuals in the transaction network are prominent figures in sixteenth-century Atlantic history, with Bernaldo de Grimaldo, Benito Pinello and Martín Centurione at the forefront in Table 4, and the rest being Genoese or Florentine. However, in the association network, 11 of the individuals are neither Genoese nor foreign, and most of the top individuals from Table 4 do not reappear in Table 5.
Top 20 nodes by centrality measures of transaction network. Degree Centrality (D.Cen.), Betweenness Centrality (B.Cen.), Closeness Centrality (C.Cen.)
Top 20 nodes by centrality measures of association network. Degree Centrality (D.Cen.), Betweenness Centrality (B.Cen.), Closeness Centrality (C.Cen.)
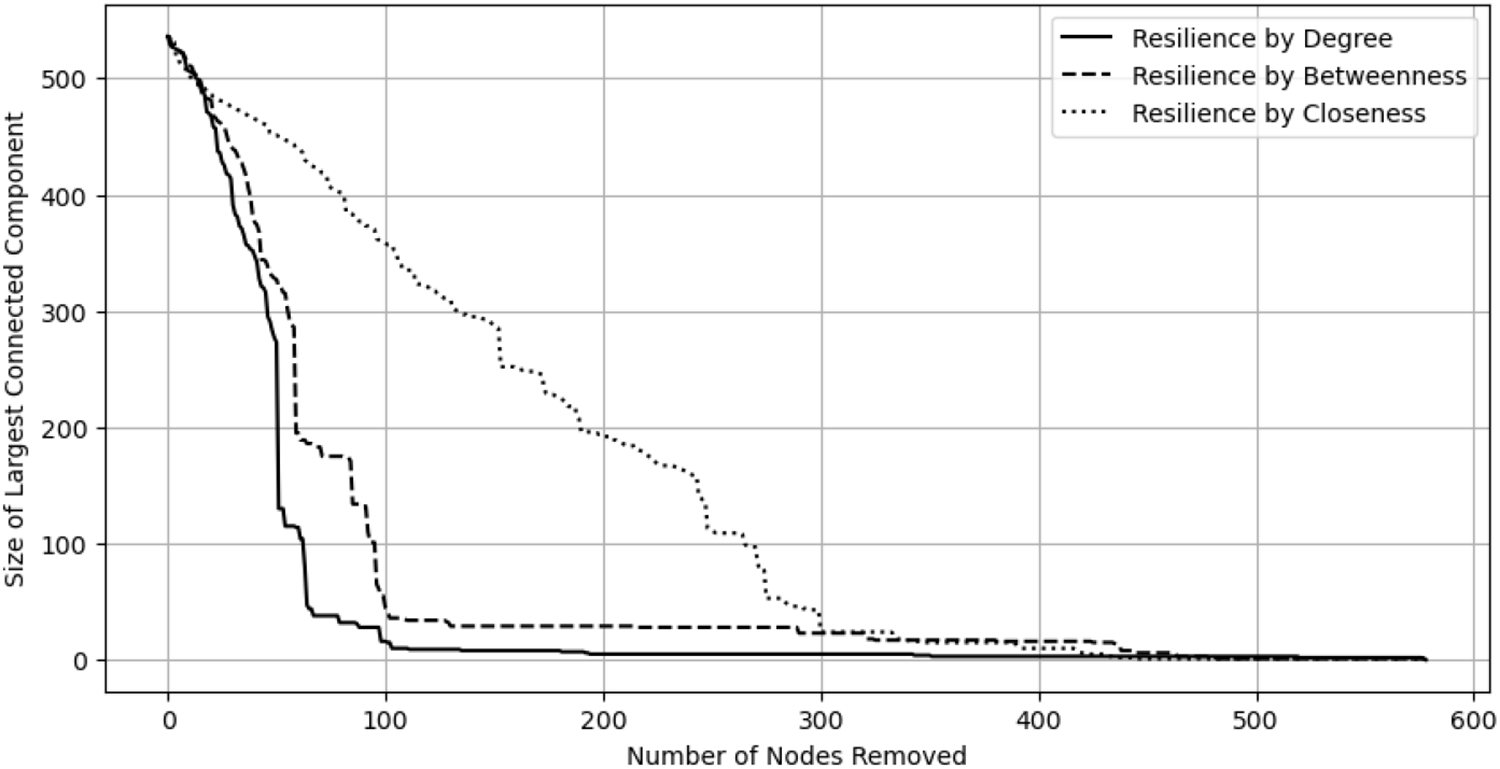
The final test that could be performed on the networks to assess their reliance on prominent individuals is a resilience test on the transactions network, such as percolation or robustness analysis, to determine how the removal of high-centrality nodes affects the network. This can illustrate the network’s dependence on these individuals. As evidenced in Figure 5, the analysis of the network’s resilience based on degree centrality (continuous line) shows a steep initial decline, suggesting that removing nodes with high degrees significantly impacts the network. This indicates that nodes with high degrees are critical for maintaining network connectivity, supporting the idea that prominent network members (those with many connections) play vital roles in the network structure. The betweenness centrality (dashed line) exhibits a similar decline, although less steep compared to degree centrality, but continues to decrease as more nodes are removed. This pattern suggests that nodes with high betweenness centrality are crucial for facilitating interactions between other nodes, acting as bridges within the network. Their removal gradually diminishes the network’s cohesion, indicating that these intermediaries are also significant, but their impact unfolds over a more extended range of removals. Finally, closeness centrality (dotted line) declines more gradually, reflecting that while close nodes are important for shorter paths and quicker interactions within the network, their removal does not immediately cause large sections of the network to become disconnected. This demonstrates a more distributed importance across several nodes rather than reliance on a few.
Network resilience analysis across different centrality measures. This graph depicts the size of the largest connected component as a function of the number of nodes removed, illustrating network resilience under three different centrality-based node removal strategies: degree centrality (solid line), betweenness centrality (dashed line), and closeness centrality (dotted line).

Other instruments, such as IOUs or bills, inherently possess a credit-based nature. However, by 1510, trade with America had become a more common and increasingly attractive commercial destination, particularly for the ports of Seville and Cadiz. The significance of America as a port can be contextualised by the figures presented in Figure 1, which illustrate how the recorded number of transactions and average values for completed transactions predominantly concentrate in the last two decades of this study. The number of captains and seamen in the records requesting loans to equip or secure their voyages increased over the years. From a financial perspective, providing loans for any American enterprise was ideal for the Genoese. Unlike in Europe or the Canaries, where business opportunities existed at every stage of the production chain, in America, especially in the early sixteenth century, Queen Isabella prohibited travel and property ownership for all foreigners, even naturalised ones. Unintentionally, the queen’s actions created conditions for all foreigners to operate as the bankers of the conquest of these territories. An examination of the Genoese experience in the Canary Islands reveals that functioning as bankers allowed them to mitigate most of the social, political and cultural risks while still benefiting from the economy (Mesa Reference Mesa2023a).
There were credit transactions where reputation was verifiable. Loans or any form of credit contracts with ship captains were among them. The captains were inevitably tied to the ship, making it possible to track them, which provided a significant advantage. It can be argued that one reason why merchants entered into so many agency contracts with shipmasters and captains in the sixteenth century was the simplicity and efficiency they offered, in contrast to the costs of employing or maintaining a factor or branch office in multiple cities (Jiménez Montes Reference Jiménez Montes2020). For instance, Juan Farfan, the shipmaster of the Santa Trinidad, obtained three loans from different Genoese bankers on behalf of the ship’s owner, Diego de Nicuesa, for the same trip to Santo Domingo in 1508. On 17 August, he borrowed 126,250 mrs from Benito Doria and Ambrosio Spinola.Footnote 15 On 9 September, Farfan secured a loan of 165 ducats (69,300 mrs) from Batista Centurion.Footnote 16 Finally, on 12 September, he borrowed 75 ducats (40,000 mrs) from Benito Pomar.Footnote 17 As with the previous example, other shipmasters and various Genoese bankers often executed contracts with the same notary, indicating common knowledge of the transactions among Genoese merchants. This suggests that the merchants were aware of each other’s business, fostering a sense of security. However, it is important to note that the shipmaster could change at any time. For example, in May of the same year, the shipmaster of the Santa Trinidad was Alfonso Quintero. Nonetheless, the loan bond remained attached to the ship and the enterprise.Footnote 18
Insurance was the institution used to mitigate risks, particularly with the expansion of Atlantic markets, which inherently involved a credit component. Some scholars have even suggested that merchants concealed credit transactions as insurance to evade persecution by the Church (Van Doosselaere Reference Van Doosselaere2009, pp. 182–94). The commercialisation of these instruments sparked a revolution in Genoa during the fifteenth century, significantly impacting transatlantic commerce and transforming trade in the northern Atlantic and the rest of Europe (Gelderblom Reference Gelderblom2015, p. 105).
Various forms of insurance evolved depending on the specific needs and characteristics of different ventures. However, these contracts typically included the name of the insured, the insurer, a description of the goods, and the insured amount. Agreements were subject to variations based on factors such as travel routes, duration, specific clauses addressing potential issues, or provisions for contingencies (Piccinno Reference Piccinno and Leonard2016). Insurance contracts could be drawn up in the name of the insured or, more commonly, depersonalised to focus on the ship, allowing the insurance to be transferred to other parties. In many cases, the risks of a company were shared among multiple insurers, each responsible for a portion of the total amount, leading to the emergence of insurance companies. Merchants began participating in the risks of numerous voyages simultaneously (Lambert Reference Lambert2011, pp. 124–9). Premiums paid to insurers, while not specified in contracts due to canonical prohibitions, were relatively modest and primarily dependent on the route rather than the journey’s duration. For instance, a 6 per cent premium might be charged for the short trip from Genoa to Sardinia, a notorious pirate hotspot, while a longer voyage from Chios to Flanders might incur a 10 per cent premium (Van Doosselaere Reference Van Doosselaere2009, pp. 206–7).
However, the mere existence of these contracts did not guarantee their fulfilment or the honouring of agreements by the heirs of the involved parties. For instance, in 1522, French pirates seized a ship returning from America, but it was subsequently intercepted by a Portuguese fleet and brought to Lisbon. The cargo belonged to Pedro Juan de Riberol, Franco Leardo, Pedro Benito Basignana, Esteban da Forne, and Leonardo Cattaneo da Miguel Angel.Footnote 19 The most valuable items aboard were pearls and gold. Legal disputes dragged on for years, with powers of attorney being issued to send envoys to Portugal in an attempt to recover the shipments.Footnote 20 The possibility of recovering the shipment kept everything in a state of suspense, and insurers also sought to claim the cargo through their own means.Footnote 21
III
Business between merchants occurred through both partnerships and specific transactions. The juridical forms in place in Castile during the fifteenth and sixteenth centuries continued to be influenced by Alfonso X of Castile’s Partidas (Ortega Cera Reference Ortega Cera, Hernando and Carvajal de la Vega2012, pp. 261-86). The formation of companies (compañías) represented the union of people working towards a common goal. Although the institution existed and bore similarities to the Genoese commenda, such contracts are not statistically significant in the surviving archives, with only 28 contracts found among the 4,000 sources examined. Additionally, a different institution, the encomienda, governed business in the colonial enterprises in America (Zavala Reference Zavala1935; Keith Reference Keith1971). In her studies, Agatha Ortega argues that while the contracts themselves do not survive, they surely existed, as other contracts, such as ‘promises of payment’, recorded the relationship between individuals as compañeros (partners) (Ortega Cera Reference Ortega Cera, Hernando and Carvajal de la Vega2012, p. 272). Nevertheless, there are no juridical records where shared liability appears as a constitutional element of the company contract (Taviani Reference Taviani, Sicking and Wijffels2020).
A different institution appeared to govern liability issues in the Castilian markets – the mancomun. However, the use of this contract is primarily limited to Castilians who needed to settle debts post facto.Footnote 22 Few Genoese engaged in such contracts, as they involved the deferral of payment and responsibility to a co-signer who was not part of the original transaction. This aligns with Dari-Mattiacci’s argument that late Middle Ages contracts involved ‘individuals (societas) sharing losses and gains’ (Dari-Mattiacci et al. Reference Dari-Mattiacci2017). One contract names Francisco di Rivarolo as the co-signer of Bartolome de Fontana, who served as the lessor and tax collector in Gran Canaria in 1501, for an amount of 80,000 maravedís. Footnote 23 Fontana failed to pay the Spanish monarchs, leading them to grant Pedro Rondinelli (Florentine) the task of collecting from Fontana’s warrantor. The document records Rivarolo’s responsibility to pay, as per the order from the king and queen. Subsequently, the document records Rivarolo’s request for time to answer the order, followed by Rondinelli’s testimony, stating that Rivarolo hadn’t responded and had left Seville. The exact order from the monarchs is missing from Seville’s provincial archive, leaving no evidence of the subsequent developments.
So far, this article has analysed the role of IOUs and bills of exchange in the circulation of credit. However, the credit which existed to meet the needs of the system to transfer resources through time and space also functioned as a mechanism for pooling resources. In theory, credit is not a mechanism for pooling resources, as its function is to transfer resources through time. However, in pre-modern Castile, there was virtually no control over the speculative practices that merchants/bankers could engage in, nor over the required reserves they needed to maintain. The operations and practices, which can be traced through ghost money, can point towards the use of lines of credit as a means to pool resources. This is evident when observing operations were financed from open lines of credit or unpaid debts that a merchant/banker had at a given time.
The examined data show the settling of debt through debt transfers. If one were to focus only on the micro transaction nature of the operations, or on the individuals, the picture would show simply that a merchant ‘a’ owes ‘b’ n amount of coin for x amount of product. Subsequently, the payment of the debts in the market would depict ‘b’ giving ‘a’ the power to collect from ‘c’ n or some other quantity, and so on for other debts until settling the debt. This sort of operation was examined in the previous section and exemplified in Table 2. The fact is that this operation shows that merchants accepted a third party’s debt as payment (partial or total). If credit was so prolific and trust in the conflict resolution mechanism offered by the Castilian crown was so great, this could create the conditions for small or medium merchants to enter into larger enterprises without being required to create companies or partnerships.
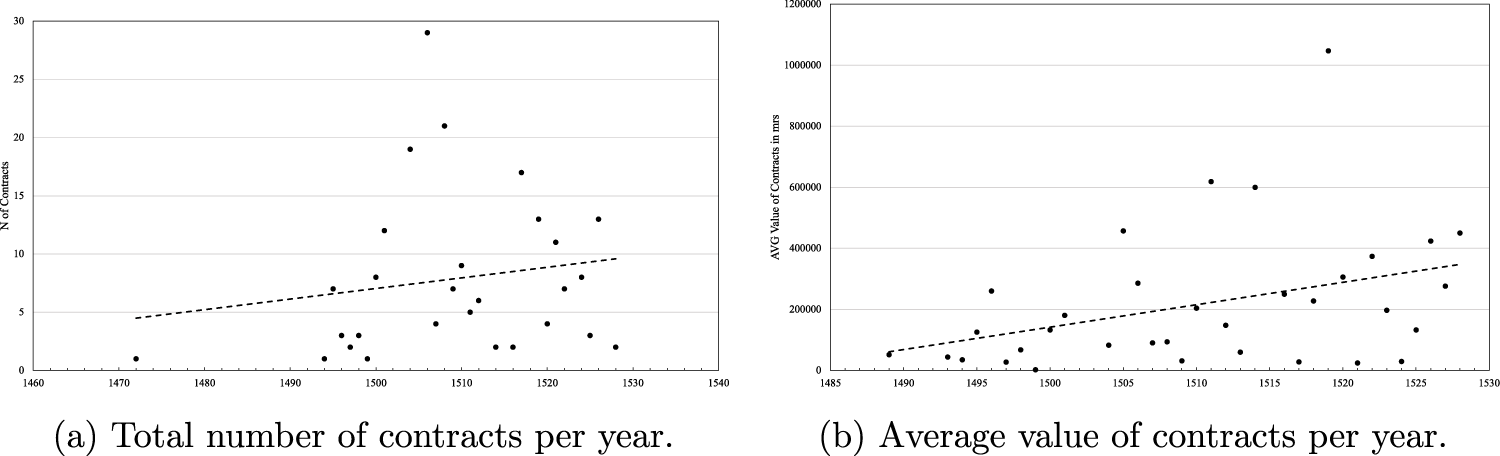
Figure 6 shows that there is, in fact, a relevant number of contracts recording third-party debt as payment. The average value of this credit operation was around 200,000 mrs, equivalent to the price of 200 quintals of olive oil in 1506.Footnote 24 Nevertheless, the majority of contracts had a value below 90,000 mrs. The contracts that surpassed the average were related to American business. For example, one of these was a transaction made by members of the Columbus family, who entered into trade with an IOU from the Spanish monarchs.Footnote 25 Merchants like the Columbus family did not possess the liquidity, collateral or reputation required to engage in a business totalling 600,000 mrs without some form of backup. Furthermore, since they lacked the qualifications for such a significant business venture, who would enter into a partnership agreement with them? It was only through book debt that they could borrow money for investment projects.
Distribution of contracts recording third-party’s debt as payment. (a) Depicts 290 contracts, equivalent to 28.3 per cent of the total debt or credit operation examined. (b) Depicts 209 contracts that actually recorded the third-party’s debt value, equivalent to 20.4 per cent of the total debt or credit operation examined.

The use of book debt borrowing also raises other questions. First, as discussed above following Figure 1a, is the absolute importance of credit and the absence of recorded debt clearing in notarial sources. However, when one combines the number of receipts and the number of deeds recording third-party debt as payment (646), the actual percentage of complete transactions reported in the notarial archives is 53.2 per cent, highlighting the significance of notaries and judges in Castile. Second, what was the actual reach and impact of this function of credit as a mechanism for pooling resources? The reality is that, although the examined samples provide relevant results, they remain small in comparison to the available volume of sources in Castile and Europe. The regression analysis in Figure 6 reveals that there is no significant relationship between the number of contracts, their value and their date. This complexity underscores the need for further study of medieval financial systems and future research.
IV
In recent years, economic historiography has extensively explored general phenomena related to Genoa and its medieval and later economy (Epstein and Epstein Reference Epstein and Epstein2001; Beneš Reference Beneš2018). This focus can be attributed to a lack of consensus on fundamental principles in the financial and commodities market, in contrast to regions like Florence. In Florence, scholars can confidently delve into individual or corporate studies, benefiting from a well-established understanding of the Florentine market. However, when it comes to Genoa, scholars often exercise caution due to the city’s remarkable adaptability and its capacity to engage across diverse markets. This research aims to highlight the enduring traits of flexibility and freedom as consistent features of Genoese economic endeavours.
In addition, this research finds that the market characteristics in Castile, along with the financial culture of Genoese merchants, primarily foster individual and short-term enterprises. These business practices, combined with a robust notarial system, coincide with a reduced need for centralised corporate structures and redundant accounting methods. Therefore, the discernible face of the financial market is that of securities trading and credit extension.
For late medieval Genoese merchants, using cash incurred additional expenses in most commodity trades. Consequently, the use of coins was avoided whenever possible. This research demonstrates that the extensive use of account money enabled Ligurians to access trade and markets with flexibility and agility. Furthermore, the significant importance of credit, the extensive use of loans in daily life and the widespread use of ghost money all created the conditions for a market to thrive, even in the absence of circulating metal coins (Gelderblom and Jonker Reference Gelderblom, Jonker, van der Spek and van Leeuwen2018, p. 240).
The significance of various credit instruments, such as loans, bills of exchange, or IOUs, extended beyond mere payment deferral. The legal framework and widespread utilisation of notaries enabled merchants and ordinary individuals to finalise transactions by transferring the aforementioned instruments. Consequently, this scenario fostered a market where the diversity and alternatives for payment methods made it extremely challenging to trace the actual flow of money without cash accounts.
The article has taken an important step towards understanding the methods of resource pooling used by Genoese merchants in Andalusia. It is crucial to highlight that many practices, which are nowadays considered fraudulent, predatory, unscrupulous, or exploitative by merchants or banks, were not viewed this way in the past. The lack of regulation and a limited understanding of statistics and economics allowed these practices to persist without ill intent. Therefore, researchers need to consider that sophistication and innovation arose from the financial market functions and mundane instruments. The case of book debts functioning as a mechanism for pooling resources is proof of this, and it could only be identified through quantitative research and functional approaches to economic studies (Crane Reference Crane1995).
It has been shown that, despite the possibility of tracing goods, securities, or money exchanges, notarial deeds without association contracts are insufficient for determining partnerships, accounts, and equity balances. However, reputation has been identified as a potentially quantifiable and verifiable variable for discerning the attraction of new business by merchants. This can be measured by the number of financial and trade operations, which, statistically, is also consistent with the most valuable operations. Furthermore, this approach would allow the use of methodologies such as Social Network Analysis to (1) verify hypotheses regarding the structure and functioning of financial networks, and (2) overcome the lack of different sources, such as ledgers, association contracts and letters.
Therefore, the importance of international database construction and academic cooperation is evident. New methodologies and technologies rely on the power of big data and statistics. In terms of notarial archives, Europe possesses an immense source of information, which can be scaled if integrated in the same way it was in the past. The integration of these archives would allow for a more comprehensive view of this aspect of the market. One could argue that it could also partially (sometimes even completely) reconstruct accounts, enabling a more accurate approach to studying the late medieval and early modern financial markets.


 Open access