

Obesity has been reported to be markedly increased in the global population(Reference Kant1,Reference Albrechtsen, Kuhre and Deacon2) . Consumption of an imbalanced diet, especially high-fat and/or high-sucrose content, is a major cause of obesity development that is further linked to various metabolic syndrome disorders, such as insulin resistance, hypertension and hyperlipidaemia(Reference Kao, Chang and Lee3–Reference Makaronidis and Batterham8). Moreover, obesity has been reported to alter gut hormone secretion(Reference Makaronidis and Batterham8–Reference Ranganath, Beety and Morgan10). The incretin hormone, glucagon-like peptide-1 (GLP-1), is produced and secreted by enteroendocrine L-cells. GLP-1 secretion is stimulated by luminal nutrients such as glucose, fructose, some of fatty acids, peptides and amino acids immediately after food ingestion(Reference Kuhre, Gribble and Hartmann11–Reference Wang, Liu and Chen13). It regulates the postprandial glycaemic response by increasing the insulin secretion and also performs various intrapancreatic and extrapancreatic physiological functions(Reference Fava, Dong and Wu14–Reference Abu-Hamdah, Rabiee and Meneilly16).
It is still unclear whether postprandial GLP-1 secretory response is enhanced, unchanged or decreased in obese, pre-diabetic and diabetic patients, as well as in animal models(Reference Hira, Pinyo and Hara17). A previous study showed that GLP-1 secretion has been reported to be enhanced in response to oral glucose in type 2 diabetic patients(Reference Alssema, Rijkelijkhuizen and Holst18). Contrarily, other studies have demonstrated that GLP-1 secretion has been found to be impaired in obese and type 2 diabetic patients(Reference Ranganath, Beety and Morgan10,Reference Toft-Nielsen, Damholt and Madsbad19) . Furthermore, GLP-1 secretion has been found to be unaltered in response to oral glucose in type 2 diabetic patients(Reference Calanna, Christensen and Holst20).
The impact of obesogenic diet in animal models has been widely investigated; however, changes in postprandial GLP-1 response during obesity development in both non-diabetic and diabetic rat models remain controversial. We previously demonstrated that the postprandial GLP-1 responses were increased in rats during obesity development(Reference Nakajima, Hira and Hara21–Reference Pinyo, Hira and Hara23). However, it is still unclear whether the increased GLP-1 responses in the diet-induced obese models were sustained, enhanced or disappeared after prolonged treatment with an obesogenic diet. Moreover, the meal-induced GLP-1 responses in genetically diabetic models under treatment with the obesogenic diet are unknown. In the present study, we examined whether the adaptive enhancement of postprandial GLP-1 responses sustains or disappears in the diet-induced obese model rats after a long experimental period (26 weeks). To explore potential mechanisms involved in the adaptive changes in postprandial GLP-1 responses in diet-induced obesity and glucose intolerance status, we also examined the GLP-1 responses in diabetic model rats treated with an obesogenic diet. In the present study, a meal tolerance test (MTT) was conducted to monitor changes in postprandial glucose, insulin and GLP-1 responses using oral administration of a liquid diet, rather than the oral glucose tolerance test, since MTT is a more appropriate methodology for investigating postprandial metabolic responses, compared with oral glucose tolerance test(Reference Staten and Kelley24).
Materials and methods
Animals
Male Wistar rats (as non-diabetic control) and male non-obese diabetic Goto-Kakizaki (GK) rats (5 weeks old) were obtained from Japan SLC Inc. Prior to the experiment, the rats were fed a control diet (American Institute of Nutrition-93G based diet) to provide a week-long acclimation period. The rats were housed individually in environmentally controlled rooms (22 ± 2°C, 50 ± 5 % humidity) under a 12 h light–12 h dark cycle (light from 08.00 to 20.00 hours). The rats were provided ad libitum access to food and water except the day before experiment.
After an acclimation period, both Wistar and GK rats were subdivided into control and high-fat/high-sucrose (HFS, 30 % fat and 40 % sucrose)(Reference Nakajima, Hira and Hara21,Reference Hira, Suto and Kishimoto22,Reference Pinyo, Hira and Hara25) groups with each group consisting of 8–9 rats that were selected based on the body weight (BW), glucose and GLP-1 levels after an overnight fast. The HFS diet consistently(Reference Nakajima, Hira and Hara21–Reference Pinyo, Hira and Hara23) and rapidly enhanced postprandial GLP-1 response rather than an individual high-fat or high-sucrose diet alone(Reference Pinyo, Hira and Hara25). The rats were assigned to different groups as follows: Wistar rats fed a control diet (WC group), Wistar rats fed an HFS diet (WH group), GK rats fed a control diet (GC group) and GK rats fed an HFS diet (GH group). All diets were formulated according to the American Institute of Nutrition-93G formulation and are shown in Table 1. BW and food intake were simply measured by using a conventional digital balance every 2 d (mostly before noon). All procedures related to animal experiments in our study were approved by the Hokkaido University Animal Committee, and the rats were maintained according to the guidelines for the care and use of laboratory animals.
Experimental diet compositions (g/kg of diet)
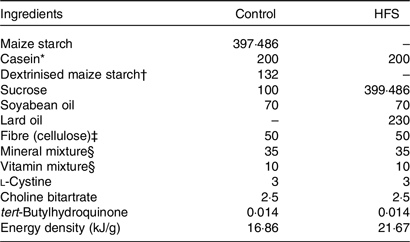
HFS, high-fat/high-sucrose.
* Acid casein (Fonterra Ltd).
† TK-16 (Matsutani Chemical Industry Co. Ltd).
‡ Just Fiber BH200FCC (Morimura Bros. Inc.).
§ Mineral and vitamin mixtures were prepared according to the American Institute of Nutrition-93G formulation.
Meal tolerance test
Postprandial glycaemia, insulin, GLP-1 and gastric emptying in response to ‘diet’ administration were determined using MTT after 4, 8, 16 and 24 weeks of feeding period. After a 16-h fasting period with free access to water, basal blood (0 min) was collected from the tail vein. The rats were then orally administered with a liquid diet (62·76 kJ/10 ml per kg BW; Ensure H, Abbott) that contained acetaminophen (100 mg/kg BW; Sigma-Aldrich) to determine the gastric emptying rate. The blood samples were collected at 15, 30, 60, 90 and 120 min after the diet administration and were immediately mixed with heparin (final concentration 50 IU/ml; Ajinomoto Company Inc.) and aprotinin (final concentration 500 Kallikrein inhibitor units (kIU)/ml; Wako Pure Chemical Industries Ltd) in chilled tubes to prevent coagulation.
Blood plasma was separated at 2300 g for 10 min at 4°C. Next, the plasma samples were immediately collected and stored at −80 °C. Glucose levels were measured using the Glucose CII Test Kit (Wako Pure Chemical Industries). Acetaminophen (paracetamol) absorption test was used to determine the gastric emptying rate(Reference Maida, Lovshin and Baggio26–Reference Medhus, Lofthus and Bredesen28). Acetaminophen level was assessed using the acetaminophen detection kit (Kanto Chemical Co. Inc.). Insulin and GLP-1 concentrations were determined using Rat Insulin ELISA kit (U-E type, AKRIN-130; Shibayagi Company Limited) and total GLP-1 ELISA kit (High sensitive; Wako), respectively. The homeostatic model assessment of insulin resistance (HOMA-IR) was used to predict the insulin resistance using glucose and insulin values at basal levels(Reference Cacho, Sevillano and de Castro29): $\scale94.5%{\[{\rm{HOMA\hbox-IR = }}\,{{{\rm{insulin}}\,\left( {{\rm{\mu U/ml}}} \right)\,\rm{ \times\, glucose\, }}\left( {{\rm{mmol/l}}} \right)} /({\rm 0{\cdot} 0555\, \times \, 2430}),}$
where 1 mg insulin = 26 IU; 1 mg/dl glucose = 0·0555 mM.
Blood and tissue collection
After 26 weeks of test diet feeding, blood samples from the portal vein and abdominal aorta were collected under sodium pentobarbital anaesthesia (50 mg/kg of BW) using a syringe that contained heparin (final concentration 50 IU/ml), aprotinin (final concentration 500 kIU/ml) and dipeptidyl-peptidase IV (DPP-IV) inhibitor (final concentration 50 µmol/l; DPP4-010; Merck Millipore).
Plasma samples were collected and stored as described above for the assessment of glucose, insulin, total GLP-1, TAG and total cholesterol levels. Blood samples were simultaneously collected from the portal vein and abdominal aorta using the syringe filled with heparin (final concentration 50 IU/ml) only for the measurement of DPP-IV activity. Total GLP-1 and insulin levels were measured using the Multi Species GLP-1 Total ELISA (EZGLP1T-36K; Merck Millipore) and Rat Insulin ELISA kits (AKRIN-010T; Shibayagi Company Limited), respectively. Plasma TAG and cholesterol levels were determined using the Triglyceride E Test kit (Wako Pure Chemical Industries) and Cholesterol E Test kit (Wako Pure Chemical Industries), respectively. Plasma DPP-IV activity was measured based on the rate of surrogate substrate (Gly-Pro-p-nitroaniline) hydrolysis(Reference Karl, Chwalisz and Wedekind30–Reference Ishikawa, Hira and Inoue32).
The rats were killed by exsanguination, following which the intestinal segments were immediately dissected and washed with cold saline (0·9 % NaCl). Next, the mucosa (5 cm segment) and the duodenum, jejunum, ileum and colon (2 cm segments each) were collected from the middle region of each segment to measure the mRNA expression level and GLP-1 content. The caecal tissues were washed with a cold saline and divided equally into two parts: the first part was collected for GLP-1 measurement, and the mucosa from the second part was scraped for mRNA analysis. All intestinal segments were rapidly frozen in liquid N2 and stored at −80°C until GLP-1 content measurement. Intestinal mucosa samples were collected and transferred to the tubes containing lysis buffer (RLT buffer in RNeasy Mini Kit; Qiagen). The collected samples were immediately frozen in liquid N2 and stored at −80°C until RNA extraction. Pancreatic tissues were also collected to measure insulin content. The weights of mesenteric, retroperitoneal and epididymal adipose tissue were measured and represented as visceral adipose tissue weight.
Glucagon-like peptide-1 content in intestinal tissue
The intestinal tissues were immersed in an acid alcohol solution (74 % absolute ethanol, 25 % water and 1 % HCl 12 N) using 5 ml/g tissue weight(Reference Cani, Hoste and Guiot33). Next, intestinal tissues were sectioned into small segments and subsequently homogenised at 24 000 rpm (Ultra Turrax homogenizer T18, IKA) for 2 min. The homogenised samples were extracted at 4°C for 24 h. After extraction, 150 µl of each homogenised sample was stored at −30°C for measuring the protein concentration. Subsequently, the remaining homogenate was centrifuged at 2000 g for 20 min. The supernatant was collected and stored at −80°C for further analysis. The protein concentration and GLP-1 content were measured using Lowry’s protein assay and Multi Species GLP-1 Total ELISA kit (EZGLP1T-36 K; Merck Millipore), respectively. The homogenate samples were diluted forty times for measurement of protein concentration, whereas the supernatant was diluted 500 times for the measurement of GLP-1 content.
Pancreatic insulin content measurement
Pancreatic tissue was minced in ethanol acid solution (10 ml/g tissue; 75% absolute ethanol, 23·5 % water and 1·5% HCl 12 N)(Reference Kuhre, Gribble and Hartmann11,Reference Granata, Volante and Settanni34) and then homogenised at 24 000 rpm (Ultra Turrax homogenizer T18, IKA) for 2 min. The pancreatic homogenate samples were stored at 4°C for 24 h to extract insulin. Aliquots of the homogenate samples (150 µl) were stored for the measurement of protein concentration. The remaining homogenate samples were centrifuged (5000 g , 10 min, 4°C). The supernatants were collected and stored at −80°C for the estimation of insulin concentration. The homogenate samples were diluted fifty times for protein quantification using Lowry’s protein assay. The supernatant was diluted 6000 times for assessment of insulin content using the Rat Insulin ELISA kit (AKRIN-010T; Shibayagi Company Limited).
Real-time quantitative PCR
Mucosa of each intestinal segment was scraped and stored in RLT buffer solution (RLT buffer:2-mercaptoethanol at a ratio of 100:1) at −80°C for RNA extraction. Total RNA was extracted using the RNeasy Mini kit (Qiagen), and subsequently, complementary DNA was synthesised using the ReverTra Ace qPCR Master Mix with gDNA Remover (Toyobo Company Limited) according to the manufacturer’s instructions. Gene expression levels were analysed by TaqMan gene expression assays (Life Technologies Company) using the rat gene-specific, predesigned TaqMan primers, and probe sets (Rn99999916_s1 for glyceraldehyde 3-phosphate dehydrogenase, Rn00562293_m1 for proglucagon (gcg), Rn00824686_s1 for free fatty acid receptor 1 (ffar1 or gpr40), Rn02345824_s1 for free fatty acid receptor 2 (ffar2 or gpr43), Rn01457614_g1 for free fatty acid receptor 3 (ffar3 or gpr41) and Rn01759772_m1 for free fatty acid receptor 4 (ffar4 or gpr120)). The relative expression level of each individual gene was compared with the reference gene, glyceraldehyde 3-phosphate dehydrogenase, using the standard curve method.
Statistical analysis
In the present study, the total sample size was calculated based on the experimental design (ANOVA: repeated measures) for MTT to assess postprandial GLP-1 responses in both non-diabetic and diabetic rats fed either the control or HFS diet as the primary outcome measure using G*Power software (version 3.1.9.2). The parameters used for the analysis were as follows: power = 0·8, significance level = 0·05 and effect size (medium) = 0·25. The total number of rats was calculated as 28 (7 rats/group). The data are expressed as the mean values with their standard errors. Significant effects of diet, strain and strain-by-diet interactions were assessed using two-way ANOVA. Statistically significant difference was determined using one-way ANOVA followed by an appropriate post hoc test (Tukey–Kramer’s or Student’s t test). The data were statistically analysed using JMP pro version 12.2.0 software (SAS Institute Inc.). All P values were considered to be significant at P < 0·05.
Results
Body weight, energy intake and tissue weights
The final BW, BW gain and total energy intake of rats fed the HFS diet were significantly higher than those of rats fed the control diet both in Wistar and GK rats (Table 2). HFS feeding groups (WH and GH) showed significantly higher liver weight and visceral fat accumulation (sum of mesenteric, epididymal and retroperitoneal fat) as compared with the control diet feeding groups (WC and GC) as shown in Table 2.
Body weight (BW), food and energy intake and tissue weights after a 26-week feeding period (n 7–9 rats)
(Mean values with their standard errors)
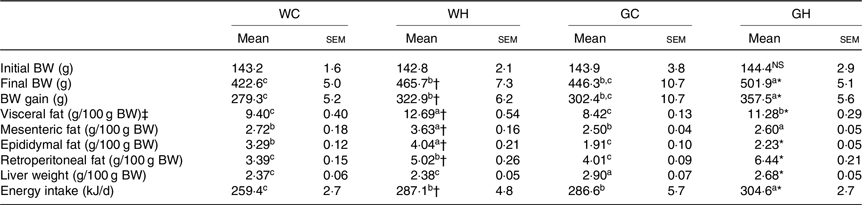
WC, Wistar rats fed a control diet; WH, Wistar rats fed a high fat/high sucrose diet; GC, Goto-Kakizaki rats fed a control diet; GH, Goto-Kakizaki rats fed a high fat/high sucrose diet.
a,b,c Mean values in a row with unlike superscript letters are significantly different (P < 0·05, Tukey–Kramer’s test).
* Significant differences between mean values of the GC and GH groups (P < 0·05, Student’s t test). NS indicates that there was no significant difference between the treatments.
† Significant differences between mean values of the WC and WH groups.
‡ Visceral fat weight is the sum of the mesenteric, epididymal and retroperitoneal fat weight.
Fasting glucose, insulin, glucagon-like peptide-1 levels and homeostatic model assessment of insulin resistance
Fasting glucose levels in GK rats (GC and GH) were higher than those of the Wistar rats (WC and WH) throughout the monitoring period (Table 3). After 16 weeks of feeding, the WH and GH groups had higher fasting glucose levels compared with the respective control diet feeding groups (as indicated with † and * signs in Table 3). Fasting GLP-1 and insulin levels were higher or slightly higher in the WH group compared with the WC group; however, such trends were not observed between the GC and GH groups. Both the HFS diet groups had higher HOMA-IR at fasting state compared with the control diet group after 16 weeks of feeding (Table 3).
Fasting glucose, insulin, glucagon-like peptide-1 (GLP-1) levels and homeostatic model assessment of insulin resistance (HOMA-IR) (n 6–9 rats)
(Mean values with their standard errors)
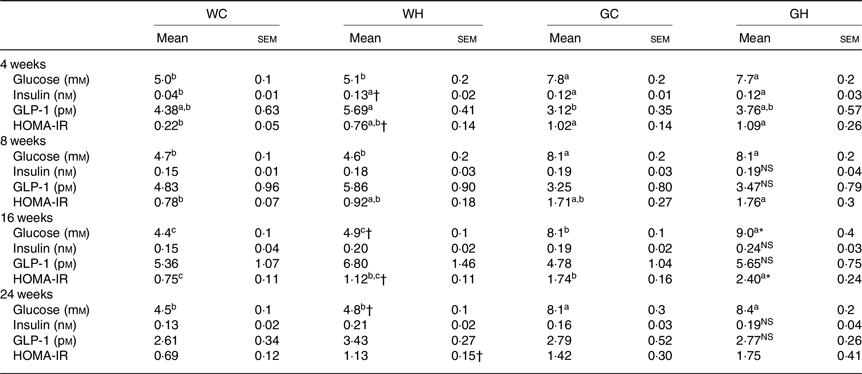
WC, Wistar rats fed a control diet; WH, Wistar rats fed a high fat/high sucrose diet; GC, Goto-Kakizaki rats fed a control diet; GH, Goto-Kakizaki rats fed a high fat/high sucrose diet.
a,b,c Mean values in a row with unlike superscript letters are significantly different (P < 0·05, Tukey–Kramer’s test).
* Significant differences between mean values of the GC and GH groups (P < 0·05, Student’s t test). NS indicates that there was no significant difference between the treatments.
† Significant differences between mean values of the WC and WH groups.
Postprandial glycaemic response
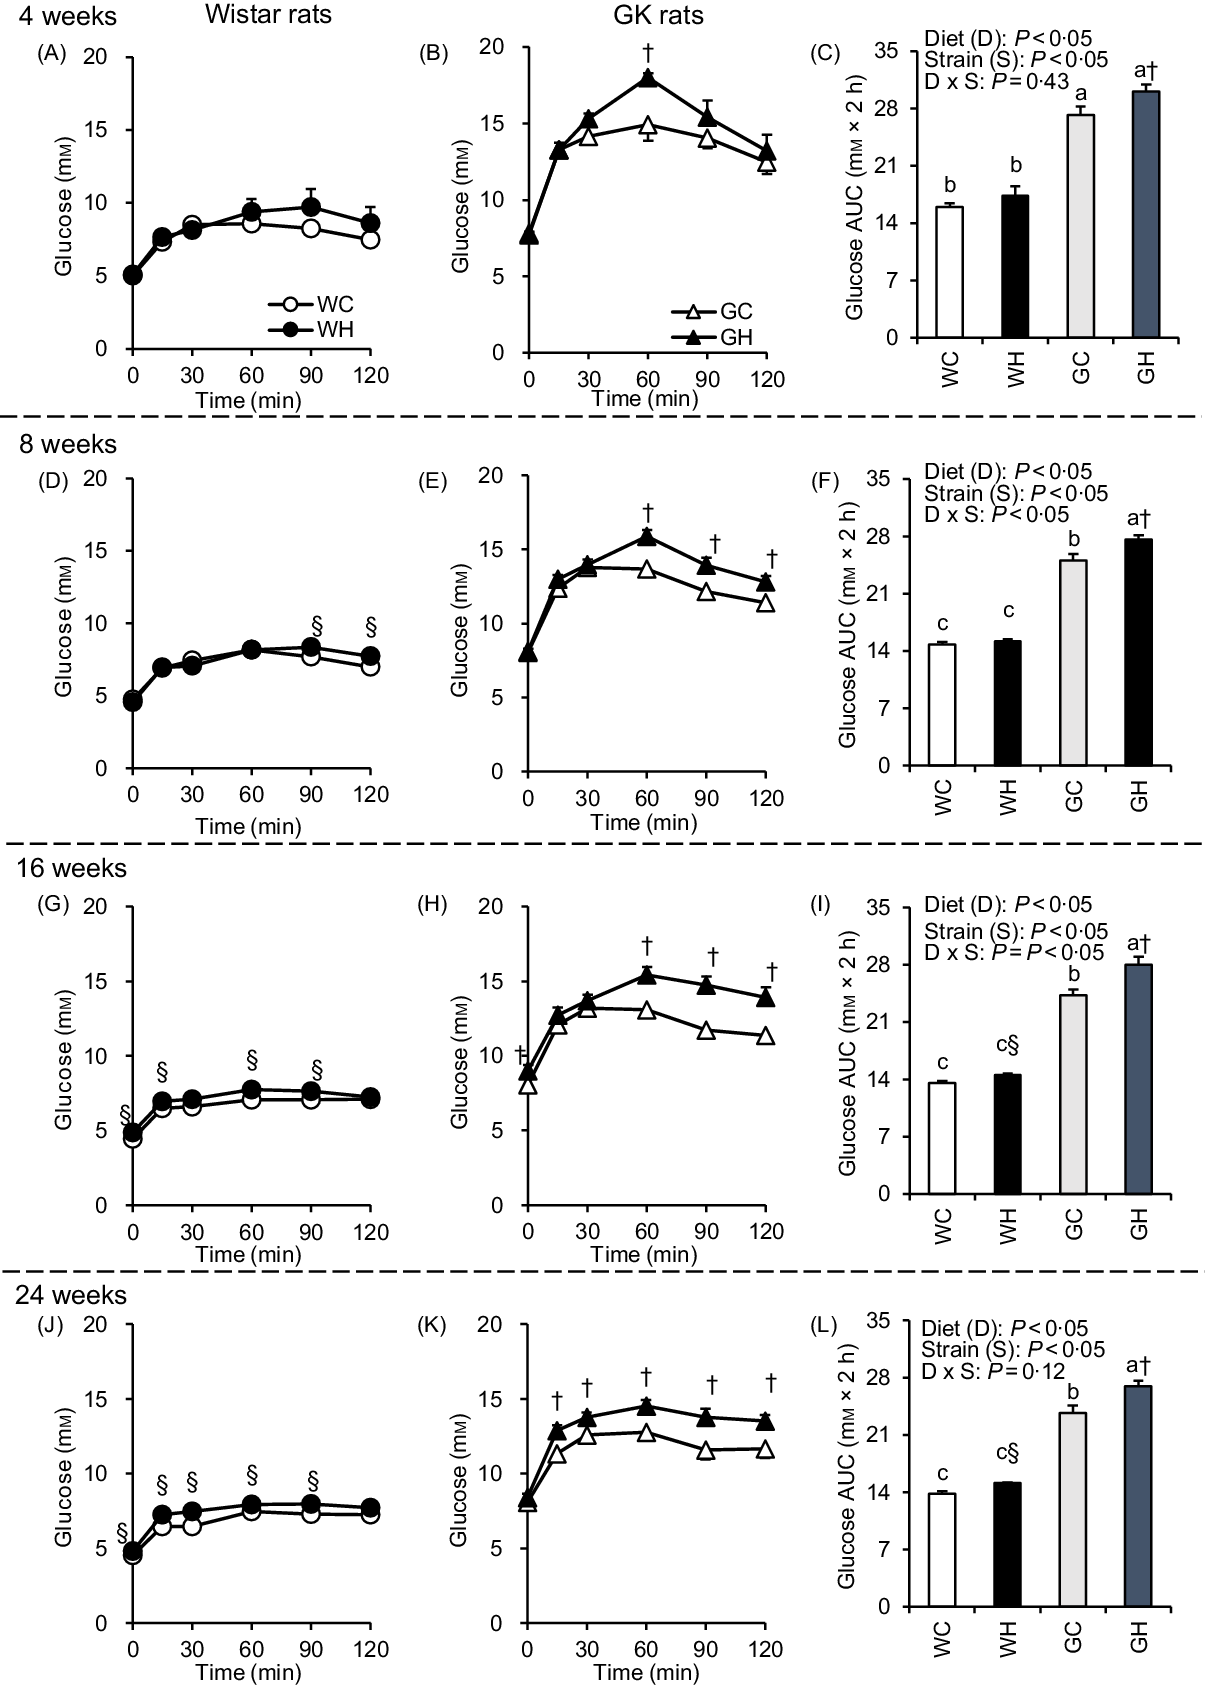
After an overnight fast, the liquid diet (62·76 kJ/10 ml per kg BW) was administered orally to rats to determine responses to a meal. The WH group had higher glycaemic responses than the WC group at multiple time points after 16- and 24-week feeding periods as shown in Fig. 1(G) and (J), and significant differences were observed in the AUC (Fig. 1(I) and (L)). In GK rats, glucose levels and the AUC in the GH group were significantly higher compared with those in the GC group throughout the experimental period (Fig. 1(C), (F), (I) and (L)). Significant effects of diet and of strain on glycaemia AUC were detected by two-way ANOVA in all MTT.
Postprandial glycaemic responses under meal tolerance test (MTT) after 4-, 8-, 16- and 24-week feeding period. Wistar rats and diabetic Goto-Kakizaki (GK) rats were fed either a control diet or high-fat/high-sucrose (HFS) diet for 4, 8, 16 and 24 weeks before conducting MTT. After an overnight fast, blood samples were collected from the tail vein before (0 min) and after oral administration of a liquid diet (Ensure H, 10 ml/kg body weight). ![]() , Wistar rats fed the control diet (WC);
, Wistar rats fed the control diet (WC); ![]() , Wistar rats fed the HFS diet (WH);
, Wistar rats fed the HFS diet (WH); ![]() , GK rats fed the control diet (GC);
, GK rats fed the control diet (GC); ![]() , GK rats fed the HFS diet (GH). Data are mean values with their standard errors (n 6–9 rats in each group). a,b,c Mean values with unlike letters are significantly different (P < 0·05, Tukey–Kramer’s test). § Significant differences between mean values of the WC and WH groups; † significant differences between mean values of the GC and GH groups (P < 0·05, Student’s t test). P values of two-way ANOVA for diet, strain and strain-by-diet interactions are shown in the panels.
, GK rats fed the HFS diet (GH). Data are mean values with their standard errors (n 6–9 rats in each group). a,b,c Mean values with unlike letters are significantly different (P < 0·05, Tukey–Kramer’s test). § Significant differences between mean values of the WC and WH groups; † significant differences between mean values of the GC and GH groups (P < 0·05, Student’s t test). P values of two-way ANOVA for diet, strain and strain-by-diet interactions are shown in the panels.
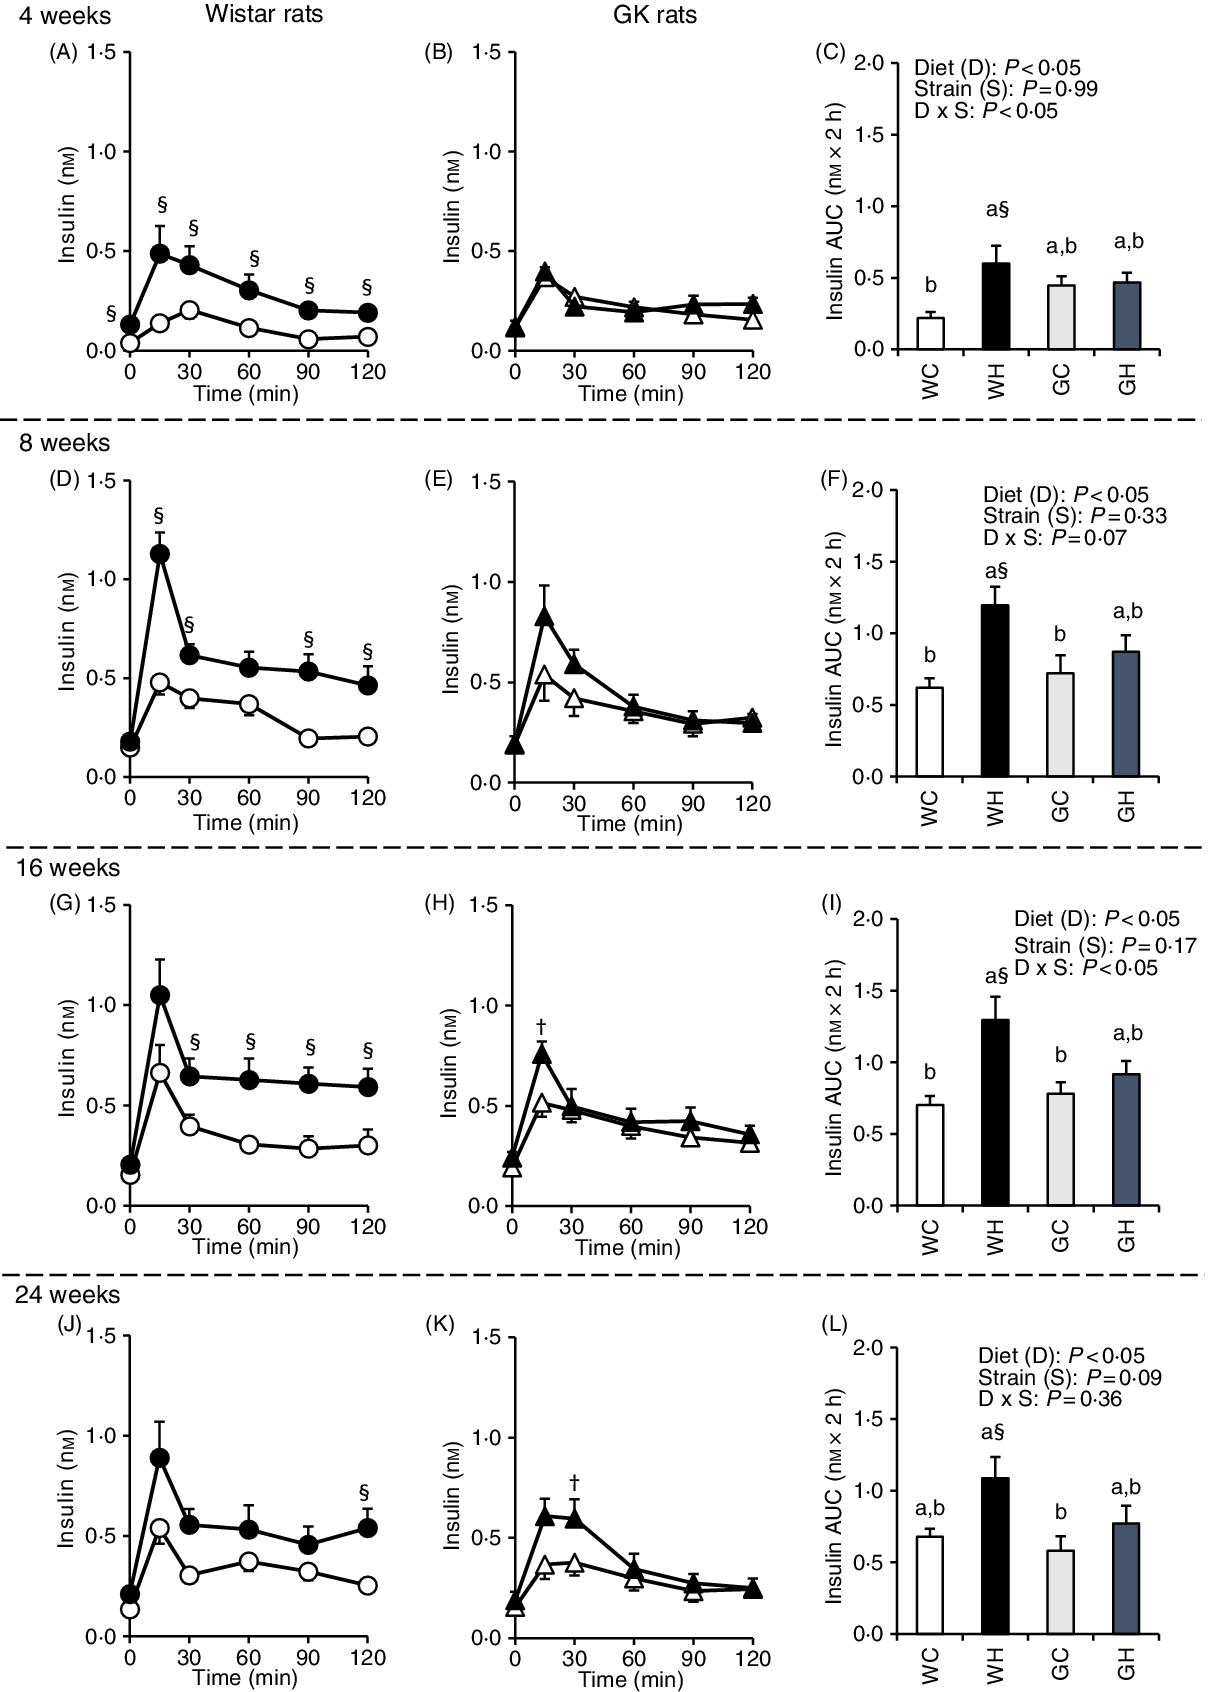
Postprandial insulin response
Insulin secretion was immediately increased (peaked at 15 or 30 min) after the administration of liquid diet in all groups. In the WH group, insulin concentrations at multiple time points (Fig. 2(A), (D), (G) and (J)) and the AUC were higher compared with those in the WC group throughout experimental period (Fig. 2(C), (F), (I) and (L)). In contrast, the GH group had higher insulin concentrations only at 15 min after 16 weeks and 30 min after 24 weeks, compared with those of the GC group (Fig. 2(H) and (K)). However, no significant differences were observed in the AUC between the GC and GK groups throughout the experimental period (Fig. 2(C), (F), (I) and (L)).
Postprandial insulin responses under meal tolerance test (MTT) after 4-, 8-, 16- and 24-week feeding period. Wistar and diabetic Goto-Kakizaki (GK) rats were fed either a control diet or high-fat/high-sucrose (HFS) diet for 4, 8, 16 and 24 weeks before conducting MTT. After an overnight fast, blood samples were collected from the tail vein before (0 min) and after oral administration of a liquid diet (Ensure H, 10 ml/kg body weight). ![]() , Wistar rats fed the control diet (WC);
, Wistar rats fed the control diet (WC); ![]() , Wistar rats fed the HFS diet (WH);
, Wistar rats fed the HFS diet (WH); ![]() , GK rats fed the control diet (GC);
, GK rats fed the control diet (GC); ![]() , GK rats fed the HFS diet (GH). Data are mean values with their standard errors (n 6–9 rats in each group). a,b Mean values with unlike letters are significantly different (P < 0·05, Tukey–Kramer’s test). § Significant differences between mean values of the WC and WH groups; † significant differences between mean values of the GC and GH groups (P < 0·05, Student’s t test). P values of two-way ANOVA for diet, strain and strain-by-diet interactions are shown in the panels.
, GK rats fed the HFS diet (GH). Data are mean values with their standard errors (n 6–9 rats in each group). a,b Mean values with unlike letters are significantly different (P < 0·05, Tukey–Kramer’s test). § Significant differences between mean values of the WC and WH groups; † significant differences between mean values of the GC and GH groups (P < 0·05, Student’s t test). P values of two-way ANOVA for diet, strain and strain-by-diet interactions are shown in the panels.
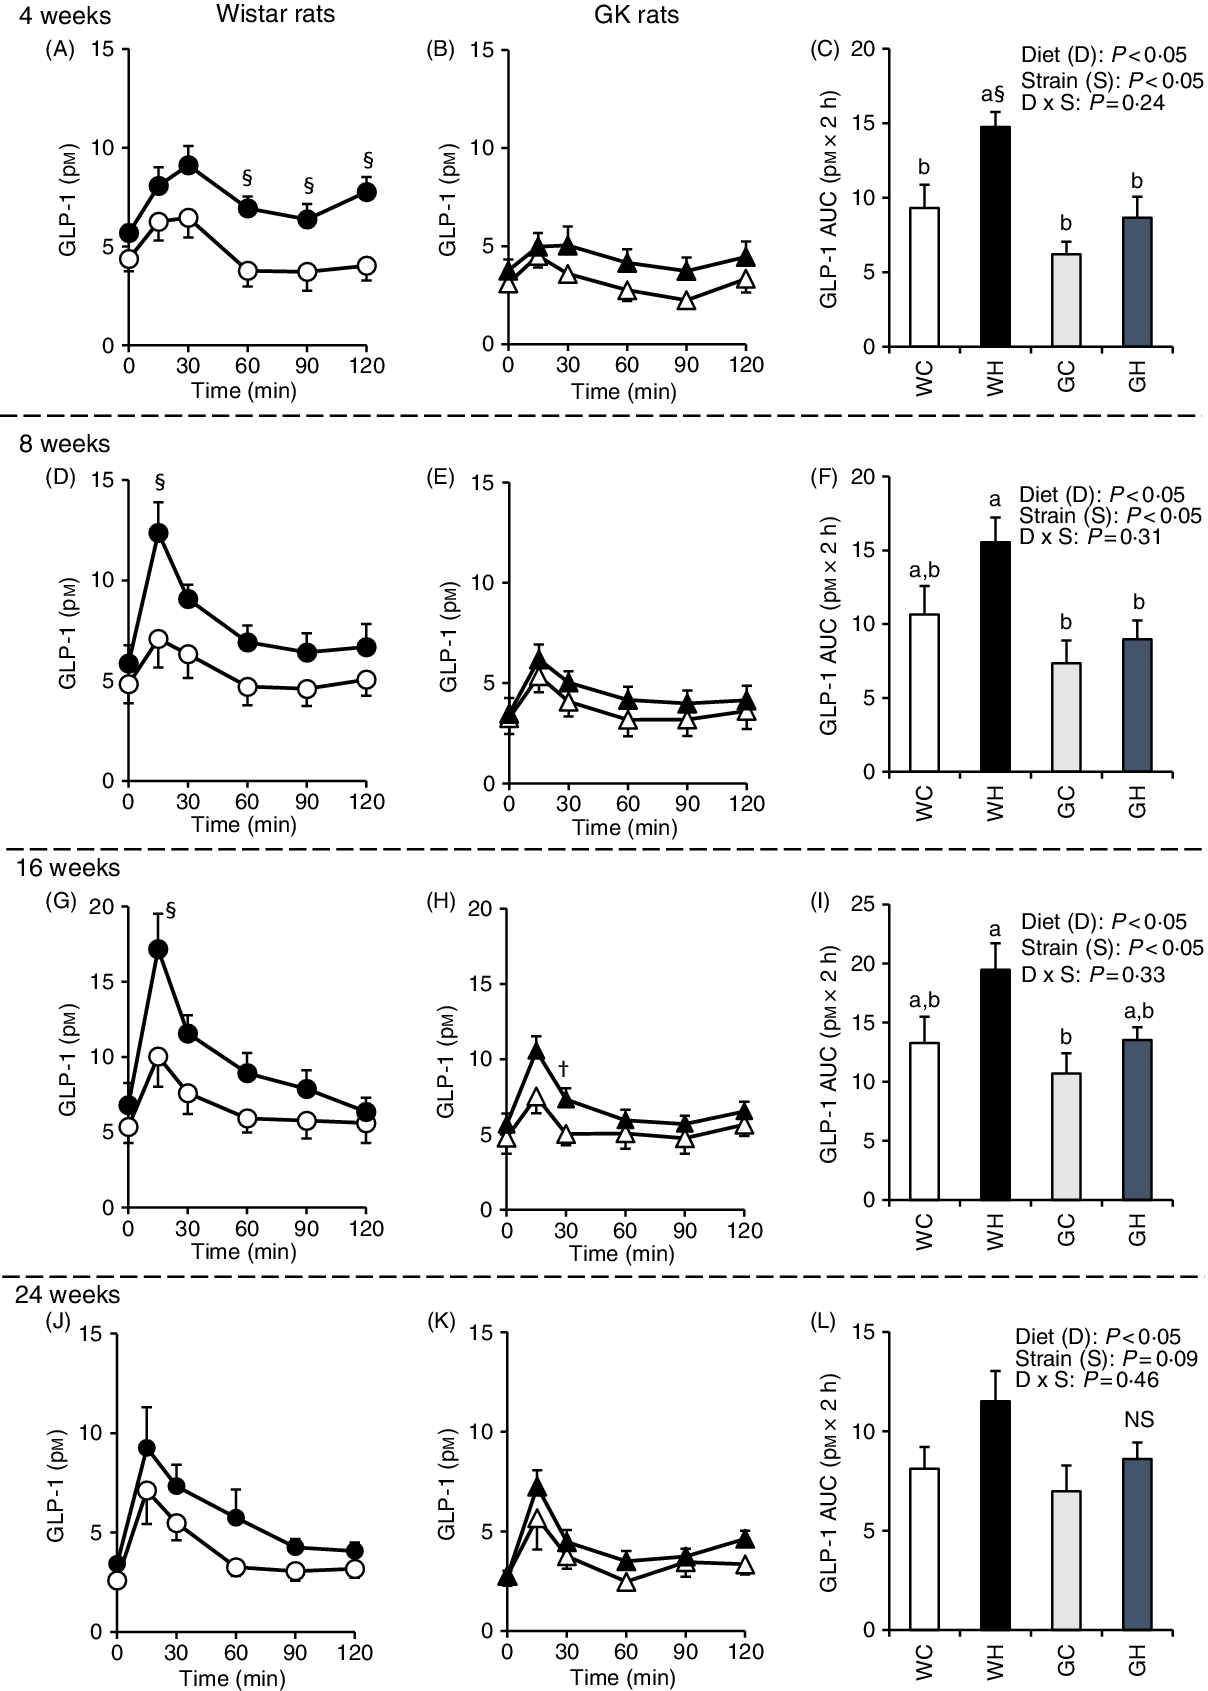
Postprandial glucagon-like peptide-1 response
GLP-1 responses were higher in the WH group compared with those of the WC group (at 60–120 min and the AUC after 4 weeks, as well as at 15 min after 8 and 16 weeks) as shown in Fig. 3(A), (D) and (G), whereas GLP-1 responses and the AUC were observed to be similar in the GH and GC groups throughout the experimental period (Fig. 3(C), (F), (I) and (L)). Likewise, two-way ANOVA showed significant effects of diet and/or of strain on postprandial GLP-1 AUC in all MTT.
Postprandial glucagon-like peptide-1 (GLP-1) responses under meal tolerance test (MTT) after 4-, 8-, 16- and 24-week feeding period. Wistar rats and diabetic Goto-Kakizaki (GK) rats were fed either a control diet or high-fat/high-sucrose (HFS) diet for 4, 8, 16 and 24 weeks before conducting MTT. After an overnight fasting, blood samples were collected from the tail vein before (0 min) and after oral administration of a liquid diet (Ensure H, 10 ml/kg body weight). ![]() , Wistar rats fed the control diet (WC);
, Wistar rats fed the control diet (WC); ![]() , Wistar rats fed the HFS diet (WH);
, Wistar rats fed the HFS diet (WH); ![]() , GK rats fed the control diet (GC);
, GK rats fed the control diet (GC); ![]() , GK rats fed the HFS diet (GH). Data are mean values with their standard errors (n 6–9 rats in each group). a,b Mean values with unlike letters are significantly different (P < 0·05, Tukey–Kramer’s test). § Significant differences between mean values of the WC and WH groups; † significant difference between mean values of the GC and GH groups (P < 0·05, Student’s t test). P values of two-way ANOVA for diet, strain and strain-by-diet interactions are shown in the panels. NS indicates that there was no significant difference between the treatments.
, GK rats fed the HFS diet (GH). Data are mean values with their standard errors (n 6–9 rats in each group). a,b Mean values with unlike letters are significantly different (P < 0·05, Tukey–Kramer’s test). § Significant differences between mean values of the WC and WH groups; † significant difference between mean values of the GC and GH groups (P < 0·05, Student’s t test). P values of two-way ANOVA for diet, strain and strain-by-diet interactions are shown in the panels. NS indicates that there was no significant difference between the treatments.
Plasma parameters after 26-week feeding period
After a feeding period of 26 weeks, fasting glucose levels in HFS diet feeding groups (WH and GH) were higher than those of the respective control diet feeding groups (WC and GC) both in portal vein and abdominal aorta blood samples (Table 4). Regardless of the diet consumed, the GK rats showed higher fasting glucose levels compared with the Wistar rats. The WH group showed significantly higher and slightly but not significantly higher levels of fasting insulin and GLP-1, respectively, in comparison with the WC group, whereas the GH group showed similar levels to those of the GC group (Table 4). These results were consistent with postprandial glucose, insulin and GLP responses after the 24-week feeding period (Figs. 1–3). Fasting TAG and cholesterol levels in the abdominal aorta had similar trends with fasting glucose concentrations (Table 4). DPP-IV activity in GK rats was significantly higher in the portal vein compared with that of Wistar rats. Diet did not affect DPP-IV activity both in Wistar and GK rats (Table 4).
Plasma parameters after 26-week feeding period‡ (n 7–9 rats)
(Mean values with their standard errors)
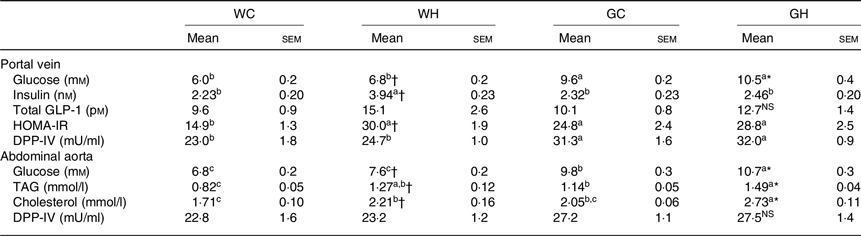
WC, Wistar rats fed a control diet; WH, Wistar rats fed a high fat/high sucrose diet; GC, Goto-Kakizaki rats fed a control diet; GH, Goto-Kakizaki rats fed a high fat/high sucrose diet; GLP-1, glucagon-like peptide-1; HOMA-IR, homeostatic model assessment of insulin resistance; DPP-IV, dipeptidyl-peptidase IV.
a,b,c Mean values in a row with unlike superscript letters are significantly different (P < 0·05, Tukey–Kramer’s test).
* Significant differences between mean values of the GC and GH groups (P < 0·05, Student’s t test). NS indicates that there was no significant difference between the treatments.
† Significant differences between mean values of the WC and WH groups.
‡ Wistar and diabetic Goto-Kakizaki rats were fed either the control diet or the high fat/high sucrose diet for 26 weeks. Blood samples from the portal vein and abdominal aorta were collected under sodium pentobarbital anaesthesia (50 mg/kg body weight) after an overnight fast.
Glucagon-like peptide-1 content in the intestinal tissues and insulin content in the pancreatic tissue
The WH group had higher GLP-1 concentrations than those of the WC group in the jejunal and ileal segments, whereas no difference was observed in the intestinal GLP-1 concentrations between the GC and GH groups (Fig. 4(B) and (C)). Significant effects of diet, strain and strain-by-diet interaction on GLP-1 content were detected by two-way ANOVA in the ileum. In the pancreas, the WH group had higher insulin content compared with that of the WC group, whereas the GC and GH groups showed similar insulin content (Fig. 4(F)). Significant effects of diet and of strain on pancreatic insulin content were detected by two-way ANOVA.
Glucagon-like peptide-1 (GLP-1) content in the intestinal tissues and insulin content in the pancreas after a 26-week feeding period of either a control or high-fat/high sucrose (HFS) diet. Rats were provided with either the control diet or HFS diet for 26 weeks. Each intestinal segment: (A) duodenum, (B) jejunum, (C) ileum, (D) caecum and (E) colon and rat pancreas (F) were collected after killing. Data are mean values with their standard errors (n 7–9 rats in each group). a,b Mean values with unlike letters are significantly different (P < 0·05, Tukey–Kramer’s test). § Significant differences between mean values of the WC and WH groups (P < 0·05, Student’s t test). P values of two-way ANOVA for diet, strain and strain-by-diet interactions are shown below each panel. NS indicates that there was no significant difference between the treatments. WC, Wistar rats fed a control diet; WH, Wistar rats fed an HFS diet; GC, Goto-Kakizaki rats fed a control diet; GH, Goto-Kakizaki rats fed an HFS diet.

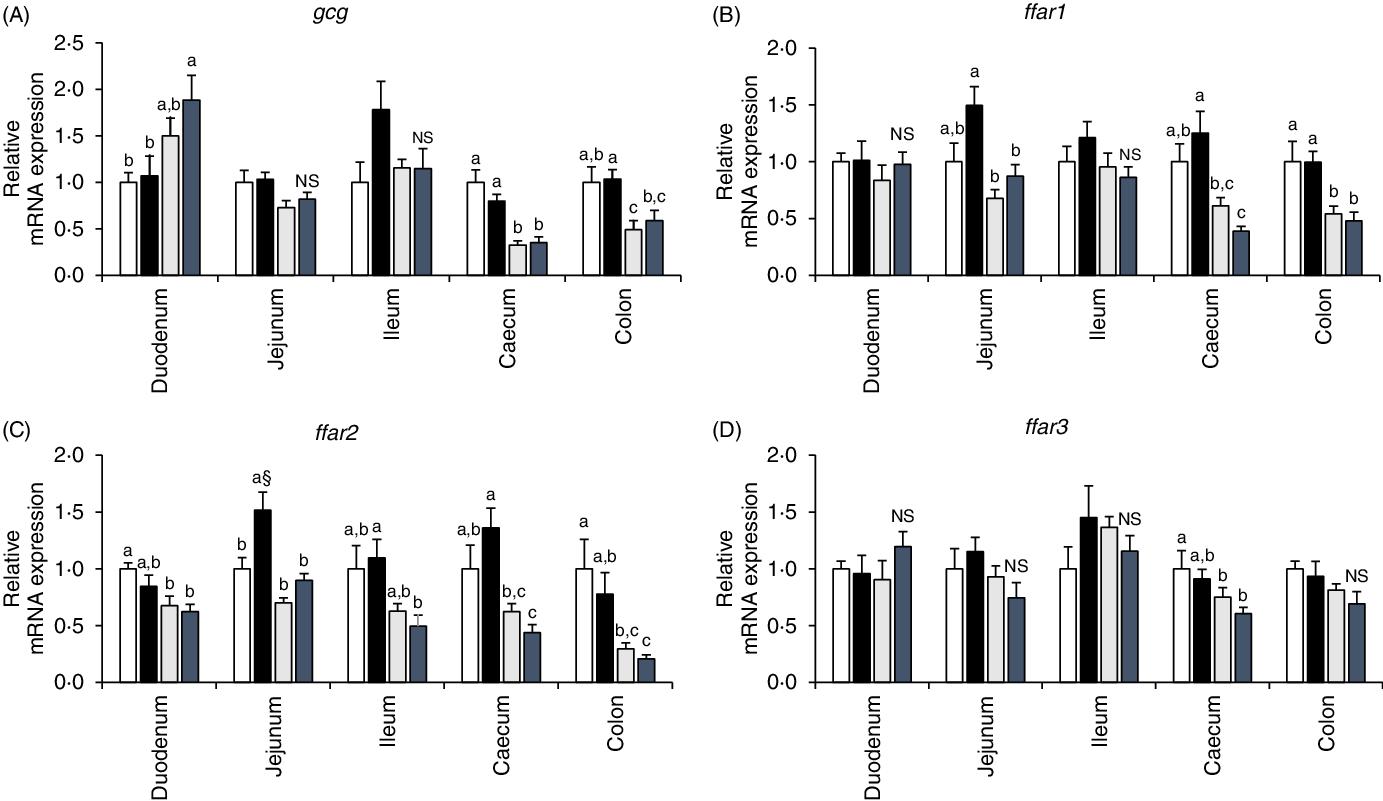
mRNA expression analysis of proglucagon and free fatty acid receptors (ffar1, ffar2, ffar3 and ffar4) in each intestinal segment
In the duodenum segment, gcg mRNA expression level tended to be higher in GK rats than in Wistar rats. In contrast, GK rats had lower gcg mRNA expression levels in the caecum and colon segments. Significant effects of diet were not seen observed in gcg mRNA expression levels of any intestinal regions (Fig. 5(A)). High fat rather than high sucrose had higher impact on enhancing GLP-1 responses during diet-induced obesity(Reference Pinyo, Hira and Hara25), and fatty acid receptors function in enteroendocrine cells as sensors for fatty acids to trigger gut hormone secretions(Reference Ekberg, Hauge and Kristensen35,Reference Hirasawa, Tsumaya and Awaji36) . In the jejunum of the WH group, ffar1 mRNA level tended to be higher (P = 0·0534, Student’s t test) and ffar2 mRNA level was significantly higher than those in the WC group (Fig. 5(B) and (C)). Although diet treatment had no effect, ffar4 mRNA expression was almost undetectable in the quantitative PCR in GK rats; however, it was normally detectable in Wistar rats (data not shown) in all intestinal segments.
mRNA expression levels of proglucagon (gcg) and fatty acid receptors (ffar1, ffar2 and ffar3) in the intestinal mucosa of rats after a 26-week feeding period in either a control or high-fat/high sucrose (HFS) diet group. Rats were provided with either the control diet or HFS diet for 26 weeks. Intestinal mucosa was collected from each intestinal segment after killing the animals. The mRNA expression levels were determined by real-time quantitative PCR (qPCR). Data are presented as the relative expression level to that of the control group normalised to glyceraldehyde 3-phosphate dehydrogenase (gapdh) mRNA expression level. ![]() , Wistar rats fed the control diet (WC);
, Wistar rats fed the control diet (WC); ![]() , Wistar rats fed the HFS diet (WH);
, Wistar rats fed the HFS diet (WH); ![]() , Goto-Kakizaki rats fed the control diet (GC);
, Goto-Kakizaki rats fed the control diet (GC); ![]() , Goto-Kakizaki rats fed the HFS diet (GH). Data are mean values with their standard errors (n 7–9 rats in each group). a,b,c Mean values with unlike letters are significantly different (P < 0·05, Tukey–Kramer’s test). § Significant difference between mean values of the WC and WH groups (P < 0·05, Student’s t test). NS indicates that there was no significant difference between the treatments.
, Goto-Kakizaki rats fed the HFS diet (GH). Data are mean values with their standard errors (n 7–9 rats in each group). a,b,c Mean values with unlike letters are significantly different (P < 0·05, Tukey–Kramer’s test). § Significant difference between mean values of the WC and WH groups (P < 0·05, Student’s t test). NS indicates that there was no significant difference between the treatments.
Discussion
In the present study, we investigated whether the adaptive enhancement of postprandial GLP-1 responses sustains or disappears during long-term diet-induced obesity and in the diabetic GK rats fed an HFS diet. The postprandial insulin and GLP-1 responses were significant or tended to be higher in the WH group than in the WC group throughout the study. In contrast, both the GK groups (GC and GH) had similar postprandial GLP-1 responses in all MTT. Small intestinal GLP-1 production and ffar mRNA expression levels were enhanced by HFS feeding in Wistar rats, but not in GK rats. The difference in the GLP-1 responses between Wistar and GK rats could be involved in the development of glucose intolerance. Taken together, enhancement of ffar1 mRNA expression together with GLP-1 production in the jejunum segment by HFS diet feeding in Wistar rats, but not in GK rats, may exert the glucoregulatory action through stimulation of postprandial GLP-1 secretion in Wistar rats.
After 26 weeks of HFS feeding, both strains had higher BW and lipid accumulation compared with the respective control group, confirming the potent impact of HFS diet even on diabetic model rats. Wistar rats had higher glycaemic response after 16 weeks of HFS diet intake; however, GK rats had higher glycaemic response already after 4 weeks of HFS diet consumption. Even after 24 weeks of HFS diet feeding, WH rats still had lower fasting and postprandial glucose levels than those in GC rats. Consistent with our results, in a previous study, although Wistar rats fed a high-fat diet (10 months) developed glucose intolerance, they did not develop diabetes(Reference Chalkley, Hettiarachchi and Chisholm37).
In the present study, postprandial GLP-1 response increased after treatment with the HFS diet in non-diabetic Wistar rats, which was consistent with the results of previous studies using non-diabetic Sprague–Dawley rats(Reference Nakajima, Hira and Hara21,Reference Pinyo, Hira and Hara23,Reference Pinyo, Hira and Hara25) . In GK rats, both control and HFS diet feeding showed a similar postprandial GLP-1 response. Likewise, the GLP-1 levels were not observed to be different between the control subjects and patients with type 2 diabetes(Reference Laferrère, Heshka and Wang38). Although primary outcome of this study was to assess postprandial GLP-1 responses in obese and/or diabetic status, the secretion of other gut hormones such as glucose-dependent insulinotropic polypeptide (GIP), cholecystokinin (CCK) and peptide YY (PYY) could also be altered in obesity and diabetes(Reference Steinert, Feinle-Bisset and Asarian39–Reference Dirksen, Graff and Fuglsang41). Further investigations may help to understand relationship between enteroendocrine systems and obesity/diabetes.
Acetaminophen appearances in MTT remained unchanged among treatments throughout the experimental period (data not shown), thus indicating that the nutrient delivery to the small intestine (gastric emptying rate) does not explain the differences in GLP-1 responses in the present study. Rather, the increased jejunal and ileal GLP-1 contents in response to HFS feeding in Wistar rats, but not in GK rats, could be responsible for the increased GLP-1 secretion. This is supported by positive correlations (r 0·4619, 0·5550, 0·6342 and 0·4339, P < 0·05, at 4, 8, 16 and 24 weeks, respectively, by Pearson’s correlation coefficient analysis) between ileal GLP-1 content (pmol/mg protein) and postprandial GLP-1 secretion AUC (pm × 2 h). Alternatively, the sensitivity of GLP-1-producing L-cells to luminal nutrients might be enhanced by chronic HFS diet feeding in Wistar rats, but not in GK rats. However, further studies are needed in the future to address the issue of whether the increased intestinal GLP-1 content attributed to ‘increased number of L cells’ or ‘increased content of GLP-1 in each L cells’. It is also interesting to know the molecular mechanisms underlying increment of GLP-1 (cell or production) by the HFS diet. Based on our results, it is likely that L-cells in the jejunum and ileum are the major sources of postprandial GLP-1 secretion. These findings are consistent with the results of the previous studies in which postprandial GLP-1 secretion was found to be a direct action of the luminal contents on L-cells in the distal jejunum and ileum(Reference Wang, Liu and Chen13,Reference Singh42) .
In the present study, the gcg mRNA expression levels were not correlated with GLP-1 contents in intestinal segments. This might be due to some other factors involved in GLP-1 production, secretion and degradation, such as DPP-IV and prohormone convertase 1/3 activity(Reference Rouillé, Kantengwa and Irminger43,Reference Morimoto, Watanabe and Sugizaki44) . In the previous study, HFS diet and high-fat diet had a potent effect on postprandial GLP-1 response rather than high-sucrose diet feeding(Reference Staten and Kelley24). Hence, the mRNA expression of free fatty acid receptors (ffar1, ffar2, ffar3 and ffar4) was investigated in the present study, and ffar1 mRNA expression level in the jejunum of WH rats tended to be higher than that of WC rats. The results suggest that chronic HFS diet feeding enhanced the sensitivity to long-chain fatty acids possibly in GLP-1 producing cells(Reference Beloqui, Alhouayek and Carradori45,Reference Thombare, Ntika and Wang46) . Although specific reasons are not entirely clear, ffar4 mRNA was almost undetectable in GK rats regardless of diet consumption. The development of glucose intolerance in GK rats might be due to ffar4 deficiency. In support our hypothesis, dysfunction of lipid sensor ffar4 has been found to cause glucose intolerance in mice(Reference Ichimura, Hirasawa and Poulain-Godefroy47).
GK rats are well recognised as type 2 diabetes models, with reduced β-cell number, and impaired glucose-induced insulin secretion(Reference Amiri, John and Shafarin48–Reference Shirai, Shichi and Sato50). Although impaired insulin secretion was not observed in both the GK groups, GH rats failed to elicit an enhanced insulin response compared with GC rats. Similar trend was observed in pancreatic insulin content, suggesting that the β-cells in Wistar rats fed an HFS diet were capable of producing compensatory insulin to maintain a normal blood glucose level. GK rats has been previously reported to exhibit dysregulation of SNARE proteins in β-cells resulting in impaired insulin secretion(Reference Gaisano, Ostenson and Sheu51). Another study reported enteroendocrine L-cells deficient in syn1a (core SNARE protein) impaired GLP-1 secretion(Reference Wheeler, Stacey and Nahaei52). Accordingly, dysregulation of SNARE protein may be involved in the lack of compensation in GLP-1 secretion for HFS diet in GK rats. On the other hand, genetic defects in GK rats, such as impaired development of pancreatic β-cell or abnormal β-cell insulin secretory machinery(Reference Shang, Yasuda and Takahashi53,Reference Movassat, Saulnier and Serradas54) , may be partially explained by a lack of enhanced GLP-1 secretion response as observed in GH rats.
The enhancement of fasting GLP-1 and insulin may play a role in the prevention of blood glucose elevation in non-diabetic Wistar rats. However, these adaptations were absent in diabetic GK rats. Interestingly, GK rats had higher plasma DPP-IV activity than Wistar rats regardless of diet composition. Although it does not seem to be universal, an elevated plasma DPP-IV activity has been previously demonstrated in type 2 diabetic patients(Reference Mannucci, Pala and Ciani55,Reference Ryskjaer, Deacon and Carr56) . Possibly, higher DPP-IV activity in GK rats is involved in unchanged basal insulin level. However, the mechanisms that underlie an increase in plasma DPP-IV activity remain unclear. A previous study reported that an exposure to high glucose can determine an increase in endothelial DPP-IV mRNA expression and protein secretion(Reference Pala, Mannucci and Pezzatini57). Other tissues such as kidney, liver and intestine might be involved(Reference McKillop, Stevenson and Moran58).
Possibly, the Wistar rats fed an HFS diet may develop diabetes after longer experimental periods much more than 26 weeks, which may impair the adaptive enhancement of postprandial GLP-1 response. Although the underlying mechanisms involved in the increment of postprandial GLP-1 secretion are still not clearly elucidated in the present study, understanding the relationship between GLP-1 secretory responses and metabolic status described in the study could contribute to a better design of therapeutic and preventive approaches for obesity and diabetes in the near future.
Conclusions
In Wistar rats, postprandial GLP-1 responses were sustained higher or tended to be higher in the obese group compared with the control group throughout the study (24 weeks), whereas diabetic GK rats had similar postprandial GLP-1 responses regardless of diet feeding. Additionally, GLP-1 content and ffar1 mRNA expression level in the jejunum segment were elevated and tended to be higher in Wistar rats after HFS diet feeding, but not in GK rats. The results suggest that the sensitivity of GLP-1-producing L-cells to long-chain fatty acids was enhanced by chronic HFS diet feeding in Wistar rats. The loss of ability to adapt against chronic ingestion of an obesogenic diet in GK rats may be responsible for exacerbating glucose impairment.
Acknowledgements
This work was supported by JSPS KAKENHI (grant numbers JP16K07725, JP18K19158 and JP19K05860).
J. P., T. H. and H. H. designed the research; J. P. conducted the research and analysed the data; J. P. and T. H. wrote the paper; T. H. had primary responsibility for the final content. All authors read and approved the final manuscript.
The authors declare that they have no conflicts of interest.


