


1 Introduction
X-rays are a very important tool for scientific research in physics, chemistry or biology. They have also become essential for a wide variety of societal applications, from nondestructive inspection for security or industry to medical imaging and treatment. These applications justify the present interest in developing compact, stable, micrometric size, high-average power and cost-effective sources as an alternative to conventional X-ray tubes and synchrotron-like facilities.
Advances in laser technology, such as chirped pulse amplification (CPA)[Reference Strickland and Mourou1], make it possible to build laser systems with gigawatt to petawatt peak powers and short pulses in a wide range of pulse energies and repetition rates[Reference Brabec and Krausz2]. These lasers can be used to accelerate particles such as electrons, protons and ions, which in turn produce X-rays and  $\unicode[STIX]{x03B3}$-rays. Laser-driven sources are based on the interaction of ultrashort and ultraintense laser pulses with matter, producing a hot dense plasma in which particles are accelerated by the combined fields of the plasma and the intense laser pulse[Reference Gibbon and Förster3]. Laser-plasma X-ray sources have been demonstrated in gas and solid targets. In gases, X-rays are produced through various mechanisms[Reference Corde, Phuoc, Lambert, Fitour, Malka, Rousse, Beck and Lefebvre4] such as betatron, synchrotron, Thomson scattering, Compton scattering or from interactions in a secondary solid target converter[Reference Döpp, Guillaume, Thaury, Lifschitz, Sylla, Goddet, Tafzi, Iaquanello, Lefrou, Rousseau, Conejero, Ruiz, Ta Phuoc and Malka5].
In contrast, for solid targets and intensities larger than  $10^{16}~\text{W}/\text{cm}^{2}$, electrons can be heated through a series of mechanisms such as resonant absorption[Reference Brunel6], vacuum heating[Reference Gibbon and Bell7] depending on the plasma gradient length[Reference Singh, Cui, Adak, Lad, Chatterjee, Brijesh, Sheng and Kumar8] or $j\times B$ at higher intensities[Reference Kruer and Estabrook9]. These electrons can produce hard X-rays through bremsstrahlung[Reference Chen, Forget, Fourmaux, Kieffer, Krol, Chamberlain, Hou, Nees and Mourou10] or specific K- $\unicode[STIX]{x03B1}$ emission. These laser-driven X-ray sources can be considered as an alternative to conventional X-ray tubes, in particular to microfocus sources, due to their unique characteristics such as their ultrafast nature, high brightness and small source size, which are well suited for some applications like high-resolution imaging[Reference Kieffer, Fourmaux and Krol11].
Bremsstrahlung laser-plasma sources are made from a wide variety of metallic solid targets, i.e., Cu, Mo, Ag, Sn, Al and Ta, or nonmetallic ones like Si or Ge. Moreover, they can be built in different arrangements that include rotating disks[Reference Huang, Li, Yan, Guo, Li, Chen, Ma, Zhao, Li, Zhang and Chen12–Reference Li, Huang, Chen, Yan, Tao, Zhao, Ma, Li and Zhang17], tapes[Reference Zhavoronkov, Gritsai, Bargheer, Woerner and Elsaesser18–Reference Weisshaupt, Juvé, Holtz, Ku, Woerner, Elsaesser, Ališauskas, Pugžlys and Baltuška22], wires[Reference Jiang, Lee, Li, Ketwaroo and Rose-Petruck23, Reference Bonvalet, Darmon, Lambry, Martin and Audebert24] or more sophisticated targets like liquid metal jets[Reference Korn, Thoss, Stiel, Vogt, Richardson, Elsaesser and Faubel25]. These X-ray sources can also generate efficiently characteristic radiation from the target, whose energy can be easily adapted by using different target materials[Reference Hagedorn, Kutzner, Tsilimis and Zacharias14, Reference Hou, Nees, Mordovanakis, Wilcox, Mourou, Chen, Kieffer, Chamberlain and Krol26, Reference Hou, Easter, Krushelnick and Nees27].
The X-ray radiation produced by laser-plasma sources is pulsed with a duration comparable to the laser pulses. Depending on the laser and target parameters, laser-plasma sources with bunches from tens of femtosecond to few picoseconds have been measured or estimated[Reference Zhavoronkov, Gritsai, Bargheer, Woerner and Elsaesser18, Reference Inoue, Tokita, Otani, Hashida, Hata, Sakagami, Taguchi and Sakabe28, Reference Feurer, Morak, Uschmann, Ziener, Schwoerer, Reich, Gibbon, Förster, Sauerbrey, Ortner and Becker29]. The ultrafast nature of these X-ray pulses has been used in time-resolved diffraction experiments[Reference Silies, Witte, Linden, Kutzner, Uschmann, Förster and Zacharias20, Reference Rischel, Rousse, Uschmann, Albouy, Geindre, Audebert, Gauthier, Förster, Martin and Antonetti30–Reference Bargheer, Zhavoronkov, Gritsai, Woo, Kim, Woerner and Elsaesser32], opening up their use in ultrafast time-resolved measurements in physics, chemistry or biology.
Laser-driven X-ray sources with moderate laser pulse energies ( ${\sim}\text{mJ}$) are operated at or close to the $\unicode[STIX]{x1D706}^{3}$ regime, which is the physical limit of compression of a laser pulse[Reference Hou, Nees, Theobald, Mourou, Chen, Kieffer, Krol and Chamberlain33], to achieve intensities around $10^{16}$– $10^{18}~\text{W}/\text{cm}^{2}$. The laser pulses are focused on target close to the diffraction limit to attain the high intensities required for electron heating[Reference Gibbon and Förster3], but also producing a micrometric X-ray source. The sizes reported so far are in the range of few microns to tens of microns[Reference Li, Huang, Chen, Yan, Tao, Zhao, Ma, Li and Zhang17, Reference Zhavoronkov, Gritsai, Bargheer, Woerner and Elsaesser18, Reference Silies, Witte, Linden, Kutzner, Uschmann, Förster and Zacharias20, Reference Serbanescu, Chakera and Fedosejevs34, Reference Hou, Mordovanakis, Easter, Krushelnick and Nees35], making these sources suitable for conventional imaging[Reference Sjögren, Harbst, Wahlström, Svanberg and Olsson13] and also for high-resolution imaging applications like phase contrast[Reference Li, Huang, Chen, Yan, Tao, Zhao, Ma, Li and Zhang17], where the source size is an important parameter.
In order to produce laser-driven X-ray sources using laser systems with high repetition rates (1–10 kHz) and moderate energies (1–10 mJ) where the focalization is tight, it is necessary to overcome three main challenges:
– Replenishing the target material after each impact.
– Repositioning the target with respect to the laser focus with high precision to keep constant the laser pulse intensity on target, using a set of target position diagnostics and movement acting during the continuous operation of the source.
– Designing a target assembly providing the two previous functions at a kHz pulse repetition rate.
To the best of our knowledge, one of the few laser-induced X-ray sources fulfilling these requirements was built by Zamponi and collaborators[Reference Zamponi, Ansari, Schmising, Rothhardt, Zhavoronkov, Woerner, Elsaesser, Bargheer, Trobitzsch-Ryll and Haschke21] using a tape-type target on vacuum producing X-rays by transmission. In this paper, we report on the development of a compact vacuum-free laser-plasma X-ray source based on rotating thick targets, which ensures stability, long operation periods and simplicity in terms of design and operation, for its use in different applications.
2 Table-top X-ray source
The laser-plasma X-ray source presented in this work is based on the interaction of infrared laser pulses, focused on a very small spot[Reference Hou, Nees, Mordovanakis, Wilcox, Mourou, Chen, Kieffer, Chamberlain and Krol26, Reference Hou, Nees, Theobald, Mourou, Chen, Kieffer, Krol and Chamberlain33], with thick solid targets. The high intensity of the laser field ionizes the target surface during the first cycles of the interaction with the laser, creating an overdense plasma. The density of this overdense plasma is several times the critical density for  $\unicode[STIX]{x1D706}=800~\text{nm}$ laser pulses. The high intensity of the pulses ( $I>10^{16}~\text{W}/\text{cm}^{2}$) produces hot electrons with relativistic velocities. These electrons interact with the ions of the target, producing bremsstrahlung and characteristic radiation[Reference McCall36–Reference Galy, Maučec, Hamilton, Edwards and Magill38]. These interactions lead to the heating of the target and at much later times, from the picosecond to the nanosecond scale, produce a Coulomb explosion. This phenomenon increases the plasma pressure and leads to the ablation of the target surface[Reference Gibbon and Förster3].
In our experiment, ultrashort infrared laser pulses are focused on a 1-mm-thick copper plate target to produce backward emitted X-ray pulses. Figure 1 shows a schematic representation of the experimental setup used to guide the laser pulses, the target assembly and the X-ray detection system.
Schematic representation of the setup where laser pulses are focused on a 1-mm-thick target by an  $f/1$ microscope objective. The X-rays produced are measured by a CdTe detector.
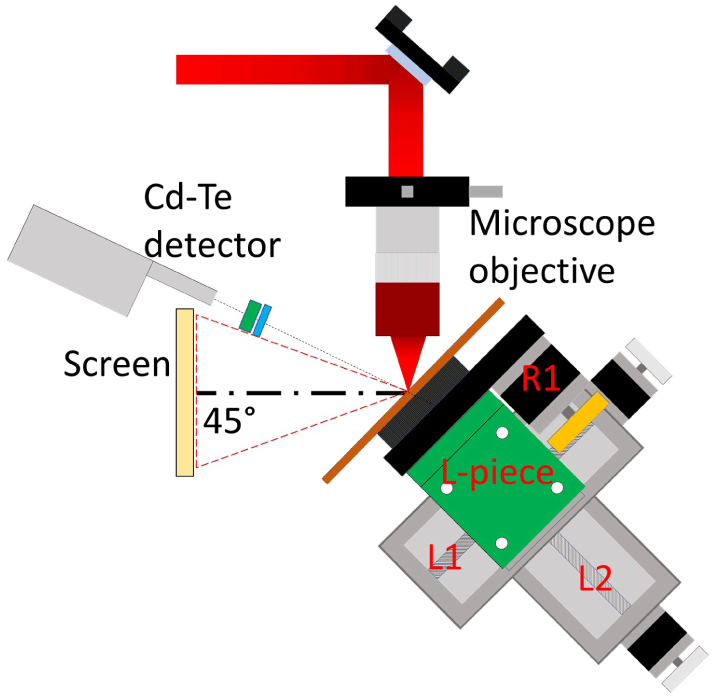
We used the low energy line of the laser system (THALES ALPHA 10/XS, 1 mJ, 35 fs, 1 kHz, 800 nm) installed at the Laser Laboratory for Acceleration and Applications (L2A2) at the University of Santiago de Compostela (USC)[Reference Benlliure, Cortina-Gil, Llerena and Ruiz39]. The s-polarized laser pulses were guided and focused onto the target at  $45^{\circ }$ from the normal, in a vacuum-free environment, with an $f/1$ microscope objective (Mitutoyo, M Plan APO NIR $20\times$).
The measurement of the duration of the  $950~\unicode[STIX]{x03BC}\text{J}$ laser pulses was performed with SPIDER (APE, Lx-SPIDER), extracting pulses before the microscope objective. The laser compressor was adjusted to provide the shortest possible pulses at this point. The temporal width of the pulses was 37 fs (FWHM). Figure 2 shows the laser contrast measured with a third-order correlator with 60 fs steps and averaging 60 shots (TUNDRA, Ultrafast Innovations). The contrast obtained is $1\times 10^{-7}$ at 10 ps and $1\times 10^{-6}$ at 2 ps. The s-polarization was used to minimize the effect of resonant absorption[Reference Brunel6, Reference Li, Huang, Chen, Yan, Tao, Zhao, Ma, Li and Zhang17, Reference Wang, Liu, Cai, Wang, Liu, Xia, Deng, Xu, Leng, Li and Xu41, Reference Cerchez, Jung, Osterholz, Toncian, Willi, Mulser and Ruhl42] and to reduce the size of the source[Reference Hou, Nees, Mordovanakis, Wilcox, Mourou, Chen, Kieffer, Chamberlain and Krol26].
Laser contrast measured with a third-order correlator with 60 fs steps and averaging 60 shots (TUNDRA, Ultrafast Innovations). The contrast obtained is  $1\times 10^{-7}$ at $10~\text{ps}$ and $1\times 10^{-6}$ at $2~\text{ps}$. Peaks located close to $-30$, $-20$ and $-10~\text{ps}$ are artefacts produced by the measurement procedure while the real ones are the symmetrical postpulses with higher intensities[Reference Herrmann, Veisz, Tautz, Tavella, Schmid, Pervak and Krausz40].

The X-ray energy spectra were measured with a CdTe detector (Amptek, XR-100T-CdTe) calibrated using the standard procedure[Reference Tisnek, Kalanxhi, Serkland, Iversen, Belyakov and Dahle43], with  $^{241}\text{Am}$ and $^{55}\text{Fe}$ radioactive sources. This detector was positioned 25 cm away from the source. To reduce pile-up effects, we used a lead collimator (2.12 mm thick, 1.15 mm in diameter), and an aluminium attenuator of $300~\unicode[STIX]{x03BC}\text{m}$ placed in front of the detector. Under these conditions, the X-ray counting rate at the CdTe detector was around $500~\text{s}^{-1}$ with a dead time around 9%. Pile-up was further reduced from the spectra following the unfolding procedure described in Ref. [Reference Hernández and Fernández44].
A laser-driven X-ray source running in air provides clear practical advantages. The technical requirements for vacuum operation are not present and therefore the operation is easier. Moreover, it provides flexibility for its use in imaging, as the locations of the source and the detectors are not restricted by the dimensions of a vacuum chamber. The electrons emitted by the source are stopped in air within some few millimetres and there is no need to introduce a deflecting magnet. Also, the contamination of the optics due to the debris is lower than in the case of operation in vacuum.
This laser-driven X-ray source also presents drawbacks as the nonlinear propagation of the laser pulses in air from the exit of the microscope objective to the target. This requires a careful calibration of the displacement of the focal position and complicates the estimation of the laser intensity on target.
Picture of the three stages of the target positioning system, the L-piece and the rotatory platform. The rotatory stage (R1) controls the angular coordinate, the upper linear stage (L1) controls the radial coordinate and the lower one (L2) controls the focal position.

3 Target positioning system
The main challenges for this type of X-ray source is to renew the target material at the impact position while keeping the target on focus at kHz repetition rate. This is achieved by a target positioning system that takes into account both, the size of the affected area at the target surface after each shot and the magnitude of the Rayleigh length for the focusing conditions. The target area affected depends on the intensity and incident angle of the laser pulses. In this focusing geometry the Rayleigh range is on the order of a few microns requiring precise positioning of the target to maintain high intensities.
The target positioning system developed in this work is composed by two identical linear stages L1 and L2 (PiMicos, VT-80) and a rotatory stage R1 (PiMicos, DT-50), where L1 and L2 (Figure 3) are mounted perpendicularly and R1 is attached to them with an L-shaped plate. The whole system is mounted on a rotatory platform to choose the incidence angle with respect to the microscope objective, in our case  $45^{\circ }$. The targets are polished copper plates of $10~\text{cm}\times 10~\text{cm}$ and 1 mm thick placed on the centre of the rotatory stage.
Several solutions for the target positioning system in this kHz regime are reported in literature[Reference Li, Huang, Chen, Yan, Tao, Zhao, Ma, Li and Zhang17, Reference Zamponi, Ansari, Schmising, Rothhardt, Zhavoronkov, Woerner, Elsaesser, Bargheer, Trobitzsch-Ryll and Haschke21, Reference Legall, Blobel, Stiel, Sandner, Seim, Takman, Martz, Selin, Vogt, Hertz, Esser, Sipma, Luttmann, Höfer, Hoffmann, Yulin, Feigl, Rehbein, Guttmann, Schneider, Wiesemann, Wirtz and Diete45, Reference Zhang, Zhu, Yang, Wang and Wang46]. Our design presents some important advantages. In particular, the use of a rotatory plate, does not require large accelerations as the ones for linear stages, favouring the stability of the source. Moreover, the high speed of the rotatory stage allows us to minimize the superposition of laser impacts at the target surface even at the highest repetition rate of the laser system (1 kHz).
The stability, high-average power, and long periods of operation of the X-ray source are determined by the movements of the target positioning system. To optimize the performances of the source, advanced diagnostic systems to characterize the focal position and a precise definition of the target movement are needed.
4 Focusing diagnostics
Laser focal spot obtained with the  $f/1$ microscope objective ( $20\times$). By removing the target and using other microscope objective ( $50\times$) we can image the focal spot as illustrated in the inset.

The characterization of the laser focus is critical for the optimum operation of the X-ray source. In particular, we need to measure the laser spot size at the focal position of the microscope objective, in order to estimate the intensity of the laser pulses at focus, knowing also the pulse duration and energy. In this section, we present a set of well-known diagnostics to determine the focus size, the focus position in the linear regime and the shift of the focus due to the nonlinear effects induced by the propagation in air.
The laser focus is imaged with a calibrated system composed by a microscope objective (Mitutoyo, M Plan APO NIR  $50\times$) and a CMOS camera (Mightex, 5 Mpx) mounted on a linear stage (Thorlabs, MTS50). The focal spot diameters measured were $d_{x}(\text{FWHM})=(3.8\pm 0.4)~\unicode[STIX]{x03BC}\text{m}$ and $d_{y}(\text{FWHM})=(3.9\pm 0.3)~\unicode[STIX]{x03BC}\text{m}$ (see Figure 4). The horizontal spot size on target is slightly larger, $d_{x}(\text{FWHM})=(5.4\pm 0.6)~\unicode[STIX]{x03BC}\text{m}$, because of the $45^{\circ }$ incidence. Finally, using the energy of the laser pulses, $950~\unicode[STIX]{x03BC}\text{J}$ and the temporal width, 37 fs, measured at the entrance of the microscope objective, we estimate the nominal intensity on focus $1.5\times 10^{17}~\text{W}/\text{cm}^{2}$. The precise determination of the intensity on target is a real challenge because of the focusing conditions of the laser pulses and their nonlinear propagation in air.
Speckle images obtained at different target positions. (a) 100 μm after focus, (b)  $50~\unicode[STIX]{x03BC}\text{m}$ after focus, (c) $20~\unicode[STIX]{x03BC}\text{m}$ after focus, (d) $5~\unicode[STIX]{x03BC}\text{m}$ after focus, (e) speckle at focus, (f) $5~\unicode[STIX]{x03BC}\text{m}$ before focus, (g) $20~\unicode[STIX]{x03BC}\text{m}$ before focus, (h) $50~\unicode[STIX]{x03BC}\text{m}$ before focus and (i) $100~\unicode[STIX]{x03BC}\text{m}$ before focus. (j) Spectral intensity for low frequencies of the speckle pattern as a function of the target position with respect to the laser focus.

The precise positioning of the target is of utmost importance for optimizing the stability of the X-ray source. For this purpose, we used the speckle technique based on the observation of the laser specular reflection on the target[Reference Martín, Benlliure, Cortina, Llerena, González and Ruiz47] to determine the focus position in the linear regime, i.e., the nominal focus of the microscope objective. To implement the speckle, we used a He-Ne laser propagating through the same path as the main infrared one. The reflection on the target after the objective was imaged on a white screen and collected with a CMOS camera, while moving the target position with the focal motor L2.
Figure 5 shows the speckle images obtained with the alignment He-Ne laser beam for different positions of the longitudinal linear stage, L2. The image shown in Figure 5(e), corresponds to the laser focus position with an homogeneous laser reflection, because the roughness of the target surface is larger than the laser spot. However, when the target is located upstream (Figures 5(f)–5(i)) or downstream (Figures 5(a)–5(d)) the focal position, higher spatial frequencies are more prominent and target surface structures over the specular reflection of the laser, with an heterogeneous pattern. Figure 5(j) shows the spectral intensity of low spatial frequencies as a function of the distance to the laser focal position. The distribution becomes smoother as the target approaches the focal position of the laser pulses. This technique allowed us to determine the optimum position of the target with an accuracy of the order of the Rayleigh range ( ${\sim}4~\unicode[STIX]{x03BC}\text{m}$). The speckle technique was also benchmarked with a rear-side technique[Reference Carroll, McKenna, Kar, Borghesi, Foster, Symes, Pattathil and Neely48, Reference Carroll, Coury, Scott, Mckenna, Streeter, Nakamura, Najmudin, Fiorini, Green and Green49]. The choice of the speckle technique came from the fact that it was easier to implement in our setup and it provided a more accurate positioning in the case of thick targets that could present thickness variations over the target surface.
Integral of the X-ray energy spectra as a function of the distance to the nominal focus for laser pulses with  $950~\unicode[STIX]{x03BC}\text{J}$ (red) and $500~\unicode[STIX]{x03BC}\text{J}$ (blue).

The pulse intensities attained before focus are enough to ionize air and to induce nonlinear effects during the pulse propagation. The competition between the two main nonlinear effects at these intensities, self-phase modulation and auto-focusing (Kerr effect)[Reference Couairon and Mysyrowicz50, Reference Lim, Durand, Baudelet and Richardson51], produce a shift of the focal position of the infrared laser pulses. As a consequence, the focal position approaches the objective as intensity increases[Reference Dergachev, Ionin, Kandidov, Mokrousova, Seleznev, Sinitsyn, Sunchugasheva, Shlenov and Shustikova52].
Maintaining the pulse duration and the spot size constant, we were able to characterize this focus displacement in terms of the pulse energy. For a fixed detection angle ( $17^{\circ }$) of the CdTe detector, we measured several spectra varying the position of the target on the focus axis for pulses with two different energies. In Figure 6 we show the integrated X-ray energy spectra as a function of the distance to the nominal focus for $E=950~\unicode[STIX]{x03BC}\text{J}$ and $E=500~\unicode[STIX]{x03BC}\text{J}$. Fitting these curves, we obtain the infrared focus displacement when working on air for these two energies that corresponds to $41~\unicode[STIX]{x03BC}\text{m}$ and $33~\unicode[STIX]{x03BC}\text{m}$, respectively. This result is in agreement with the previously observed shift in the focal position as a function of the intensity[Reference Talebpour, Petit and Chin53]. This precise determination of the focus position in air is of crucial importance to optimize the operation of the X-ray source.
5 Target movement optimization
Map of the target surface deviations including the wobble effect.

The stability and repeatability of the X-ray source relies on the optimization of the target assembly movement to refresh the target material shot by shot and to position the target at laser focus position. Two important issues concerning this movement should be considered. The first one is related to the wobble of the target, due to the tilt of the axis of the rotating stage holding the target material while it is moving. The second one is the distance between impact positions on the target surface for consecutive laser shots at 1 kHz repetition rate.
We applied two different corrections to address these issues and to guarantee the stability of the source. The first one is the modification of the angular velocity according to the radial position of the impacts. The second is the longitudinal displacement of the target surface with respect to the focal position of the laser pulses or target offset.
The wobble caused by the fast movement of the rotating stage will modify the position of the target surface with respect to the laser focus. According to the manufacturer specifications the wobble of the rotatory stage used in the present target assembly is  $\pm 100~\unicode[STIX]{x03BC}\text{m}$, making it necessary to take into account this effect. For this purpose, we used a precision positioning device with a resolution of $\pm 1~\unicode[STIX]{x03BC}\text{m}$ (Micro-Epsilon, OptoNCDT ILD 1320-10) for radii ranging from 12 mm to 40 mm. As can be seen in Figure 7 (right vertical scale), the longitudinal position of the target surface deviates from some $100~\unicode[STIX]{x03BC}\text{m}$, for the inner radii, and up to some $200~\unicode[STIX]{x03BC}\text{m}$ for the outer ones, as consequence of the wobble of the rotatory stage. The external part of the copper plate has larger displacements, despite of the smaller angular velocity, because the wobble effect depends not only on the velocity but also on the distance to the rotation axis. Deformations, imperfections and scratches on the target surface can also be measured with the positioning sensor.
The second important issue affecting the repeatability of the X-ray source is the angular velocity of the target. This angular velocity defines, together with the radius, the linear velocity of any point at the target surface. The separation between impacts at the target surface is thus an important parameter for the stability and optimization of the X-ray source[Reference Hironaka, Fujimoto, Nakamura, Kondo and Yoshida54].
Example of two copper targets irradiated (a) with a constant angular velocity and (b) with a variable angular velocity.

Five X-ray energy spectra measured, during 120 s each one, with the same laser conditions, but moving the target (a) with a constant angular velocity and (b) with a variable angular velocity according to the radius of the impact position. The colours represent spectra obtained in measurements done with different radial positions with respect to the target centre of rotation. The correction of the target offset with respect to focus was applied in all the measurements.
 $15\times$ microscope image of the variable angular velocity target indicating the radii of the inner $R_{1}=14~\unicode[STIX]{x03BC}\text{m}$ and the outer $R_{2}=38~\unicode[STIX]{x03BC}\text{m}$, the distance between craters $B=58~\unicode[STIX]{x03BC}\text{m}$ and the radial distance between circles $A=110~\unicode[STIX]{x03BC}\text{m}$.

Two strategies concerning the angular velocity are possible. The first one is to keep the angular velocity constant, resulting in smaller separations between laser impacts while decreasing the radius. In Figure 8(a) we can see a target irradiated with a constant angular velocity of  $20^{\circ }/\text{s}$, corresponding to the maximum speed of the system imposed by the linear stages when the three stages are moving in an engaged mode. As observed in this figure, the copper plate is completely burnt due to the superposition of laser impacts. The X-ray energy spectra obtained in this case for different measurements at $17^{\circ }$ and irradiating just a small fraction of the target surface during 120 s, are depicted in Figure 9(a). These spectra show important variations in the shape, but also fluctuations in the total X-ray flux larger than 35%. Indeed, it can be clearly seen how for the smaller irradiation radii, where the superposition between impact spots of consecutive shots exists, the X-ray flux reduces significantly.
The second strategy consists on using a variable angular velocity movement, optimized by choosing a fixed distance between impacts and, accommodating the movement of the whole system to the irradiation radius. To optimize this movement, one should consider the size of the holes at the target surface produced by a single shot. Measurements of the holes produced by the laser pulses with a scanning electron microscope show a deep crater of around  $40~\unicode[STIX]{x03BC}\text{m}$ diameter and material debris–vapour deposition of around $70~\unicode[STIX]{x03BC}\text{m}$ in the total affected area.
Based on these measurements, we chose  $60~\unicode[STIX]{x03BC}\text{m}$ for the separation between the centre of the impact positions on target and a separation of $110~\unicode[STIX]{x03BC}\text{m}$ between consecutive radii. Considering a 1 kHz repetition rate this corresponds to a linear velocity of $60~\text{mm}/\text{s}$. To keep constant the linear speed, we had to adapt the angular velocity as a function of the impact radius.
The motions of the motors refresh the target material and correct the target position with respect to focus. At 1 kHz the correction of the position of the target with respect to focus cannot be done shot by shot; alternatively, we choose to implement this correction at four equidistant points for each circle. First, the target rotates  $90^{\circ }$ clockwise. After this, the linear stage (L2) moves to correct the target position with respect to the focus and another $90^{\circ }$ rotation is performed. This is repeated until a complete circumference is covered. Then the other linear stage (L1) changes the radius to an inner one and the $90^{\circ }$ rotatory movements are done now in anticlockwise direction until all the available target area is irradiated. Because of this movement, the irradiated areas produce concentric circles on the target surface.
Figure 8(b) shows a copper plate target after being irradiated with variable angular velocity. As can be seen, the irradiated area is hardly burnt and with an appreciable structured pattern in the copper surface. The over-burnt areas forming a cross correspond to the positions where the distance to focus is corrected or the radius changed. Figure 10 shows a magnified image of the surface of an irradiated copper target. The image was done using a conventional  $15\times$ microscope. As the linear velocity is $60~\text{mm}/\text{s}$, we can observe that craters in the same irradiation circle are separated by $B=58~\unicode[STIX]{x03BC}\text{m}$ while the radial distance between circles is $A=110~\unicode[STIX]{x03BC}\text{m}$. Two different zones can be distinguished in the craters, a small one with $R_{1}=14~\unicode[STIX]{x03BC}\text{m}$ in diameter and a bigger one with $R_{2}=38~\unicode[STIX]{x03BC}\text{m}$. This movement strategy leads to a stable operation of the X-ray source. When the target rotates with constant angular velocity we observe a significant reduction in the X-ray flux for the lowest impact radii, as shown in Figure 9(a). This reduction in flux, attributed to the superposition of consecutive shots on the target surface, decreases when increasing the radius of the irradiation positions. On the other hand, a stable operation is achieved when the distance between impacts is larger than the size of the craters produced by each impact at the target surface. This stability is shown by the similarity in the five different energy spectra displayed in Figure 9(b).
The operation of the target with a constant angular velocity is simpler, because it is not necessary to know the impact radius. However, in order to reach a stable operation in this mode, it would be necessary to use larger targets to avoid overlap between impacts. On the other hand, adjusting the angular speed as a function of the impact radius allows us to define a smaller fixed separation distance between laser impacts. This optimization of the target positioning allows us to maximize the number of laser impacts per target and to maintain continuous operation for as long as 36 min with very good stability. This operation time could be increased by using larger targets.
6 Results
The variable angular velocity operation mode presented in Section 5, together with the positioning of the target described in Section 4 and the correction of the target offset with respect to focus in four equidistant positions per impact radial position, improves the stability of the X-ray source.
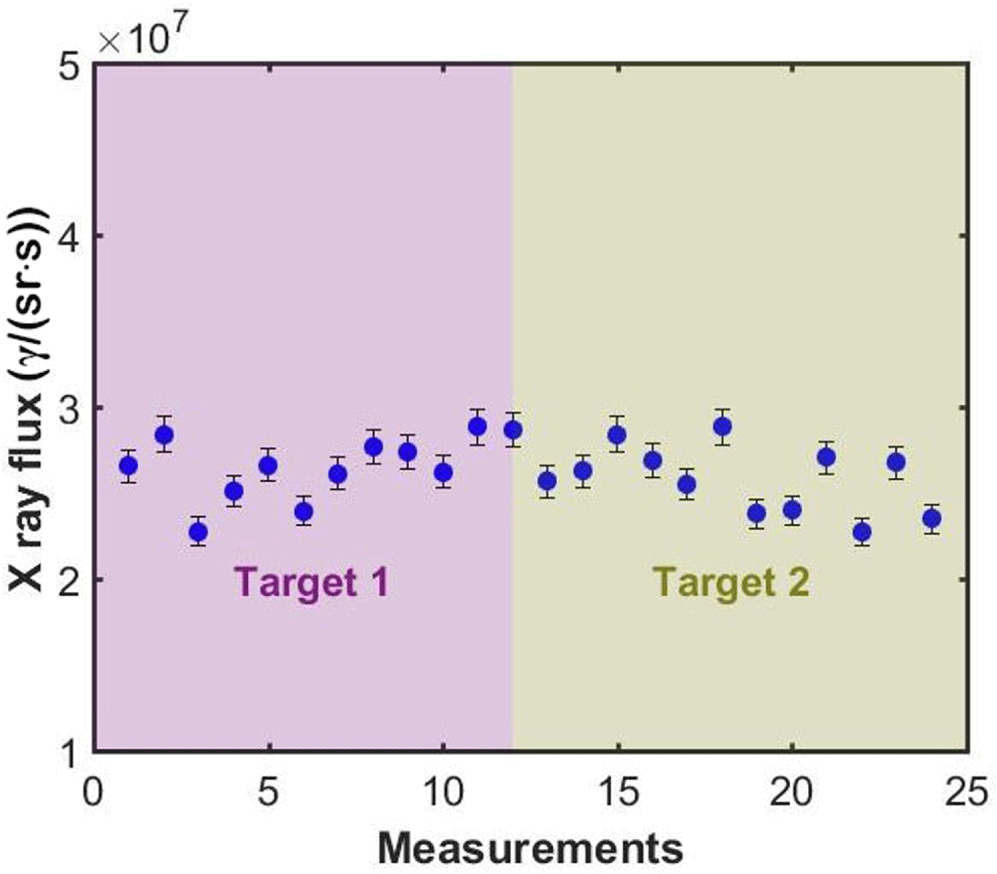
The final stability of the source can be quantified in terms of the repeatability of the characteristics of the produced X-rays. To investigate this repeatability we have measured 24 X-ray spectra at  $17^{\circ }$ during 3 min each, resulting in more than 1 h of source operation, corresponding to the use of two complete copper targets.
We quantified the stability of the X-ray source by looking to the variations of the X-ray flux in different measurements, which amounts to  $2.6\times 10^{7}\unicode[STIX]{x1D6FE}/(\text{sr}\cdot \text{s})$ as determined with the CdTe detector. In Figure 11 we display the X-ray flux obtained per measurement. The flux deviation for the 24 different measurements amounts to 6.6%, indicating that the repeatability of this X-ray source is better than 93%. Moreover, the shape of the energy spectrum of the produced X-rays is also stable as shown in Figure 9(b).
Total counts obtained at  $17^{\circ }$ in 24 different measurements of 3 min performed with two different targets and laser pulses of $950~\unicode[STIX]{x03BC}\text{J}$. Error bars are calculated as the systematic uncertainty in the determination of the solid angle of the collimator and the statistical uncertainty in X-ray counts.
Another important parameter defining the potential use of this kind of X-ray sources in different applications is the delivered dose rate. We measured the dose delivered by the source described in this work using ring-type TLDs (Harshaw, TLD-100). The dose rate we have obtained amounts to  $1.5~\text{Sv}/\text{h}$ at 30 cm when the X-ray source is operating at the maximum laser energy per pulse ( $950~\unicode[STIX]{x03BC}\text{J}$).
We can then conclude that this is a cost-effective source delivering  $1.5~\text{Sv}/\text{h}$ at 30 cm with a peak power of few watts, while conventional X-ray tubes with a similar power produce smaller dose rates and softer X-ray spectra (e.g., 4 W, $1~\text{Sv}/\text{h}$[55]). The high stability, high-average power and operation duration as long as 36 min of this source make it suitable for high-resolution imaging applications, but also to make systematic measurements for a complete characterization of this source.
7 Conclusions
In this paper, we have presented a table-top laser-plasma X-ray source in a vacuum-free environment based on solid targets. We have also investigated the three main parameters affecting the stability of this source: focus location, focus shift by self-focusing and target positioning and movement.
The speckle technique allows us to determine the nominal focus position and to calibrate the focus shift due to the nonlinear effects induced by the propagation of the laser pulse in air. The precise determination of the focus shift in air is important to maximize the X-ray dose of this source.
The target movement optimization using a variable angular velocity mode is crucial to obtain the stable operation of the source in terms of flux and X-ray spectrum. This strategy allows us to avoid the overlap of laser impacts on the target surface while maximizing the use of the target surface and obtaining a repeatability better than 93% for nonstop operation time as long as 36 min per target. This operation time could be easily increased by using targets with larger surfaces.
Moreover, this source belongs to a family of X-ray sources with unique characteristics such as sub-picosecond X-ray pulses at kHz repetition rates and micrometric source size. These characteristics make it suitable for X-ray time-resolved experiments and high-resolution imaging techniques like phase contrast as important applications in chemistry, biology and medicine.
Acknowledgements
This work was supported by the Spanish Ministerio de Ciencia, Innovación y Universidades under RTI2018-101578-B-C21 and FPI predoctoral BES-2017-08917 grants, Unidad de Excelencia Maria de Maeztu under project MdM-2016-0692-17-2 and the Xunta de Galicia research grant GRC ED431C 2017/54. C.R. acknowledges the MINECO project FIS2016-75652-P.


 Open access