


1. Introduction
With 557 million active users (Statista 2025), the platform Twitter, recently renamed X, is positioned as one of the most popular social networks globally. Although it was conceived as a real-time urban narrative with the goal of connecting people (Los Angeles Times, 2009), its great capacity to convey social approval through likes and retweets often encourages collaboration among individuals with negative attitudes and reinforces their prejudices (Walther, Reference Walther2022). Additionally, Twitter has a distinctive feature: the brevity of its messages. With only 280 characters per tweet, users wishing to express intellectual opinions are forced to resort to comment threads or condense their content into lines that may come across as ambiguous or exaggerated (Wright, Reference Wright2014). According to Jack Dorsey, co-founder of Twitter, the name of the application was chosen because, aside from meaning “bird chirping,” it also refers to “a brief burst of inconsequential information” (Los Angeles Times, 2009). This suggests that the very design of Twitter promotes the dissemination of unfounded political arguments and biased opinions perhaps more than any other network. Furthermore, since Elon Musk assumed the role of CEO in October 2022, problematic content has significantly increased, and previously censored accounts have been reinstated (Walther, Reference Walther2022).
The analysis of online hate, which attracts considerable interest from companies and governments (United Nations, 2024; Anti-Defamation League, Reference Anti-Defamation2024; Google LLC, 2024; Microsoft Corporation, 2024; Jigsaw, Reference Jigsaw2024), arises in response to this type of content on Twitter and other social networks. For instance, in Spain, since 2019, the Spanish National Office Against Hate Crimes (ONDOD) and the Spanish Observatory of Racism and Xenophobia (OBERAXE) have led the investigation of hate on Twitter through the ALRECO and REAL-UP projects.Footnote a These projects have resulted in research papers (Pereira-Kohatsu et al. Reference Pereira-Kohatsu, Quijano-Sánchez, Liberatore and Camacho-Collados2019; del Valle-Cano et al. Reference Valle-Cano, Quijano-Sánchez, Liberatore and Gómez2023), which are examples of many studies over the past few years that have focused on training and optimising classifiers on static datasets to determine the intent behind tweets (Nayla, Setianingsih, and Dirgantoro Reference Nayla, Setianingsih and Dirgantoro2023; Singh, Malhotra, and S. Reference Singh, Malhotra and Savaridassan2023a; Turjya et al. Reference Turjya, Kumari, Swain and Bandyopadhyay2023; Singh et al. Reference Singh, Sanjay, Pramod Jain, Rishi and Bhardwaj2023b). Another major line of research on Twitter hate is the development of monitoring tools that analyse datasets generated in real time (Dinh et al. Reference Dinh, Vo, Nguyen and Do2023; Carhuancho-Bazan, Nuñez-Lazo, and Ugarte Reference Carhuancho-Bazan, Nuñez-Lazo and Ugarte2023; Gupta et al. Reference Gupta, Kadian, Jain, Dwivedi and Sharma2023).
However, in the field of online hate speech, there are very few studies on user profiling (Noorian et al. Reference Noorian, Ghenai, Moradisani, Zarrinkalam and Alavijeh2024; Doğanç and Markov Reference Doğanç and Markov2023). When expanding the search to a more general context, user profiling is more common (Lee et al. Reference Lee, Oh, Lim and Choi2014; Heidari, Jones, and Uzuner Reference Heidari, Jones and Uzuner2020; Treves, Masud, and Faloutsos Reference Treves, Masud and Faloutsos2022). The term “profiling” refers to the analysis of characteristics and behaviours of large groups of users defined by an attribute, such as age (Nguyen et al. Reference Nguyen, Gravel, Trieschnigg and Meder2021), ethnicity (Rao et al. Reference Rao, Paul, Fink, Yarowsky, Oates and Coppersmith2021), gender (Liu, Li, and Li Reference Liu, Li and Li2021; Rao et al. Reference Rao, Paul, Fink, Yarowsky, Oates and Coppersmith2021), or personality (Skowron et al. Reference Skowron, Tkalcic, Ferwerda and Schedl2016). It is used in marketing to segment audiences and personalise products (Stakhiyevich and Huang Reference Stakhiyevich and Huang2019); in cybersecurity, to identify malicious actors (Treves, Masud, and Faloutsos Reference Treves, Masud and Faloutsos2022); to combat disinformation by characterising bots (Heidari, Jones, and Uzuner Reference Heidari, Jones and Uzuner2020); and to profile haters (Noorian et al. Reference Noorian, Ghenai, Moradisani, Zarrinkalam and Alavijeh2024). Additionally, studies have been conducted that use graphs to represent users involved in hate speech to understand complex patterns among user groups (del Valle-Cano et al. Reference Valle-Cano, Quijano-Sánchez, Liberatore and Gómez2023; Perera, Perera, and Ahangama Reference Perera, Perera and Ahangama2023). In these graphs, users are nodes, and relationships (follows, mentions, likes, etc.) are edges. The goals are to identify highly influential haters (Perera, Perera, and Ahangama Reference Perera, Perera and Ahangama2023) and analyse the nature of interactions between different types of users (Chandra et al. Reference Chandra, Reddy, Sehgal, Gupta, Buduru and Kumaraguru2021), among others.
The aim of this research, carried out in collaboration with the ONDOD and OBERAXE, is to understand the behaviour of users related to hate speech on Twitter, both at an individual level and within their social environment. The main focus is to meticulously describe the profiles of perpetrators and victims, as well as to create innovative tools through which the impact and dissemination of hate speech can be evaluated. This work contributes to the understanding of online hate dynamics, which may support the development of mitigation and prevention strategies undertaken by law enforcement and government organisations dedicated to it. The objective is to strengthen online hate monitoring capabilities and enhance counter-narrative strategies that combat hate speech stemming from racism, xenophobia, Islamophobia, anti-Semitism, and antigypsyism, among others.
After an exhaustive review of hate speech analysis on social networks, it has been observed that while hate message classifiers and real-time monitoring have been widely addressed (Nayla, Setianingsih, and Dirgantoro Reference Nayla, Setianingsih and Dirgantoro2023; Turjya et al. Reference Turjya, Kumari, Swain and Bandyopadhyay2023; Singh et al. Reference Singh, Sanjay, Pramod Jain, Rishi and Bhardwaj2023b), user profiling and graphs as representations of the social network remain open lines of research. Regarding the former, besides the lack of studies in the field of hate (Chandra et al. Reference Chandra, Reddy, Sehgal, Gupta, Buduru and Kumaraguru2021; He et al. Reference He, Ziems, Soni, Ramakrishnan, Yang and Kumar2022; Noorian et al. Reference Noorian, Ghenai, Moradisani, Zarrinkalam and Alavijeh2024), it has been observed that the definition of user classes is based on subjective criteria. In the particular case of hate, users are usually divided into only two groups (Rangel et al. Reference Rangel, De La Peña Sarracén, Chulvi, Fersini and Rosso2021; Noorian et al. Reference Noorian, Ghenai, Moradisani, Zarrinkalam and Alavijeh2024; Mishra et al. Reference Mishra, Tredici, Yannakoudakis and Shutova2019; An et al. Reference An, Kwak, Lee, Jun and Ahn2021): haters and non-haters (hereafter, neutrals). However, it is possible that users naturally cluster into other distinct subsets. For example, into haters, extreme haters, and neutrals, or into haters and upstanders (people who oppose hate). Moreover, to automatically classify users using a machine learning model, different textual features derived from tweets and profile information are taken as input attributes (Rangel et al. Reference Rangel, De La Peña Sarracén, Chulvi, Fersini and Rosso2021; Noorian et al. Reference Noorian, Ghenai, Moradisani, Zarrinkalam and Alavijeh2024; Mishra et al. Reference Mishra, Tredici, Yannakoudakis and Shutova2019; An et al. Reference An, Kwak, Lee, Jun and Ahn2021; Chandra et al. Reference Chandra, Reddy, Sehgal, Gupta, Buduru and Kumaraguru2021; He et al. Reference He, Ziems, Soni, Ramakrishnan, Yang and Kumar2022), but it has not been explored whether this can be done solely with profile data. Regarding the latter, edges typically represent superficial relationships (follows, mentions, likes, etc.; del Valle-Cano et al. (Reference Valle-Cano, Quijano-Sánchez, Liberatore and Gómez2023); Perera et al. (Reference Perera, Perera and Ahangama2023)), meaning they do not always translate into meaningful personal relationships.
In light of these observed limitations, the following
research questions are formulated:
-
• RQ1: What objective techniques can classify users based on their stance towards hate?
-
• RQ2: What underlying groups exist within the set of users with respect to hate?
-
• RQ3: What profile characteristics are specific to each type of user?
-
• RQ4: How do users behave in terms of (a) the topics on which they express hate and (b) the virality of their hate messages?
-
• RQ5: How are relationships of support and opposition between users reflected in a social network through the structure of a graph?
To address the RQs, we have relied on two datasets. First, a keyword-based corpus of 3.3 million tweets has been collected using hate-associated terms; after filtering, 1.6 million unique tweets remained for analysis. Second, from this dataset, we identified approximately 3,000 users and extracted their timelines, resulting in over 3 million tweets in total.Footnote b To answer RQ1 and RQ2, clustering techniques have been employed to avoid imposing an arbitrary limit on the percentage of hate emitted by a user. To answer RQ3, a classifier has been trained based on profile information, and a descriptive analysis has been conducted to determine the most significant characteristics of each type of user. Both explicit characteristics (number of tweets and followers, time spent on Twitter, etc.) and implicit characteristics (gender, personality, anonymity, etc.) have been considered. To answer RQ4, statistical techniques have been used to model and understand user behaviour patterns. Finally, to answer RQ5, an interactive graph visualisation tool has been developed to analyse the interactions between each type of user.
The rest of the document is structured as follows: Section 2 provides a review of the most relevant state-of-the-art literature according to the objectives of this project and justifies the research questions. Section 3 describes the methods and algorithms developed to profile users and analyse their interactions. Section 4 presents the datasets used and the procedure implemented to extract them. Section 5 illustrates the experiments conducted and discusses the results. Finally, Section 6 summarises the conclusions drawn, highlights the limitations of this research, and outlines possible future research directions.
2. State of the art
To gain a comprehensive understanding of the research on hate speech and user behaviour on Twitter, we have conducted a systematic bibliographic review following the approach of Bramer et al. (Reference Bramer, De Jonge, Rethlefsen, Mast and Kleijnen2018). To establish the novelty of this study, we began with a broad search for existing tools used to detect and monitor online hate speech. This review revealed that the areas of hate user profiling and hate interaction analysis remain mainly under-explored, making them focal points for further investigation in the following subsections. The section concludes by outlining the limitations identified in the current literature, which serve as the basis for the objectives of this study.
2.1 Hate speech detection studies
Hate speech encompasses discriminatory language, insults, intimidation, and the use of stereotypes targeting specific groups based on factors such as ethnicity, sexuality, or gender. While it is widely acknowledged as a serious issue on social media, manually detecting and moderating such behaviour in real time is nearly unfeasible due to the sheer volume and rapid pace of content generation. Consequently, numerous studies have focused on developing automated tools to combat online hate speech. This section reviews the two primary research areas in hate speech detection: the classification of hate speech messages and real-time monitoring systems.
2.1.1 Hate speech message classification
The majority of research on hate speech within social networks (see Table 1 for a summary of the most relevant references), approximately 95% of search results, centres on the classification of hate messages. These studies typically involve training machine learning models using static datasets where each text segment is labelled as either hate or non-hate (Pereira-Kohatsu et al. Reference Pereira-Kohatsu, Quijano-Sánchez, Liberatore and Camacho-Collados2019; Briliani, Irawan, and Setianingsih Reference Briliani, Irawan and Setianingsih2019). Although binary classification is the most common approach, there are instances where multiclass classification is employed (Sachdeva et al. Reference Sachdeva, Chaudhary, Madaan and Meel2021; Qureshi and Sabih Reference Qureshi and Sabih2021; Jahan et al. Reference Jahan, Dutta, Hassan Khan, Shahariar Karim Badhon and Rab2022; del Valle-Cano et al. Reference Valle-Cano, Quijano-Sánchez, Liberatore and Gómez2023). For example, Jahan et al. (Reference Jahan, Dutta, Hassan Khan, Shahariar Karim Badhon and Rab2022) categorise sexism into subtypes such as stereotyping and objectification, domination, sexual harassment, and threats of violence, while del Valle-Cano et al. (Reference Valle-Cano, Quijano-Sánchez, Liberatore and Gómez2023) classify tweets as violent hate, non-violent hate, counter-narratives, or neutral. While much of the literature addresses general hate speech (Briliani, Irawan, and Setianingsih Reference Briliani, Irawan and Setianingsih2019), some studies focus specifically on sexist (Sachdeva et al. Reference Sachdeva, Chaudhary, Madaan and Meel2021; Jahan et al. Reference Jahan, Dutta, Hassan Khan, Shahariar Karim Badhon and Rab2022) or racist content (Alotaibi and Abul Hasanat Reference Alotaibi and Abul Hasanat2020; Sachdeva et al. Reference Sachdeva, Chaudhary, Madaan and Meel2021), or on hate speech tied to specific events such as the COVID-19 pandemic (Bhimani et al. Reference Bhimani, Bheda, Dharamshi, Nikumbh and Abhyankar2021) or political elections (Febriana and Budiarto, Reference Febriana and Budiarto2019). Additionally, while some studies narrow their scope by defining hate speech strictly, others expand it to include both discriminatory hate and offensive language, covering general insults without explicit racial or sexist motivations (Martins et al. Reference Martins, Gomes, Almeida, Novais and Henriques2018; Chhikara and Malik Reference Chhikara and Malik2022; Turjya et al. Reference Turjya, Kumari, Swain and Bandyopadhyay2023; Singh, Malhotra, and S. Reference Singh, Malhotra and Savaridassan2023a).
Summary of hate speech classification studies

These systems primarily leverage natural language processing (NLP) techniques, which typically involve preprocessing the text prior to training by removing stopwords, special characters, emoticons, and more, while also correcting spelling errors and applying tasks such as stemming, standardisation, and tokenisation (Martins et al. Reference Martins, Gomes, Almeida, Novais and Henriques2018; Herodotou, Chatzakou, and Kourtellis Reference Herodotou, Chatzakou and Kourtellis2021; Plaza-Del-Arco et al. Reference Plaza-Del-Arco, Molina-Gonzalez, Urena-Lopez and Martin-Valdivia2021; Panchala et al. Reference Panchala, S Sasank, Harshitha Adidela, Yellamma, Ashesh and Prasad2022; Shrimali, Reference Shrimali2022; Nayla, Setianingsih, and Dirgantoro Reference Nayla, Setianingsih and Dirgantoro2023). After preprocessing, the text is converted into numerical vectors using methods such as word2vec or GloVe to make the text “machine-readable” (Syam, Irawan, and Setianingsih Reference Syam, Irawan and Setianingsih2019; Bhimani et al. Reference Bhimani, Bheda, Dharamshi, Nikumbh and Abhyankar2021; Sachdeva et al. Reference Sachdeva, Chaudhary, Madaan and Meel2021; Shrimali, Reference Shrimali2022). In some instances, TF-IDF is also employed to identify the most significant words in the dataset, which the classifier then uses (Martins et al. Reference Martins, Gomes, Almeida, Novais and Henriques2018; Briliani, Irawan, and Setianingsih Reference Briliani, Irawan and Setianingsih2019; Roy et al. Reference Roy, Tripathy, Das and Gao2020; Defersha, Kekeba, and Kaliyaperumal Reference Defersha, Kekeba and Kaliyaperumal2021; Qureshi and Sabih Reference Qureshi and Sabih2021; Jahan et al. Reference Jahan, Dutta, Hassan Khan, Shahariar Karim Badhon and Rab2022; Singh et al. Reference Singh, Sanjay, Pramod Jain, Rishi and Bhardwaj2023b). Classifiers rely on traditional machine learning models such as Naive Bayes (NB), random forest (RF), decision trees (DT), K-nearest neighbours, support vector machine (SVM), and logistic regression (LR) (Martins et al. Reference Martins, Gomes, Almeida, Novais and Henriques2018; Briliani, Irawan, and Setianingsih Reference Briliani, Irawan and Setianingsih2019; Roy et al. Reference Roy, Tripathy, Das and Gao2020; Defersha, Kekeba, and Kaliyaperumal Reference Defersha, Kekeba and Kaliyaperumal2021; Bhimani et al. Reference Bhimani, Bheda, Dharamshi, Nikumbh and Abhyankar2021; Herodotou, Chatzakou, and Kourtellis Reference Herodotou, Chatzakou and Kourtellis2021; Shrimali, Reference Shrimali2022; Panchala et al. Reference Panchala, S Sasank, Harshitha Adidela, Yellamma, Ashesh and Prasad2022; Jahan et al. Reference Jahan, Dutta, Hassan Khan, Shahariar Karim Badhon and Rab2022). Among these, SVM often performs best (Martins et al. Reference Martins, Gomes, Almeida, Novais and Henriques2018; Defersha, Kekeba, and Kaliyaperumal Reference Defersha, Kekeba and Kaliyaperumal2021; Panchala et al. Reference Panchala, S Sasank, Harshitha Adidela, Yellamma, Ashesh and Prasad2022; Jahan et al. Reference Jahan, Dutta, Hassan Khan, Shahariar Karim Badhon and Rab2022). However, recent research has shifted towards deep learning models for their ability to detect finer nuances in language. These include architectures such as convolutional neural networks (CNN) (Roy et al. Reference Roy, Tripathy, Das and Gao2020; Shukla, Nagpal, and Sabharwal Reference Shukla, Nagpal and Sabharwal2022), long short-term memory (LSTM) (Syam, Irawan, and Setianingsih Reference Syam, Irawan and Setianingsih2019; Roy et al. Reference Roy, Tripathy, Das and Gao2020; Dinh et al. Reference Dinh, Vo, Nguyen and Do2023), and transformer models, with BERT being the most widely adopted (Plaza-Del-Arco et al. Reference Plaza-Del-Arco, Molina-Gonzalez, Urena-Lopez and Martin-Valdivia2021; Carhuancho-Bazan, Nuñez-Lazo, and Ugarte Reference Carhuancho-Bazan, Nuñez-Lazo and Ugarte2023; Turjya et al. Reference Turjya, Kumari, Swain and Bandyopadhyay2023). Deep learning models have been shown to outperform traditional approaches (Roy et al. Reference Roy, Tripathy, Das and Gao2020; Carhuancho-Bazan, Nuñez-Lazo, and Ugarte Reference Carhuancho-Bazan, Nuñez-Lazo and Ugarte2023).
Despite these advancements, a significant challenge remains in identifying implicit hate speech, where abusive intent is conveyed through irony, sarcasm, or stereotypes without the use of explicit offensive terms. This complexity arises from the creative and cognitive aspects of language, as explored by Frenda et al. (Reference Frenda, Patti and Rosso2023), who highlight how implicitness complicates the detection of abusive content online. To address this, recent research has explored the synergy between different architectures; for instance, Damo et al. (Reference Damo, Ocampo, Cabrio and Villata2026) propose integrating large language models (LLMs) with traditional detectors to not only improve identification but also generate faithful and plausible explanations for why a message is considered implicitly hateful.
The datasets used for training are static, meaning they do not change during the training process. Many studies utilise pre-existing datasets from Kaggle (Roy et al. Reference Roy, Tripathy, Das and Gao2020; Panchala et al. Reference Panchala, S Sasank, Harshitha Adidela, Yellamma, Ashesh and Prasad2022) or other research sources (Martins et al. Reference Martins, Gomes, Almeida, Novais and Henriques2018; Plaza-Del-Arco et al. Reference Plaza-Del-Arco, Molina-Gonzalez, Urena-Lopez and Martin-Valdivia2021; Pawar et al. Reference Pawar, Gawali, Gite, Jawale and William2022; Shrimali, Reference Shrimali2022). When a dataset with specific attributes is required, data are collected via official APIs from various platforms, using keywords and/or news sources (Briliani, Irawan, and Setianingsih Reference Briliani, Irawan and Setianingsih2019; Alotaibi and Abul Hasanat Reference Alotaibi and Abul Hasanat2020; Febriana and Budiarto Reference Febriana and Budiarto2019; Jahan et al. Reference Jahan, Dutta, Hassan Khan, Shahariar Karim Badhon and Rab2022). Twitter is the most frequently used platform (Syam, Irawan, and Setianingsih Reference Syam, Irawan and Setianingsih2019; Roy et al. Reference Roy, Tripathy, Das and Gao2020; Shukla, Nagpal, and Sabharwal Reference Shukla, Nagpal and Sabharwal2022; Turjya et al. Reference Turjya, Kumari, Swain and Bandyopadhyay2023; Alotaibi and Abul Hasanat Reference Alotaibi and Abul Hasanat2020; Febriana and Budiarto Reference Febriana and Budiarto2019; Plaza-Del-Arco et al. Reference Plaza-Del-Arco, Molina-Gonzalez, Urena-Lopez and Martin-Valdivia2021; Sachdeva et al. Reference Sachdeva, Chaudhary, Madaan and Meel2021; Panchala et al. Reference Panchala, S Sasank, Harshitha Adidela, Yellamma, Ashesh and Prasad2022; Pawar et al. Reference Pawar, Gawali, Gite, Jawale and William2022; Shrimali, Reference Shrimali2022), though other platforms such as Facebook (Defersha, Kekeba, and Kaliyaperumal Reference Defersha, Kekeba and Kaliyaperumal2021; Jahan et al. Reference Jahan, Dutta, Hassan Khan, Shahariar Karim Badhon and Rab2022), YouTube (Shukla, Nagpal, and Sabharwal Reference Shukla, Nagpal and Sabharwal2022; Jahan et al. Reference Jahan, Dutta, Hassan Khan, Shahariar Karim Badhon and Rab2022), Discord (Singh, Malhotra, and S. Reference Singh, Malhotra and Savaridassan2023a), Wikipedia (Shrimali, Reference Shrimali2022), and Instagram (Briliani, Irawan, and Setianingsih Reference Briliani, Irawan and Setianingsih2019) have also been studied. These texts are typically manually labelled, often through crowdsourcing. Dataset sizes vary, ranging from thousands (Briliani, Irawan, and Setianingsih Reference Briliani, Irawan and Setianingsih2019; Plaza-Del-Arco et al. Reference Plaza-Del-Arco, Molina-Gonzalez, Urena-Lopez and Martin-Valdivia2021; Jahan et al. Reference Jahan, Dutta, Hassan Khan, Shahariar Karim Badhon and Rab2022; Shukla, Nagpal, and Sabharwal Reference Shukla, Nagpal and Sabharwal2022; Turjya et al. Reference Turjya, Kumari, Swain and Bandyopadhyay2023), to tens of thousands (Roy et al. Reference Roy, Tripathy, Das and Gao2020; Defersha, Kekeba, and Kaliyaperumal Reference Defersha, Kekeba and Kaliyaperumal2021; Bhimani et al. Reference Bhimani, Bheda, Dharamshi, Nikumbh and Abhyankar2021; Pawar et al. Reference Pawar, Gawali, Gite, Jawale and William2022; Panchala et al. Reference Panchala, S Sasank, Harshitha Adidela, Yellamma, Ashesh and Prasad2022), and even hundreds of thousands (Singh, Malhotra, and S. Reference Singh, Malhotra and Savaridassan2023a). These manually labelled datasets tend to be imbalanced, as significantly more neutral messages are extracted from networks compared to hate messages.
Some models rely solely on the message text for predictions, minimising the need for manual feature extraction. However, other models explore the benefits of incorporating additional features, such as the relative importance of words derived from the TF-IDF method (Martins et al. Reference Martins, Gomes, Almeida, Novais and Henriques2018; Briliani, Irawan, and Setianingsih Reference Briliani, Irawan and Setianingsih2019; Roy et al. Reference Roy, Tripathy, Das and Gao2020; Defersha, Kekeba, and Kaliyaperumal Reference Defersha, Kekeba and Kaliyaperumal2021; Qureshi and Sabih Reference Qureshi and Sabih2021; Jahan et al. Reference Jahan, Dutta, Hassan Khan, Shahariar Karim Badhon and Rab2022; Singh et al. Reference Singh, Sanjay, Pramod Jain, Rishi and Bhardwaj2023b), linguistic features (e.g., uppercase ratio, message length, and offensive word count) (Qureshi and Sabih Reference Qureshi and Sabih2021; del Valle-Cano et al. Reference Valle-Cano, Quijano-Sánchez, Liberatore and Gómez2023), sentiment analysis (Martins et al. Reference Martins, Gomes, Almeida, Novais and Henriques2018; Plaza-Del-Arco et al. Reference Plaza-Del-Arco, Molina-Gonzalez, Urena-Lopez and Martin-Valdivia2021; Qureshi and Sabih Reference Qureshi and Sabih2021; Bhimani et al. Reference Bhimani, Bheda, Dharamshi, Nikumbh and Abhyankar2021), and emotional categories (e.g. anger, fear, sadness, joy) (Martins et al. Reference Martins, Gomes, Almeida, Novais and Henriques2018; Plaza-Del-Arco et al. Reference Plaza-Del-Arco, Molina-Gonzalez, Urena-Lopez and Martin-Valdivia2021). Additional parameters include user profile details (e.g., number of followers) (Herodotou, Chatzakou, and Kourtellis Reference Herodotou, Chatzakou and Kourtellis2021; del Valle-Cano et al. Reference Valle-Cano, Quijano-Sánchez, Liberatore and Gómez2023) and social network graph centrality measures (del Valle-Cano et al. Reference Valle-Cano, Quijano-Sánchez, Liberatore and Gómez2023). Emerging models also consider visual content instead of text (Singh, Malhotra, and S. Reference Singh, Malhotra and Savaridassan2023a; M and P, 2023).
Most models are designed for English, but there are also models developed for other languages, such as Arabic (Alotaibi and Abul Hasanat Reference Alotaibi and Abul Hasanat2020), Indonesian (Febriana and Budiarto Reference Febriana and Budiarto2019; Briliani, Irawan, and Setianingsih Reference Briliani, Irawan and Setianingsih2019; Nayla, Setianingsih, and Dirgantoro Reference Nayla, Setianingsih and Dirgantoro2023), Bengali (Jahan et al. Reference Jahan, Dutta, Hassan Khan, Shahariar Karim Badhon and Rab2022), Hindi (Shukla, Nagpal, and Sabharwal Reference Shukla, Nagpal and Sabharwal2022), German (Turjya et al. Reference Turjya, Kumari, Swain and Bandyopadhyay2023), and Spanish (Pereira-Kohatsu et al. Reference Pereira-Kohatsu, Quijano-Sánchez, Liberatore and Camacho-Collados2019; Plaza-Del-Arco et al. Reference Plaza-Del-Arco, Molina-Gonzalez, Urena-Lopez and Martin-Valdivia2021; Turjya et al. Reference Turjya, Kumari, Swain and Bandyopadhyay2023; del Valle-Cano et al. Reference Valle-Cano, Quijano-Sánchez, Liberatore and Gómez2023). For Spanish, the most prominent models are HaterBERT and SocialHaterBERT (del Valle-Cano et al. Reference Valle-Cano, Quijano-Sánchez, Liberatore and Gómez2023), achieving macro-F1 scores of 0.9754 and 0.9233, respectively. These models are currently employed by the government agencies OBERAXE and ONDOD to monitor and address hate speech on Twitter.
2.1.2 Real-time monitoring
In terms of real-time monitoring, there are fewer studies compared to those focused on hate speech classification (see Table 2 for an overview). Among the existing works, most develop custom text classification models, which are then integrated into real-time data processing modules. Some research goes further by creating a comprehensive pipeline that periodically extracts data from social networks, classifies it by hate speech type, and visualises the results through statistics, such as the proportion of hate speech and the most frequently used terms (Pereira-Kohatsu et al. Reference Pereira-Kohatsu, Quijano-Sánchez, Liberatore and Camacho-Collados2019; Doan et al. Reference Doan, Nguyen, Phan and Do2022; Dinh et al. Reference Dinh, Vo, Nguyen and Do2023). In other cases, the objective is not to visualise statistics but to provide instant alerts during hate speech incidents. For instance, Carhuancho-Bazan et al. (Reference Carhuancho-Bazan, Nuñez-Lazo and Ugarte2023) developed an API for Discord that allows moderators to monitor their channels. Additionally, some studies focus solely on assessing the scalability of processing modules, with the intention of connecting them to a continuous data flow in the future (Herodotou, Chatzakou, and Kourtellis Reference Herodotou, Chatzakou and Kourtellis2021; Shrimali, Reference Shrimali2022; Gupta et al. Reference Gupta, Kadian, Jain, Dwivedi and Sharma2023). These studies typically use existing datasets and simulate a continuous data stream rather than extracting new data (Herodotou, Chatzakou, and Kourtellis Reference Herodotou, Chatzakou and Kourtellis2021; Shrimali, Reference Shrimali2022).
Overview of real-time monitoring studies

A variety of platforms have been studied in this field, including Twitter (Pereira-Kohatsu et al. Reference Pereira-Kohatsu, Quijano-Sánchez, Liberatore and Camacho-Collados2019; Caldera, Meedin, and Perera Reference Caldera, Meedin and Perera2020b; Herodotou, Chatzakou, and Kourtellis Reference Herodotou, Chatzakou and Kourtellis2021), Discord (Carhuancho-Bazan, Nuñez-Lazo, and Ugarte Reference Carhuancho-Bazan, Nuñez-Lazo and Ugarte2023), YouTube (Doan et al. Reference Doan, Nguyen, Phan and Do2022), Facebook (Dinh et al. Reference Dinh, Vo, Nguyen and Do2023), and Twitch (Gupta et al. Reference Gupta, Kadian, Jain, Dwivedi and Sharma2023). Although English was expected to be the dominant language in these studies, it is noteworthy that five of the eight studies focus on other languages: Spanish (Pereira-Kohatsu et al. Reference Pereira-Kohatsu, Quijano-Sánchez, Liberatore and Camacho-Collados2019; Gupta et al. Reference Gupta, Kadian, Jain, Dwivedi and Sharma2023), Vietnamese (Doan et al. Reference Doan, Nguyen, Phan and Do2022; Dinh et al. Reference Dinh, Vo, Nguyen and Do2023), and Sinhalese (Sri Lanka) (Caldera, Meedin, and Perera Reference Caldera, Meedin and Perera2020b).
2.2 User profiling studies
User profiling in the context of social networks involves analysing user characteristics, behaviours, and preferences to create representative profiles for large user groups. Its applications are wide ranging: in marketing, it is used to segment audiences and provide personalised product or service recommendations through recommendation systems (Lee et al. Reference Lee, Oh, Lim and Choi2014; Stakhiyevich and Huang Reference Stakhiyevich and Huang2019). Beyond commercial purposes, user profiling is critical in cybersecurity for identifying malicious actors (Treves, Masud, and Faloutsos Reference Treves, Masud and Faloutsos2022), in combating disinformation by characterising bots (Heidari, Jones, and Uzuner Reference Heidari, Jones and Uzuner2020), and in addressing online hate speech by profiling those who spread hate (Rangel et al. Reference Rangel, De La Peña Sarracén, Chulvi, Fersini and Rosso2021; Noorian et al. Reference Noorian, Ghenai, Moradisani, Zarrinkalam and Alavijeh2024; Mishra et al. Reference Mishra, Tredici, Yannakoudakis and Shutova2019; Pereira-Kohatsu et al. Reference Pereira-Kohatsu, Quijano-Sánchez, Liberatore and Camacho-Collados2019; An et al. Reference An, Kwak, Lee, Jun and Ahn2021; Chandra et al. Reference Chandra, Reddy, Sehgal, Gupta, Buduru and Kumaraguru2021; He et al. Reference He, Ziems, Soni, Ramakrishnan, Yang and Kumar2022). Due to the limited research on this last topic, the literature review has been expanded to include general user profiling studies. This section first reviews user profiling research broadly and then examines how individuals spreading hate speech are classified and characterised in the literature.
The primary focus of research in user profiling typically assumes that individuals consistently belong to a single class, although some studies examine class transitions over time (He et al. Reference He, Ziems, Soni, Ramakrishnan, Yang and Kumar2022), even when the class definitions vary (Vasanthakumar, Shashikumar, and Suresh Reference Vasanthakumar, Shashikumar and Suresh2019). User classes are commonly defined based on attributes such as age (Pandey and Mittal Reference Pandey and Mittal2016; Nguyen et al. Reference Nguyen, Gravel, Trieschnigg and Meder2021), ethnicity (Rao et al. Reference Rao, Paul, Fink, Yarowsky, Oates and Coppersmith2021), gender (Burger et al. Reference Burger, Henderson, Kim and Zarrella2011; Pandey and Mittal Reference Pandey and Mittal2016; Priadana, Maarif, and Habibi Reference Priadana, Maarif and Habibi2020; Liu, Li, and Li Reference Liu, Li and Li2021; Rao et al. Reference Rao, Paul, Fink, Yarowsky, Oates and Coppersmith2021), geographic location (Alonso-Lorenzo, Costa-Montenegro, and Fernández-Gavilanes Reference Alonso-Lorenzo, Costa-Montenegro and Fernandez-Gavilanes2016; Williams, Gray and Dixon Reference Williams, Gray and Dixon2017; Utomo, Adji, and Ardiyanto Reference Utomo, Adji and Ardiyanto2018), personality (Golbeck, Robles, and Turner Reference Golbeck, Robles and Turner2011; Skowron et al. Reference Skowron, Tkalcic, Ferwerda and Schedl2016), marital status (Pandey and Mittal Reference Pandey and Mittal2016), and anonymity level (Peddinti, Ross, and Cappos Reference Peddinti, Ross and Cappos2014; Nakano et al. Reference Nakano, Suda, Okaie and Moore2016). For instance, Nguyen et al. (Reference Nguyen, Gravel, Trieschnigg and Meder2021) categorise users into age groups (under 20, 20–40, and over 40), while Peddinti et al. (Reference Peddinti, Ross and Cappos2014) classify users by anonymity levels (anonymous, partially anonymous, identifiable, or highly identifiable). Typically, the first step involves defining user classes and providing clear descriptions of each. These descriptions are then used by those responsible for assigning users to a class, often through manual methods such as crowdsourcing (Burger et al. Reference Burger, Henderson, Kim and Zarrella2011; Peddinti, Ross, and Cappos Reference Peddinti, Ross and Cappos2014), though researchers themselves (Nguyen et al. Reference Nguyen, Gravel, Trieschnigg and Meder2021; Rangel et al. Reference Rangel, De La Peña Sarracén, Chulvi, Fersini and Rosso2021; He et al. Reference He, Ziems, Soni, Ramakrishnan, Yang and Kumar2022) or even users (Golbeck, Robles, and Turner Reference Golbeck, Robles and Turner2011; Skowron et al. Reference Skowron, Tkalcic, Ferwerda and Schedl2016) sometimes carry out this task. Some studies also aim to automate the classification process, defining user classes based on profile attributes and publications (Rao et al. Reference Rao, Paul, Fink, Yarowsky, Oates and Coppersmith2021). After classifying users, several studies aim to statistically describe each class or identify correlations between classes and other user characteristics (Nakano et al. Reference Nakano, Suda, Okaie and Moore2016; Rao et al. Reference Rao, Paul, Fink, Yarowsky, Oates and Coppersmith2021; He et al. Reference He, Ziems, Soni, Ramakrishnan, Yang and Kumar2022).
Most studies focus on a single platform, such as Twitter or Facebook, though some research explores linking accounts across multiple social networks to complement the partial data from individual platforms (Kaushal, Ghose, and Kumaraguru Reference Kaushal, Ghose and Kumaraguru2019; Treves, Masud, and Faloutsos Reference Treves, Masud and Faloutsos2022). Data are usually collected via official APIs (Chandra et al. Reference Chandra, Reddy, Sehgal, Gupta, Buduru and Kumaraguru2021; He et al. Reference He, Ziems, Soni, Ramakrishnan, Yang and Kumar2022) or from existing datasets (Liu, Li, and Li Reference Liu, Li and Li2021; Noorian et al. Reference Noorian, Ghenai, Moradisani, Zarrinkalam and Alavijeh2024). Using this data and manually labelled corpora, machine learning models are trained to classify users (Burger et al. Reference Burger, Henderson, Kim and Zarrella2011; Golbeck, Robles, and Turner Reference Golbeck, Robles and Turner2011; Pandey and Mittal Reference Pandey and Mittal2016; Alonso-Lorenzo, Costa-Montenegro, and Fernández-Gavilanes Reference Alonso-Lorenzo, Costa-Montenegro and Fernandez-Gavilanes2016; Skowron et al. Reference Skowron, Tkalcic, Ferwerda and Schedl2016; Williams, Gray and Dixon Reference Williams, Gray and Dixon2017; Nguyen et al. Reference Nguyen, Gravel, Trieschnigg and Meder2021; Liu, Li, and Li Reference Liu, Li and Li2021; Rao et al. Reference Rao, Paul, Fink, Yarowsky, Oates and Coppersmith2021). The input data often consists of textual features from users’ posts, such as the average use of capital letters, post length, and offensive word frequency, particularly in tweets (Burger et al. Reference Burger, Henderson, Kim and Zarrella2011; Peddinti, Ross, and Cappos Reference Peddinti, Ross and Cappos2014; Nguyen et al. Reference Nguyen, Gravel, Trieschnigg and Meder2021). In essence, these classification models primarily rely on analysing user posts. For Twitter, users’ timelinesFootnote c are accessed to extract frequently occurring textual features, and NLP techniques such as Named Entity Recognition (NER) and Sentiment Analysis are applied. Additional features such as sociolinguistic markers (emoticons, repeated letters, etc.), profile data (Skowron et al. Reference Skowron, Tkalcic, Ferwerda and Schedl2016; Alonso-Lorenzo, Costa-Montenegro, and Fernández-Gavilanes Reference Alonso-Lorenzo, Costa-Montenegro and Fernandez-Gavilanes2016; Williams, Gray and Dixon Reference Williams, Gray and Dixon2017; Liu, Li, and Li, Reference Liu, Li and Li2021; Rao et al. Reference Rao, Paul, Fink, Yarowsky, Oates and Coppersmith2021), and social environment characteristics (Golbeck, Robles, and Turner, Reference Golbeck, Robles and Turner2011; Alonso-Lorenzo, Costa-Montenegro, and Fernández-Gavilanes Reference Alonso-Lorenzo, Costa-Montenegro and Fernandez-Gavilanes2016; Williams, Gray and Dixon Reference Williams, Gray and Dixon2017) are also considered. Table 3 lists the most representative studies based on these characteristics.Footnote d
Summary of works focused on user profiling based on different attributes

Another example is personality profiling (Golbeck, Robles, and Turner Reference Golbeck, Robles and Turner2011; Skowron et al. Reference Skowron, Tkalcic, Ferwerda and Schedl2016), where the Big Five model is used due to its widespread recognition in psychology, though it might be more appropriate to carefully select personality groups that are more relevant on Twitter. A major limitation in user profiling studies is that user classification is often arbitrary. The categories used to classify users are typically based on assumptions rather than a rigorous scientific process. For instance, when segmenting users by age, researchers often create more categories for younger users, assuming most Twitter users are young. However, an alternative approach could assign equal numbers of classes across all age groups. Even when more categories are defined for younger users, there is no consensus on the exact ranges. For example, Pandey and Mittal (Reference Pandey and Mittal2016) define age groups as under 20, 20–40, and over 40, while Nguyen et al. (Reference Nguyen, Gravel, Trieschnigg and Meder2021) use 16–20, 21–25, 26–30, and over 30. Similarly, studies on gender (Burger et al. Reference Burger, Henderson, Kim and Zarrella2011; Peddinti, Ross, and Cappos Reference Peddinti, Ross and Cappos2014; Liu, Li, and Li Reference Liu, Li and Li2021; Rao et al. Reference Rao, Paul, Fink, Yarowsky, Oates and Coppersmith2021) typically classify users as male or female, even though this may not accurately represent the significant percentage of Twitter users who do not identify with either gender. In personality profiling studies (Golbeck, Robles, and Turner Reference Golbeck, Robles and Turner2011; Skowron et al. Reference Skowron, Tkalcic, Ferwerda and Schedl2016), the Big Five model is commonly used due to its recognition in psychology, though a more tailored selection of personality traits might be more relevant for Twitter users.
2.2.1 User profiling studies in the context of hate speech
In the field of online hate speech, there are relatively few user profiling studies (Rangel et al. Reference Rangel, De La Peña Sarracén, Chulvi, Fersini and Rosso2021; Noorian et al. Reference Noorian, Ghenai, Moradisani, Zarrinkalam and Alavijeh2024; Mishra et al. Reference Mishra, Tredici, Yannakoudakis and Shutova2019; Pereira-Kohatsu et al. Reference Pereira-Kohatsu, Quijano-Sánchez, Liberatore and Camacho-Collados2019; An et al. Reference An, Kwak, Lee, Jun and Ahn2021; Chandra et al. Reference Chandra, Reddy, Sehgal, Gupta, Buduru and Kumaraguru2021; He et al. Reference He, Ziems, Soni, Ramakrishnan, Yang and Kumar2022; Doğanç and Markov Reference Doğanç and Markov2023). Some of these studies address hate speech broadly, defining it as discriminatory behaviour targeting individuals or groups based on characteristics such as gender, religion, sexual orientation, nationality, or ethnicity (Pereira-Kohatsu et al. Reference Pereira-Kohatsu, Quijano-Sánchez, Liberatore and Camacho-Collados2019; Rangel et al. Reference Rangel, De La Peña Sarracén, Chulvi, Fersini and Rosso2021). Others focus on specific types of hate, including anti-Asian hate (An et al. Reference An, Kwak, Lee, Jun and Ahn2021; He et al. Reference He, Ziems, Soni, Ramakrishnan, Yang and Kumar2022; Noorian et al. Reference Noorian, Ghenai, Moradisani, Zarrinkalam and Alavijeh2024), Islamophobia (Chandra et al. Reference Chandra, Reddy, Sehgal, Gupta, Buduru and Kumaraguru2021), sexism (Mishra et al. Reference Mishra, Tredici, Yannakoudakis and Shutova2019), and racism (Mishra et al. Reference Mishra, Tredici, Yannakoudakis and Shutova2019). Similar to general profiling research, some rely on existing datasets (An et al. Reference An, Kwak, Lee, Jun and Ahn2021; Noorian et al. Reference Noorian, Ghenai, Moradisani, Zarrinkalam and Alavijeh2024; Mishra et al. Reference Mishra, Tredici, Yannakoudakis and Shutova2019), while others create their own (Chandra et al. Reference Chandra, Reddy, Sehgal, Gupta, Buduru and Kumaraguru2021; He et al. Reference He, Ziems, Soni, Ramakrishnan, Yang and Kumar2022). A key difference in this context is that user labelling is automated rather than manual. These studies assume that user classes are predefined based on the proportion of hate speech in their tweets. For instance, if 90% of a user&’s tweets are classified as hateful, these studies assume that manual labelling is not required. Instead, they adopt a rule-based approach, where users are automatically categorised based on the proportion of hateful content in their posts. A common rule is to label users with more than 50% hateful tweets as “haters” and those with 50% or fewer as “non-haters.” After tweets are classified using an NLP model, a program can assign users to categories. Most studies use NLP models for classification (An et al. Reference An, Kwak, Lee, Jun and Ahn2021 ; Mishra et al. Reference Mishra, Tredici, Yannakoudakis and Shutova2019; He et al. Reference He, Ziems, Soni, Ramakrishnan, Yang and Kumar2022), while some rely on hate-related keywords (Noorian et al. Reference Noorian, Ghenai, Moradisani, Zarrinkalam and Alavijeh2024), and a few use manual classification (Rangel et al. Reference Rangel, De La Peña Sarracén, Chulvi, Fersini and Rosso2021).
In this context, users are often categorised as either haters or non-haters (Rangel et al. Reference Rangel, De La Peña Sarracén, Chulvi, Fersini and Rosso2021; He et al. Reference He, Ziems, Soni, Ramakrishnan, Yang and Kumar2022; Noorian et al. Reference Noorian, Ghenai, Moradisani, Zarrinkalam and Alavijeh2024; Mishra et al. Reference Mishra, Tredici, Yannakoudakis and Shutova2019; An et al. Reference An, Kwak, Lee, Jun and Ahn2021). However, this binary classification is based on the unfounded assumption that all users fit into one of these two groups, reflecting the issue of arbitrariness mentioned in the previous section. It is possible that other classifications could exist, such as distinguishing between mild haters and extreme haters, or between haters and upstanders. Moreover, despite various studies employing similar hypotheses, there is no consensus on a precise definition of a “hater.” For instance:
-
• He et al. (Reference He, Ziems, Soni, Ramakrishnan, Yang and Kumar2022) and Noorian et al. (Reference Noorian, Ghenai, Moradisani, Zarrinkalam and Alavijeh2024) define haters as those who have posted at least one hate tweet and no upstander tweets.
-
• Rangel et al. (Reference Rangel, De La Peña Sarracén, Chulvi, Fersini and Rosso2021) define haters as users with more than 10 hate tweets.
-
• Mishra et al. (Reference Mishra, Tredici, Yannakoudakis and Shutova2019) define haters as those who have posted more than one hate tweet.
-
• An et al. (Reference An, Kwak, Lee, Jun and Ahn2021) define haters as those who have posted more than two hate tweets.
Additionally, some studies classify users based on characteristics such as age, gender, and origin, rather than by the volume of hate speech they produce, aiming to create personalised counter-narrative messages (Doğanç and Markov Reference Doğanç and Markov2023).
After categorising users as either haters or non-haters, the latter group is often used as a “control” group to examine the differences and similarities between the two. Various analyses are conducted based on their timelines: linguistic analyses, such as identifying the most representative words for each group (An et al. Reference An, Kwak, Lee, Jun and Ahn2021; Chandra et al. Reference Chandra, Reddy, Sehgal, Gupta, Buduru and Kumaraguru2021; Noorian et al. Reference Noorian, Ghenai, Moradisani, Zarrinkalam and Alavijeh2024); psychological analyses, such as personality profiling (Noorian et al. Reference Noorian, Ghenai, Moradisani, Zarrinkalam and Alavijeh2024); and social analyses, such as comparing how each group&’s tweets are received (An et al. Reference An, Kwak, Lee, Jun and Ahn2021).
Most studies reviewed subsequently develop predictive models aimed at identifying individuals who propagate online hate speech. These models typically use textual features extracted from users’ timelines as input (Rangel et al. Reference Rangel, De La Peña Sarracén, Chulvi, Fersini and Rosso2021; Noorian et al. Reference Noorian, Ghenai, Moradisani, Zarrinkalam and Alavijeh2024; Mishra et al. Reference Mishra, Tredici, Yannakoudakis and Shutova2019; An et al. Reference An, Kwak, Lee, Jun and Ahn2021), allowing for the evaluation of the effectiveness of these features based on predictive performance (An et al. Reference An, Kwak, Lee, Jun and Ahn2021; Noorian et al. Reference Noorian, Ghenai, Moradisani, Zarrinkalam and Alavijeh2024). Additionally, some models are trained to assess whether incorporating user profiling improves the performance of hate speech classifiers (Mishra et al. Reference Mishra, Tredici, Yannakoudakis and Shutova2019). Table 4 offers a detailed comparison of the six most relevant studies on user profiling in the context of hate.Footnote e
Overview of studies focused on user profiling in the context of hate speech

2.3 User graph studies
Representing user relationships through graphs is a powerful technique for uncovering complex patterns within thematic groups (Wang et al. Reference Wang, Liu, Huang and Feng2016; Ahmed, Aurpa, and Anwar Reference Ahmed, Aurpa and Anwar2020), often outperforming traditional methods in some cases (Bozhidarova et al. Reference Bozhidarova, Chang, Ale-Rasool, Liu, Ma, Bertozzi, Brantingham, Lin and Krishnagopal2023). In hate speech research, graphs are crucial in two key areas: hate tweet classification and the identification of influential individuals and groups.
In hate tweet classification, graph centrality measures are frequently used as input for classifiers (Beatty, Reference Beatty2020; Mishra et al. Reference Mishra, Tredici, Yannakoudakis and Shutova2019; del Valle-Cano et al. Reference Valle-Cano, Quijano-Sánchez, Liberatore and Gómez2023). However, there has been a growing trend toward utilising neural models designed for graph-structured data, known as graph neural networks (GNNs) (Hebert, Golab, and Cohen Reference Hebert, Golab and Cohen2022; Duong, Zhang, and Lu Reference Duong, Zhang and Lu2022; Harby and Zulkernine Reference Harby and Zulkernine2023). While these studies generally find that representing social networks as graphs does not outperform the most advanced NLP techniques, it remains useful for classification purposes.
In the second area, studies such as Pereira-Kohatsu et al. (Reference Pereira-Kohatsu, Quijano-Sánchez, Liberatore and Camacho-Collados2019), Perera et al. (Reference Perera, Perera and Ahangama2023), and Oroh et al. (Reference Oroh, Bandung and Zagi2021) focus on detecting influential haters, whereas others, such as Ting et al. (Reference Ting, Wang, Chi and Wu2013), define user clusters and characterise them based on their hater status by analysing the most frequent words and interconnections within the clusters. Additionally, Chandra et al. (Reference Chandra, Reddy, Sehgal, Gupta, Buduru and Kumaraguru2021) create a connection graph to analyse interactions between different user groups, revealing that highly hateful users tend to be closely interconnected.
Overview of user graph studies

In the reviewed studies (see Table 5 for an overview), nodes and edges are used to represent various elements within graphs:
-
• Nodes typically represent users, though some studies classify them (Pereira-Kohatsu et al. Reference Pereira-Kohatsu, Quijano-Sánchez, Liberatore and Camacho-Collados2019; Chandra et al. Reference Chandra, Reddy, Sehgal, Gupta, Buduru and Kumaraguru2021), while others do not (Mishra et al. Reference Mishra, Tredici, Yannakoudakis and Shutova2019; Beatty, Reference Beatty2020; Caldera, Meedin, and Perera Reference Caldera, Meedin and Perera2020a; Oroh, Bandung, and Zagi Reference Oroh, Bandung and Zagi2021; Bozhidarova et al. Reference Bozhidarova, Chang, Ale-Rasool, Liu, Ma, Bertozzi, Brantingham, Lin and Krishnagopal2023). In some cases, posts (Caldera, Meedin, and Perera Reference Caldera, Meedin and Perera2020a) and topics (Bozhidarova et al. Reference Bozhidarova, Chang, Ale-Rasool, Liu, Ma, Bertozzi, Brantingham, Lin and Krishnagopal2023) are also represented as nodes. For studies that classify users, profiling techniques (see Section 2.2) are used to group users based on the amount of hate they produce. For example, Pereira-Kohatsu et al. (Reference Pereira-Kohatsu, Quijano-Sánchez, Liberatore and Camacho-Collados2019) divide users into red nodes (haters) and blue nodes (hate recipients), while Chandra et al. (Reference Chandra, Reddy, Sehgal, Gupta, Buduru and Kumaraguru2021) categorise them into red nodes (highly hateful users), yellow nodes (moderately hateful), and green nodes (low hateful users). Most studies include isolated users, though there are exceptions (Mishra et al. Reference Mishra, Tredici, Yannakoudakis and Shutova2019).
-
• Edges represent relationships between users, which are defined in various ways. A user can be connected to another by following them (Mishra et al. Reference Mishra, Tredici, Yannakoudakis and Shutova2019; Chandra et al. Reference Chandra, Reddy, Sehgal, Gupta, Buduru and Kumaraguru2021), mentioning them (Pereira-Kohatsu et al. Reference Pereira-Kohatsu, Quijano-Sánchez, Liberatore and Camacho-Collados2019), interacting with them (e.g., liking, commenting, and retweeting) (Bozhidarova et al. Reference Bozhidarova, Chang, Ale-Rasool, Liu, Ma, Bertozzi, Brantingham, Lin and Krishnagopal2023), or through more complex relationships (Ting et al. Reference Ting, Wang, Chi and Wu2013; Caldera, Meedin, and Perera Reference Caldera, Meedin and Perera2020a). Edges can be directional (Pereira-Kohatsu et al. Reference Pereira-Kohatsu, Quijano-Sánchez, Liberatore and Camacho-Collados2019; Caldera, Meedin, and Perera Reference Caldera, Meedin and Perera2020a; Chandra et al. Reference Chandra, Reddy, Sehgal, Gupta, Buduru and Kumaraguru2021) or bidirectional (Mishra et al. Reference Mishra, Tredici, Yannakoudakis and Shutova2019; Oroh, Bandung, and Zagi Reference Oroh, Bandung and Zagi2021). The commonality across all studies is that edges are unweighted.
While most graph-based studies focus on Twitter, others examine platforms such as Facebook (Ting et al. Reference Ting, Wang, Chi and Wu2013; Caldera, Meedin, and Perera Reference Caldera, Meedin and Perera2020a), YouTube (Caldera, Meedin, and Perera Reference Caldera, Meedin and Perera2020a), and Reddit (Hebert, Golab, and Cohen Reference Hebert, Golab and Cohen2022).
2.4 Limitations and research gaps
After an exhaustive review of hate analysis on social media, it has become evident that while hate message classification and real-time monitoring have been thoroughly investigated, user profiling and graph-based representations of social networks remain underexplored areas of research.
In terms of user profiling, our first goal is to move away from arbitrary classifications and instead develop a partitioning of users based on objective, scientifically grounded methods. We aim to establish more complex classification criteria that account for multiple variables, rather than relying on a single factor, such as the number of hate tweets, to provide a more accurate definition of a “hater” user. This raises the question of whether users can indeed be categorised into haters and non-haters, as many studies have suggested (see Table 1).
Second, we inquire whether a user can be automatically classified based solely on profile data, without including linguistic traits or other characteristics derived from their timelines. This contrasts with the approach taken by most existing profiling studies (see Table 4). This question is particularly pertinent following Twitter&’s restriction of API access in February 2023, which now requires a monthly fee to download tweets (Calma, Reference Calma2023). However, profile information (e.g., username, follower count, and account age) remains easily accessible. To address these gaps, we propose research questions RQ1, RQ2, and RQ3. Similar to other profiling studies (Nakano et al. Reference Nakano, Suda, Okaie and Moore2016; Rao et al. Reference Rao, Paul, Fink, Yarowsky, Oates and Coppersmith2021; He et al. Reference He, Ziems, Soni, Ramakrishnan, Yang and Kumar2022), the resulting user classification will be used to understand behavioural patterns and differences in online activity, leading to research question RQ4.
Regarding graph-based representations, existing studies have not found edges that represent more meaningful connections between users beyond superficial relationships like follows or mentions (see Table 5).These relationships are considered superficial because they are “digital” and do not necessarily reflect significant real-world interactions. The study with the most “real” connections (Pereira-Kohatsu et al. Reference Pereira-Kohatsu, Quijano-Sánchez, Liberatore and Camacho-Collados2019) interprets mentions not just as digital links but as oppositional interactions between users. Specifically, it assumes that if one user mentions another in a hate tweet, it reflects either an insult or a connection to disliked topics. However, we challenge this assumption, as we suspect that many users who mention each other do so in agreement, reinforcing one another&’s views. To test this theory and expand the concept of online connections to include more genuine, human interactions, we propose a new definition of user interaction based on whether they support or oppose each other&’s ideologies. This leads to our final research question RQ5.
3. Materials and methods
In this section, we describe the proposed procedures to address the identified research gaps in the literature and to answer the posed research questions.
3.1 User profiling
This section presents a methodology for profiling and modelling users in the context of social networks. Although it is initially designed to characterise users based on the proportion of hate tweets they write, it goes beyond this initial objective as it can be adapted to other social platforms. The methodology consists of four steps motivated by the RQs: clustering, feature extraction, classifier training, and extrapolation of insights.
To answer RQ1, we propose using cluster analysis methods as scientific and objective procedures for user segmentation. To address RQ2 and discover the underlying number of groups, a study must be conducted to determine which input data to use and which specific clustering algorithm is most optimal. These input data should align with the particular study domain to effectively segment users. In our case, the data should pertain to the domain of hate on Twitter. Additionally, the choice of clustering algorithm must be carefully considered, especially in terms of the data, to optimise both the accuracy and interpretability of the results. The next step in the methodology is user characterisation. This involves modelling users through a classifier that takes profile features as input. By evaluating the most relevant features of the classifier and understanding how each feature helps distinguish each cluster, we address RQ3. At this stage, the final step in the user profiling methodology is to extrapolate insights that allow us to understand user behaviour based on the work done. This enables us to answer RQ4, which in turn addresses specific questions posed by our collaborating entities, that is ONDOD and OBERAXE.
User profiling methodology.

Figure 1 shows the design of the proposed general procedure for profiling users. The following section details the functioning of each module and specifies the variables and algorithms considered for the hate domain on Twitter, explaining why these are chosen over others.
3.1.1 User segmentation
This section discusses the input variables and clustering algorithms that are most suitable for the specific context of hate speech on Twitter, selecting those that best fit this particular scenario.
Clustering analysis. Cluster analysis encompasses techniques aimed at dividing a dataset into different groups so that the elements within the same group are more similar to each other than to those in other groups (Everitt et al. Reference Everitt, Landau, Leese and Stahl2011). It is based on the hypothesis that the data form a heterogeneous set composed of homogeneous subsets or clusters. However, the number of clusters and the specific characteristics of the data to be considered for classification are not known a priori. This is why cluster analysis is an unsupervised learning tool and, since it makes no assumptions about the data or its structure, it helps address RQ1.
For clustering algorithms, there are several options for numerical data, such as k-means, DBSCAN, Fuzzy, or hierarchical methods (Lee and Yun Reference Lee and Yun2003; Schubert et al. Reference Schubert, Sander, Ester, Kriegel and Xu2017). K-means is chosen because it performs well with large datasets and has been widely used in a range of applications. In comparison, hierarchical methods are not suitable for large datasets as they rely on visualising a partition tree (Everitt et al. Reference Everitt, Landau, Leese and Stahl2011). DBSCAN does not assign clusters to points distant from high-density regions, which does not meet our requirement of classifying all users, and Fuzzy, on the other hand, assumes that each point can belong to more than one cluster, which also does not align with our objective. However, since k-means is more effective with multivariate data following a spherical distribution (Chaudhary, Reference Chaudhary2020), the distribution of the variables must be studied, and transformations may be applied to achieve a spherical distribution before using k-means.
In k-means, the number of clusters $k$
must be chosen in advance. This means that, given a user partition, it is initially unclear whether it reflects an inherent grouping structure in the data or is merely an artificial division. Although the most interpretable partition could be selected, to ensure the objectivity required by RQ1, we propose identifying the optimal number of clusters by counting the number of local maxima in the density estimation level curves of the transformed spherical distributed data, as each local maximum identifies a different sub-population in the data.
$k$
must be chosen in advance. This means that, given a user partition, it is initially unclear whether it reflects an inherent grouping structure in the data or is merely an artificial division. Although the most interpretable partition could be selected, to ensure the objectivity required by RQ1, we propose identifying the optimal number of clusters by counting the number of local maxima in the density estimation level curves of the transformed spherical distributed data, as each local maximum identifies a different sub-population in the data.
Input data for the clustering algorithm. As in other user profiling studies in the hate speech domain (Pereira-Kohatsu et al. Reference Pereira-Kohatsu, Quijano-Sánchez, Liberatore and Camacho-Collados2019; Rangel et al. Reference Rangel, De La Peña Sarracén, Chulvi, Fersini and Rosso2021; Noorian et al. Reference Noorian, Ghenai, Moradisani, Zarrinkalam and Alavijeh2024; Mishra et al. Reference Mishra, Tredici, Yannakoudakis and Shutova2019; An et al. Reference An, Kwak, Lee, Jun and Ahn2021; Chandra et al. Reference Chandra, Reddy, Sehgal, Gupta, Buduru and Kumaraguru2021; He et al. Reference He, Ziems, Soni, Ramakrishnan, Yang and Kumar2022), more than 100 tweets should be collected per user, starting with the most recent ones. From these tweets, certain linguistic traits that are assumed to be related to the study domain can be extracted. For example, in the context of hate speech, it might be hypothesised that a hater uses a higher number of offensive words or makes more spelling mistakes. However, to avoid relying on unfounded assumptions about users’ writing styles, we opt for values directly related to the domain of study.
The methodology involves classifying tweets to determine how they relate to hate speech. Once classified, the relative frequency of each class (i.e., the proportion of tweets in each category) is calculated. These frequencies are used as input for a clustering process (previewed in Figure 1). The decision to use relative rather than absolute frequencies is made to account for variations in how many tweets different users post.
In this context, a pre-trained classifier, HaterBERT, is applied to categorise tweets in Spanish into four classes (see Table 6). The relevant inputs for clustering are the relative frequencies of tweets in these categories. If the proportion of offensive or extreme hate is very small, they may be combined into a single “hate” category to avoid data distortion.
Categories designed for tweet classification

So, the inputFootnote f for clustering becomes either:
 \begin{equation*} \text{Input Data for Clustering} = X_{\text{upstander}} \times X_{\text{offensive hate}} \times X_{\text{extreme hate}} \end{equation*}
or, if the categories are combined:
 \begin{equation*} \text{Input Data for Clustering} = X_{\text{upstander}} \times X_{\text{hate}}\text{, where } X_{\text{hate}} = X_{\text{offensive hate}}+X_{\text{extreme hate}} . \end{equation*}
3.1.2 User classifier based on profile
As shown in Figure 1, the next step is to derive a set of user characteristics from their profile information. The objective is to use these characteristics as input to a classifier that assigns each user a label based on easily obtainable data, without the need to download hundreds of tweets. This approach is innovative, as previous studies have always required tweet characteristics to be included, profile data being only considered as supplementary information (see Table 3). The efficacy of this classifier will help determine whether a user&’s profile alone contains sufficient information to classify them, something not previously explored. If effective, then user profiling can be achieved without downloading large amounts of tweets.Footnote g
Profile feature extraction. To begin, a set of profile features must be selected. To maximise the amount of information extracted, we consider the full set of features available from Twitter&’s API. Some of these are used directly, such as the number of tweets or followers, or almost directly, via simple calculations. For instance, from the account creation date (provided by the API), the time on Twitter is calculated as the difference in days between that date and the day the data is extracted. These features are labelled as “explicit.” Other features, such as the username or description, cannot be used directly and are processed through additional modules to derive “implicit” features. The only data not used or processed is the profile image, which is left for future work. A detailed list of the profile features is provided in Appendix A, where each feature is characterised according to its general type: metadata-based (i.e., extracted directly from the user profile), model-based (i.e., generated through pretrained classifiers), and manual (i.e., derived from structured fields).
The explicit features include the following thirteen attributes. Some may be relevant for identifying haters. For example, $Y_{\text{time}}$
, since haters may be more likely to be reported and have their accounts closed, leading to shorter Twitter lifespans, or
$Y_{\text{time}}$
, since haters may be more likely to be reported and have their accounts closed, leading to shorter Twitter lifespans, or $Y_{\text{frequency}}$
, as haters might post more frequently to reiterate their views.
$Y_{\text{frequency}}$
, as haters might post more frequently to reiterate their views.
-
• Number of tweets ( $Y_{\text{tweets}} \in \mathbb{Z}_{\geq 0}$
)
$Y_{\text{tweets}} \in \mathbb{Z}_{\geq 0}$
) -
• Number of followers (
$Y_{\text{followers}} \in \mathbb{Z}_{\geq 0}$
), number of followings (
$Y_{\text{followings}} \in \mathbb{Z}_{\geq 0}$
), and the ratio between the two (
$Y_{\text{ratio}} \in \mathbb{R}_{\geq 0}$
) -
• Time on Twitter in days (
$Y_{\text{time}} \in \mathbb{Z}_{\geq 0}$
) and tweet frequency (
$Y_{\text{frequency}} \in \mathbb{R}_{\geq 0}$
) -
• Number of lists they are part of (
$Y_{\text{lists}} \in \mathbb{Z}_{\geq 0}$
) -
• Whether they are verified (
$Y_{\text{verified}} \in \mathbb{Z}_2$
) and type of verification (
$Y_{\text{type verification}} \in \mathbb{Z}_4$
) -
• Number of cashtags, hashtags, mentions, and URLs in the description (
$Y_{\text{cashtags}}, Y_{\text{hashtags}}, Y_{\text{mentions}}, Y_{\text{urls}} \in \mathbb{Z}_{\geq 0}$
).


The seven selected implicit features are described below. They are derived from data that cannot be used directly (username, description, URLs, and location) due to their potential to distinguish haters from non-haters. In other applications, a different set of implicit attributes should be considered depending on the target objective.
-
• Anonymity Level
$(Y_{\text{anonymity}}) \in \mathbb{Z}_4$
This feature addresses the question: Are hater users more likely to hide behind anonymity than other types? Anonymity may allow users to express themselves freely without fear of repercussions. To categorise users based on anonymity levels, we use the definitions from Peddinti et al. (Reference Peddinti, Ross and Cappos2014).-
– Identifiable: A Twitter account containing both a first and last name.
-
– Highly Identifiable: An identifiable Twitter account that also contains a URL reference to another social network account that uses a real name (e.g., Facebook or LinkedIn). Also, verified Twitter users are automatically categorised as Highly Identifiable, as Twitter&’s verification process is more rigorous than simply having a name and a URL with a real name (Twitter, 2023). This is a subset of the identifiable group.
-
– Partially Anonymous: A Twitter account with either a first or last name, but not both.
-
– Anonymous: A Twitter account without a first or last name.
To detect first or last names within a username, a segmentation module and a pre-existing name bank are used.
-
-
• Location
$(Y_{\text{location}} \in \mathbb{Z}_2)$
This is a binary label indicating whether the profile location provides enough information to infer the user&’s geographical location. This feature is motivated by the same privacy concerns as anonymity: users who wish to remain unidentified may also avoid revealing their location. Manual labelling is used, as no existing tool can automatically classify locations. A location is marked as “yes” if it minimally reveals the user&’s whereabouts (e.g., broad regions, countries, Twitter&’s default locations like “ÜT,” postal codes, streets, rivers). Blank or non-informative locations are marked as “no.” Additionally, verified business or government accounts (not tied to individual users) are marked as “yes.” -
• Personality (
$Y_{\text{personality}} \in \mathbb{Z}_5$
) One of the most researched and accepted personality theories is the Big Five model, consisting of extraversion, openness to new experiences, conscientiousness, agreeableness, and neuroticism (McCrae and Costa Reference McCrae and Costa1987). Since each of these traits leaves a trace on social networks (Azucar, Marengo, and Settanni Reference Azucar, Marengo and Settanni2018), it is worth associating each user with a trait from this model. A personality classifier processes the profile description. -
• Topic of Description (
$Y_{\text{topic}} \in \mathbb{Z}_{17}$
) The profile description is classified according to its topic. -
• Gender (
$Y_{\text{gender}} \in \mathbb{Z}_2$
) The user&’s custom or display name is analysed for male or female names based on a name database. If no gender can be assigned, no label is given. -
• Hate Type in Description (
$Y_{\text{hate}} \in \mathbb{Z}_4$
) The description is passed through a pre-trained hate speech classifier. -
• Sentiment of Description (
$Y_{\text{sentiment}} \in \mathbb{Z}_3$
) A pre-trained model is used to determine the sentiment (positive, negative, or neutral).


Simplified process for implicit feature extraction.

The methodology for implicit feature extraction is summarised in Figure 2.Footnote h
In this specific case, to segment the words in each username, we use the Python library ekphrasis.classes.segmenter (Baziotis, Reference Baziotis2022), chosen after testing other options. The name database used is from the INE (the Spanish National Institute of Statistics) (Boquet, Reference Boquet2012), selected because it includes all names and surnames of individuals with Spanish nationality. Additionally, the personality traits in the description are extracted using the multi-language model Siddique et al. (Reference Siddique, Bertero and Fung2019) On the other hand, the topic of the description is inferred through a model from CardiffNLP (Camacho-Collados et al. Reference Camacho-Collados, Rezaee, Riahi, Ushio, Loureiro, Antypas, Boisson, Espinosa-Anke, Liu and Martínez-Cámara2022), which was trained specifically on tweets. The hate speech classifier is HaterBERT for continuity. Finally, the sentiment classifier chosen is pysentimiento/robertuito-sentiment-analysis, as it is specific to Spanish and the most accurate among the tested options.
By integrating these pre-trained transformer-based models (e.g. HaterBERT, CardiffNLP, and pysentimiento), our pipeline leverages task-specific models fine-tuned for hate speech detection, topic classification, and sentiment analysis. This hybrid approach allows the final user classifier to benefit from their contextual representations while maintaining the efficiency and interpretability of structured classification on profile-based attributes.
Before processing the description text and tweets through all the models, preprocessing is performed: line breaks, URLs, mentions, hashtags, cashtags, and emojis are removed, and the text is converted to lowercase.
In conclusion, the input features for the classifier are:
 \begin{equation} \text{Input data for classifier} = \text{Explicit features} \times \text{Implicit features} \end{equation}
where
 \begin{align*} \text{Explicit features} &= Y_{\text{tweets}} \times Y_{\text{followers}} \times Y_{\text{followings}} \times Y_{\text{ratio}} \\[3pt] &\quad \times Y_{\text{time}} \times Y_{\text{frequency}} \times Y_{\text{lists}} \times Y_{\text{verified}} \times Y_{\text{type verification}} \\[3pt] &\quad \times Y_{\text{cashtags}} \times Y_{\text{hashtags}} \times Y_{\text{mentions}} \times Y_{\text{urls}} \end{align*}
and
 \begin{align*} \text{Implicit features} &= Y_{\text{anonymity}} \times Y_{\text{location}} \times Y_{\text{personality}} \times Y_{\text{topic}} \\[3pt] &\quad \times Y_{\text{gender}} \times Y_{\text{hate}} \times Y_{\text{sentiment}} \end{align*}
Classifier creation. After adding these features to the data matrix, a suitable machine learning model must be selected, prioritising interpretability alongside performance. Several machine learning models have been tested in a series of experiments (detailed in Appendix C), and XGBoost emerged as the top-performing model. In the case of class imbalance, a data augmentation technique is recommended. For this study, we employ random oversampling.
After training the classifier, to address RQ3, feature importance is analysed using the F-score, a metric that depends on the number of times each feature appears in the decision tree to split two paths and at what height it is used; thus, the higher the F-score of a feature, the more important it is for classification.
3.1.3 Extrapolation of insights
At this stage, the final point in the user profiling methodology is to extrapolate insights that allow us to understand user behaviour based on the classified tweets and the users grouped by clusters. As such, RQ4 is divided into two parts, addressing concerns raised by the collaborating entities. Below, we describe the statistical analysis model designed to answer these sub-questions.
RQ4a: Behavioural analysis based on thematic differences of each tweet type. We aim to analyse user behaviour by investigating the topics they express hate about. The underlying hypothesis is that users discuss different topics when expressing hate compared to neutral or upstander messages. For example, a user might discuss non-hate-related topics like music but may shift to offensive language when commenting on politics or sports. This leads to the broader question of whether the topic of a tweet (e.g., music, news, and sports) is associated with the tweet&’s stance on hate speech (hate, neutral, or upstander).
Formally, we seek to determine whether the distribution of the random variable “topic” differs across the three tweet categories: hate, neutral, and upstander. To address this, we apply a homogeneity test, using a significance level of 0.05, to assess whether the topics discussed vary depending on the tweet&’s relationship to hate speech.
RQ4b: Behavioural analysis with respect to the virality of hate messages. Second, we want to analyse the virality of hate messages. The number of replies is used as a natural measure of a tweet&’s virality. First, we identify users classified as haters and calculate the average number of replies for hate tweets (offensive and extreme) and non-hate tweets (neutral and upstander), grouping them by author. Since we are not interested in the absolute values of the averages but rather how they compare, these values are normalised as relative proportions. Next, the average number of replies to non-hate tweets is plotted against the average number of replies to hate tweets, with users ranked by the latter.
Insight extraction for the specific domain of hate speech.

Figure 3 outlines the steps described above to address the sub-questions.
3.2 Interaction graph
This project&’s final contribution focuses on designing a tool that enables authorities to visualise the nature of interactions between different types of users. Therefore, to address RQ5, we propose the design of an interactive graph. This visualisation tool is intended to be run on a dataset that includes complete conversations. According to Twitter&’s definition, a conversation consists of all the replies generated from a tweet, including direct replies, replies to those replies, and so on. Each tweet must be accompanied by the user who posted it and the necessary profile information to classify the tweet&’s author. In this case, the same dataset used for the profiling methodology is utilised (see Section 4).
In the graph, edges are directional, originating from the users who write a tweet and pointing to the users who respond to that tweet. The colour of the edges represents the nature of the interaction between the two nodes it connects: red for opposition, green for indifference, or grey for support. To obtain the edges, each tweet-response pair is processed with an argumentative relation classifier. Specifically, we use the model raruidol/ArgumentMining-EN-ARI-AIF-RoBERTa_Lv from the HuggingFace platform, as it is the only public algorithm of its kind (to the best of our knowledge). It has four labels: “Conflict,” “Rephrase,” “Inference,” and “No-relation.” In this work, “Rephrase” and “Inference” are treated as support. As the model only handles texts in English, following the results by Toledo-Ronen et al. (Reference Toledo-Ronen, Orbach, Bilu, Spector and Slonim2020), all tweets are translated using the Helsinki-NLP translator. Figure 4 provides an example of how these tools are used.
Example of the process for obtaining the argumentative relation between two replies and the original message they respond to. All the texts are fictitious.

Nodes represent users while their colour denotes the user type. The specific colours are chosen based on the user classification resulting from the clustering method. To obtain the nodes, all users involved in the conversations are selected. They are then classified according to the partition established in the User Profiling section (Section 3.1). For this, we use the user classifier developed in Section 8, which avoids the need to download large amounts of Twitter data. The complete process for obtaining nodes and edges is illustrated in Figure 5.
Finally, the graph is visualised using Visone,Footnote i which not only offers the ability to visualise nodes and edges with custom colours but also allows for interaction with the graph, including filtering functions and the visualisation of profile characteristics for each node.Footnote j
Algorithm for generating each graph.

4. Data extraction
This section describes the data extraction process used to conduct all the experiments.
As mentioned in Section 3.1.1, to answer RQ1–RQ4, it is necessary to have a set of users with at least 100 tweets each. To answer RQ5 and build the user graph, it is essential to access complete conversations, which implies obtaining all the tweets from the comment section. To the best of our knowledge, there is no public dataset of Spanish tweets that meets either of these requirements. Therefore, new data must be extracted from the network. The research questions are addressed through the analysis of a static dataset comprising tweets posted between July and September 2023.
4.1 Conversation extraction
The API operates through keyword queries, returning all tweets (and their metadata) that are less than one week old. Since it is not possible to search by coordinates, we filter by language after collecting the tweets to select those from Spain. Regarding the keywords used, we have utilised a set of hate-related terms developed during the ALRECO project. This set consists of seven files representing six categories: Roma people, Jewish people, migrants, Muslims, cultural minorities, and religious ethnicities, as well as other general terms. The full list of words in this dataset is included in Appendix D.
In total, 1.6 million tweets were retained after filtering from the initial 3.3 million tweets collected with hate-associated keywords. This subset constitutes the keyword-based corpus used for conversation-level analysis. Table 7 shows the number of tweets extracted per category and how many have responses that could be downloaded. It is worth noting that the proportion of tweets with responses ranges from 40% to 46% across all categories, except for the Jewish community (28%).Footnote k Additionally, for each tweet with responses that served as root (i.e., not replies or retweets), their associated conversations have been extracted, adding up to another 1.6 million tweets. On average, each conversation contains 7.87 tweets, with a minimum of 2 and a maximum of 8,924 tweets.
Number of tweets extracted by category and how many of these have received responses

Once the corpus of randomly downloaded tweets that may contain hate is obtained, it is necessary to select a representative sample of users whose behaviour will be studied. Ideally, this sample should include users who potentially emit a significant amount of hate, as well as those who frequently oppose hate and others who remain indifferent. This ensures that the sample is diverse and comprehensive. However, given that only an average of one tweet per user is available, it is assumed, for now, that the authors of hateful tweets are those who frequently engage in hate speech, with similar assumptions for the other categories.
Thus, it becomes necessary to classify the collected tweets. For this purpose, we have used the HaterBERT model (del Valle-Cano et al. Reference Valle-Cano, Quijano-Sánchez, Liberatore and Gómez2023). Table 8 shows the resulting number of tweets for each class. It is evident that the extreme hate class is by far the minority, as these tweets contain highly offensive and explicitly aggressive content, which are less common compared to milder levels of hate speech.
Number of tweets extracted, grouped by keyword set, and classified by hate type

Overview of the two datasets used in this study

For clarity, we have worked with two related but distinct datasets (see Table 9): (i) a keyword-based corpus of 3.3 million tweets containing hate-associated terms, from which 1.6 million unique tweets were retained after filtering and (ii) a user-based corpus, built by extracting timelines from approximately 3,000 users linked to hate speech, amounting to over 3 million tweets. Throughout the paper, we explicitly state which dataset each analysis draws upon.
4.2 User extraction
Since the goal of this study is to understand the behaviour of users involved in hate-related activities, it is desirable to focus on users who have been active on Twitter for a significant period and maintain consistent activity. This ensures a more complete and representative data sample. From the authors of the tweets collected during the extraction process, users with fewer than 100 tweets are excluded, as are those with an average activity of fewer than one tweet per month. The remaining sample of tweets is then grouped by type of hate. Since the number of extremely hateful tweets is relatively small, they are combined with offensive hate tweets. Based on this, a ranking of users is created according to the following criteria:
-
• Number of tweets authored by the user
-
• Number of reactions (sum of likes, retweets, replies, and quotes)
-
• Number of followers
-
• Number of views
-
• Ratio of reactions to views
This process generates five different rankings, and the top 200 users from each ranking are selected. To avoid duplicates, users already selected in one ranking are excluded from others. The result is three distinct lists: one with 1,000 users who have posted at least one hate message, another with 1,000 users who have posted an upstander message (supportive), and a third with 1,000 users who have posted at least one neutral message. Out of these 3,000 users, only 2,722 accounts were available for extracting recent tweets (the rest had been deactivated or privatised). On average, 1,103.33 tweets were collected per user and classified using HaterBERT (the results are presented in the next section). This provides the necessary dataset to achieve the objectives of this project.
4.3 Validation of pretrained classifiers for hate speech in Spanish
A potential limitation of our approach is the reliance on pretrained classifiers, such as HaterBERT, for the detection of hate speech. Concerns have been raised in the literature that biases or inaccuracies in such models may propagate into the final labels. To mitigate this risk, we have conducted an additional validation exercise comparing HaterBERT with other available hate speech classifiers in Spanish. We have evaluated the model pysentimiento/robertuito-hate-speech, which constitutes one of the few alternatives for Spanish within the Hugging Face library. Both models have been applied to the same manually validated subset of tweets, and their outputs have been assessed for consistency in terms of label distribution and classification accuracy. Table 10 reports their overall performance on a manually validated subset of tweets. These results demonstrate that differences between HaterBERT and robertuito are minimal. Both models achieve highly comparable F1-scores (macro average above 0.92 in our validation set), and the distribution of predictions across hate/non-hate classes is nearly identical. Importantly, no systematic skew towards particular subgroups or protected attributes (gender, ideology, and age) has been observed. In addition, we have performed a fairness check across protected attributes (gender, ideology, and age) to verify that neither model exhibits systematic disparities. As shown in Table 11, the absolute differences in F1-scores between models remain below 0.02 across all groups. This indicates that the classifiers behave consistently and equitably, without propagating significant bias into the final labels. This consistency across models indicates that our findings are not artefacts of a single pretrained classifier.
Comparison of Spanish hate speech classifiers on the validation subset. Notes: Values are averaged over the manually validated subset of tweets. Both models show very similar classification performance and nearly identical distributions of predicted labels, with no systematic skew across protected attributes

Fairness check of hate speech classifiers across protected attributes. Notes: The $\Delta$
column shows the absolute difference in F1-scores between models. Differences remain below 0.02, suggesting consistent behaviour across groups and no systematic bias propagation. This table demonstrates explicitly that both models behave stably and equitably across gender, ideology, and age
$\Delta$
column shows the absolute difference in F1-scores between models. Differences remain below 0.02, suggesting consistent behaviour across groups and no systematic bias propagation. This table demonstrates explicitly that both models behave stably and equitably across gender, ideology, and age

Furthermore, in the clustering experiments (see Section 5.1), the user groupings (haters, neutrals, and upstanders) emerge from aggregated proportions of hate content rather than isolated tweet-level classifications. This methodological choice reduces the potential impact of misclassifications by any one model and reinforces the robustness of the results. In sum, while pretrained models always entail some degree of bias, our validation shows that, in the Spanish context, the leading available classifiers for hate speech (HaterBERT and robertuito) produce stable and convergent outputs. This strengthens confidence that the conclusions presented here are not overly dependent on the idiosyncrasies of a particular model.
5. Results
This section presents the results of applying our methodology for user profiling and modelling in the context of hate speech on Twitter. The analysis focuses on identifying key user characteristics, behaviours, and patterns associated with the dissemination of hateful content. Through a combination of feature extraction and machine learning techniques, we aim to uncover insights into user behaviour and profile traits that are indicative of hate speech activity on the platform. The findings offer a comprehensive view of how specific user profiles contribute to the propagation of hate, supporting the broader objective of understanding and mitigating harmful online behaviour.
5.1 User segmentation
In this section, RQ1 and RQ2 are addressed by applying the designed methodology to the extracted data. First, for each user, the proportion of hate tweets (variable $X_{\text{hate}}$
, including both offensive and extreme) and the proportion of upstander tweets (variable
$X_{\text{hate}}$
, including both offensive and extreme) and the proportion of upstander tweets (variable $X_{\text{upstander}}$
) are extracted. The two types of hate are merged, as the number of extreme hate tweets is considerably small (see Table 8), which could cause distortions when running the clustering algorithm. Then, the user density is graphically analysed to identify the optimal number of clusters. The data are transformed to achieve a spherical distribution, which provides clearer results while, at the same time, improving the performance of k-means (Chaudhary, Reference Chaudhary2020).
$X_{\text{upstander}}$
) are extracted. The two types of hate are merged, as the number of extreme hate tweets is considerably small (see Table 8), which could cause distortions when running the clustering algorithm. Then, the user density is graphically analysed to identify the optimal number of clusters. The data are transformed to achieve a spherical distribution, which provides clearer results while, at the same time, improving the performance of k-means (Chaudhary, Reference Chaudhary2020).
Let $X_{\text{upstander}}$
and
$X_{\text{upstander}}$
and $X_{\text{hater}}$
represent the proportion of upstander and hate tweets for each user, respectively. The distribution of the vector
$X_{\text{hater}}$
represent the proportion of upstander and hate tweets for each user, respectively. The distribution of the vector $(X_{\text{hater}},X_{\text{upstander}})$
is studied to assess the possibility of transforming it into a spherical distribution. First, the distribution of
$(X_{\text{hater}},X_{\text{upstander}})$
is studied to assess the possibility of transforming it into a spherical distribution. First, the distribution of $X_{\text{upstander}}$
and
$X_{\text{upstander}}$
and $X_{\text{hater}}$
is studied separately. Figure 6a shows the histogram of the 2,722 samples of
$X_{\text{hater}}$
is studied separately. Figure 6a shows the histogram of the 2,722 samples of $X_{\text{upstander}}$
. It is clear that it does not follow a spherical distribution. However, it is possible that it follows a
$X_{\text{upstander}}$
. It is clear that it does not follow a spherical distribution. However, it is possible that it follows a $\text{Beta}(\alpha , \beta )$
distribution, as it takes values in
$\text{Beta}(\alpha , \beta )$
distribution, as it takes values in $[0,1]$
. To verify this assumption, the parameters
$[0,1]$
. To verify this assumption, the parameters $\alpha$
and
$\alpha$
and $\beta$
are estimated. Knowing that:
$\beta$
are estimated. Knowing that:
 \begin{equation} \operatorname {E}[X] = \frac {\alpha }{\alpha +\beta },\; \operatorname {\text{Median}}\![X] \approx \frac {\alpha -1/3}{\alpha +\beta -2/3},\; \operatorname {\text{Mode}}\![X] = \frac {\alpha -1}{\alpha +\beta -2} \end{equation}
for $X \text{Beta}(\alpha , \beta )$
, the parameters
$X \text{Beta}(\alpha , \beta )$
, the parameters $\alpha$
and
$\alpha$
and $\beta$
are estimated using the sample values of the mean, median, and mode. The results are shown in Figures 6b and 6d. It can be observed that in both Figure 6b and Figure 6d, the density function fits the histogram reasonably well. However, in Figure 6b, the density converges to zero more rapidly than the histogram. The opposite occurs in Figure 6d. Therefore, it can be inferred that
$\beta$
are estimated using the sample values of the mean, median, and mode. The results are shown in Figures 6b and 6d. It can be observed that in both Figure 6b and Figure 6d, the density function fits the histogram reasonably well. However, in Figure 6b, the density converges to zero more rapidly than the histogram. The opposite occurs in Figure 6d. Therefore, it can be inferred that $X_{\text{upstander}}$
is, in fact, the sum of two beta distributions. In Figure 6c, the density as a sum of the previous betas (equally weighted) now fits much better with the histogram, both for values near zero and those farther from zero. In conclusion, it is reasonable to assume that
$X_{\text{upstander}}$
is, in fact, the sum of two beta distributions. In Figure 6c, the density as a sum of the previous betas (equally weighted) now fits much better with the histogram, both for values near zero and those farther from zero. In conclusion, it is reasonable to assume that $X_{\text{upstander}}$
indeed follows the distribution of the sum of two betas.
$X_{\text{upstander}}$
indeed follows the distribution of the sum of two betas.
Density analysis of $X_{\text{upstander}}$
.
$X_{\text{upstander}}$
.

Analogously, the distribution of the hate proportions, $X_{\text{hate}}$
, is analysed, and it is concluded that it is reasonable to assume that it follows a sum of two beta distributions (Figure 7).
$X_{\text{hate}}$
, is analysed, and it is concluded that it is reasonable to assume that it follows a sum of two beta distributions (Figure 7).
Histogram of the proportions of hater tweets accompanied by the density function $0.55*\text{Beta}(\alpha =2.7,\beta =5)+0.45*\text{Beta}(\alpha =1.05,\beta =21)$
.
$0.55*\text{Beta}(\alpha =2.7,\beta =5)+0.45*\text{Beta}(\alpha =1.05,\beta =21)$
.

Figure 8a represents each user as a point, where the $x$
axis corresponding to
$x$
axis corresponding to $X_{\text{hate}}$
and the
$X_{\text{hate}}$
and the $y$
axis to
$y$
axis to $X_{\text{upstander}}$
. The farther a point is from the
$X_{\text{upstander}}$
. The farther a point is from the $x$
-axis, the more upstander messages the user writes, and the farther it is from the
$x$
-axis, the more upstander messages the user writes, and the farther it is from the $y$
-axis, the more hate the user emits. It is evident that no point exceeds the diagonal
$y$
-axis, the more hate the user emits. It is evident that no point exceeds the diagonal $x + y = 1$
, as these are proportions that cannot sum to more than one. The points are graphed with partial transparency, allowing us to see areas with a higher concentration of users. It is noticeable that near the bottom-left corner, where the hate and upstander levels are close to zero, many points accumulate. These are the users who post few tweets related to hate speech and primarily write neutral tweets. Also, it can be easily seen that the points do not follow a spherical distribution, which was anticipated given that hate and upstander proportions are not spherical. The contour lines of the estimated density in Figure 8b are plotted. Indeed, we observe that the contours are not circular in shape; for comparison, Figure 8c shows the contour lines of a spherical density, where circular contours are clearly visible.
$x + y = 1$
, as these are proportions that cannot sum to more than one. The points are graphed with partial transparency, allowing us to see areas with a higher concentration of users. It is noticeable that near the bottom-left corner, where the hate and upstander levels are close to zero, many points accumulate. These are the users who post few tweets related to hate speech and primarily write neutral tweets. Also, it can be easily seen that the points do not follow a spherical distribution, which was anticipated given that hate and upstander proportions are not spherical. The contour lines of the estimated density in Figure 8b are plotted. Indeed, we observe that the contours are not circular in shape; for comparison, Figure 8c shows the contour lines of a spherical density, where circular contours are clearly visible.
Moreover, the potential number of clusters can already be identified. In fact, Figure 8a resembles a topographic map, where the contour lines represent density in each region, that is, the concentration of users. It is very clear that near the point (0,0), there is a local maximum, that is, a closed curve that contains no other curves within it, which means that many users are concentrated in the region with low hate and upstander proportions. This had already been observed in Figure 8a. However, now two other local maxima are detected: one directly above the one previously mentioned and another elongated one to the right. This indicates that the data can be classified into three clusters, as each local maximum identifies a sub-population within the total user population.
To obtain a spherical distribution, the following transformation is chosen:
 \begin{equation} x \mapsto \frac {x}{1-x} \mapsto \log \left (\frac {x}{1-x}\right ) \end{equation}
The first transformation maps the interval $(0,1)$
to all of
$(0,1)$
to all of $\mathbb{R}^{+}$
, and the second maps it to all of
$\mathbb{R}^{+}$
, and the second maps it to all of $\mathbb{R}$
, which is the space where a spherical variable takes values. In Figure 8d, it can be seen that after applying the transformation, the three previously identified local maxima become more visible, resembling those in Figure 8c, and therefore more similar to a normal distribution.
$\mathbb{R}$
, which is the space where a spherical variable takes values. In Figure 8d, it can be seen that after applying the transformation, the three previously identified local maxima become more visible, resembling those in Figure 8c, and therefore more similar to a normal distribution.
The resulting k-means clustering with $k=3$
is illustrated in Figure 9, where users are divided into those with little relation to hate speech (in green), those who emit more hate (in red), and those who post more upstander content (in blue). In Appendix B, we show that, indeed, the transformed data are better suited for applying k-means clustering. To evaluate the quality of the clustering, we have computed the silhouette coefficient (0.47) and the Davies–Bouldin index (0.61). Both values indicate meaningful separation between clusters, supporting the existence of distinct user groups (haters, upstanders, and neutrals) beyond the traditional binary classification.
$k=3$
is illustrated in Figure 9, where users are divided into those with little relation to hate speech (in green), those who emit more hate (in red), and those who post more upstander content (in blue). In Appendix B, we show that, indeed, the transformed data are better suited for applying k-means clustering. To evaluate the quality of the clustering, we have computed the silhouette coefficient (0.47) and the Davies–Bouldin index (0.61). Both values indicate meaningful separation between clusters, supporting the existence of distinct user groups (haters, upstanders, and neutrals) beyond the traditional binary classification.
Density estimation level curves for different distributions.

Clusters identified by k-means on the transformed data, with $k=3$
.
$k=3$
.

At this point, RQ1 and RQ2 are definitively answered. The answer to RQ1 is that cluster analysis combined with density analysis is an objective methodology that can be used to classify users based on their stance on hate speech, surpassing the arbitrary criteria found in the literature. The answer to RQ2 is that there are three underlying groups within the user set: those with little relation to hate speech, those who post a lot of hate, and those who oppose hate. From now on, these groups are referred to as neutrals, haters, and upstanders, each comprised of 734, 1,390, and 598 users, respectively.
5.2 User classifier
In this section, RQ3 is addressed, focusing on which profile characteristics (number of followers, number of tweets, etc.) differentiate each type of user. By constructing a model that classifies each user as a hater, neutral, or upstander, we analyse the attributes that hold the most importance in the model.
For each user, the features defined by Equation (1) are extracted. The classifier is then trained using the XGBoost classifier implemented through the Python package xgboost, applying oversampling (using the RandomOverSampler class from the imblearn library) during training to balance the classes, with a test size of 20%. To evaluate the profile-based classifier, we have applied 10-fold cross-validation with hyperparameter tuning via Grid Search. In each iteration, the classifier has been trained on nine folds and evaluated on the held-out fold, with performance aggregated across folds. User labels (Haters, Upstanders, and Neutrals) are derived from the unsupervised clustering procedure in Section 5.1 and serve as ground truth. Among all tested models (i.e., logistic regression, Elastic Net, SVM, CNN, and XGBoost, see Appendix C, Table 15) XGBoost achieves the best performance across all metrics: Accuracy 0.7560, weighted F1 0.7571, macro F1 0.7384, AUROC 0.9086, and AUPRC 0.8284. These values demonstrate a significant relationship between profile features and user type. This finding is important as it shows that it is not necessary to analyse multiple tweets from a user to determine their type, surpassing the need found in the literature for analysing multiple tweets.
Confusion matrix of the profile-based classifier using 10-fold cross-validation. User labels correspond to the cluster-derived classes (Haters, Upstanders, and Neutrals). Each cell shows both the number of users and the percentage within the true class row.

Figure 10 reports the resulting confusion matrix, where each cell contains both absolute user counts and row-normalised percentages. It is clear that haters and neutrals are classified most accurately. The reason upstanders are not perfectly classified could be due to their similarity to haters in terms of profile features, as explained below.
Figure 11 shows the importance level of each attribute, measured using the F-score. The higher the F-score of an attribute, the more important it is. Therefore, the most relevant features for classification, in order, are $Y_{\text{time}}$
,
$Y_{\text{time}}$
, $Y_{\text{ratio}}$
,
$Y_{\text{ratio}}$
, $Y_{\text{followers}}$
,
$Y_{\text{followers}}$
, $Y_{\text{frequency}}$
,
$Y_{\text{frequency}}$
, $Y_{\text{tweets}}$
, and
$Y_{\text{tweets}}$
, and $Y_{\text{lists}}$
. The distribution of each feature, grouped by user type, is plotted in Figure 12.
$Y_{\text{lists}}$
. The distribution of each feature, grouped by user type, is plotted in Figure 12.
Feature importance of profile attributes identified by the model (ordered by the normalised F-score).

Box plot of the five most important characteristics of the model by author type. Outliers are not graphed for clarity.

At this point, we can answer RQ3, which asks which profile attributes differ the most between clusters. Figure 12 shows that neutral users have been on Twitter longer, have more followers, have posted more tweets (with higher frequency), and are included in more lists. In other words, neutral users have a strong presence on the platform, are active, and have built large networks. In contrast, haters and upstanders do not exhibit these characteristics but tend to follow more accounts than neutrals, with upstanders slightly outpacing haters.
Since no attribute clearly distinguishes haters from upstanders, we analyse the next most relevant feature in the model, $Y_{\text{topic}}$
(the topic of the description). Figure 13 shows the proportion of topics by user type. Although the two dominant topics are the same in both groups (news and social concerns in light green, daily life in purple), the percentages differ significantly: 35.6% and 27.6% for haters, and 64.8% and 11.7% for upstanders. This means that upstanders tend to mention news and social concerns in their descriptions more than haters.
$Y_{\text{topic}}$
(the topic of the description). Figure 13 shows the proportion of topics by user type. Although the two dominant topics are the same in both groups (news and social concerns in light green, daily life in purple), the percentages differ significantly: 35.6% and 27.6% for haters, and 64.8% and 11.7% for upstanders. This means that upstanders tend to mention news and social concerns in their descriptions more than haters.
Pie charts of topics’ description by user type.

The remaining attributes have been analysed, and all have been found to be similarly distributed in both groups. The only significant difference observed is in the sentiment of the description: while neutral sentiment predominates in both groups, the second most common sentiment is positive for upstanders and negative for haters (Figure 14).
Pie charts of sentiment&’s description by user type.

5.3 Extrapolation of insights
The insight extraction methodology allows us to answer the two sub-questions of RQ4.
Behavioural analysis based on thematic differences of each tweet type. To address this question, a hypothesis test for the independence of tweet type (hate or non-hate) and tweet topic (music, sports, news, etc.) is run for each user. The hypothesis that tweet type and topic are independent is rejected 56% of the time. In conclusion, more than half of the users change topics when their tweet is related to hate speech.
Behavioural analysis with respect to the virality of hate messages. To address this question, in Figure 15 we plotted for each user the average number of responses to hate tweets (red dots) and the average number of responses to non-hate tweets (light blue dots), normalised to sum oneFootnote l The horizontal thin lines show the average proportions across all the users. We observe that the red dots do not cross 50% until approximately the 1,250th user. This means that, out of the 1,390 haters, only about 140 tend to receive more responses on their hate tweets compared to non-hate tweets. Additionally, the graph reveals that, for the remaining 1,250 users (approx), the percentage of responses to hate tweets is below 0.4 for the majority of them. Therefore, we can conclude that, according to our data, hate tweets are less viral than non-hate tweets.
Proportion of the average number of responses received by each author based on tweet type.

5.4 Interaction graph tool
The ultimate goal of this project is to analyse the interactions between different types of users to address RQ5. Nodes and edges are assigned colours according to the type of user and interaction, respectively, according to the schema below (see Figure 16).
Graph tool colour coding.

Next, the argumentative relation process (Figure 4) is implemented and executed on the set of complete conversations extracted using hate-related keywords. Figure 17 includes two fragments of graphs obtained, along with the conversations from which these graphs were derived. Figure 18 shows a complex graph with multiple edges and nodes.
Table 12 shows the percentage of node and edge types obtained by hate category. In general, the majority of edges represent support, and the majority of nodes are haters. This suggests that haters tend to group together and reinforce each other. This behaviour could be beneficial, as clustering makes it easier to identify and apply hate mitigation strategies in a targeted and localised manner.
At this point, the last question, RQ5, is answered. Through the design of a graph representing the nature of interactions between users within the context of hate, a series of graphs have been generated that can be used by collaborating entities to analyse and better understand how users interact with each other. Note that the tool includes additional functionalities, such as modifying node sizes based on centrality measures, filtering by node and edge types, and more.
Percentage of node and edge types obtained by hate category

Examples of relationships between hater and upstander users, along with the conversations from which these graphs were obtained. The names are anonymised for privacy.

Graph representing a conversation stemming from a hate tweet targeting the Roma community.

6. Conclusions and future work
This section summarises the research findings and suggests potential future research lines.
6.1 Results
Online hate has drawn the attention of many researchers and governments due to its potential to fragment communities and incite real-world violence. This research expands the existing body of work on digital hate, addressing significant gaps in the literature, providing network analysis results, and developing several tools that will enable the collaborating entities, ONDOD and OBERAXE, to tackle online hate more effectively.
The literature review revealed that while hate speech detection has been extensively studied, a comprehensive analysis of who the actors associated with hate are, what characterises them, and how they interact within the online environment has not yet been conducted. Specifically, there is often an assumption that there are only two primary groups—haters and non-haters— when in fact, other groups might better reflect how hate circulates online. Additionally, user classification models typically rely on large datasets of tweets as input, which is problematic as Twitter&’s API is no longer freely accessible, making it difficult to easily retrieve tweets from the platform. Furthermore, social networks are usually visualised through graphs where edges represent only superficial relationships. To address these gaps, a series of research questions have been formulated. Experiments have been designed to address these questions, and novel designs have been proposed for user classifiers and network graphs.
The experimental results from the cluster analysis indicate that among the Twitter hate-related domain, there are three main groups: those who spread hate, those who oppose it, and those who remain indifferent. These groups have been labelled as haters, upstanders, and neutrals. This classification disproves the common hypothesis of only two groups. Also, it is observed that users from any of these groups can post hate tweets, upstander tweets, or neutral tweets; this classification is therefore not based on rigid definitions, such as assuming that haters only post hate tweets and none in defence of others (He et al. Reference He, Ziems, Soni, Ramakrishnan, Yang and Kumar2022). Nor is it based on overly relaxed definitions, such as classifying a hater as someone who has posted more than 1, 2, or 10 hate tweets, disregarding other types of tweets (Rangel et al. Reference Rangel, De La Peña Sarracén, Chulvi, Fersini and Rosso2021; Mishra et al. Reference Mishra, Tredici, Yannakoudakis and Shutova2019; An et al. Reference An, Kwak, Lee, Jun and Ahn2021). Our classification, on the other hand, considers the number of tweets of each type simultaneously. Thanks to this broader perspective and the partitions obtained with k-means, we have been able to define each cluster with more complex descriptions that take into account all available information.
In addition, a user classifier has been developed, where the input data are attributes derived from user profiles. With an accuracy of 76%, it can be inferred that profile information alone is a reliable indicator for automatically classifying users, a topic that had not been previously explored. Hence, Spanish authorities performing hate monitoring on Twitter can use this classifier to identify hateful users without the need to download a large volume of tweets. This is particularly relevant now, given that the tools currently in use (Pereira-Kohatsu et al. Reference Pereira-Kohatsu, Quijano-Sánchez, Liberatore and Camacho-Collados2019; del Valle-Cano et al. Reference Valle-Cano, Quijano-Sánchez, Liberatore and Gómez2023) are no longer usable without paying a high fee.
From the analysis of the most relevant model attributes, significant statistical differences between the classes have been found. Neutral users have been on Twitter for longer, have more followers, have posted more tweets, and appear on more lists. In other words, neutral users stand out for having a strong online presence, being active, and having built large platforms. On the other hand, haters and upstanders do not display these characteristics. The key feature distinguishing upstanders from haters is their profile description: more upstanders address news and social concerns in their description compared to haters.
As a final point in the user analysis, an additional study, motivated by two questions posed by the collaborating entities, illustrates that:
-
• More than half of users tend to change their discussion topic when switching from non-hateful to hateful tweets.
-
• In most accounts, non-hateful tweets receive more responses than hateful ones.
Finally, a graph visualisation tool has been developed that expands the concept of online connections to a more realistic, human-centred one. It is based on a new definition of edges that connect two users depending on whether they support or oppose each other ideologically. After analysing the graphs, it is observed that most edges represent support, and the majority of nodes are haters. In other words, haters tend to congregate and reinforce each other&’s ideas, which could be useful for identifying hate niches and applying targeted hate mitigation strategies. These generated graphs will be highly valuable to authorities analysing interactions between different types of users, as they can study the most central nodes and understand the dynamics between haters and other haters or victims of hate.
In conclusion, a reusable methodology has been developed for profiling users and mapping their interactions, which can be applied to larger datasets and adapted for other studies of online user behaviour. This can be particularly useful for sociologists and authorities studying online behaviour, an increasingly relevant issue in this digital age. We note that the proposed tools and analyses, although promising for institutional monitoring, should be interpreted as methodological contributions rather than fully operational systems. Their applicability depends on platform constraints, pretrained model performance, and the specific characteristics of the analysed dataset. The developed code has been handed over to the collaborating entities for reuse and future improvements if desired. Also, the code and the dataset are available upon request from the authors.
6.2 Limitations and future work
One of the main limitations encountered during this project was the lack of multilingual NLP libraries. While there are numerous options available in English, including those specifically designed for hate speech classification (e.g., CardiffNLP, Camacho-Collados et al. (Reference Camacho-Collados, Rezaee, Riahi, Ushio, Loureiro, Antypas, Boisson, Espinosa-Anke, Liu and Martínez-Cámara2022)), this is not the case for Spanish. We have noticed a scarcity of libraries capable of automatically classifying stance and argumentation (both in favour and against), personality tests tailored to this language, or Twitter topic and thematic classifiers. Note that, although the current implementation of the interaction graph focuses on Spanish content, the proposed methodology is not language-dependent. The pipeline could be adapted to other linguistic regions by replacing the classifiers with equivalent models in the target language, or by leveraging multilingual transformer models such as XLM-R or mBERT. Future work should explore these possibilities to enable the deployment of truly multilingual or language-agnostic interaction graphs, which would be especially valuable for monitoring hate speech in cross-border or multilingual contexts.
Also, although our dataset covers a three-month period and thus offers only a cross-sectional view of user behaviour, we indirectly capture some temporal aspects through profile-based features. For instance, account age and time on Twitter provide indications of behavioural persistence, while tweet frequency reflects intensity of activity over time. Our results show that haters often present shorter account lifespans and higher posting rates, suggesting patterns of instability and recurrent expression of hate. While these variables provide partial insight into temporal dynamics, future research should adopt a longitudinal design to monitor whether users become more or less hateful, or transition between classes, over extended periods. Such studies would deepen our understanding of behavioural trajectories and support the design of timely interventions.
In this study, personality was inferred from the profile description alone, which provides a minimal but informative signal. Future work should investigate more comprehensive strategies, such as integrating tweet-level features (e.g., sentiment variation, lexical richness, and stylistic markers) and behavioural attributes (e.g., activity frequency, interaction tendencies). Combining bio-based and behaviour-based information could substantially improve personality classification, although this requires access to extended user timelines, which are increasingly difficult to obtain under current API restrictions.
Regarding the selection of users for the study, we originally chose those who remained active, as they could provide a more complete and representative data sample. However, this led to selecting neutral users with significant influence on the network, such as newspaper accounts or writers. This may have introduced bias into the classifier, which only categorises a user as neutral if they have a large following and a long-standing presence on the platform. This could be reasonable since users who post content related to hate (either in favour or against it) may be more likely to have their accounts suspended or made private than those not involved with hate-related content. However, there may also be a significant number of neutral users who are not characterised by having high influence on the network. Therefore, further study is needed to examine how this has affected the classifier, and a new study could be conducted by selecting less active users.
For the cluster analysis, we chose to merge the two types of hate because extreme hate was relatively rare. Nonetheless, it could be interesting to conduct an additional analysis where each user is classified based on their proportion of offensive hate, extreme hate, and upstander tweets, to see how this additional parameter affects the results.
Looking at the interactions between users, two observations can be made. First, the percentage of haters in the graphs is very high (around 90%), which may be because the classifier developed identifies as neutral users those with a high presence on the platform, although there may be neutral users with less presence. Second, since each graph has a root tweet extracted using a hate-related keyword (related to Roma people, Jews, migrants, Muslims, or other minorities), each graph can be considered to represent a niche of haters expressing hate towards a specific group. If in the future other specific niches are to be analysed, new searches for tweets with keywords related to other types of discrimination should be performed. Our study does not explicitly address the role of coordinated behaviour among users, such as botnets or organised hate clusters. However, the interaction graph provides a foundation for detecting such dynamics, as clusters of tightly interconnected users with synchronised activity could reflect orchestrated behaviour. Future research should extend this approach by incorporating coordination indicators (e.g., posting synchrony, retweet cascades, shared hashtags) to better understand the impact of collective amplification by haters or upstanders. Distinguishing between individual and coordinated behaviours would enhance both the interpretability of our results and their applicability for mitigation strategies.
Finally, we focused on racial and cultural discrimination, as this was the main concern of the collaborating entities. However, it would be relevant to explore other types of hate, such as homophobia or hate toward political figures. This would require extracting new data from the network using keywords related to these types of hate and classifying them with a classifier trained to detect those specific types of hate, as the one we used, HaterBERT, is not equipped for this purpose.
Acknowledgements
This research was conducted within the project: REAL-UP “Discurso de odio, racismo y xenofobia: mecanismos de alerta y respuesta coordinada” (Hate speech, racism and xenophobia: Alert Mechanisms and Response, analysis of the Upstander speech) funded by the European Commission within the “Citizens, Equality, Rights and Values” (CERV) program and with identification 101049673. The research of Quijano-Sánchez was conducted with financial support from the Spanish Ministry of Science and Innovation, grants PID2022-139131NB-I00 & PR47/24 PID2024-157561NB-I00. The authors would like to thank the Spanish National Office Against Hate Crimes (ONDOD) and the Spanish Observatory of Racism and Xenophobia (OBERAXE) for all the help and resources provided to this research project. We also thank the team of the UC3M-Santander Big Data Institute, in particular Iñaki Ucar for his support with Twitter data retrieval, and the director Rosa E. Lillo for facilitating logistics and providing the servers and infrastructure necessary to carry out this project.
All the financial support is gratefully acknowledged. During the preparation of this work, the authors used ChatGPT to improve language and readability. After using this tool/service, the authors reviewed and edited the content as needed and take full responsibility for the content of the publication.
Appendix A. Profile features to classify users
This section displays the list of input attributes for the user classifier (Tables A1 and A2). These are attributes that are extracted directly from the profile information or through processing of the username and description.
Features extracted from general profile data. Those marked with an asterisk are implicit

Type indicates how each feature is obtained: Metadata (directly extracted from the user profile), Manual (derived from structured fields or simple transformations), and Model-based (inferred using pretrained NLP models).
Features extracted from users’ profile descriptions. Those marked with an asterisk are implicit

Type indicates how each feature is obtained: Metadata (directly extracted from the user profile), Manual (derived from structured fields or simple transformations), and Model-based (inferred using pretrained NLP models).
Appendix B. Validation of spherical transformation for k-means
Let us analyse the performance of the k-means algorithm on the data both before and after applying the transformation. With $k=3$
, we observe in Figure B1b that the clusters differentiate between haters (in red), upstanders (in blue), and neutral (in green). In contrast, the clusters shown in Figure B1a appear to differ primarily based on the level of hate alone, without leveraging upstander proportions for separation. If we were to use this division, users would be labelled based on whether they emit low, moderate, or high levels of hate, disregarding the role of neutral and upstander users. Also, these clusters do not consider the local maxima in the density estimation curves, identified in Figure 8b.
$k=3$
, we observe in Figure B1b that the clusters differentiate between haters (in red), upstanders (in blue), and neutral (in green). In contrast, the clusters shown in Figure B1a appear to differ primarily based on the level of hate alone, without leveraging upstander proportions for separation. If we were to use this division, users would be labelled based on whether they emit low, moderate, or high levels of hate, disregarding the role of neutral and upstander users. Also, these clusters do not consider the local maxima in the density estimation curves, identified in Figure 8b.
Scatter plot of proportions grouped into 3 clusters.

Appendix C. Classification models comparison
In this appendix, we present the results of the machine learning models evaluated for the classifier creation task. For all models, hyperparameter optimisation was conducted using grid search, combined with 10-fold cross-validation and random oversampling. The metrics reported in Table C1 clearly demonstrate the superiority of XGBoost over the other models.
Classification models comparison. The best results for each metric are highlighted in bold

The hyperparameters utilised in the experiments, along with their respective value ranges and the optimal values obtained, are given in the following:
CNN

Best hyperparameters: {’filters’: 16, ’kernel_size’: 3, ’dropout_rate’: 0.3, ’dense_units’: 128}
Elastic Net

Best hyperparameters: {’C’: 0.1, ’l1_ratio’: 0.5, ’penalty’: ’elasticnet’, ’solver’: ’saga’}
SVM

Best hyperparameters: {’C’: 1, ’degree’: 2, ’gamma’: ’scale’, ’kernel’: ’rbf’}
XGBoost

Best hyperparameters: {’reg_lambda’: 5, ’min_child_weight’: 1, ’max_depth’: 6, ’gamma’: 0, ’eta’: 0.5, ’colsample_bytree’: 0.6, ’alpha’: 0}
Appendix D. Keywords of the ALRECO project
In the following, the keywords (in Spanish) of the ALRECO project are provided, according to their topic. For accessibility, English translations of the Spanish keywords are provided below each list.
Disclaimer: The following content contains language that may be offensive. Reader discretion is advised.
D.1 General hate keywords
Spanish: stopinvasion, mantero, manteros, topmanta, eurabia, terrorismo, atentado, atentados, guerra, sumision, boicot, frontera, fronteras, expulsion, frnaco, fdanco, franko, hideologia.
English: stop invasion, street vendor, street vendors, street market, Eurabia, terrorism, attack, attacks, war, submission, boycott, border, borders, expulsion, Franco (misspelled variants: frnaco, fdanco, franko), ideology.
D.2 Keywords for cultural minorities and religious ethnicities
Spanish: negro, negra, negros, negras, panchito, panchita, panchitos, panchitas, indio, india, indios, indias, conguito, conguita, conguitos, conguitas, machupichu, machupichus.
English: black (man/woman/men/women), “panchito” (pejorative for Latin American), Indian (man/woman/men/women), “Conguito” (derogatory), Machu Picchu (used pejoratively).
D.3 Keywords for the Roma community
Spanish: gitano, gitana, gitanos, gitanas, romani, romanis, patriarca, hitana, hitano.
English: gypsy (man/woman/men/women), Romani, patriarch, misspellings (hitana, hitano).
D.4 Keywords for the Jewish community
Spanish: judio, gudio, judia, judios, judias, sion, sionista, sionistas, hebreo, israeli, israelis, holocuento, holocausto, hitler, jitler, Hittler, nazi, nasi, jeit, ebreo.
English: Jew (male/female/singular/plural, with misspellings), Zion, Zionist(s), Hebrew, Israeli(s), “holo-hoax” (holocuento), Holocaust, Hitler (with misspellings), Nazi (with misspellings), derogatory variants (jeit, ebreo).
D.5 Keywords about migrants (first dataset)
Spanish: latinos, latinas, rumano, rumana, rumanos, rumanas, subsahariano, subsahariana, subsaharianos, subsaharianas, sudamericano, sudamericana, sudamericanos, sudamericanas, sudaca, sudacas, chino, china, chinos, chinas, chinito, chinita, chinitos, chinitas, clandestinos, clandestinas, clandestino, clandestina, mena, menas.
English: Latino(s), Romanian(s), Sub-Saharan (male/female/singular/plural), South American(s), “sudaca” (derogatory for Latin Americans), Chinese (man/woman/men/women), “chinito” (diminutive/derogatory), clandestine/illegal migrant(s), unaccompanied minor(s) (MENA, from Spanish acronym).
D.6 Keywords about migrants (second dataset)
Spanish: migracion, inmigracion, migrante, migrantes, inmigrante, inmigrantes, extranjero, extranjera, extranjeros, extranjeras, refugiado, refugiada, refugiados, refugiadas, marroqui, marroquis, magrebi, magrebis, africano, africana, africanos, africanas, latino, latina.
English: migration, immigration, migrant(s), immigrant(s), foreigner(s) (male/female), refugee(s) (male/female), Moroccan(s), Maghrebi(s), African(s), Latino(a).
D.7 Keywords about the Muslim community
Spanish: musulman, musulmana, musulmanes, musulmanas, musulmanos, mslmns, moro, mora, moros, moras, islamico, islam, arabe, arabes, sarraceno, sarracenos, yihadista, yihadistas, yijadista, yijadistas, islamista, islamistas, fundamentalista, fundamentalistas, fundamentalismo, hijab, hiyab, burca.
English: Muslim(s) (male/female, with misspellings), “moro” (derogatory for Arabs/Muslims), Islamic, Islam, Arab(s), Saracen(s), jihadist(s), Islamist(s), fundamentalist(s), fundamentalism, hijab (with spelling variants), burqa.
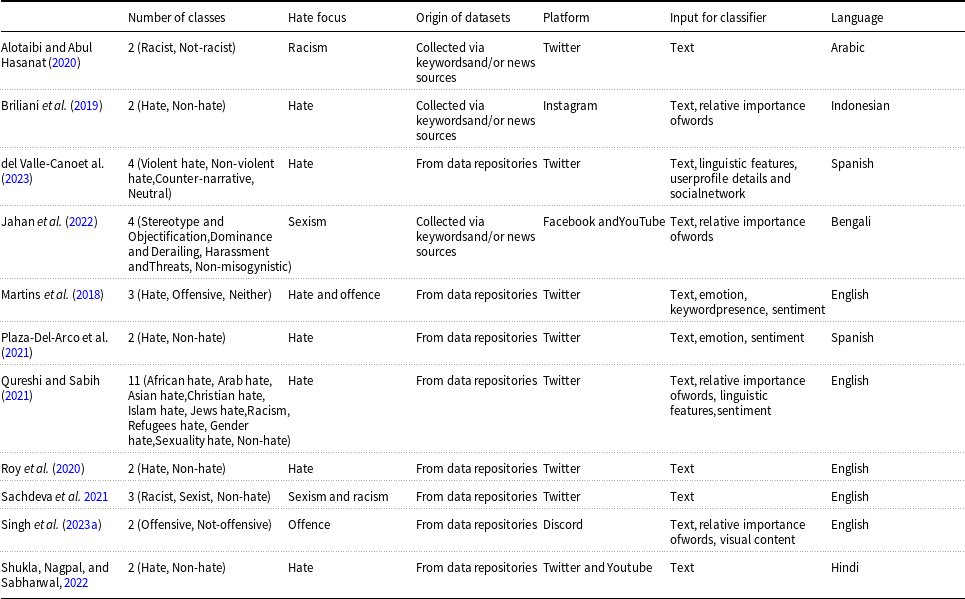
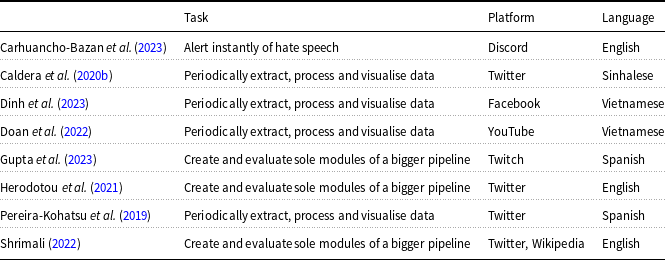
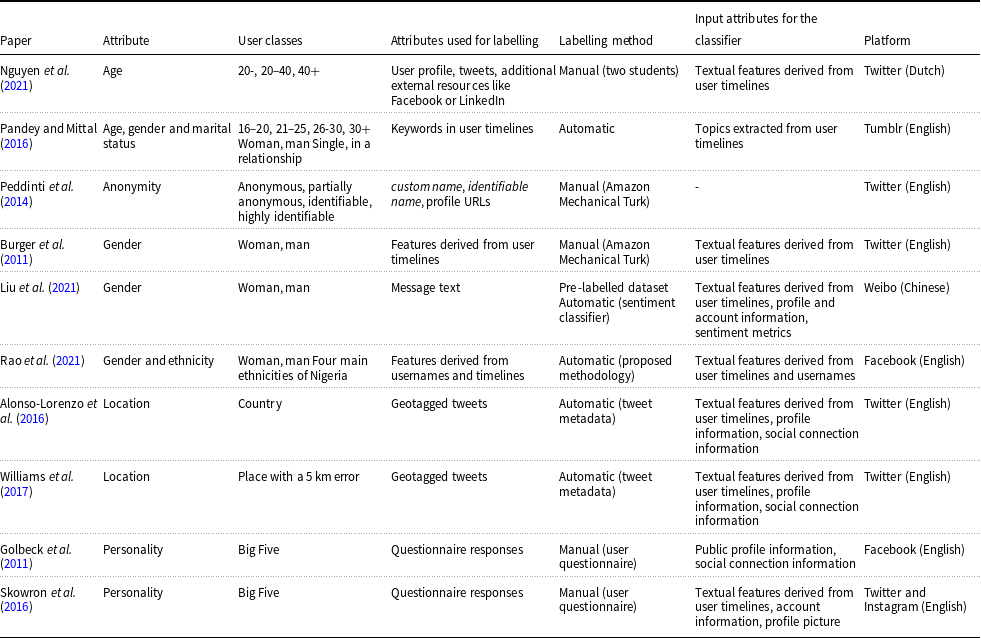
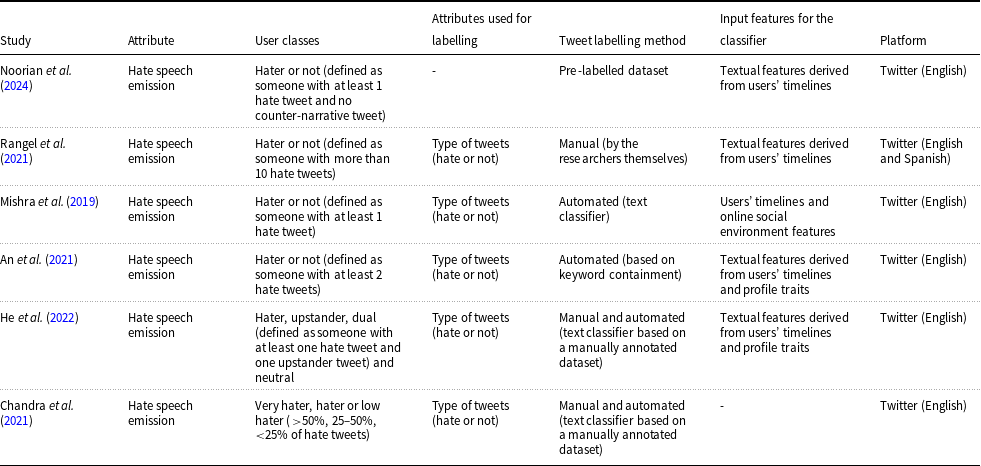
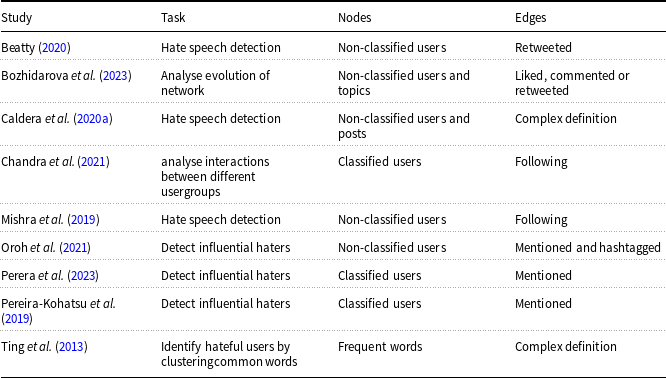

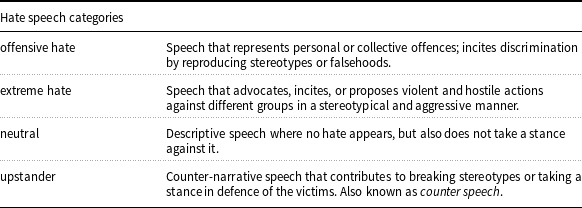


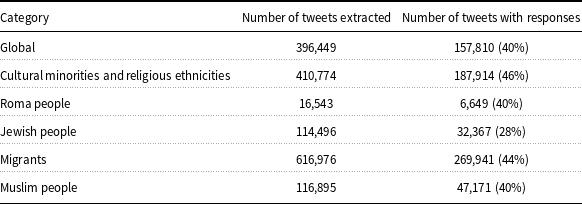
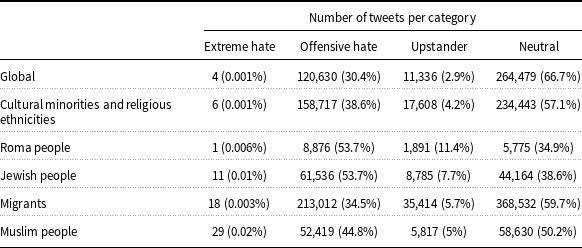
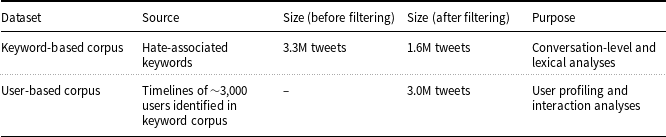
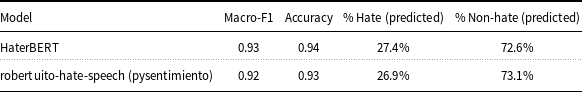
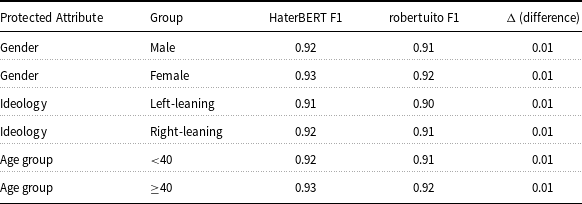


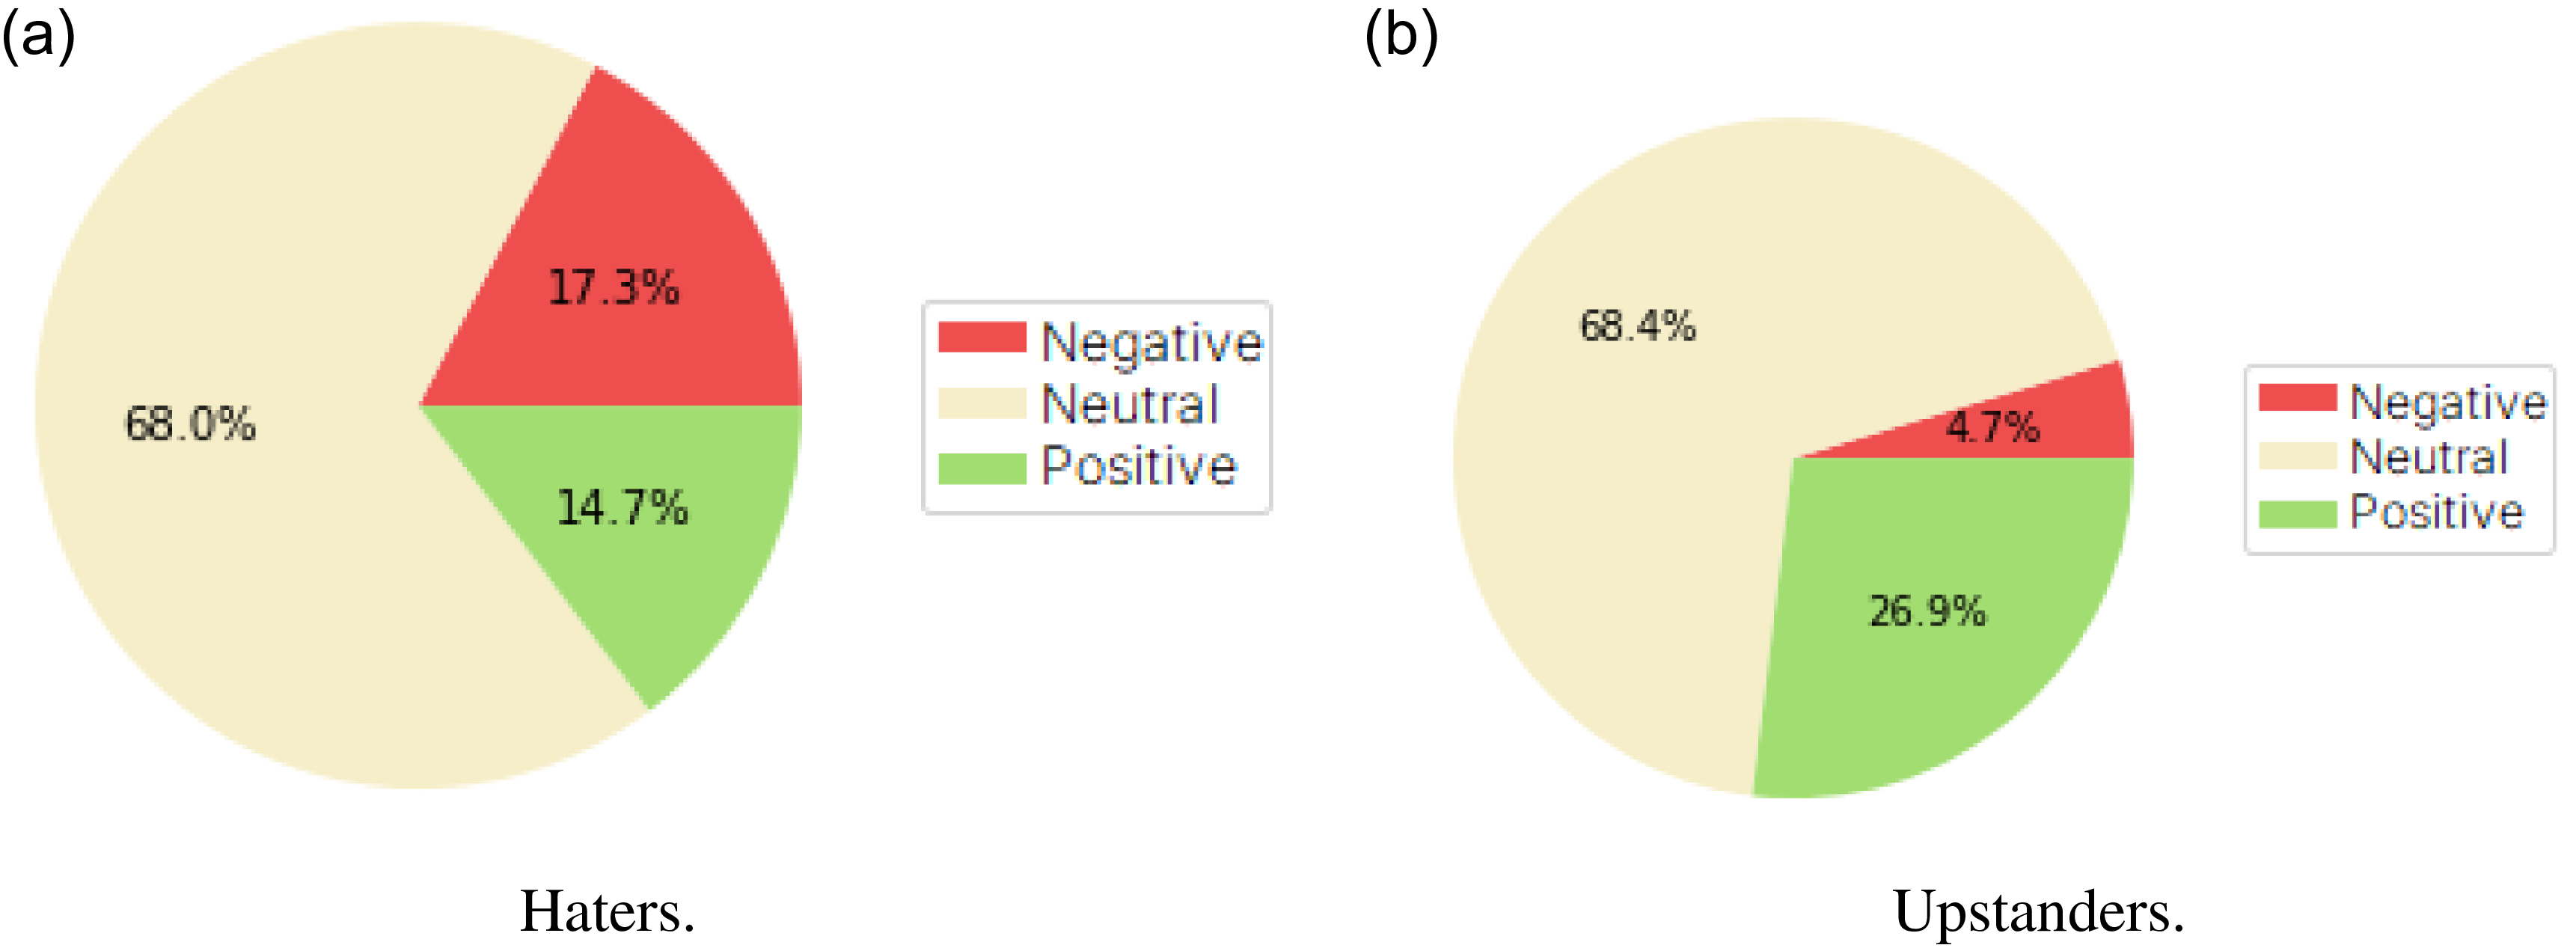

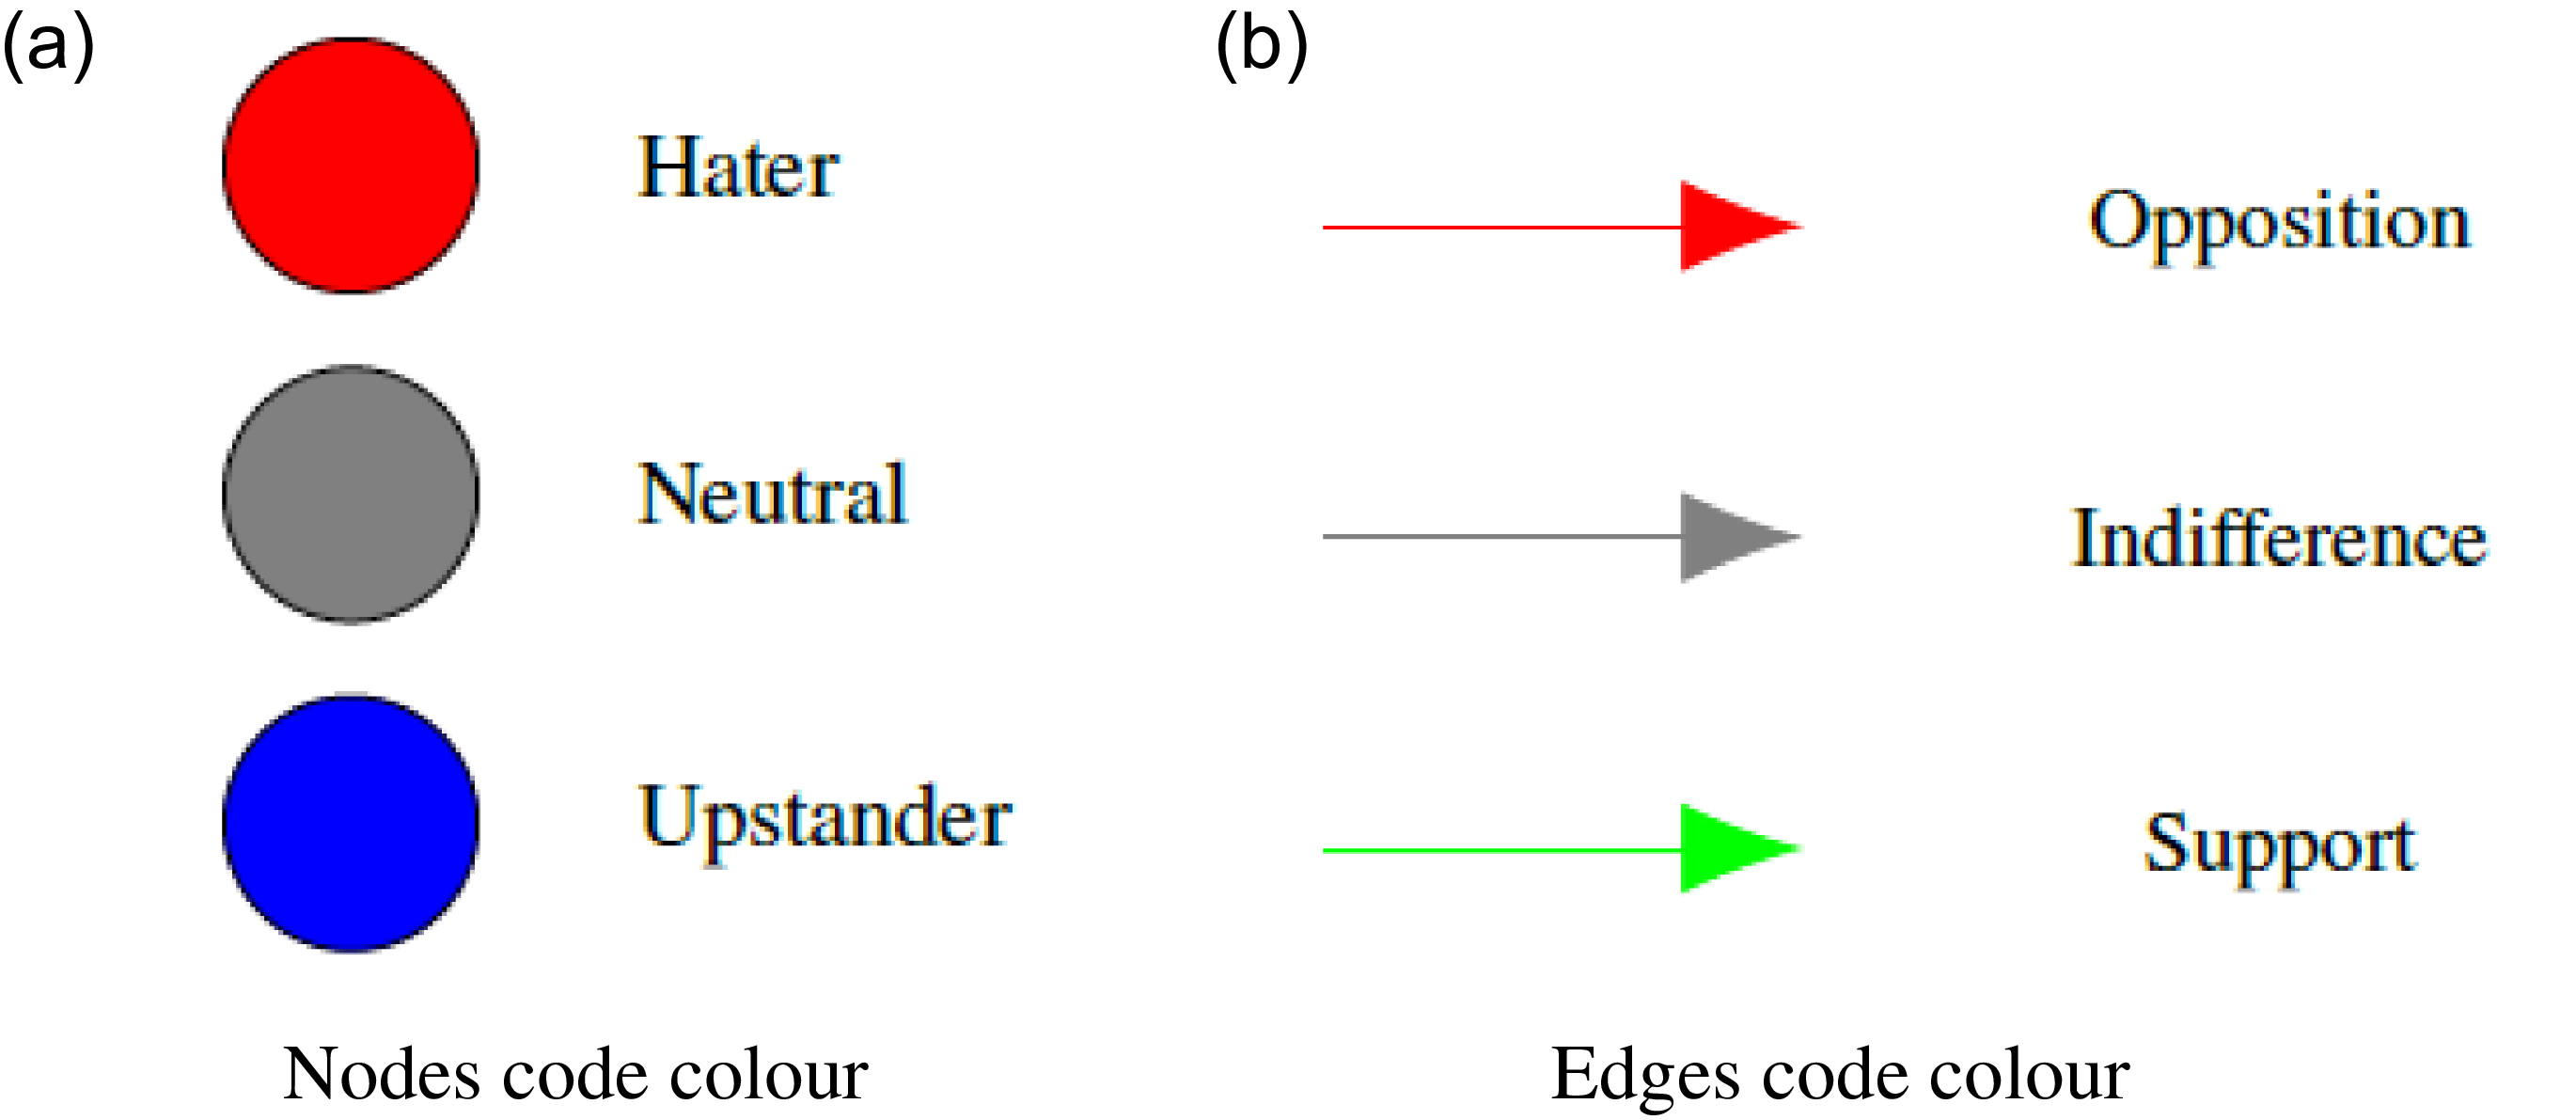
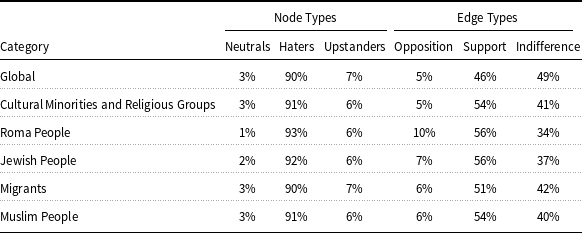


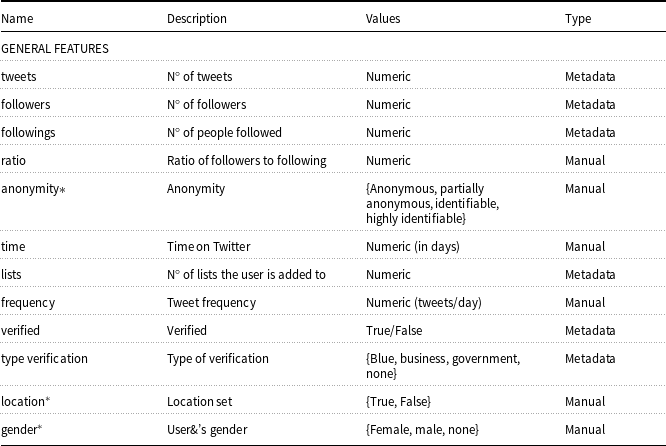
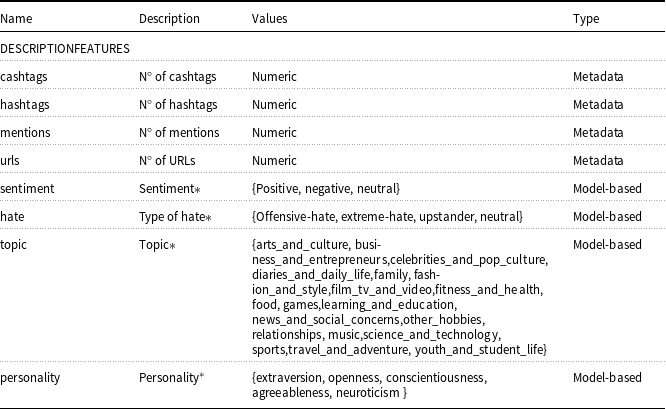

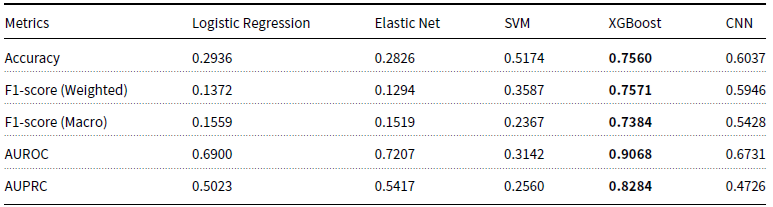

 Open access