


1. Introduction
Characterizing the flow structures around wall-mounted rectangular prisms has received extensive attention in fluid mechanics, partly due to their extensive engineering applications and partly because of their complex wake flow coherent structures. Particularly at low Reynolds numbers, understanding the wake of a wall-mounted large-depth-ratio prism (defined as the ratio of streamwise length to width,  $DR \geq 2.5$) has significant impacts in improving the design of electronic chips for more reliable cooling systems, biomedical devices and small heat exchangers (Rastan, Sohankar & Alam Reference Rastan, Sohankar and Alam2017). In these applications, a comprehensive knowledge of the flow characteristics around the prisms is critical in optimizing the design and performance of various devices, such as fast-response and accurate measuring equipment, e.g. hotwire systems. Here, the depth ratio is defined as the ratio of streamwise length over the prism width, and aspect ratio is defined as the ratio of prism height over the prism width. Reynolds number is defined as $Re=h U_{0} / \nu$, where $h$ is the prism height, $U_0$ is free-stream velocity calculated at the domain inlet and $\nu$ is the fluid kinematic viscosity.
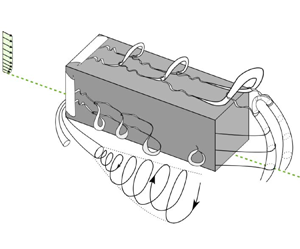
Wake models developed for the flow around wall-mounted cylinders date back to the work of Taneda (Reference Taneda1952). Since then, there have been several modifications and upgrades of these models, based on the cylinder characteristics and flow conditions. Wang et al. (Reference Wang, Zhou, Chan, Wong and Lam2004) proposed a comprehensive model for the wake of a wall-mounted square prism, which is shown in figure 1. In this model, Wang et al. (Reference Wang, Zhou, Chan, Wong and Lam2004) classified the wake vortices of a wall-mounted cylinder into four different structures. Tip and base vortices are formed close to the prism tip and junction, respectively. The spanwise vortices are Kármán-type structures in the middle height of the body, and the horseshoe vortex is formed in front of the body and continues to the wake region (see figure 1a). Later on, Wang & Zhou (Reference Wang and Zhou2009) modified this model based on their detailed experimental study of the near-wake region immediately behind the prism (see figure 1b). This study revealed the presence of a single arc-like structure with a single dominant frequency within the near-wake region. They argued that spanwise, tip and base vortices are inherently connected and form an arch-type structure regardless of the prism aspect ratio.
Wake models for wall-mounted square prisms: (a) the original model developed by Wang et al. (Reference Wang, Zhou, Chan, Wong and Lam2004); (b) the modified model by Wang & Zhou (Reference Wang and Zhou2009).

In the past decade, many researchers have attempted to identify characteristics of the coherent structures in the wake of a prism, including their shape, quantity and fluctuating features. Sattari, Bourgeois & Martinuzzi (Reference Sattari, Bourgeois and Martinuzzi2012) reported the presence of two different shedding regimes in the wake of a square prism with a height-to-width ratio (aspect ratio) of 4 at  $Re=1.2\times 10^4$. Wang & Zhou (Reference Wang and Zhou2009) were the first to introduce the idea of simultaneous occurrence of symmetric and anti-symmetric vortex shedding, which was later further developed by Sattari et al. (Reference Sattari, Bourgeois and Martinuzzi2012). They identified the presence of symmetric vortex shedding with low-amplitude wake fluctuations that exhibits $\pm 30^{\circ }$ variation in the $180^{\circ }$ phase shift of Kármán-type vortices. The origin of this alternative shedding regime was attributed to the modification of Kármán vortices with the tip vortex. Thus, the probability of symmetric vortex shedding formation was higher near the tip region. Note that the alternation between these two regimes, i.e. symmetric and antisymmetric vortex shedding, changed the amplitude of fluctuations without affecting the value of dominant frequency. Contrarily, Kawai, Okuda & Ohashi (Reference Kawai, Okuda and Ohashi2012) used proper orthogonal decomposition to identify different wake structures with distinct frequencies formed around a wall-mounted square prism with aspect ratio of $AR=2.7$ and depth ratio of $DR = 1$ at Reynolds numbers of 9400 and 15 600. In this case, the boundary layer was thin ( $\delta /h=0.3$, where $\delta$ is the boundary layer thickness). Similarly, Porteous, Moreau & Doolan (Reference Porteous, Moreau and Doolan2017) characterized four shedding regimes in the wake of a wall-mounted square prism based on the number of peak frequencies observed in the wake flow fluctuations. Their experiments involved prisms with a broad range of aspect ratios, while fixing all other parameters: $0.29\leq AR \leq 22.9, DR = 1$ and $\delta /w=1.3$ (where $w$ is the prism width) at $Re=1.4\times 10^4$. Performing a detailed acoustic and hotwire measurement in the wake, Porteous et al. (Reference Porteous, Moreau and Doolan2017) reported the presence of no peak frequency for regime 0 ( $AR<2$), one dominant peak for regime 1 ( $2< AR<10$), two distinct peaks for regime 2 ( $10< AR<18$) and three peaks for regime 3 ( $18< AR$). Most recently, da Silva et al. (Reference da Silva, Chakravarty, Sumner and Bergstrom2020) identified multiple mean wake structures, instead of a single arc-type structure, formed around a wall-mounted square prism with $AR=3$ and $DR = 1$ at $Re=500$. It was suggested that these structures have different origins, contrary to the models discussed by Wang & Zhou (Reference Wang and Zhou2009). Particularly, da Silva et al. (Reference da Silva, Chakravarty, Sumner and Bergstrom2020) showed that the structures on the upper surface of the prism appear to fade, while wake tip vortices are formed because of three-dimensional deflection of the separated flow from the side leading edges of the prism. da Silva et al. (Reference da Silva, Chakravarty, Sumner and Bergstrom2020) suggested that the differences observed in their wake model compared with that of Wang & Zhou (Reference Wang and Zhou2009) may be attributed to the time-averaged nature of their wake compared to the instantaneous wake considered by Wang & Zhou (Reference Wang and Zhou2009). These studies, although limited to small depth ratios, have revealed that there are multiple structures formed in the wake with distinct characteristics depending on the prism aspect ratio and Reynolds number.
The cross-sectional shape of a prism is one of the most critical parameters that can affect its wake. Uffinger, Ali & Becker (Reference Uffinger, Ali and Becker2013) investigated the effect of cross-sectional shape of a wall-mounted geometry (i.e. square prism, prism with elliptical afterbody and prism with wedge in front) on its wake using both numerical and experimental methods at  $Re=1.28\times 10^4$ for the case of $AR = 6$ and $1 \leq DR \leq 2.5$. They determined that the prism cross-sectional shape affects the strength of the interaction between flow structures formed over the prism top face and Kármán-type vortices along the side faces. In another numerical study, Rastan et al. (Reference Rastan, Sohankar and Alam2017) observed one major difference between the wake of square prisms and previous findings for circular cylinder wake flows. By simulating the flow around a square prism ( $AR = 7$ and $DR = 1$) at $Re = 40\unicode{x2013}250$, Rastan et al. (Reference Rastan, Sohankar and Alam2017) showed that there was only one dominant frequency along the span of a square finite wall-mounted prism, contrary to a circular finite wall-mounted cylinder. It is also notable that the vortex lines behind a square wall-mounted prism connected at the free end of the body. This suggested that there was only one coherent structure in the wake region behind a square prism (Rastan et al. Reference Rastan, Sohankar and Alam2017). These studies highlighted that the width of a prism is only critical if it results in the interaction of structures on either side of the body, whereas the depth of the prism can affect the formation of dominant structures in the wake.
Reynolds number is another parameter whose effect on the wake of small-depth-ratio prisms ( $DR < 2.5$) has been comprehensively investigated in the literature. Wei, Chen & Du (Reference Wei, Chen and Du2001) visualized the effect of increasing Reynolds number on the horseshoe vortex structure in front of a wall-mounted prism with $AR = 2$ and $DR = 1$ at $Re = 1000\unicode{x2013}32\,000$. They showed that increasing Reynolds number can make the horseshoe vortices oscillatory. Furthermore, these oscillations have a significant impact on the upstream velocity fluctuations. Zhang et al. (Reference Zhang, Cheng, An and Zhao2017) conducted direct numerical simulation (DNS) to analyse the flow around a square prism ( $AR = 4$ and $DR = 1$) at six Reynolds numbers in the range $50\unicode{x2013}1000$ and found that changing the Reynolds number can also change the types of flow structures behind the wall-mounted square prism. They identified a new type of transitional flow structure, namely ‘six vortices’ in addition to dipole and quadrupole structures using a combination of $Q$ criterion, $\lambda _2$ criterion and streamline flow visualizations. Rastan et al. (Reference Rastan, Sohankar and Alam2017) classified the wake of a small-depth-ratio prism with $AR=7$ and $DR = 1$ into five different regimes based on their DNS results: steady flow $(Re<75)$, transition to unsteady flow $(75< Re<85)$, laminar flow $(85< Re<150)$, transition to turbulent flow $(150< Re<200)$ and turbulent flow $(Re>200)$. They determined that the wake is characterized by dipole structures at $Re<85$, whereas quadrupole structures dominate the wake at $Re>150$. At $85< Re<150$ the wake is dominated by other structures that transition the flow into what is called a hexapole state. The presence of extra vortices in hexapole wakes is attributed to the bending of streamlines at the lower part of the prism. These studies provided a detailed description of the wake of small-depth-ratio prisms, while the wake dynamics of a large-depth-ratio prism is still unknown. Yet, it is expected that longer prisms see a more stable shear layer, which is attributed to a delayed unsteady transition.
Due to the wake complexities behind wall-mounted prisms, they have been considerably utilized in the literature to analyse the performance and accuracy of different numerical methods. Bruno, Salvetti & Ricciardelli (Reference Bruno, Salvetti and Ricciardelli2014) used both numerical and experimental studies at  $Re=2\times 10^4\unicode{x2013}6\times 10^4$ to examine the flow characteristics around a two-dimensional cylinder with a chord-to-depth ratio of 5. They observed a good agreement between experimental and numerical results with respect to the base pressure, coefficient of drag and Strouhal number. However, there exists a significant discrepancy between numerically and experimentally obtained mean flow features on cylinder sides, lift force, mean pressure distribution and fluctuating pressure. These variations were attributed to the sensitivity of these parameters to the computational and experimental set-up and turbulence modelling techniques (Bruno et al. Reference Bruno, Salvetti and Ricciardelli2014). Guissart et al. (Reference Guissart, Andrianne, Dimitriadis and Terrapon2019) used a combination of numerical and experimental studies to show that neither unsteady Reynolds-averaged Navier–Stokes nor delayed detached eddy simulations can provide accurate estimation of the flow around two-dimensional rectangular prisms at different angles of attack and $Re$. For detached flows, delayed detached eddy simulations provided a better prediction of the flow dynamics, while unsteady Reynolds-averaged Navier–Stokes models provided more accurate results for attached flows. Nevertheless, directly solving the Navier–Stokes equations (i.e. DNS) remains the most reliable method for capturing both steady and unsteady flow features in the wake of cylinders and prisms. As such, the current study directly solves the flow governing equations using highly refined spatial grid, which eliminates any potential numerical issues discussed in the literature.
The unsteady wake features of a wall-mounted short prism have been investigated with respect to the implications of the prism aspect ratio, boundary layer thickness on the wall and the flow Reynolds number. However, there have not been any attempts to examine the wake transition mechanisms for a large-depth-ratio (length-to-height ratio) prism. Most importantly, understanding the large-depth-ratio (long wall-mounted prism) wakes and vortex dynamics can be highly valuable in designing medical devices and micro-heat-transfer facilities. One of the primary motivations for this research was to investigate the feasibility of implementing long wall-mounted prisms as flow manipulators in arteries and pipes at low Reynolds numbers. This research illustrates that the flow dynamics of a long wall-mounted prism is very complicated due to the simultaneous existence of different spatio-temporal structures. In this study, we focused on examining the unsteady wake transition behind a wall-mounted rectangular large-depth-ratio prism. To this effect, we characterized the wake of a prism with a depth ratio of  $5$ at $Re=250\unicode{x2013}1200$. The main objective of this study was to identify and characterize unsteady wake transition associated with a short-height (low $AR$) and long-depth (large $DR$) prism. The implications of a large depth ratio can be significant since it allows for shear-layer reattachment following its initial separation from the sharp leading edge of the body. This dynamic behaviour is very different from that of a short depth ratio prism, in which case the leading-edge shear layer rolls out into the near-wake region. The paper structure involves a detailed description of the methodology and numerical set-up in § 2. The results and discussions are included in § 3, followed by conclusions in § 4.
2. Methodology
This study considers the flow around a large-depth wall-mounted prism with a rectangular cross-sectional shape (see figure 2). The prism width ( $w$) is used to normalize all dimensions and length scales. For the long rectangular prism, the width is $h=1.2w$ and the length (depth) is $l=5w$, implying a depth ratio of $DR=5$, which is sufficiently large to allow for shear-layer reattachment. These dimensions were motivated by the design of electronic chips and a particular flow manipulator for biomedical applications (Jia Reference Jia2020). Moreover, the dimensions of the prism are selected to ensure that the separated shear layer from the prism leading edges will reattach to their corresponding face based on the observations of Okajima (Reference Okajima1982). They have previously identified that ‘the critical streamwise-length-to-height-ratio for an infinitely span (2D) cylinder is 3–4’. There is also another complementary study by the authors, which focuses on the effect of depth ratio ( $0.1 \leq DR \leq 5$) on wake structures at low and moderate Reynolds numbers. Discussion of the depth ratio effect, however, falls outside the scope of the current study, where the focus remains on identifying and characterizing the transition mechanisms associated with increasing Reynolds number that results in an unsteady wake behind a long (large-depth-ratio) prism. For small-depth-ratio prisms, e.g. high-aspect-ratio square prisms ( $AR = 7$), this transition occurs at relatively low Reynolds numbers, that is, $Re=75\unicode{x2013}80$ (Rastan et al. Reference Rastan, Sohankar and Alam2017). The transition in that case is attributed to roll-up of the shear layers and instabilities of structures in the immediate wake (Dousset & Potherat Reference Dousset and Potherat2010). The results of Zargar et al. (Reference Zargar, Gungor, Tarokh and Hemmati2021a) for a long prism, however, clearly identified that the wake remains steady even at $Re=250$ for the case of larger-depth-ratio prisms, and the shear-layer roll-up does not appear to occur. Instead, it is hypothesized that the instability of shear layers and that of the horseshoe structure contributes to the unsteady transition of the wake behind larger-depth-ratio prisms, such as the geometry considered here. The uniform inlet velocity corresponds to Reynolds numbers of $Re=250, 350, 500, 575, 600, 625, 650, 675, 700, 725, 750, 850, 1000$ and $1200$ based on the prism height ( $h$), which resulted in slightly varying boundary layer thickness shown in table 1. The prism schematics are shown in figure 2, in which the cross-sectional area is in the $yz$ plane and it extends in the streamwise ( $x$) direction. Here, the non-dimensionalized lift, drag and pressure coefficients are calculated using the following equations:
 \begin{equation} C_l = \frac{F_z}{0.5 \rho U_0^2 lw} , \quad C_d = \frac{F_x}{0.5 \rho U_0^2 hw} , \quad C_p = \frac{p}{0.5 \rho U_0^2}, \end{equation}
where  $F_z, F_x$ and $p$ are the lift force, drag force and pressure, while $lw$ and $hw$ are the effective cross-sectional areas for calculating coefficients. Pressure on the lower prism face is set to zero since this plane is connected to the ground plane (zero ground clearance) while calculating force and moment coefficients.
Schematic of the computational domain (not to scale).

Boundary layer thickness at the prism leading edge ( $x/h = -4.17$ and $y/h = -7.5$) at different Reynolds numbers.
2.1. Numerical set-up
The flow around a wall-mounted long rectangular (long-depth-ratio) prism was directly simulated at 14 different Reynolds numbers. The numerical formulations are based on the incompressible Navier–Stokes and continuity equations, which are solved using OpenFOAM (Jasak, Jemcov & Tukovic Reference Jasak, Jemcov and Tukovic2007). The streamwise ( $x$), spanwise ( $y$) and normal ( $z$ ) dimensions of the computational domain, shown in figure 2, are $L=40h$, $W=12h$ and $H=6h$, respectively. The front face of the body is located $L_{up}=10h$ from the inlet and $L_{do}=25h$ from the outlet. A non-homogeneous grid made of $5\times 10^6\unicode{x2013}30\times 10^6$ hexahedral elements is used for simulating the flow at $Re=250\unicode{x2013}1200$. The spatial grid distribution for the prism at $Re=1000$ is shown in figure 3. The grids were designed to maintain the maximum value of $y^+$ below 0.55 at the walls, which enabled capturing flow fluctuations due to the separated flow. The boundary layer thicknesses at the prism leading edge at different Reynolds numbers are reported in table 1, which indicates a maximum consecutive change of less than $7\,\%$ at $Re\geq 600$. The time steps were set for each case, such that the maximum Courant–Friedrichs–Lewy number remained below $0.8$.
The spatial grid distribution for the long rectangular prism at  $Re=1000$. Top view at $z/h=0.5$ (a) and side view at $y/h=0$ (b).

The spatial and temporal discretizations of the governing equations were second-order accurate. The normalized residual momentum root mean square of  $10^{-6}$ was set as the criterion for convergence for each time step. The PIMPLE algorithm, which is a combination of pressure implicit with splitting of operator and semi-implicit method for pressure-linked equations methods, was used for coupling the pressure and velocity fields (Jasak et al. Reference Jasak, Jemcov and Tukovic2007). The computational domain for each case was divided into 16–96 separate regions for parallel computing. The simulations were completed using Intel Platinum 8160F Skylake 2.1 GHz cores at $1.5 \times 10^4$– $15 \times 10^4$ core hours.
A constant uniform velocity was applied as the inlet boundary condition. Sides and upper walls of the domain were set to slip boundary condition, defined as no wall shear stress and no normal velocity through the boundaries. The outlet boundary was set as the Neumann boundary condition ( $\partial \phi / \partial n=0$, where $\phi$ is any flow variable). The no-slip boundary condition was applied to the ground and body faces. Details of the domain and boundary conditions are shown in the schematics of figure 2.
2.2. Verification and validation
Domain size is known to affect the numerical results, and so does spatial grid quality (Hemmati, Wood & Martinuzzi Reference Hemmati, Wood and Martinuzzi2018). To address the former, we designed our computational domain such that its size exceeded those of Shah & Ferziger (Reference Shah and Ferziger1997), Krajnovic & Davidson (Reference Krajnovic and Davidson1999), Yakhot, Liu & Nikitin (Reference Yakhot, Liu and Nikitin2006), Krajnović & Davidson (Reference Krajnović and Davidson2005a) and Krajnović & Davidson (Reference Krajnović and Davidson2005b). To begin, Zargar et al. (Reference Zargar, Gungor, Tarokh and Hemmati2021a) performed a domain size analysis for a long rectangular prism at  $Re=250$ and determined that a domain with $L\times W \times H=35h\times 12h\times 6h$ is sufficiently large to capture the main flow features. Here, $x$ (or $L$) refers to the streamwise, $y$ (or $W$) to the spanwise and $z$ (or $H$) to the normal flow directions. We expand on these efforts by examining the effects of domain size and grid quality using our most extensively used cases of $Re=1000$ and $1200$.
Our domain sensitivity study is based on three different cases: Domain 1 ( $L\times W \times H=35h\times 10h \times 5h$), Domain 2 ( $L\times W\times H=40h\times 12h \times 6h$) and Domain 3 ( $L\times W\times H=45h \times 16h \times 8h$). The results for the three cases are compared in figure 4, which show that the maximum difference between two consecutive cases is less than $2$%. This suggests that Domain 2 is adequate for our analysis. Note that the current verification and validation studies were completed using only 3–4 through-times, which provided sufficiently good agreement. The main simulations, however, were completed for 20 through-times, the final 16 of which were only used for the wake analysis. Through-time ( $T$) is defined as the time required for fluid to travel from the inlet to the outlet without interruption or disturbance. It is calculated as $T = L/U_0$.
Comparing the profile of time-averaged streamwise velocity ( $\bar {u}/U_0$) in the wake of the long rectangular prism at $Re=1000, x/h=2$ and $z/h=0.5$ using (a) different domain sizes and (b) different grid refinements.

Although detailed sensitivity studies of the spatial grid quality are reported in Zargar et al. (Reference Zargar, Gungor, Tarokh and Hemmati2021a) and Zargar, Tarokh & Hemmati (Reference Zargar, Tarokh and Hemmati2021b), we further expanded on this grid analysis at  $Re = 250$ and 1000 to strengthen the confidence in our results. To this end, three different spatial grids were created and tested at $Re = 1000$ for three different $y^+_{max}$ values, the comparative results of which are shown in figure 4(b). The small discrepancies (less than 2 %) may be due to the short run time of the verification cases. Furthermore, five different grid resolutions were created and tested based on $y^+_{max} = 1.3$, 0.9, 0.55, 0.25 and 0.125 at $Re = 250$. As shown in figure 5, the surface pressure and wake velocity distributions remain constant when $y^+_{max} \leq 0.55$. Therefore, the utilized mesh in the present study is sufficiently refined.
Grid refinement analysis for the wake of the long rectangular prism at  $Re = 250$ using (a) time-averaged coefficient of pressure distribution ( $\overline {c_p} = {\bar {p}}/{0.5\rho U_0^2}$) on the surface of the prism at its middle height ( $z/h = 0.5$) and (b) time-averaged streamwise velocity ( $\bar {u}/U_0$) at $x/h=2$ and $z/h=0.5$.

There are no comprehensive studies, to the best of our knowledge, of the wake of prisms considered here in terms of their shape, dimensions and  $Re$. Thus, the overall computational methodology and numerical solver have been validated against DNS results of Saha (Reference Saha2013) and Zhang et al. (Reference Zhang, Cheng, An and Zhao2017) for the special case of a wall-mounted square prism with aspect ratio of $AR = 4$. Details of this validation study can be found in Zargar et al. (Reference Zargar, Gungor, Tarokh and Hemmati2021a,Reference Zargar, Tarokh and Hemmatib), which clearly identify that the numerical platform and set-up, which are identical between the validation case and the actual research simulations for the current study, are sufficiently accurate, including the spatial grid quality, boundary conditions, solvers and numerical methodology.
According to Moin & Mahesh (Reference Moin and Mahesh1998), accurate computation of the flow characteristics requires that the smallest resolved length scale be of the same order of magnitude as the Kolmogorov length scale, i.e.  $O(\eta )$. Here, the Kolmogorov length scale is defined as $\eta = (\nu ^3/\epsilon )^{{1}/{4}}$ with $\epsilon$ representing the turbulent energy dissipation rate, defined as $\epsilon =\nu ({\partial u'_i}/{\partial x_j})({\partial u'_i}/{\partial x_j})$, where $u'_i$ is the fluctuating velocity (Yakhot et al. Reference Yakhot, Liu and Nikitin2006). In order to confirm the validity of our results, the grid size definition of $\varDelta _{max}=\max (\delta x, \delta y, \delta z)$ is used to calculate the ratio of grid size to Kolmogorov length scale in figure 6. The distribution of this ratio is shown on two different planes at $y/h = 0$ and $z/h = 0.5$.
The ratio of grid size, defined as  $\varDelta _{max}=\max \{ \delta x , \delta y , \delta z \}$, to Kolmogorov scale at (a) $z/h = 0.5$ and (b) $y/h = 0$.

For comparison, the  $\max (\delta x, \delta y, \delta z) / \eta$ parameter in the simulations of Richter, Iaccarino & Shaqfeh (Reference Richter, Iaccarino and Shaqfeh2012) is 22.7 at $x/h = 10$ for a circular cylinder. They utilized the finite-volume method to simulate the flow around the cylinder. In another research, Yao et al. (Reference Yao, Thomas, Sandham and Williams2001) simulated the wake of a rectangular trailing edge using the finite-difference method and reported $5 \leq \max (\delta x, \delta y, \delta z) / \eta \leq 5.5$ at $x/h = 10$. In the present research, however, we have ensured that $\max (\delta x, \delta y, \delta z) / \eta < 4.5$ in the same locations reported by Richter et al. (Reference Richter, Iaccarino and Shaqfeh2012) and Yao et al. (Reference Yao, Thomas, Sandham and Williams2001). Furthermore, Saeedi, LePoudre & Wang (Reference Saeedi, LePoudre and Wang2014) and Yakhot et al. (Reference Yakhot, Liu and Nikitin2006) showed that the grid size over the Kolmogorov length scale should be less than 5 at critical regions, such as near wake and horseshoe vortex, to capture the wake details behind a wall-mounted square prism at $Re=12\,000$ and $5610$, respectively. In their study, they defined grid size as $\varDelta =(\delta x \times \delta y \times \delta z)^{1/3}$, which they proceeded to use for calculating $\varDelta /\eta$. Moreover, Zargar et al. (Reference Zargar, Gungor, Tarokh and Hemmati2021a) performed a detailed numerical study of the wake of a similar rectangular prism at different incidence angles and confirmed the validity of the simulations using the same criterion at $Re=250$. To ensure that the results of the present research are valid up to $Re=1200$, the grids are refined with increasing Reynolds number so that the mentioned criterion is correct for all cases. As shown in figure 7, the ratio of $(\delta x \times \delta y \times \delta z)^{1/3} / \eta$ remained below $5$ for the entire domain at $z/h=0.5$, which constitutes the location of the largest velocity gradient in the unsteady wake amongst all our simulations. This condition is met for both the time-averaged and instantaneous fields, examples of which are shown at $Re=1000$ (figure 7a) and $Re=1200$ (figure 7b). This hints at the accuracy of the numerical results that are resolved to the Kolmogorov scales. Notably, the grid is more refined close to the ground plane or the top of the prism with a lower ratio of $\varDelta /\eta$ (not shown here for brevity).
Contour of the ratio of grid size to Kolmogorov length scale, defined as  $\varDelta =(\delta x\times \delta y \times \delta z)^{1/3}/\eta$, for (a) the time-averaged field at $Re=1000$ and (b) instantaneous field at $Re=1200$ along the $xz$ plane at (top) $z/h=0.5$ and (bottom) $y/h=0$.

3. Results
The source of wake unsteady transition is examined for a long wall-mounted prism, which highlights differences from the same mechanisms in the wake of other bluff bodies. We begin by classifying and characterizing the instantaneous flow coherent structures and type of the shedding phenomenon at different Reynolds numbers following the wake transition from steady to unsteady flow. This was achieved using time series of wake visualizations, wake profiles and phase portrait assessments. Then, the effect of this new unsteady wake transition mechanism on the mean wake topology is examined for a range of Reynolds numbers. Mean-flow characterizations enable analysis of the integral effect of the unsteady wake transition mechanism in the flow. This also allows for a thorough comparison of the wake topology between steady and unsteady regimes. This motivates further comparison with the mean wake models developed for short-depth-ratio wall-mounted prisms (Zhang et al. Reference Zhang, Cheng, An and Zhao2017; da Silva et al. Reference da Silva, Chakravarty, Sumner and Bergstrom2020). Thus, there can be further discussion of and evidence for the change in wake topology and transition mechanisms for long wall-mounted prisms. Combining these findings, we introduce a new skeleton model for the unsteady wake of long prisms with  $DR \geq 5$. Particularly, we report all possible flow variations around the long prism due to changing Reynolds number in the current study. Therefore, note that various phenomena, flow features and wake characteristics that are reported at a single Reynolds number are also observed for other cases, unless explicitly stated otherwise. Similar flow features are not reported at different $Re$ for brevity.
3.1. Instantaneous flow structures
The wakes are first examined quantitatively and qualitatively for the range  $Re=250\unicode{x2013}1200$ to determine the flow regimes with respect to steady and unsteady features. To this effect, figures 8–15 look at the isosurface of $Q$ criterion (normalized by $U_0$ and $h$) and force coefficients. By inspection, these results correspond to a transition from steady to unsteady flow at $Re=625\unicode{x2013}650$. Thus, we use quantitative and qualitative techniques to characterize the wake transition mechanism and its unsteady features.
Isosurface of  $Q^*=0.18$ in the wake at an arbitrary time for (a) $Re = 250$, (b) $Re = 350$, (c) $Re = 500$, (d) $Re = 575$, (e) $Re = 600$ and ( f) $Re = 625$. Here, separation bubbles are denoted by ‘SB’ and horseshoe vortex and vortex loops are respectively highlighted as ‘HV’ and ‘VL’.

Isosurface of  $Q^*=0.18$ at an arbitrary time at (a) $Re = 650$, (b) $Re = 675$, (c) $Re = 700$, (d) $Re = 725$, (e) $Re = 750$, ( f) $Re = 850$, (g) $Re = 1000$ and (h) $Re = 1200$. Here, hairpin vortices on the upper and side faces are respectively denoted by ‘ ${\rm HP}_U$’ and ‘ ${\rm HP}_S$’, separation bubbles are denoted by ‘SB’ and horseshoe vortex and vortex loops are respectively highlighted as ‘HV’ and ‘VL’.

Long prism lift coefficient versus normalized time ( $t^* = (t-t_0)U_0/h$) at (a) $Re = 500$ and (b) $Re = 1000$.

(a–d) Phase portraits based on the instantaneous lift and drag forces and (e–h) PSD of the lift force signal at different Reynolds numbers.

Instantaneous velocity profiles at  $x/h = 0.5$ and $x/h = 5$ at an arbitrary time. The black dashed lines show the velocity signal at $-4 \leq y/h \leq 0$ and solid red lines display the profile at $0 \leq y/h \leq 4$.

Instantaneous vorticity distribution on the prism's mid-height plane ( $z/h = 0.5$) at different Reynolds numbers: (a) $Re = 625$, (b) $Re = 650$, (c) $Re = 675$, (d) $Re = 700$, (e) $Re = 725$, ( f) $Re = 750$, (g) $Re = 850$, (h) $Re = 1000$ and (i) $Re = 1200$.

Isosurface of  $Q^*=0.18$ in the wake of the long rectangular prism at six consecutive time instants at $Re=1000$: (a) $t= t_0$, (b) $t= t_0 + \tau$, (c) $t= t_0 + 2\tau$, (d) $t= t_0 + 3\tau$, (e) $t= t_0 + 4\tau$ and ( f) $t= t_0 + 5\tau$. Hairpin vortices on the upper and side faces are respectively denoted by ‘ ${\rm HP}_U$’ and ‘ ${\rm HP}_S$’, and horseshoe vortex and vortex loops are respectively highlighted as ‘ ${\rm HV}$’ and ‘ ${\rm VL}$’. Here, $\tau = 1.0417 h/U_0$.

Isosurface of  $Q^*=0.18$ from (a,c) side view and (b,d) top view in the wake of the long rectangular (large-depth-ratio) prism at the same arbitrary time for the case of (a,b) $Re=650$ and (c,d) $Re=1000$.

Figures 8 and 9 compare the instantaneous wake of the long prism at different Reynolds numbers using normalized  $Q$ criterion. The wake exhibited a steady behaviour at $Re \leq 625$ in figure 8, where there were no indicators of a vortex shedding process or unsteady features. Increasing the Reynolds number to 650 in figure 9(a), however, coincided with the formation of hairpin-like structures (‘HP’) on the upper face of the prism (denoted by ‘ ${\rm HP}_U$’). This hints at a completely different wake dynamics for a long prism compared with a traditional (small-depth-ratio) prism, in which case the wake unsteadiness is attributed to the near-wake instabilities (Dousset & Potherat Reference Dousset and Potherat2010). Notably, the first unsteady coherent structures with the shedding process in the current study are the hairpin structures on the prism upper face. Increasing Reynolds number to $Re = 675$ leads to the formation of hairpin structures on both sides and upper faces. For the case of $Re = 650$, hairpin structures on the sides (denoted by ‘ ${\rm HP}_S$’) do not appear to be formed, although there exist separation bubbles on the prism side faces, similar to the upper face (see figure 9a). The absence of side hairpins ( ${\rm HP}_S$) can be attributed to the effect of boundary layer, horseshoe vortex or the difference in the prism size (width and height). Further increasing the Reynolds number leads to the formation of a significantly complicated wake at $Re \geq 750$ in figure 9(e–h), the characterization of which forms the basis of the current research. More analyses and discussions of this observation are included later.
The unsteady nature of the flow at  $Re \geq 650$ in figure 9 can also be recognized from the instantaneous variations of the force coefficient, following the practice of Rastan et al. (Reference Rastan, Sohankar and Alam2017). As shown in figure 10, the prism lift coefficient converged to a constant number at $Re = 500$, which coincided with the $Q$ criterion revealing no sign of unsteady flow in figure 8(c). Contrarily, the prism lift coefficient at $Re = 1000$ exhibited substantial variations over time, which agrees with unsteady wake observations in figure 9(g).
To classify the state of the wake at different Reynolds numbers, we look at a number of statistical and global flow parameters. Figure 11 shows the phase portrait of the instantaneous lift and drag alongside the power spectral density (PSD) of instantaneous lift. Here, the horizontal axis shows the normalized frequency by prism height and free-stream velocity, while the vertical axis ( $S(\textit {f})$) shows the spectral energy distribution normalized by frequency. In figure 11(a), the phase diagram of the flow at $Re = 650$ was a simple closed loop, which indicated the periodic nature of the flow at this state. The PSD of lift fluctuations highlighted a single peak as well as its harmonics in the frequency spectrum, which corresponded to Strouhal number of $St = 0.43$. Notably, similar phase diagram trajectories have been reported for the initiation of unsteady motions due to the vortex shedding phenomenon in the wake of a cube by Meng et al. (Reference Meng, An, Cheng and Kimiaei2021). Further increasing the Reynolds number to $675 \leq Re \leq 725$ led to the formation of multiple phase trajectories, which did not collapse on each other. Figure 11(b) shows an example of this flow behaviour at $Re = 700$. Looking at the PSD of lift further revealed a strong dominant peak frequency at $St = 0.51$. Since the behaviour of the phase diagram for this case was neither precisely periodic nor purely chaotic, we would refer to the wake as ‘quasi-periodic’, which follows the descriptions provided previously by Meng et al. (Reference Meng, An, Cheng and Kimiaei2021) and Karniadakis & Triantafyllou (Reference Karniadakis and Triantafyllou1989). Increasing the Reynolds number beyond $750$ led to the formations of a chaotic trajectory in the phase portrait as shown in figure 11(c,d). The PSD diagram of lift at $Re = 750$ showed a dominant frequency of $St = 0.56$, while the frequency spectrum at $Re= 1000$ did not exhibit a dominant frequency. The presence of a signature at $St = 0.56$ for the case of $Re = 750$ is more satisfactorily demonstrated in figure 19, which shows the velocity signal frequency analysis. This is consistent with the observations of Li, Sun & Roux (Reference Li, Sun and Roux1992), who described the chaotic behaviour of the flow by a sudden broadening of the spectrum and loss of periodicity in time signals. This can be a reason for the absence of a dominant peak in lift fluctuations at $Re = 1000$. This non-periodic behaviour of lift may also be related to significant complexities of flow dynamics and the presence of multiple coherent structures in the flow at $Re = 1000$. Notably, the dominant frequency of lift fluctuations for the long wall-mounted prism (revealed by the PSD diagrams) increased by increasing the Reynolds number.
The symmetry of vortex shedding phenomenon is another feature that can help classify the effect of increasing Reynolds number on the wake dynamics behind long prisms. To this effect, figure 13 shows the instantaneous vorticity distribution on a plane at  $z/h = 0.5$. As shown in figure 13(a–e) for the case of $650 \leq Re \leq 725$, shed vortices were aligned coherently, such that the wake retained its symmetry along the $y$ direction. Further increasing the Reynolds number ( $Re \geq 750$) distorted the shedding symmetry and led to the creation of large vorticity regions (locally) in figure 13( f–i). This asymmetry intensified at higher Reynolds numbers. To carefully analyse the wake symmetry, figure 12 shows the instantaneous velocity profiles at an arbitrary location in the wake at an arbitrary time. As highlighted by these results, it is confirmed that the wake lost its spanwise ( $y$-axis) symmetry at $Re \geq 750$ since the velocity profile at $-4 \leq y/h \leq 0$ did not collapse on those at $0 \leq y/h \leq 4$. However, for $Re \leq 725$, the velocity profiles captured at two opposite sides of the wake collapsed entirely on each other. Moreover, the creation of chaotic behaviour in the $C_l$– $C_d$ phase diagram (figure 11) coincides with the creation of non-symmetric vortex shedding, such that both these phenomena initiated at $725 < Re \leq 750$. Based to these analyses, the wake of a long prism can be divided into three regimes: steady regime at $Re \leq 625$, regular (stable) unsteady regime at $650 \leq Re \leq 725$ and irregular (unstable) unsteady regime at $Re \geq 750$. In the present research, we defined stable unsteady as a flow state in which shed vortices are organized, such that spacing between consecutive structures does not change. In the unstable unsteady state, however, irregularity of the flow field caused by increasing Reynolds number prevents organized vortex shedding. These results are consistent with the wake classification proposed in the literature for the transition process of wall-mounted prisms’ flow field. To this effect, in the regular (stable) unsteady regime ( $650\leq Re \leq 725$), the coherent structures are organized such that the flow field resembles those described by a laminar unsteady wake for small-depth-ratio prisms (Rastan et al. Reference Rastan, Sohankar and Alam2017). In the irregular (unstable) unsteady regime ( $Re \geq 750$), however, coherent structure breakdown can be observed from the $Q$ criterion visualizations, and the loss of spanwise symmetry makes this regime comparable to what is described as a transitional or turbulent flow for the short prisms.
We now focus on characterizing the spatio-temporal features of different coherent structures in the wake. Flow visualizations in figures 14 and 15 reveal that the separated shear layers from the prism leading edges have reattached to the body (Zargar et al. Reference Zargar, Gungor, Tarokh and Hemmati2021a,Reference Zargar, Tarokh and Hemmatib). Notably, separation bubbles are formed on the prism side and upper faces, e.g.  ${\rm SB}_{1}$, ${\rm SB}_{2}$ and ${\rm SB}_{3}$. The separation bubbles started shedding hairpin-like vortices at $Re \geq 650$, which changed the flow behaviour from steady to unsteady, e.g. ${\rm HP}_{U1}, {\rm HP}_{U2},\ldots, {\rm HP}_{S5}, {\rm HP}_{S6}$ in figures 14 and 15. This is contrary to the observations for a short-depth low-aspect-ratio prism. Hwang & Yang (Reference Hwang and Yang2004) and Yakhot et al. (Reference Yakhot, Liu and Nikitin2006) reported that hairpin-like vortices were formed in the wake of a short-depth-ratio, short-aspect-ratio prism ( $DR = 1$ and $AR = 1$) due to destabilization of tip vortices formed in the wake. Furthermore, Wang & Zhou (Reference Wang and Zhou2009) reported the formation of an arc-type structure, which may shed into the wake in the form of a hairpin-like vortex. However, Dousset & Potherat (Reference Dousset and Potherat2010) reported that the shedding process in the wake of a square prism was triggered by the interaction of tip and base vortices. They showed that the tip and legs of the hairpin-like vortices were respectively formed by the tip and base vortices, such that both of these structures actively contributed to onset of the unsteady wake. In the current study of long rectangular prisms, however, the source of unsteadiness was attributed to the destabilization of leading-edge separation bubbles. This strongly altered the instantaneous and time-averaged wake dynamics, which is thoroughly analysed below. Transition of the separation bubble from steady to unsteady, which leads to the formation of hairpin structures, has been observed and previously reported in the literature on the suction surface of an airfoil (Kawai et al. Reference Kawai, Okuda and Ohashi2012) or pressure surface of cascade blades (Wissink Reference Wissink2003). To the best of our knowledge, however, such transition mechanisms leading to the interaction of hairpin vortices and formation of vortex loops have not been previously reported for wall-mounted prisms. This is mostly due to the limited studies of the flow dynamics behind large-depth-ratio wall-mounted prisms. To show the wake evolution with respect to formation and dynamics of hairpins and vortex loops, figure 14 shows the coherent structures at six consecutive time instances. By inspection, it is revealed that hairpin-like structures are formed by separation of the leading-edge upper and side shear layers ( ${\rm SB}_1$ and ${\rm SB}_2$ in figure 14) from the body. Initially at $t=t_0$ in figure 14(a), this leads to the formation of ${\rm HP}_{U3}$ and ${\rm HP}_{S2}$ on the top and side faces of the prism, respectively. Over time, ${\rm HP}_{U3}$ convects downstream along the surface of the prism until it starts separating from the body at $t=t_0+3\tau$ in figure 14(d). In the meantime, ${\rm HP}_{S2}$ moves downstream until it loses its coherence after $t=t_0+3\tau$ in figure 14(d). Since the origin of upper hairpin-like structures is similar to that of the side hairpins, and they maintain their coherence in a larger spatial region, the early suppression of the side hairpins was presumably related to their interactions with newly formed vortex loops that spawn out of the horseshoe vortex. Thus, ${\rm HP}_{S2}$ appears diffused at $t=t_0+4\tau$ in figure 14(e), while ${\rm HP}_{U3}$ has grown substantially on the upper wake and maintained its coherence. At $t=t_0+4\tau$ (figure 14e), there is no apparent resemblance of ${\rm HP}_{S2}$ on the side wake. The results in figure 14 clearly identify that a similar evolution takes place for hairpin-like structures formed on the top surface, namely ${\rm HP}_{U4}$ in figure 14(b), ${\rm HP}_{U5}$ in figure 14(c), ${\rm HP}_{U6}$ in figure 14(d) and ${\rm HP}_{U8}$ in figure 14( f), which coincides with the formation of ${\rm HP}_{S3}\unicode{x2013}{\rm HP}_{S8}$ in figures 14(b)–14( f), respectively. As the side structures grow, their interactions with the newly formed vortex loops (i.e. ${\rm VL}_5\unicode{x2013}{\rm VL}_8$) contribute to their suppression prior to separation from the body. Yet, the wake is dominated by hairpin-like structures shed from the top surface of the prism and vortex loops that spawn out of the horseshoe vortices.
Now that we have established the evolution of the wake structures in time, we focus on the wake topology at  $Re=650$ and 1000 more closely in figure 15. At $Re=1000$ (figure 15c,d), hairpin-like structures created on the side and upper faces of the prism partially detached from the surface. This process is apparent from both the top and side views of the isosurface plots on all three faces of the prism. Hairpins were then carried downstream towards the trailing edge with their legs still connected to the body, i.e. ${\rm HP}_{U1}, {\rm HP}_{U2}, {\rm HP}_{S1}$ and ${\rm HP}_{S2}$ in figure 15. At the trailing edge, these structures distorted in the streamwise direction as they detached from the body with no apparent lateral movements or distortions, i.e. ${\rm HP}_{U3}$ in figure 15. There were also similar structures formed on the sides of the prism due to the separation of the shear layer on those surfaces. Initially, these structures had similar spacing compared with those on the top. This indicated that their formation mechanism may be similar. However, the spacing of the side hairpins shortened as they convected downstream along the prism. The side hairpin-like structures appeared to interact with horseshoe vortex fairly early on after their formation, for example ${\rm VL}_4$ and ${\rm HP}_{S1}$ in figure 15. The side hairpins lost their coherence prior to the prism trailing edge; however, the upper structures maintained their coherence until they shed into the wake. Since the natures of hairpins on the prism upper and side faces are similar, suppression of the side hairpins was probably due to the induced flow by horseshoe vortex (vortex loops) that dominated sides of the wake and led to elongation and distortion of the side hairpin-like structures. Contrary to the wake evolution at $Re=1000$, the wake only included upper hairpin-like structures at $Re=650$, which is the first case with unsteady features. Namely, ${\rm HP}_{U1}\unicode{x2013}{\rm HP}_{U3}$ are formed along the top surface of the prism in figure 15(a). Moreover, there are no signs of the horseshoe structure transforming into vortex loops. We observe consistent behaviour in time-averaged circulations associated with these structures at $Re=650$ and 1000, which are discussed later in § 3.2, i.e. figure 28. A combination of these observations hint at the likelihood that suppression of side hairpin-like structures at lower $Re$ may be connected with the strength of horseshoe vortices.
A horseshoe structure consisting of three parts was apparent in front of the prism in figures 14 and 15. The formation of a multiple-structure horseshoe has already been reported by Hwang & Yang (Reference Hwang and Yang2004). However, horseshoe vortices formed in front of a small-depth-ratio wall-mounted prism are typically steady at  $Re \leq 1500$. Increasing the Reynolds number to $1600\leq Re \leq 2000$ coincides with transitioning of the horseshoe structure to unsteadiness (Lin, Ho & Dey Reference Lin, Ho and Dey2008). However, we observed the transformation of horseshoe structures to what appears to be unsteady vortex loops (denoted by ‘VL’ in figures 14 and 15) at $Re \geq 650$ for a long prism in the current study. To the best of our knowledge, the existence of vortex loops that originate from the horseshoe vortex has not been reported in the wake of a rectangular prism. As shown in figure 16, the $Q$ criterion did not exhibit any unsteady structures or vortex loop formations at $-4.2 \leq x/h \leq -2.3$, prior to the interaction of horseshoe vortex with side hairpins. To get a better understanding of this transition mechanism at relatively lower Reynolds numbers, we placed multiple probes (data collection points) in front of the prism and close to the prism middle depth following the formation of vortex loops. There was no evidence of unsteady behaviour with a specific dominant frequency prior to the prism leading edges (no upstream wake fluctuations). This corresponded to the initial observation that the onset of unsteady behaviour was instabilities associated with the hairpin-like vortices that originated from the prism leading-edge separation bubbles. Furthermore, contrary to the probe in front of the prism, the probe at the prism middle depth showed a dominant frequency of $St = 0.24$. Therefore, the present results highlighted that the horseshoe structure is originally steady at $Re \leq 1200$, which agrees with previous observations of Lin et al. (Reference Lin, Ho and Dey2008). The interaction of horseshoe structure and hairpin-like vortices accelerates the horseshoe transition to unsteadiness, such that it occurs at lower Reynolds numbers compared with shorter (small-depth-ratio) prisms. Notably, the vortex loops created by the interactions of the horseshoe and side hairpin-like structures are unsteady. However, there are no indicators of a secondary instability that changes the dominant frequency or strength of vortex loops. This observation changes at relatively high incident angles, say $i = 45^\circ$, where Zargar et al. (Reference Zargar, Gungor, Tarokh and Hemmati2021a) reported the presence of a low-frequency osculation that was associated with helical structures in addition to the peak frequency associated with the typical vortex shedding process. Thus, there are no secondary oscillations or unsteadiness observed for the vortex loops, and the horseshoe vortex, in the current cases of incident angle of zero. It is also important to note that the spacing between and the frequency of hairpin-like structures formed on top of the long prism in the current study were different (longer spacing by a factor of $\approx 4h$) from those measured for vortex loops formed by the unsteadiness of horseshoe structures on the sides. This implies that unsteady transition of the horseshoe vortex may be inherently unrelated to the unsteadiness of prism upper face structures.
The isosurface of  $Q^*=0.18$ overlaid by the time-averaged streamwise velocity and instantaneous vorticity contours on five different planes at $Re = 1000$.

Contours of instantaneous  $z$ vorticity in figure 16 revealed the presence of arc-type structures with characteristics that resembled a typical arc-type structure in the wake. However, the complexity of the near wake prevented an apparent identification of these structures using instantaneous $Q$-criterion isosurface plots. Thus, we instead relied on the known effects of such structures on their surrounding flow to recognize their presence. The hairpin-like structures on the side of the prism lost their coherence approximately at the trailing edge ( $x/h=0$), while those on the top shed into the wake and lost their coherence in the near wake ( $x/h=2$). The breakdown of the top hairpin-like structures occurred at the exact location in which the arc-type structures formed, i.e. $0 \leq x/h \leq 2$. Therefore, one may attribute breakdown of the upper hairpins to their interactions with the arc-type structures. The horseshoe vortex loops lost their coherence farther downstream at approximately $x/h=7$. Horseshoe structures grew substantially by mid-point length (depth) of the prism, while there was not a substantial effect that could be associated with the side hairpin-like structures. Farther downstream at the trailing edge, horseshoe vortex loops grew in diameter to half of the prism height. Thus, they were evidently one of the dominant structures in the wake. This coincided with the distortion of side hairpin-like structures.
Figure 17 shows the instantaneous velocity profile along the side and top wakes, normal to the prism side and top faces. Hairpin-like structures ( ${\rm HP}_S$ and ${\rm HP}_U$ regions in figure 17) dominate these regions, as well as vortex loops (VL region in figure 17) on the side wake. It is apparent from these results that there is no velocity deficit formed by flow structures at the prism leading edge. Moving towards the prism trailing edge, however, there is a velocity deficit that grows with expanding hairpin-like structures. The velocity deficits associated with ${\rm HP}_S$ and ${\rm HP}_U$ reach their local maximum at 60 % and 30 % of the prism length (from the leading edge), respectively. These regions that exhibit a velocity deficit vanished before the trailing edge. Contrarily, velocity deficit due to the vortex loops started to form at 40 % of the prism length, and it grew larger moving into the wake. This coincided with the fact that hairpin vortices formed on the prism upper and side faces lost their coherence at the near-wake region, while vortex loops can be detected in the far wake as significantly large and coherent structures.
Instantaneous streamwise velocity profiles in the side and top wake, normal to the prism surfaces at  $Re = 1000$. The distances are normalized using the prism length ( $l = 5w = 4.17h$).

To analyse the strength of vortices created by the vortex loops and that of the hairpin-like structures, figure 18 shows the instantaneous circulation at an arbitrary time at  $Re = 1000$. Here circulation, which is a macroscopic measure of fluid rotation, is calculated using line integral about a closed contour of the velocity component vector that is locally tangent to the contour (Holton Reference Holton1979). We denoted instantaneous circulation because this value is calculated using an instantaneous velocity vector on the close contour surrounding coherent structures. The circulation of hairpin vortices decreased continuously as they moved downstream, such that they could not retain their coherence outside the near-wake region. In contrast, the circulation associated with vortex loops became larger at $x/h \geq 5$ compared to the mid-prism streamwise length, where they first were formed. Notably, instantaneous circulation of vortex loops slightly decreased immediately after the prism trailing edge. This may be related to local effects of side hairpin-like structures on the horseshoe vortex prior to their diffusion.
Contour of vorticity along with circulation of main structures on (a)  $xy$ plane at $z/h=0.5$ and (b) $xz$ plane at $y/h=0$ for the case of $Re=1000$.

The PSD of velocity fluctuations at three locations in the wake of a long rectangular prism at (a)  $Re=750$ and (b) $Re=1000$. Here $St_{hp1}, St_{hp2}, St_{H}$ and $St_{a}$ are captured at $w(-0.4, 0.5, 0.6), u(-0.4, 0, 1.5), u(-2, 1.0, 1.5)$ and $v(5, 0, 0.6)$, respectively.

To gain insight into the unsteady wake dynamics associated with the long prism, we explore the PSD of velocity and pressure using 115 different probes (data collection points) at  $x/h = -4.5, -3.7, -2, -0.4, 0.5, 2.5, 5$ and 10, $y/h = 2.5, -1.6, 0, 0.5, 1, 1.25, 1.6$ and 2.5 and $z/h = 0.6$, 1 and 1.5 over time. Amongst these points, four probes are selected with locations that coincide with those of the main structures in the flow. Thus, the dominant frequencies that are well distinguishable in the PSD diagrams are verified, by inspection, to correspond to particular structures in the wake. To reduce the effect of noise, each signal was divided into eight segments with 50 % overlap, and PSD values were averaged using these segments. The dominant peak Strouhal numbers are calculated with a resolution of $\approx 0.0018$. Looking at the frequency signatures in figure 19, there were multiple frequencies identified in the velocity field. The velocity fluctuations are shown at four locations in the wake to capture the dominant frequencies associated with the horseshoe, side and top hairpin-like vortex structures and the arc-type structure. There was a single dominant peak frequency identified at $(x/h, y/h, z/h) = (-0.4, 0.5, 0.6)$, which corresponded to Strouhal number of $St_{hp1}=f_{hp1} h/U_\infty =0.56$ for $Re=750$ and $St_{hp1}=0.64$ for $Re=1000$. By inspection of the wake evolution, these were associated with the hairpin-like structures formed on the side faces of the prism. At the top of the prism, that is, $(x/h, y/h, z/h) = (-0.4, 0, 1.5)$, the dominant frequency due to the separated hairpin-like structure was $St_{hp2}=0.56$ and $St_{hp2}=0.38$ for $Re=750$ and $1000$, respectively. Despite similar formation mechanisms for hairpin-like structures on top and side surfaces of the prism, which relate to the detached shear layers formed on its leading edges, there was a difference between their dominant frequencies at $Re=1000$. This variation may be attributed to the effect of horseshoe vortices on side and top wake structures, which were apparent almost immediately after the detachment of hairpin-like structures (see figures 14 and 15). This effect was trivial at $Re=750$ since the induced flow of the horseshoe vortex was insignificant, whereas it grew considerably for $Re=1000$ and affected the near-wake region. The evidence of weaker induced flow at $Re = 750$ is shown in the next section by visualizing the upwash and downwash flow in different regions.
We now focus on characterizing the frequency of horseshoe structures on the sides. There was a single dominant peak frequency identified at  $(x/h, y/h, z/h) =(-2, 1.0, 1.5)$, which corresponded to $St_{H}=0.24$ for both Reynolds numbers. This was associated with the horseshoe vortex loops formed on the sides of the prism. Tracking structures using the instantaneous vorticity contours revealed that the dominant frequency of $St_{H}=0.24$ was due to the velocity fluctuations induced by the main component of the horseshoe vortex. Combining frequency analysis using PSD at $(2.5h,0h,0.6h)$, $(5h,0h,0.6h)$ and $(10h,1h,0.6h)$ with tracking of structures in figures 16 and 21 revealed that $St_a=0.2$ was associated with the arc-type structures. In fact, the frequency associated with these structure was the only peak captured far downstream, where no other peak frequencies were observed. Thus, it was apparent that at $x/h \geq 10$, the fluctuations due to the arc-type structures dominated the far wake. Closer to the ground, however, we identified a second weaker peak at $St=0.24$, which was associated with the remaining effect of the vortex loop that spawns out of the horseshoe vortex. These results suggested that there were three distinct unsteady wake mechanisms due to the horseshoe, arc-type and hairpin-like structures. Conversely, Wang & Zhou (Reference Wang and Zhou2009), McClean & Sumner (Reference McClean and Sumner2014) and El Hassan, Bourgeois & Martinuzzi (Reference El Hassan, Bourgeois and Martinuzzi2015), to name a few, identified a single dominant frequency close to the Strouhal number of $St=0.1$ for the case of a square (short-depth) prism. Based on this observation, they all concluded that there was only one structure in the wake of a square prism. Thus, changing the origin of the shedding process from interactions between wake structures in short prisms to the leading-edge separation bubbles in long prisms led to the formation of unique flow features and multiple dominant frequencies in the wake of the latter. This significantly altered the unsteady wake of long prisms compared with that of short prisms or circular cylinders. These features included horseshoe vortex loops that dominate the side wakes, shear-layer roll-up behind the body and the formation of top and side hairpin-like structures.
To analyse the effect of Reynolds number on frequency signatures associated with the velocity field, we look at PSD of velocity fluctuations in figure 20 at  $Re = 650$ and 700, which considers similar locations to those in figure 19. To this effect, the frequency analysis at $Re = 650$ showed a single dominant frequency of $St = 0.43$ in the regions closer to the prism. There was also a very weak peak frequency identified in the far downstream wake that corresponded to $St = 0.2$. The immaculately periodic flow at $Re = 650$, which was identified using the $C_l$– $C_d$ portrait in figure 11, explains the presence of a dominant signature at $St = 0.43$ in the entire flow. The energy associated with the dominant frequency at $St= 0.43$ in PSD diagrams closer to the upper prism face was at least three orders of magnitude larger than that at other points. Furthermore, upper hairpins were the only structures formed and convected downstream coherently at $Re=650$. This hints at a correspondence between the dominant frequency of $St = 0.43$ and the formation of upper hairpin structures. The frequency associated with the vortex loops, $St_H$, at higher Reynolds numbers was not observed here since the horseshoe vortex instabilities did not form at $Re = 650$. The frequency spectrum at $Re = 700$ was qualitatively similar to the case of $Re = 750$, while the associated dominant frequencies related to the hairpins and vortex loops were lower in the former case. In a general sense, these results indicated that dominant frequencies of the structures originating from or affected by the leading-edge separation, namely side hairpin ( $St_{hp1}$), upper hairpin ( $St_{hp2}$) and vortex loops ( $St_H$), depended on the flow Reynolds number. However, the dominant frequency associated with the wake structures ( $St_a$) was not a function of Reynolds number.
The PSD of velocity fluctuations at three locations in the wake of a long rectangular prism at (a)  $Re=650$ and (b) $Re=700$. Here $St_{hp1}$, $St_{hp2}$, $St_{H}$ and $St_{a}$ are captured at $w(-0.4, 0.5, 0.6)$, $u(-0.4, 0, 1.5)$, $u(-2, 1.0, 1.5)$ and $v(5, 0, 0.6)$, respectively.

Figure 21 shows the instantaneous vorticity field in the wake at  $Re = 1000$. These results highlight the shedding processes at different locations in the domain. These processes can be associated with hairpin-like structures, horseshoe vortex loops or the arc-type structure. One of the unique features of the wake of a long prism is the presence of multiple structures with different shedding frequencies and streamwise convective velocities. Depending on their location and size, each of these structures can interact with the ground boundary layer, other structures or prism geometry. In figure 21, three consecutive hairpin-like and vortex loop structures have been identified using black boxes at different time steps. These vorticity contours are utilized to track the focal point of vortical structures and confirm the dominant frequency associated with each structure from the frequency analysis discussed earlier.
Contours of instantaneous vorticity in spanwise ( $y$) and normal ( $z$) directions at mid-planes ( $z/h = 0.5$ and $y/h = 0$) of the long prism at $Re = 1000$ during five consecutive instants: (a) $t = t_0$, (b) $t = t_0 + \tau$, (c) $t = t_0 + 2\tau$, (d) $t = t_0 + 3\tau$ and (e) $t = t_0 + 4\tau$. Here, $\tau = 1.0417 h/U_0$.

To understand the role of each structure in the wake development, figure 22 shows the cross-correlation analysis between streamwise velocity fluctuation captured immediately behind the prism ( $x/ h= 0.4$) and in the downstream wake ( $x/h = 10$). These results demonstrated that the velocity fluctuations at the side and upper part of the wake are more correlated with the downstream velocity fluctuations. For example, the velocity components at point ${\rm A}_5$ are more correlated with those at ${\rm B}_1\unicode{x2013}{\rm B}_3$, compared with streamwise velocity recorded at ${\rm A}_1$ and ${\rm A}_6$. Note that ${\rm A}_5$ is located close to the upper hairpin vortices, the role of which is very prominent in the near-wake flow characteristics, particularly before the flow behaviour became irregular. Furthermore, the correlation diagrams highlight that velocity fluctuations at ${\rm A}_4$ are more correlated than the points located in the mid-region, e.g. ${\rm A}_1$ and ${\rm A}_2$. This also highlights the critical role of horseshoe and vortex loops in the downstream wake development.
Cross-correlation analysis based on the dataset captured at  $Re = 700$. Here $f_a$ is the frequency associated with arc-type wake structure with Strouhal number of $St_a = 0.2$.

3.2. Mean flow structures
Time-averaged flow characterizations allow us to compare the wake of unsteady cases ( $Re \geq 650$) with those of low Reynolds number in which the flow remains steady ( $Re \leq 500$). Hence in this section, we aim to provide more comprehensive arguments on the integral effects of Reynolds number through a new wake transition mechanism from steady to unsteady flow. Historically, classification of the wake of a square prism and circular cylinders has involved the number of streamwise wake structures; see, for example, Sumner, Heseltine & Dansereau (Reference Sumner, Heseltine and Dansereau2004), Wang & Zhou (Reference Wang and Zhou2009), Rastan et al. (Reference Rastan, Sohankar and Alam2017) and Zhang et al. (Reference Zhang, Cheng, An and Zhao2017). In this section, we investigate the alteration of time-averaged wake of the long prism due to unique flow features discussed above. We also investigate the possibility of using a similar classification for the wake compared with that of a square prism.
The configurations of the streamwise structures are extracted from two-dimensional streamlines in figures 23 and 24. Evidently, a horseshoe vortex (identified by ‘HS’) was formed in front of the prism, which elongated in the streamwise direction. Zargar et al. (Reference Zargar, Gungor, Tarokh and Hemmati2021a) reported that the horseshoe system completely distorted before reaching the trailing edge of a long prism at  $Re=250$. Similar behaviour was observed here at $Re=350, 500$ and $600$, in which the flow remained steady. However, the horseshoe vortex extended into the wake at $Re \geq 650$. Another apparent wake evolution involved the formation of multiple streamwise structures at higher Reynolds numbers. The results in figures 23 and 24 showed horseshoe structures identified as $HS_1$ and $HS_2$ at $Re=750$ and $1000$, whereas there was only a single tip vortex observed at $Re=250, 350, 500$ and $600$. The horseshoe vortex elongation in the time-averaged flow is apparent in the same cases at which the instantaneous flow field shows the formation of vortex loops. Notably, similar to time-averaged horseshoe structures, vortex loops maintained their coherence in the near wake and actively contributed to the wake dynamics. The horseshoe vortex was not classified as a critical wake structure in many previous studies of small-depth-ratio ( $DR = 1$) prisms (Wang et al. Reference Wang, Zhou, Chan, Wong and Lam2004; Wang & Zhou Reference Wang and Zhou2009; Dousset & Potherat Reference Dousset and Potherat2010; Rastan et al. Reference Rastan, Sohankar and Alam2017; Zhang et al. Reference Zhang, Cheng, An and Zhao2017). This may be due to the fact that this structure bent towards the wake centre after the short prism trailing edges, and the strong wake structures minimized its effect. The wake topology for a long prism, however, differed in favour of a stronger and more influential horseshoe structure. The results showed that the horseshoe structure was significantly larger and stronger in unsteady flow regimes, such that it dominated the wake dynamics. Below, we identify a number of unique features associated with the dominance of these structures in the wake.
Time-averaged two-dimensional streamwise streamlines in the near-wake region at (a–d)  $Re=750$ and (e–h) $Re=1000$.

Time-averaged two-dimensional streamwise streamlines in the far-wake region at (a–c)  $Re=750$ and (d–f) $Re=1000$.

Mean streamwise vortices were identified as one of the most critical characteristics of the wake of finite cylinders and prisms (Zhang et al. Reference Zhang, Cheng, An and Zhao2017). Results shown in figures 23 and 24 are used to analyse the evolution and interaction of mean structures, which may have contributed to the unsteady flow behaviour at  $Re\geq 650$. A tip vortex structure, identified as ‘TV’, was formed close to the trailing edge of the prism in figure 23(b) for $Re=750$ and figure 23( f) for $Re=1000$. Similar to the observations of Wang & Zhou (Reference Wang and Zhou2009), it was apparent that the tip vortex represented a two-dimensional projection of the arc-type structure in the streamwise direction. Zhang et al. (Reference Zhang, Cheng, An and Zhao2017) and Rastan et al. (Reference Rastan, Sohankar and Alam2017) showed that the tip vortex formed in the near wake of a small-depth-ratio prism extended to the far wake at steady and unsteady flow regimes ( $100 \leq Re \leq 1000$). In the case of a long prism, however, the tip vortex cannot be observed after $x/h=1.5$ when the flow is unsteady. As shown previously, contrary to a small-depth-ratio prism, the leading-edge-separated shear layers could not roll into the near-wake region and contribute directly to the formation of the wake structures. Instead, they transformed into hairpin-like structures that interacted with the arc-type structure on the top and horseshoe structure on the sides of the prism. The formed tip vortex was suppressed in the near wake early on, such that it could not extend in to the wake (compare figures 23f and 23g). This may be due to interactions of upper hairpin-like and arc-type structures in the instantaneous flow field.
Steady wake of the long prism was characterized by the formation of tip vortices (Zargar et al. Reference Zargar, Gungor, Tarokh and Hemmati2021a,Reference Zargar, Tarokh and Hemmatib), whereas the time-average wake for the unsteady regime was dominated by base vortices. Figures 23 and 24 identified base vortices at both  $Re=750$ and $1000$, which were labelled as ‘BV’ and ‘SV’. Wang & Zhou (Reference Wang and Zhou2009) have previously identified that the simultaneous presence of tip and base vortices depends on the prism aspect ratio. Particularly, they showed that tip and base vortices could be observed simultaneously for cases of $AR\geq 5$, while they appeared separately at $AR=3$. Furthermore, Hussein & Martinuzzi (Reference Hussein and Martinuzzi1996) and Krajnovic & Davidson (Reference Krajnovic and Davidson2002) reported that for a square prism ( $AR=1$), the downwash is strong enough to reach the ground plane and suppress the upwash flow and base vortices. Similarly, the strong downwash effects in the steady wake of the long prism ( $Re\leq 250$) suppressed the upwash flow and base vortices (Zargar et al. Reference Zargar, Tarokh and Hemmati2021b). However, the wake topology changed at $Re\geq 650$, such that downwash effects were weakened in the far wake, allowing for the formation of base vortices. In fact, present results identified that there is a weak upwash flow induced on the mid-plane ( $y/h=0$) of the wake, which may be attributed to suppression of the tip vortex. Due to the boundary layer on the ground plane, the base vortices were set to form without a strong downwash flow. This constitutes the main mechanism, in which the mean wake topology changed at $Re=600\unicode{x2013}650$, the same range of Reynolds numbers associated with the unsteady flow transition.
As shown with two-dimensional streamlines in figure 24, there were two pairs of base vortices (identified as ‘BV’ and ‘SV’) in the wake at  $Re=750$, while there existed only one pair (BV) at $Re=1000$. This may be related to the dynamics of a primary vortical structure formed on the upper face of the prism at $Re=750$ (PV in figure 23b). This structure appeared distorted by $x/h=2$, likely due to its interactions with the arc-type structure. There were also no indications of this structure either at lower Reynolds numbers, e.g. $Re=250\unicode{x2013}350$, or higher Reynolds numbers (see figure 23f). Moreover, a secondary streamwise structure (SV in figure 23d) was formed starting at $x/h\approx 4$ and the same spanwise location for the case of $Re=750$. This secondary structure formed an additional pair of base vortices in the far wake (see SV in figure 24a). These secondary structures were also reported by Rastan et al. (Reference Rastan, Sohankar and Alam2017) and Zhang et al. (Reference Zhang, Cheng, An and Zhao2017) for a low-depth-ratio prism at moderate Reynolds numbers. Rastan et al. (Reference Rastan, Sohankar and Alam2017) attributed these ‘transitional vortices’ to bending of the streamlines due to the formation of the base vortex. In the case of the long prism in the current study, however, the secondary base vortex appeared prior to the main base vortex (BV) in the streamwise ( $x$) direction. Furthermore, the secondary vortex did not appear in the wake at $Re=1000$, although the main base vortex was apparent in this case. Thus, one may not attribute the formation of secondary base vortex (SV) to the main base vortex (BV). Instead, this structure could originate from the interactions of the primary structure (PV) and tip vortex structure (TV $_n$) in the near wake. This was not observed at $Re=1000$, in which case there were no primary vortices formed in the wake. Hence, the secondary structures can be regarded as ‘transitional’, implying that they appear during a small range of $Re$ as the wake transforms in both topology and dynamics.
The induced upwash and downwash flows are a common observation in the wake of wall-mounted prisms. In the current study, however, there were various mechanisms that led to multiple regions of induced upwash and downwash flow in the wake at  $Re \geq 650$. These regions are discussed individually to better illustrate the implications of wake structures discussed earlier. First, there was an induced downwash flow that had originated from the boundary layer on the upper part of the trailing edge and reached the ground plane very close to the prism trailing edge at $y/h=0$ (see figure 25). The second feature involved the formation of the tip vortex, which coincided with an induced upwash flow at $y/h=\pm 0.5$. The third induced flow was due to the downwash effect imposed by the horseshoe vortex at $y/h=\pm 0.5$, which led to the interaction of tip and horseshoe vortices. As shown previously, horseshoe vortices were elongated farther into the wake at higher Reynolds numbers. It is important to note that the size and location of this structure was not implied by two-dimensional streamwise plots in figure 23(c), corresponding to $x/h=2$ at $Re=750$. This is mainly attributed to the limitations of visualizing vortical structures by means of two-dimensional streamlines. As Jeong & Hussain (Reference Jeong and Hussain1995) explained, the complex (i.e. nonlinear) transition of vortices may lead to incomplete revolution of fluid particles around the vortex centre during the lifetime of the vortex. In this situation, two-dimensional streamlines fail to visualize a vortical structure. Zhang et al. (Reference Zhang, Cheng, An and Zhao2017) reported a similar observation for the failure of two-dimensional streamlines for capturing the size and location of vortices in the wake of a square prism. Therefore, two-dimensional streamwise streamlines should only be used for comparison purposes. In the current study at $Re=750$, the highlighted region labelled as ‘UT’ in figure 25 is larger than the similar region at $Re=1000$. Thus, the horseshoe vortex responsible for the downwash effect in the same region was captured precisely using two-dimensional streamwise streamlines in figure 23(g) at $Re = 1000$, and was not captured precisely in figure 23(c) at $Re = 750$.
Time-averaged distribution of normal ( $z$) velocity component on $yz$ planes in the near wake at (a–d) $Re=750$ and (e–h) $Re=1000$.

Contours of the normal ( $z$) component of velocity at the mid-plane of the prism are shown in figure 26. There existed a weak downwash flow at $Re=350$ and $500$, which started from the near-wake to the far-wake region. This confirmed the presence of a tip vortex in the downstream wake for these cases. As Reynolds number increased to $Re=750$ and $1000$, a strong downwash effect formed close to the trailing edge, which was followed by a rather weak upwash flow at $x/h=4$. This coincided with diffusion of the tip vortex near the prism trailing edge at $Re=750$ and $1000$ (see TV $_n$ in figures 23b and 23f). Note that the upwash flow in the wake was more substantial at $Re=750$, which confirmed the presence of an extra base vortex in the flow field. Therefore, a single tip vortex dominated the normal velocity distribution in the near and far wakes at $250 \leq Re \leq 500$, while base vortices dominated the near wake ( $0\leq x/h \leq 2$) and the far wake at $750 \leq Re \leq 1000$. At higher Reynolds numbers, the far wake consisted of a horseshoe system and base vortices.
Time-averaged normal ( $z$) component of velocity vector at $y/h=0$: (a) $Re=350$, (b) $Re=500$, (c) $Re=750$ and (d) $Re=1000$.

We now aim to quantitatively characterize the wake features and structures. To start, the surface pressure variations are examined at different Reynolds numbers in figure 27. Changing the Reynolds number from the steady regime to that with unsteady instantaneous features leads to a significant variation in the pressure distribution of side and front faces of the prism, but not the back face. Both the value of the pressure coefficient and the trend of its distribution change on varying the Reynolds number before and after the transition to unsteady wake. For example, increasing the Reynolds number during the steady wake regime leads to increasing pressure coefficient at the stagnation point on the prism front face. However, transition to unsteady wake at  $Re = 650$ leads to a substantial decrease in the stagnation pressure. This decreasing trend continues for higher Reynolds numbers up to $Re =1200$. This information can be critical when designing methods for flow control mechanisms.
(b) Time-averaged coefficient of surface pressure variations with Reynolds number on the middle prism height ( $z/h = 0.5$) $t$ axis shown schematically in (a).

As shown previously, the formation of hairpin-like structures on the upper and side faces of the prism was not triggered following the same conditions. Here, we aim to investigate the similarities between the separation bubbles formed on the prism side and upper faces. To achieve this, as shown in figure 28, the vortex circulation on the prism mid-planes is assessed at different Reynolds numbers. The circulation of these structures does not follow a similar behaviour with changing Reynolds number. This hints at very different characteristics of the separation bubbles on side and upper faces of the prism, although both of them originated from the leading-edge-separated shear layer. Furthermore, the circulation associated with the separation bubbles decreased dramatically, precisely before the formation of hairpin-like structures. These quantitative and qualitative observations hint at the idea that the circulation behaviour is connected with instabilities of the separation bubbles. This further reiterates our initial hypothesis on the correspondence of the unsteady wake transition with instabilities of the shear layer and the horseshoe vortex. These results indicate that the trend of the circulation of side and upper vortices changed at the same critical Reynolds numbers that were earlier identified for wake classifications. Figure 28(a) shows that the upper vortex circulation decreased in the steady regime ( $Re \leq 625$) and increased in the stable unsteady regime ( $650 \leq Re \leq 750$). However, this trend changed with further increasing Reynolds number such that the upper vortex circulation at $Re = 1000$ is less than those at $Re = 850$ and 1200. This behaviour may be attributed to the asymmetric vortex shedding in the unstable unsteady regime. Approximately similar trends can likewise be observed for the side vortex circulation at different flow regimes such that they can be identified using this qualitative assessment.
Variation of the normalized time-averaged circulation with Reynolds number for the two-dimensional vortex structure (a) on the upper face ( $y/h=0$) and (b) the side face ( $z/h=0.5$). These results are calculated within (a) $-4.16 \leq x/h \leq -2$ and $0.416 \leq y/h \leq 0.7$ and (b) $-4.16 \leq x/h \leq -2$ and $1 \leq z/h \leq 1.35$.

The highlighted saddle and nodal points on the upper and ground planes of figure 29 are attributed to the upper separation bubble and formation of the arc-type structure. The distances  $L_{uv}$ and $L_x$ are calculated at different Reynolds numbers as a measure for the upper separation bubble and wake size, respectively. The time-averaged size of the separation bubble on the upper face significantly increased with increasing Reynolds number in the steady regime, while its size remained approximately constant at $Re \geq 575$. Time-averaged wake size, however, exhibits three different flow regimes. At $250 \leq Re \leq 500$, increasing Reynolds number leads to a larger wake, while the wake size is almost constant when $575 \leq Re \leq 750$, and it decreases on further increasing the Reynolds number. This confirms that the wake characteristics are different in the stable unsteady regime, compared with the cases at $Re \geq 750$. Although interesting, the matured unsteady wake topology at Reynolds numbers higher than 1200 forms the basis of a complementary study and falls outside the scope of this paper. Here, the focus remains on understanding and characterizing the transition mechanism and early unsteady features of the flow.
Variations of the time-averaged distance of (a) saddle point on the upper prism face and (b) nodal point on the ground plane with Reynolds number.

The horseshoe vortex is another significant structure in the examined flow field whose characteristics should be analysed with respect to changing Reynolds number. Notably for the long rectangular prism, increasing Reynolds number changed the horseshoe structure from a single-part vortical structure at  $Re <500$ to a vortex system consisting of two pieces at $500\leq Re <575$ and to a vortex system with three elements at $Re \geq 575$. As shown in figure 30(a) for the case of $Re=1000$, the first (HS Part1) and third (HS Part3) components of the horseshoe structure maintained their coherence in the downstream region, while the second part (HS Part2), which is located farther from the prism surfaces, lost its coherence at approximately $x/h = -3$. To this effect, figure 30(b) shows the strength of different coherent components of the horseshoe vortex calculated on $yz$ plane at $x/h = -1$ for different $Re$. As shown in this figure, normalized circulation of HS Part1 increased with increasing Reynolds number ( $Re = 250$ to $575$), while it was approximately constant at Reynolds numbers close to unsteady transition, i.e. $Re = 650$. The strength of HS Part1 increased again on further increasing Reynolds number at $Re \geq 1000$. Similar to HS Part1, the strength of HS Part3 grew when increasing Reynolds number beyond the transitional range ( $Re \geq 1000$).
(a) Time-averaged  $Q$ criterion and time-averaged vorticity distribution plotted on the $x/h = -1$ plane at $Re=1000$. (b) Effect of changing Reynolds number on the strength of the horseshoe vortex parts.

To further characterize the effect of increasing Reynolds number on horseshoe vortices, we looked at the location of vortex focal points in figure 31. Here, the location of the vortex focal points on the  $xz$ plane (mid-plane) is evaluated in front of the prism (the origin of the horseshoe structures). As shown in figure 31(a), increasing Reynolds number from $Re = 250$ to 600 coincided with movement of HS Part1 away from the prism leading edge in the streamwise ( $x$) direction, while the time-averaged distance of HS Part3 from the prism leading edge ( $X_3$) decreased. Contrarily, increasing Reynolds number beyond 600 did not significantly affect the time-averaged streamwise distance of horseshoe vortex elements from the prism leading edge. Figure 31(b) shows the distance of different parts of the horseshoe vortex from the ground plane in the $z$ direction. As highlighted here, increasing Reynolds number coincided with slight movement of HS Part1 towards the ground plane, while the positions of HS Part2 and Part3 were approximately unchanged at different Reynolds numbers.
Effect of Reynolds number on the location of horseshoe vortex components in (a) the streamwise direction from the prism leading edge and (b) the normal direction from the ground plane.

Analysing the time-averaged flow characteristics in the critical regions, e.g. where horseshoe structure behaviour changed, can be essential in determining the influence of Reynolds number on flow behaviour and quantitatively describing wake features. To this effect, figure 32 shows the spanwise and normal velocity components at streamwise mid-length of the prism ( $x/h = -2.08$). Results at $0.6 \leq y/h \leq 0.8$ in figure 32(a,b) show the region in which side hairpins were formed (in the instantaneous flow field) and those at $1 \leq y/h \leq 1.75$ represented the characteristics of a horseshoe structure. These results highlight that the peaks of velocity components in the side wake increased continuously in the steady regime with increasing the Reynolds number, while they remained approximately constant in the unsteady wakes. Note that the flow in these regions was characterized by a rapid change of spanwise and normal velocity components. For example, time-averaged normal component of velocity reached a maximum (upwash) at $y/h \approx 0.5$ and decreased to a minimum (downwash) at $y/h \approx 0.7$ and another local maximum at $y/h \approx 1.2$ in the region dominated by the horseshoe. Figure 32(c,d) show the velocity line plots in the region at which the upper hairpins were present. Contrary to the velocity profiles in the side region, these results show that the Reynolds number profoundly affects the upper flow region in the unsteady and steady regimes. Thus, the maximum spanwise velocity in this region reached its maximum at $Re = 1000$, which is a sign for the spanwise flow asymmetry since these results have been captured at $y/h = 0$. Furthermore, the normal velocity component implied the presence of an upwash flow ( $w/U_0 > 0$) at $Re = 350$ and 500. This trend changed to a downwash effect on increasing the Reynolds number, such that the strongest downwash was observed for the case of $Re = 750$.
The (a,b) spanwise and (c,d) normal velocity profiles at streamwise mid-length of the prism ( $x/h = -2.08$).

The current study has identified substantial differences in the wake of a long prism compared with a square prism at different Reynolds numbers, which were mainly attributed to the formation of separation bubbles and hairpin-like structures. It was previously shown that for the case of a small-depth-ratio prism with a large  $AR$, increasing the Reynolds number from $Re=250$ to $1200$ can lead to suppression of the base vortices and alteration of the wake topology from hexapole- and quadrupole- to dipole-type flow with a strong pair of tip vortices (Zhang et al. Reference Zhang, Cheng, An and Zhao2017). In the case of a long prism, however, three different types of time-averaged flow structures can be identified at $250\leq Re \leq 1000$: (1) a wake that exhibits a single tip vortex in the steady flow regime; (2) a wake with one or two pairs of base vortices and horseshoe vortex at ‘transitional’ Reynolds numbers (e.g. $Re=750$); and (3) a wake with one base vortex and horseshoe vortex at ‘post-transitional’ Reynolds numbers (e.g. $Re=1000$). Considering each part of the horseshoe vortex as a distinct streamwise structure, there were five vortex pairs formed in the wake at $Re=750$ and four vortex pairs formed at $Re=1000$. It is important to note that a hexapole, quadrupole or dipole wake structure is defined based on the number of streamwise vortical structures in the wake. For the hexapole and quadrupole structures, there are tip and base vortices simultaneously in the wake region and for the dipole type the tip vortex is the only streamwise coherent structure. This method for classifying the wake was sufficiently informative for short-depth prisms, since they only exhibited a single tip vortex in the wake region along with zero, one, or two base vortices. Classifying the wake of a long prism, however, requires specifying the number of vortices and their type. This distinction is necessary since the tip vortex can be suppressed by the flow behaviour, and the horseshoe system can create multiple structures with different directions of rotation.
3.3. Wake model
Observations on the mean and instantaneous wakes of a long wall-mounted prism in a range of Reynolds numbers, including flow mechanisms and dynamics, enable us to generate a new model for the transitional mechanisms and early unsteady wake developments. The proposed new model in figure 33 embodies all the observations and characterizations related to the wake analysis and vortex interactions discussed thus far, which we briefly recall here. First, unsteady flow fluctuations in the case of a long wall-mounted prism were initiated at  $Re = 650$ by the leading-edge shear-layer instabilities (figures 8, 9, 13, 14, 15, 27, 28, 29 and 32), contrary to short prisms, in which wake instabilities initiate the unsteady transition. This unsteady transition appeared as the hairpin structures formed and convected downstream on the side and upper surfaces of the prism (figures 8, 9, 14, 15, 16, 18, 21 and 22). Second, the model identifies the formation of vortex loops due to the induced unsteady fluctuations from side hairpin vortices (figures 8, 9, 11, 14, 15, 19, 20 and 22). Here, the former structure appeared to grow by moving downstream, while the latter was distorted (figures 8, 9, 14, 15, 17, 21, 23, 24, 25 and 26). Finally, this new model identifies the arc-type structures as a flow coherent feature that impact downstream wake dynamics. Therefore, the proposed model outlines the presence of at least three primary unsteady wake mechanisms around and behind the prism, which strongly differ from existing wake models for short prisms. Based on the quantitative and qualitative wake assessments provided thus far, it is apparent that our newly proposed model closely resembles the flow around wall-mounted prisms that have sufficient width ( $\geq 0.8h$), such that side structures are independent from one another, and depth ( $\geq 3$), such that shear layers can reattach properly to the body and develop into a hairpin-like structure. It is important to note that this model only applies to low-aspect-ratio prisms, since the orientation and characteristics of wake structures change with increasing aspect ratio. Thus, this model greatly contributes to our understanding of unsteady wakes of long wall-mounted bodies with applications in biomedical devices and flow manipulators at lower Reynolds numbers and aerodynamics of trailer trucks and trains at higher Reynolds numbers.
New model for the vortex structures of a long rectangular prism.

4. Discussion and conclusion
The flow around a long wall-mounted prism with a depth ratio of  $DR=5$ was numerically solved using a direct approach at Reynolds numbers of $250\unicode{x2013}1200$. The wake dynamics was analysed extensively for both time-averaged and unsteady flows to identify the origin of unsteadiness in the wake of a long prism and its differences from the wake of a square prism or circular cylinder. The wake unsteady transition appeared to occur in the Reynolds number range $625< Re \leq 650$. The wake descriptions identified significant variations in the wake topology due to the leading-edge-separated shear-layer reattachment, which led to the formation of separation bubbles on the prism side and upper faces. The results highlighted a unique wake dynamics for the long wall-mounted prism compared with small-depth-ratio prisms, including a particular source of the transition to unsteady behaviour, the flow frequency signature, the formation and interaction of coherent structures, the arrangement of streamwise vortices and the distribution of upwash and downwash flow.
Increasing the Reynolds number from 625 to 650 transformed the flow into an unsteady wake. The source of unsteadiness is attributed to the destabilization of separation bubbles which led to the formation of hairpin-like vortices on the prism side and upper faces. The horseshoe vortex grew substantially as it transformed to vortex loops, most likely due to the induced instability associated with the formation of hairpin-like structures in the side wake. Interaction of the unsteady horseshoe vortex (vortex loops) with the side hairpins suppressed the latter prior to the trailing edge of the prism. This enabled uninterrupted growth of the vortex loops after the prism trailing edges, the effects of which remain visible in the far downstream regions of the wake at  $Re \geq 650$. There also existed arc-type structures, which did not extend to the far wake. An instantaneous wake model was presented that extends the existing models for wall-mounted prisms. Based on different qualitative and quantitative assessments of the flow, the wake can be classified into three regimes: ‘steady’ at $Re \leq 625$, ‘regular (stable) unsteady’ at $650 \leq Re \leq 725$ and ‘irregular (unstable) unsteady’ at $Re \geq 750$. The stable unsteady cases could correspond to the laminar unsteady state of flow, while the unstable unsteady regime resembled transitional or turbulent regimes. Finally, a model was introduced that incorporates three distinct unsteady wake mechanisms that dominate the flow: horseshoe vortex loops, arc-type structure and hairpin-like structures. Given the strength and size of the vortex loops, it was expected that they play a critical role in the unsteady wake dynamics at different conditions, e.g. higher incidence angles.
Topology of the time-averaged flow structures significantly changed relative to existing small-depth-ratio studies. At  $Re \geq 650$, horseshoe vortices exhibited a significantly large structure with multiple parts, which actively contributed to the wake dynamics. This structure, and its subsequent features, retained their coherence in the far wake. The tip vortex close to the prism trailing edge defused in the near-wake region due to the interactions of arc-type structure with the hairpin-like vortices formed on the upper surface of the prism. At $Re = 750$, the far-wake region of the prism at the mid-plane was dominated by two base vortices, while there was only a single base vortex prominent at $Re=1000$. The wake at $Re=750$, therefore, exhibited features that can be categorized as ‘transitional vortices’. Increasing Reynolds number led to the formation of more substantial downwash flow in the near wake, and an upwash flow due to the formation of base vortices in the far wake.
The mean wake of a wall-mounted long prism at low Reynolds numbers can be categorized into three classes: (1) wake flow with a single tip vortex at steady flow regimes ( $Re\leq 625$); (2) wake flow with one or two pairs of base vortices and horseshoe vortex at transitional Reynolds numbers ( $650 \leq Re \leq 850$ ); and (3) wake flow with one base vortex and horseshoe vortex at moderate (post-transitional) Reynolds numbers ( $Re\geq 1000$).
Funding
This work received financial support from the Canada First Research Excellence through the University of Alberta Future Energy Systems Institute. The computational analysis was carried out using Compute Canada clusters.
Declaration of interest
The authors report no conflict of interest.


 Open access