

Inflammation is a set of complex changing responses that protects the body against cell and tissue damages. It also eliminates or suppresses the harmful pathogens, such as bacteria, trauma, chemicals or other destructive substances(Reference Taniguchi, Wu and Grivennikov1,Reference Xia, Deng and Guo2) . Inflammation is a physiological response of the immune system that promotes the healing and regeneration processes(Reference Taniguchi, Wu and Grivennikov1,Reference Xia, Deng and Guo2) . The process of inflammation involves two phases: (1) the process of acute inflammation by oedema and emigration of leucocytes and (2) chronic patterns of inflammation in the presence of lymphocytes and macrophages along with proliferation of blood vessels, fibrosis and tissue necrosis(Reference Fujiwara and Kobayashi3). Chronic and prolonged inflammation can be harmful and may lead to chronic diseases, such as CVD(Reference Couzin-Frankel4), type 2 diabetes, insulin resistance(Reference Couzin-Frankel4,Reference Schmidt, Duncan and Sharrett5) , the metabolic syndrome (MetS)(Reference Monteiro6) and different kinds of cancers(Reference Couzin-Frankel4,Reference Allavena, Sica and Solinas7,Reference Shacter and Weitzman8) .
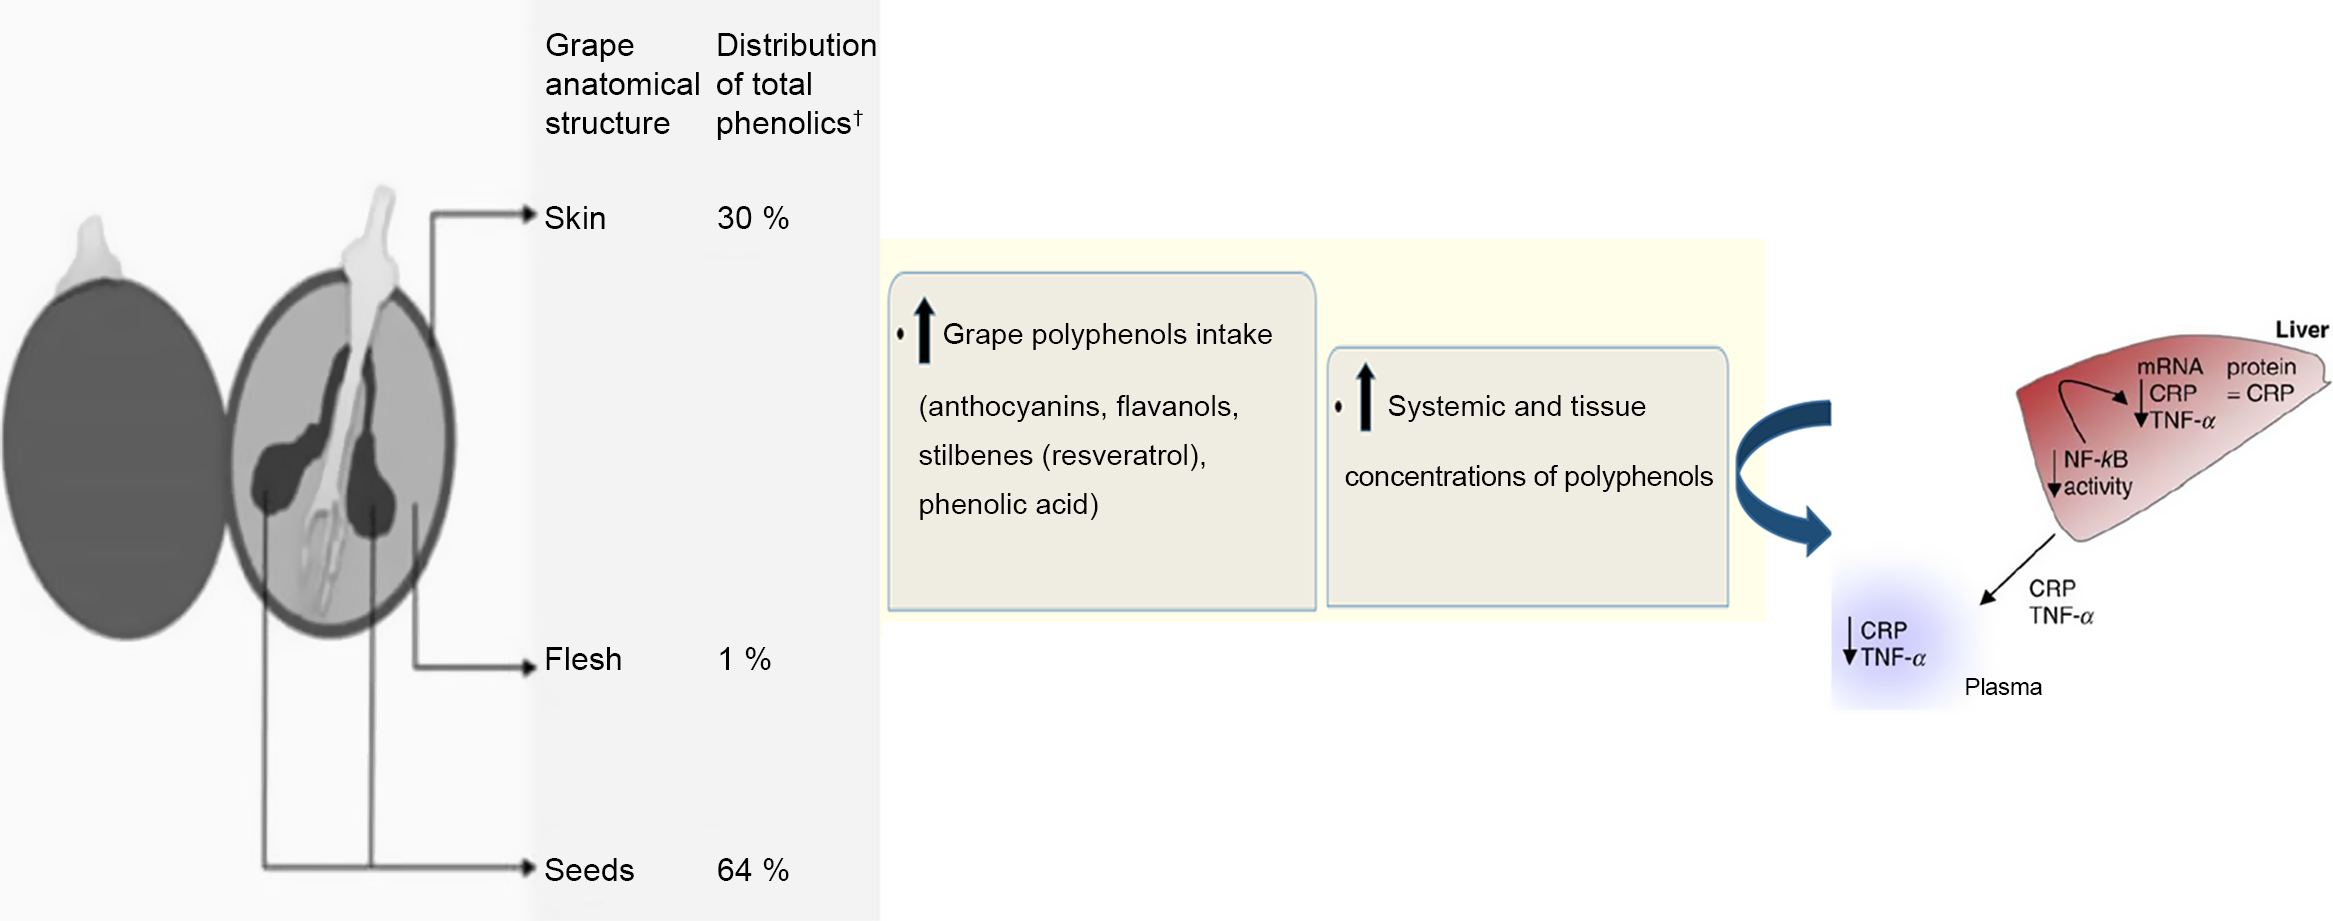
Literature analysis showed that inflammation was usually characterised by regional vascular dilatation, increased blood flow, increased vascular penetration, release of fluid into the interstitial space, increased fibrinogen and coagulation, as well as migration of granulocytes and monocytes into the injured tissue(Reference Zabel, Allen and Kulig9–Reference Fernandez, Henson and Otani11). In response to inflammation, different vessels and immune cells are involved in a series of cascading events(Reference Lind, Hochwald and Malaty12). C-reactive protein (CRP) is an acute-phase protein synthesised by the liver cells in response to inflammation(Reference Hurlimann, Thorbecke and Hochwald13) and a predictor of CVD(Reference Ansar and Ghosh14). The CRP is also one of the most important biomarkers because it is better suited to studying the relationship between inflammation and CVD(Reference Ducros, Demuth and Sauvant15,Reference King16) than cell adhesion molecules, specifically cytokines or fibrinogen, which may cause inflammatory situations(Reference Pérez-Jiménez and Saura-Calixto17). Furthermore, findings showed the extra hepatic production of CRP in different cells, including peripheral mononuclear cells(Reference Dong and Wright18), human coronary artery smooth muscle cells(Reference Calabró, Willerson and Yeh19), human neurons(Reference Yasojima, Schwab and McGeer20), kidney epithelial cells(Reference Jabs, Lögering and Gerke21) and atherosclerotic lesions(Reference Yasojima, Schwab and McGeer22). Based on some studies, CRP bond with bacterial ligands, damage tissues, prevent them from binding with FC receptors and improve inflammatory processes(Reference Bharadwaj, Stein and Volzer23,Reference Bodman-Smith, Melendez and Campbell24) . Furthermore, CRP is a systemic sensitive index for evaluating inflammation and a valid predictor biomarker in disorders with inflammatory-involved processes(Reference Pepys25–Reference Group, Kuller and Tracy29). In several randomised controlled trials (RCT), grape and its products had positive effects on disorders with inflammatory process, such as CVD( Reference Zern, Wood and Greene30,Reference Tsang, Higgins and Duthie31 ), type 2 diabetes, insulin resistance(Reference Banini, Boyd and Allen32,Reference Urquiaga, D’Acuña and Pérez33) and the MetS(Reference Barona, Aristizabal and Blesso34–Reference Sivaprakasapillai, Edirisinghe and Randolph36). These beneficial effects are mainly due to the polyphenols contained in grape and its products(Reference Xia, Deng and Guo2). Various phenolic compounds have been found in grape skin, flesh and seed(Reference Revilla and Ryan37), which mainly include anthocyanins, flavanols, stilbenes (resveratrol) and phenolic acids(Reference Luthria, Mukhopadhyay and Kwansa38,Reference Keli, Hertog and Feskens39) . The phenolic compounds of the grape have anti-inflammatory properties(Reference Xia, Deng and Guo2). Expression of CRP in the liver is related to TNF-α, IL-6 and IL-1, which are directly secreted from visceral fat tissues to the liver portal system(Reference Yuan, Konstantopoulos and Lee40). Grape polyphenols, especially flavanols, inhibit the pro-inflammatory cytokines or endotoxin-mediated kinases and transcription factors involved in the metabolic diseases(Reference Chuang and McIntosh41). This process results in suppressing inflammatory cytokines(Reference Chuang and McIntosh41–Reference Sakurai, Kitadate and Nishioka43) and ultimately reduces expression of the CRP gene(Reference Kaur, Rao and Agrawal42,Reference Terra, Pallarés and Ardèvol44) .
Some animal studies showed positive effects of grape polyphenols on the reduction of CRP concentrations(Reference Terra, Pallarés and Ardèvol44–Reference Hogan, Canning and Sun46). The results of RCT are contradictory with regard to the effects of different grape products containing polyphenols on the CRP levels. For example, in a crossover study, consumption of 600 mg of grape seed extract per d for 4 weeks significantly reduced high-sensitivity CRP in thirty-two participants with type 2 diabetes(Reference Kar, Laight and Rooprai47). Moreover, in a study on 115 people with diabetes and a recent history of myocardial infarction, consumption of red wine decreased the CRP levels significantly(Reference Marfella, Cacciapuoti and Siniscalchi48). Similarly, polyphenol compounds of grape products significantly decreased CRP levels in other studies(Reference Torres, Cachofeiro and Millan49–Reference Sacanella, Vázquez-Agell and Mena55). However, some other studies indicated that consuming 60 g of grape powder rich in polyphenols for 10 weeks had no significant effect on healthy participants with obesity(Reference Bardagjy, Hu and Giebler56). Furthermore, taking 90 g of raisins (containing 138·5–221·5 mg polyphenols) per d for 4 weeks had no significant effect on CRP levels(Reference Kanellos, Kaliora and Protogerou57). Other studies also found no significant effect of grape polyphenols on CRP levels(Reference Clifton58–Reference Barden, Shinde and Phillips74).
Although some clinical trials were carried out over the effect of grape polyphenol supplementation on CRP levels, no consistent evidences exist on the effectiveness of grape polyphenols. In addition, no systematic review and meta-analysis has ever been conducted in this area. Thus, the aim of this systematic review and meta-analysis was to summarise the overall effect of grape products containing polyphenols on CRP concentrations. In addition, we assessed the effects of different dosage and duration of supplementation. To hit this target, polyphenol-containing grape products were categorised into grape extract, grape seed extract (GSE), grape powder, juice, red wine and raisins. Moreover, participants were categorised into healthy individuals and patients with a clinical condition.
Materials and methods
Search strategy
This systematic review and meta-analysis was conducted according to the Preferred Reporting Items for Systematic Reviews and Meta-Analyses Guidelines(Reference Moher, Shamseer and Clarke75).
The protocol of the present study was registered in PROSPERO, an International Prospective Register of Systematic Reviews (http://www.crd.york.ac.uk/PROSPERO) with the registration number of CRD42018110169.
We searched online databases, including PubMed (http://www.pubmed.com), ISI Web of Science (http://www.webofknowledge.com), Scopus (http://www.scopus.com) and Google Scholar (http://www.scholar.google.com) up to 30 March 2020 without any restrictions. The comprehensive search strategy was conducted using following keywords and medical subject heading terms: ‘Polyphenols’, ‘Grape’, ‘grape seed’, ‘grape seed extract’, ‘wine’, ‘C-Reactive Protein’, ‘CRP’, ‘Inflammation’, ‘inflammatory mediators’, ‘Anti-Inflammatory Agents’, combined with ‘Intervention Studies’, ‘intervention’, ‘controlled trial’, ‘randomized’, ‘randomised’, ‘random’, ‘randomly’, ‘placebo’ and ‘assignment’. We used Boolean operators (AND and OR) to connect the aforementioned terms (supporting information). To widen our search scope, the trial registries of Iranian Registry of Clinical Trials and ClinicalTrials.gov were checked to identify unpublished trials in this context. Additionally, reference lists of the related original and review articles were carefully checked to obtain other eligible studies.
To ensure about comprehensiveness of the searches, we checked the references of all included studies manually for any possible further sources.
Eligibility criteria
The selected studies for this meta-analysis: (1) were original articles with an RCT design; (2) evaluated the effect of grape products containing polyphenols on CRP levels compared with the placebo or other interventions; (3) reported the dose of grape products; (4) did not administer grape product with other products or special diets; (5) used participants with 18 years of age or higher; (6) lasted 3 weeks or more; (7) reported the CRP level as the primary or secondary measure; and (8) were in English.
Study selection
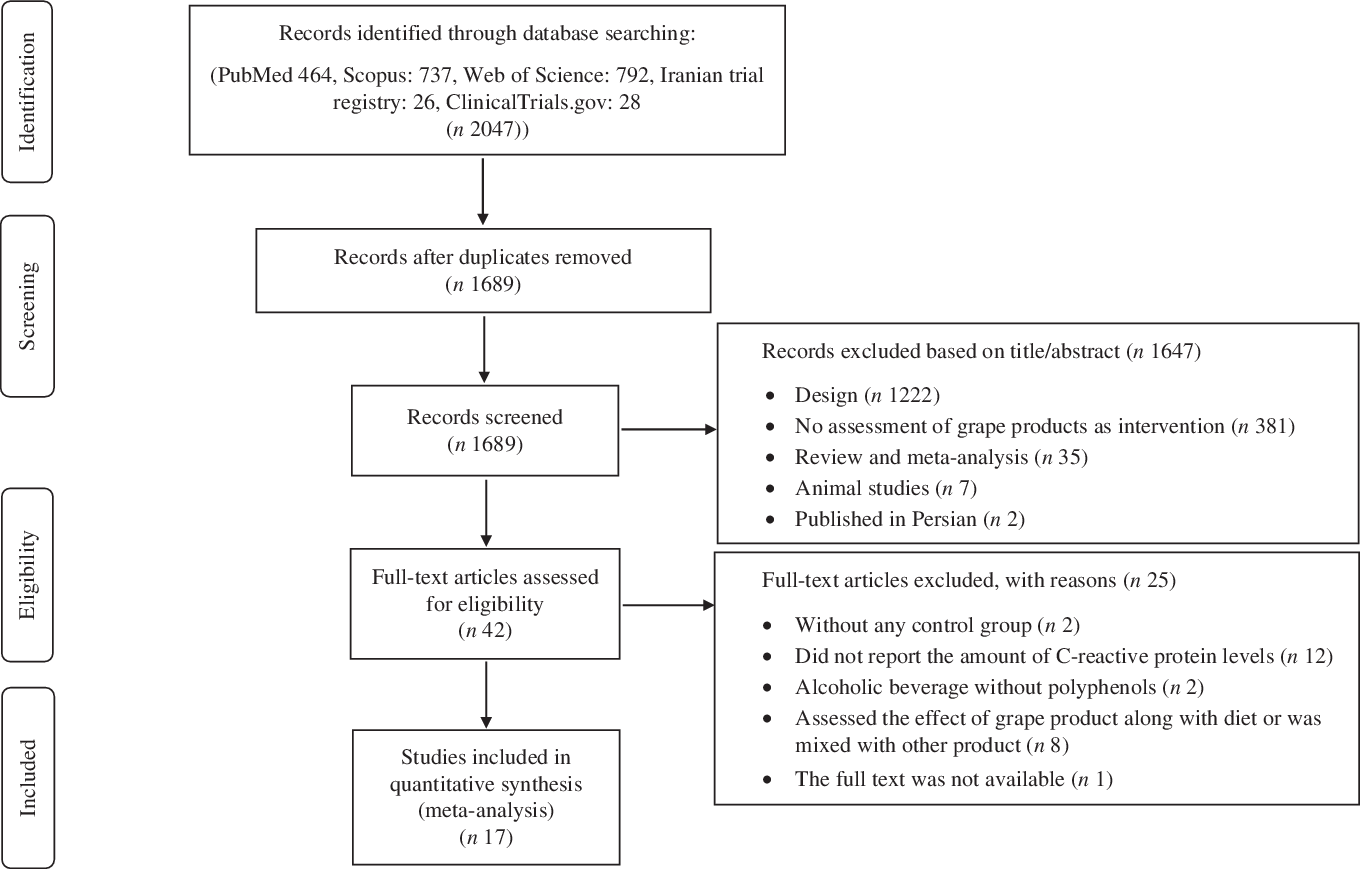
Two authors (S. S.-K. H. and M. H.) separately performed the initial screening according to the articles’ titles and abstracts to avoid missing articles. In the next step, the full texts of all related articles were investigated by researchers to select studies that investigated the effect of grape products containing polyphenols on CRP levels. Moreover, Hassan Mozaffari-Khosravi checked the findings and resolved the disagreements by discussion (Fig. 1).
Preferred Reporting Items for Systematic Review and Meta-analyses (PRISMA) flow diagram of study selection process.
Data extraction
At this stage, S. S.-K. H. and M. H. summarised the articles’ data including author’s family name, year of publication, sample size, dose and type of intervention, duration of study, type of study (crossover or parallel study design), participants’ sex and age, healthy status of participants, as well as the mean and standard deviations of CRP concentration in the intervention and control groups at the baseline and end of the studies. The collected information was double checked by Hassan Mozaffari-Khosravi.
Quality assessment
Two researchers (S. S.-K. H. and M. H.) independently evaluated the methodological quality of the included articles according to the Cochrane risk of bias tool. Any disagreement was resolved through consensus or consultation with another researcher (Hassan Mozaffari-Khosravi). The risk of bias in the included RCT was assessed according to the Cochrane Collaboration’s tool, including six domains of: (1) sequence generation; (2) allocation and concealment; (3) blinding of participants and personnel; (4) blinding of outcome assessment; (5) incomplete outcome data; and (6) selective reporting. Each domain was classified into three categories: low risk of bias, high risk of bias and unclear risk of bias(Reference Higgins and Green76).
NutriGrade
The present meta-analysis examined the effect of grape products containing polyphenols on CRP levels. The overall quality of the present study was evaluated by the NutriGrade scoring system (maximum of ten points)(Reference Schwingshackl, Knüppel and Schwedhelm77). The following items were considered for meta-analyses of the RCT: (a) risk of bias, (b) precision, (c) heterogeneity, (d) directness, (e) publication bias, (f) funding bias and (g) study design. The credibility of evidence was evaluated as (a) high (≥8 points), (b) moderate (6–7·99 points), (c) low (4–5·99) and (d) very low (0·3–3·99 points).
Data synthesis and analysis
To calculate the effect size for each parameter, the mean changes and standard deviations of the intervention and control groups/periods were extracted from each study. These rates were used to estimate the mean difference and its corresponding standard error. Standardised mean difference (SMD) was defined as the effect size. Later, SMD was calculated after dividing mean by standard deviation. In studies that reported the standard error value, se was converted into sd as follows: sd = se ×
 $$\surd n$$
(n = number of participants in each group). In order to incorporate between-study variation, a random effects model was used to calculate the SMD with 95 % CI for conducting the meta-analysis. Between-study heterogeneity was tested by Cochran’s Q test and quantified by the I 2 statistic, where a significant Q test (P < 0·05) and a value for I 2 > 75 % were considered to indicate considerable heterogeneity(Reference Higgins, Thompson and Deeks78). Subgroup analysis was conducted to explore the possible source of heterogeneity among the studies. Publication bias was also evaluated by examining the funnel plot and formal testing for ‘funnel plot’ asymmetry using Begg’s test and Egger’s test, respectively(Reference Hassimotto, Moreira and Nascimento79). Sensitivity analysis was performed to identify the effect of an individual study or a particular group of studies on the findings(Reference Hassimotto, Moreira and Nascimento79). If the results differ across sensitivity analyses, this is an indication that the result may need to be interpreted with caution(Reference Hassimotto, Moreira and Nascimento79). Moreover, sensitivity analysis was conducted to explore the impact of excluding each study on the overall results. Statistical analyses were conducted using STATA version 11.2 (StataCorp.). The statistically significant level was set at P values < 0·05.
$$\surd n$$
(n = number of participants in each group). In order to incorporate between-study variation, a random effects model was used to calculate the SMD with 95 % CI for conducting the meta-analysis. Between-study heterogeneity was tested by Cochran’s Q test and quantified by the I 2 statistic, where a significant Q test (P < 0·05) and a value for I 2 > 75 % were considered to indicate considerable heterogeneity(Reference Higgins, Thompson and Deeks78). Subgroup analysis was conducted to explore the possible source of heterogeneity among the studies. Publication bias was also evaluated by examining the funnel plot and formal testing for ‘funnel plot’ asymmetry using Begg’s test and Egger’s test, respectively(Reference Hassimotto, Moreira and Nascimento79). Sensitivity analysis was performed to identify the effect of an individual study or a particular group of studies on the findings(Reference Hassimotto, Moreira and Nascimento79). If the results differ across sensitivity analyses, this is an indication that the result may need to be interpreted with caution(Reference Hassimotto, Moreira and Nascimento79). Moreover, sensitivity analysis was conducted to explore the impact of excluding each study on the overall results. Statistical analyses were conducted using STATA version 11.2 (StataCorp.). The statistically significant level was set at P values < 0·05.
Meta-regression
Meta-regression was performed in order to evaluate the association of estimated effect size with grape polyphenol dose and duration of trial.
Results
Study selection and characteristics
Our search throughout the databases of Google Scholar, PubMed, Web of Science, Scopus, Iranian trial registry and ClinicalTrials.gov resulted in a total of 2024 articles. The search strategy is shown in online Supplementary material. After removing the duplicate studies and screening the included articles’ tittles and abstracts, 1689 papers remained. Later, 1647 other studies were excluded since they had not RCT design (n 1222), did not evaluate the effect of grape products as interventions (n 381) and they were animal studies (n 7), review/meta-analysis studies (n 35), and in Persian (n 2). Full texts of the remaining articles were reviewed and twenty-five papers were excluded since: they did not have control group(Reference Albert, Glynn and Ridker80,Reference Blair, Kelly and Steinberger81) , did not report the amount of CRP levels(Reference Bantle, Thomas and Bantle82–Reference Shai, Rimm and Schulze93), contained alcoholic beverage without polyphenols(Reference Sierksma, Van Der Gaag and Kluft94,Reference Beulens, van den Berg and Kok95) , assessed the effect of grape product along with a diet(Reference Parandoosh, Yousefi and Khorsandi96–Reference Mezzano, Leighton and Martinez98) or with other products(Reference Kuntz, Kunz and Herrmann99–Reference Mullen, Gonzalez and Siwy103), its full text was not available although an email that was sent to the corresponding author(Reference Sari-Sarraf, Babaei and Hagravan104). Therefore, seventeen studies were included in our systematic review and meta-analysis (Fig. 1).
Characteristics of all studies investigated in our systematic review and meta-analysis are indicated in Table 1. All studies were published from 2004 to 2018. A total of 668 participants were investigated in these studies: 469 individuals in the intervention and 429 people in the control groups. Regarding the place of studies, seven studies were conducted in Europe(Reference Estruch, Sacanella and Badia51,Reference Kanellos, Kaliora and Protogerou57,Reference Weseler, Ruijters and Drittij-Reijnders61,Reference Hokayem, Blond and Vidal62,Reference Chiva-Blanch, Urpi-Sarda and Llorach64,Reference Tome-Carneiro, Larrosa and Yanez-Gascon71,Reference Retterstol, Berge and Braaten72) , three in Australia(Reference Clifton58,Reference Mori, Burke and Zilkens63,Reference Barden, Chavez and Phillips69) , five in America(Reference Bardagjy, Hu and Giebler56,Reference Mellen, Daniel and Brosnihan65–Reference Zunino, Peerson and Freytag67,Reference Janiques, Leal and Stockler-Pinto70) and two studies were carried out in Asia(Reference Vaisman and Niv68) and Africa(Reference Turki, Charradi and Boukhalfa59). All studies were randomised controlled trials with parallel or crossover design. All studies were conducted within 4–24 weeks and the doses of grape polyphenols were from 22·4 mg/d to 2000 mg/d. In addition, grape products containing polyphenols were administered in several forms of GSE(Reference Clifton58,Reference Turki, Charradi and Boukhalfa59,Reference Weseler, Ruijters and Drittij-Reijnders61,Reference Mellen, Daniel and Brosnihan65) , grape powder(Reference Bardagjy, Hu and Giebler56,Reference Zunino, Peerson and Freytag67,Reference Vaisman and Niv68,Reference Janiques, Leal and Stockler-Pinto70) , red wine(Reference Estruch, Sacanella and Badia51,Reference Mori, Burke and Zilkens63,Reference Chiva-Blanch, Urpi-Sarda and Llorach64,Reference Barden, Chavez and Phillips69,Reference Retterstol, Berge and Braaten72) , raisins(Reference Kanellos, Kaliora and Protogerou57), grape juice(Reference Dohadwala, Hamburg and Holbrook66), grape extract(Reference Tome-Carneiro, Larrosa and Yanez-Gascon71) and grape polyphenols(Reference Hokayem, Blond and Vidal62).
Study design and participants’ characteristics included in the meta-analysis*
(Mean values and standard deviations)
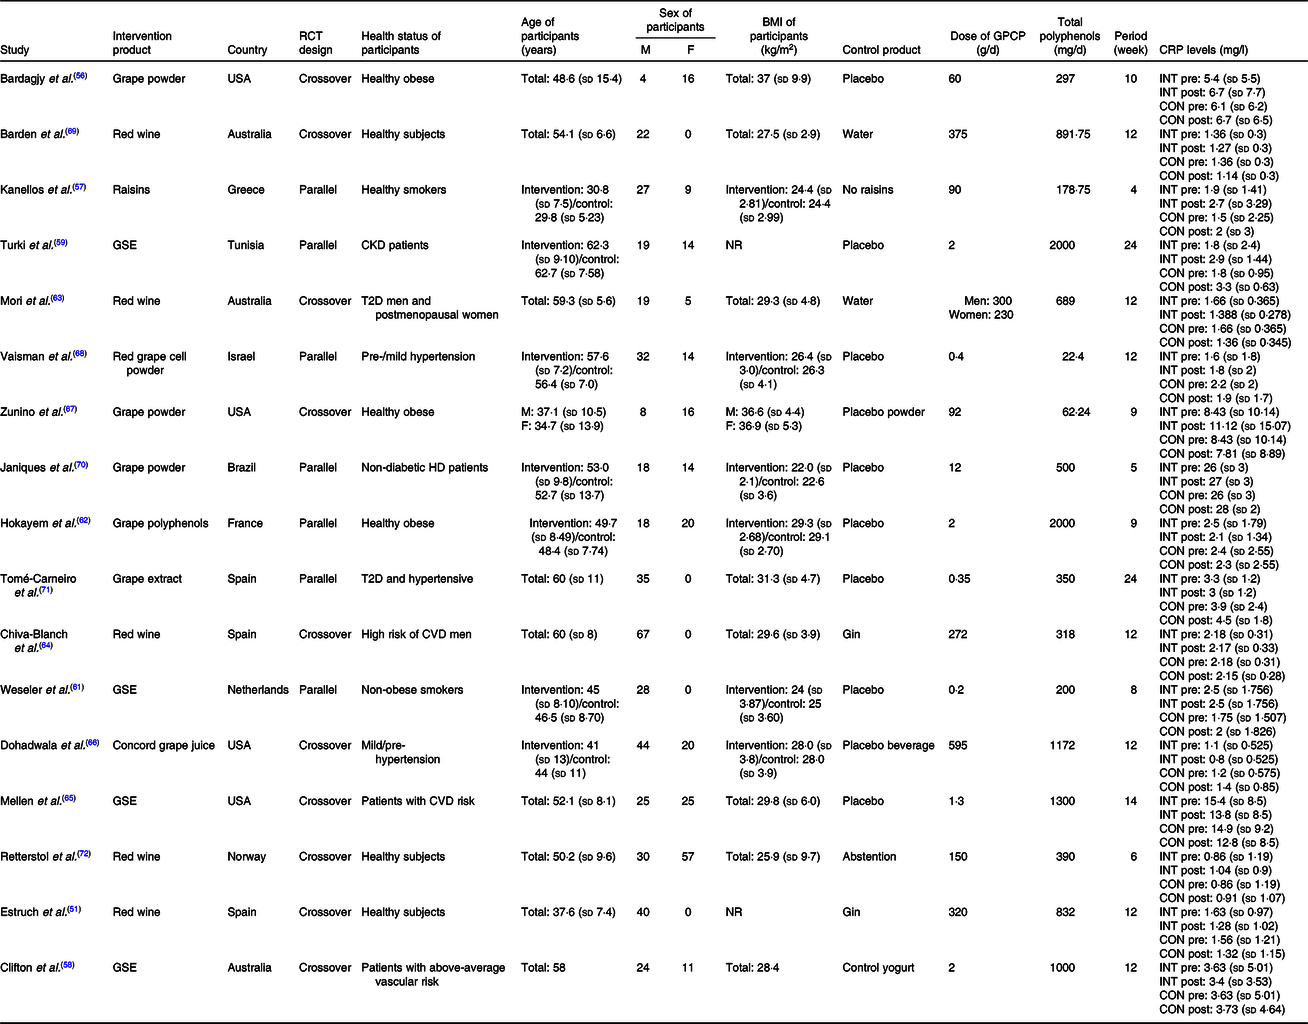
RCT, randomised controlled trial; M, male; F, female; GPCP, grape products containing polyphenols; CRP, C-reactive protein; INT, intervention; CON, control; GSE, grape seed extract; CKD, chronic kidney disease; NR, not reported; T2D, type 2 diabetes; HD, haemodialysis.
* Meta-analyses were conducted using the random effects model. Main analysis: all included studies were conducted on no-grape polyphenol controls and intervention group who consumed grape product containing polyphenols.
Quality assessment of studies
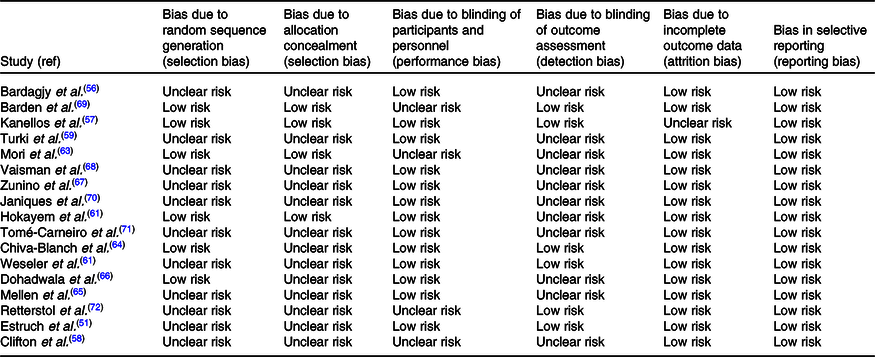
We assessed quality of our included studies according to the Cochrane risk of bias tool (Table 2). Six of our included studies described random sequencing generation(Reference Kanellos, Kaliora and Protogerou57,Reference Hokayem, Blond and Vidal62,Reference Mori, Burke and Zilkens63,Reference Barden, Chavez and Phillips69) but a lack of information was found in this regard in the other studies. Allocation concealment was performed in four studies(Reference Kanellos, Kaliora and Protogerou57,Reference Hokayem, Blond and Vidal62,Reference Mori, Burke and Zilkens63,Reference Barden, Chavez and Phillips69) . Moreover, most of the studies had a low risk for blinding of participants except four studies which had unclear risk because they did not mention about blinding procedure(Reference Clifton58,Reference Mori, Burke and Zilkens63,Reference Barden, Chavez and Phillips69,Reference Retterstol, Berge and Braaten72) , and incomplete outcome data were addressed in all of the studies except one study(Reference Kanellos, Kaliora and Protogerou57). Outcome assessors were unclear in most of the studies, while all the studies had a low risk for selective outcome reports. The details of the risk of bias assessment in individual studies are presented in Table 2.
Cochrane risk of bias assessment
NutriGrade
The overall quality of the present meta-analysis using the NutriGrade scoring system resulted in the total score of 5 for the meta-analysis of the effect on circulating CRP levels; accordingly, the quality of evidence for an effect of polyphenols on CRP is low. This score indicating low confidence in the effect estimate, which shows further research, will provide important evidence on the confidence and likely change the effect estimate.
The effect of grape products containing polyphenols on C-reactive protein levels
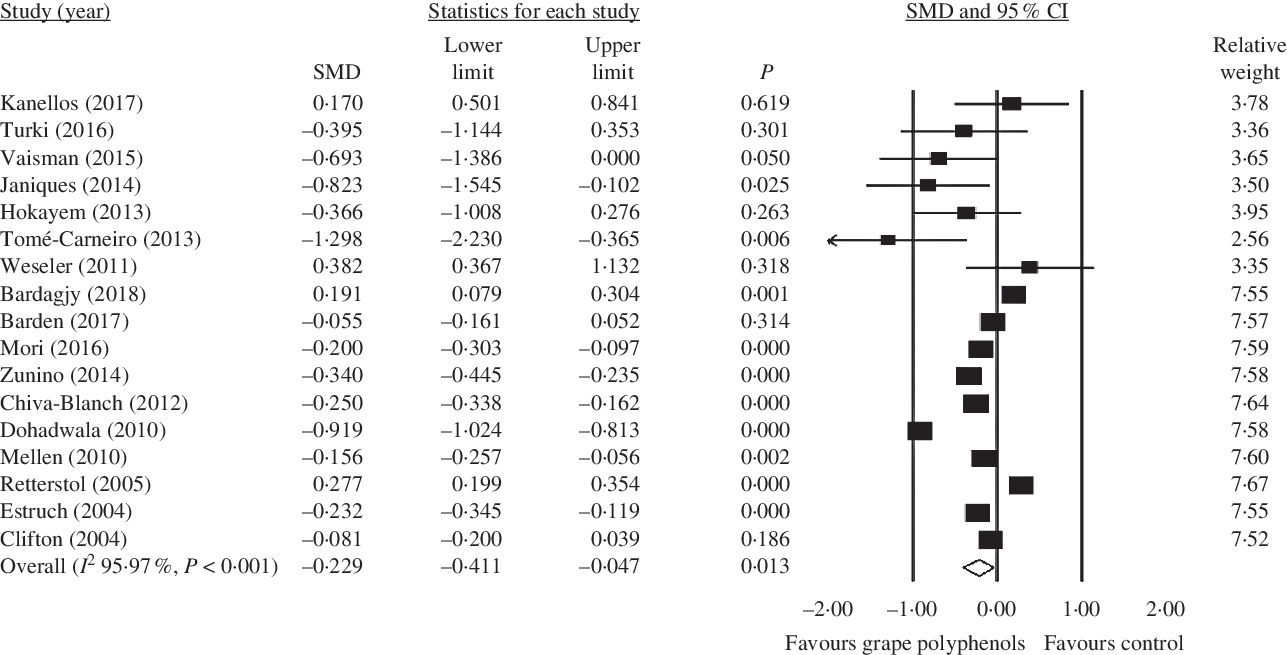
As a result, seventeen studies were included in the meta-analysis. Only one study indicated that grape products containing polyphenols had a significant reduction effect on CRP levels. Finally, our pooled analysis demonstrated that high intakes of grape products containing polyphenols were associated with lower concentrations of CRP (SMD = −0·229; 95 % CI −0·41, −0·05; P = 0·013) (Fig. 2). Moreover, in our study, overall result was not affected by the removal of any particular study. So, the results can be considered robust as even with different decisions they remain the same/similar (online Supplementary Fig. S1). A significant heterogeneity was observed between studies (Cochran’s Q test, Q statistic = 397·07, P < 0·001, I 2 95·97).
Forest plot of the effect of grape products containing polyphenols on C-reactive protein levels. SMD, standardised mean difference.
Subgroup analysis
The results of subgroup analysis are shown in Table 3 and the forest plots are shown in Figs. 3–7.
Subgroup analysis of the effect of grape polyphenol supplementation on C-reactive protein (CRP) levels
(Effect sizes and 95 % confidence intervals)
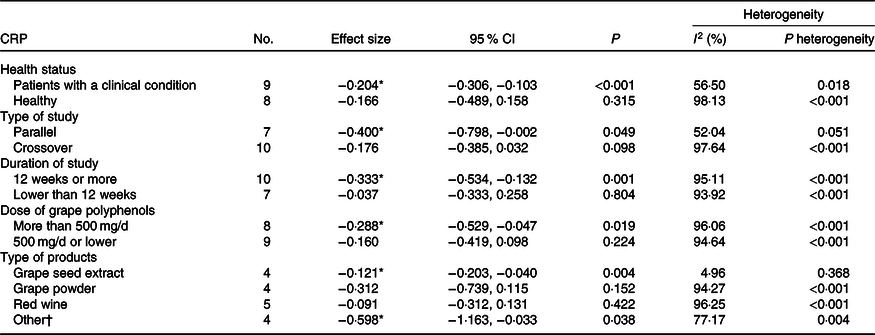
* Significant decrease in the outcome was observed.
† Raisins, grape extract and juice.
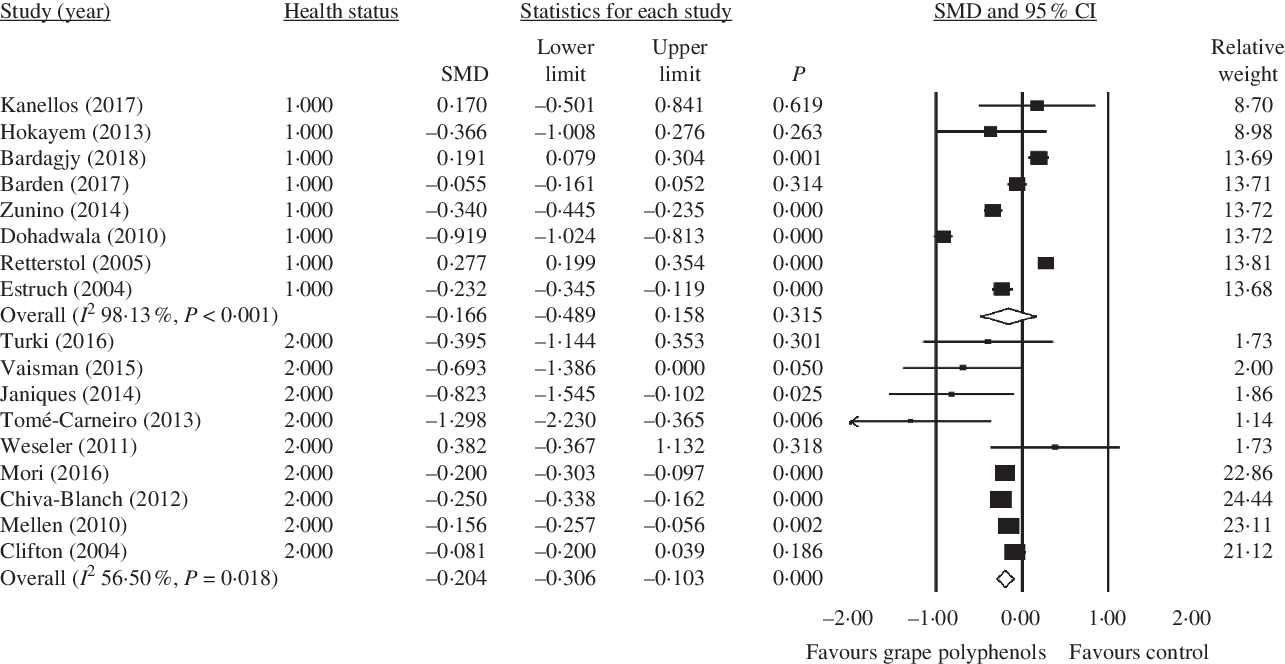
Forest plot of the effect of grape polyphenol intake on C-reactive protein levels in healthy participants and patients with a clinical condition. SMD, standardised mean difference.
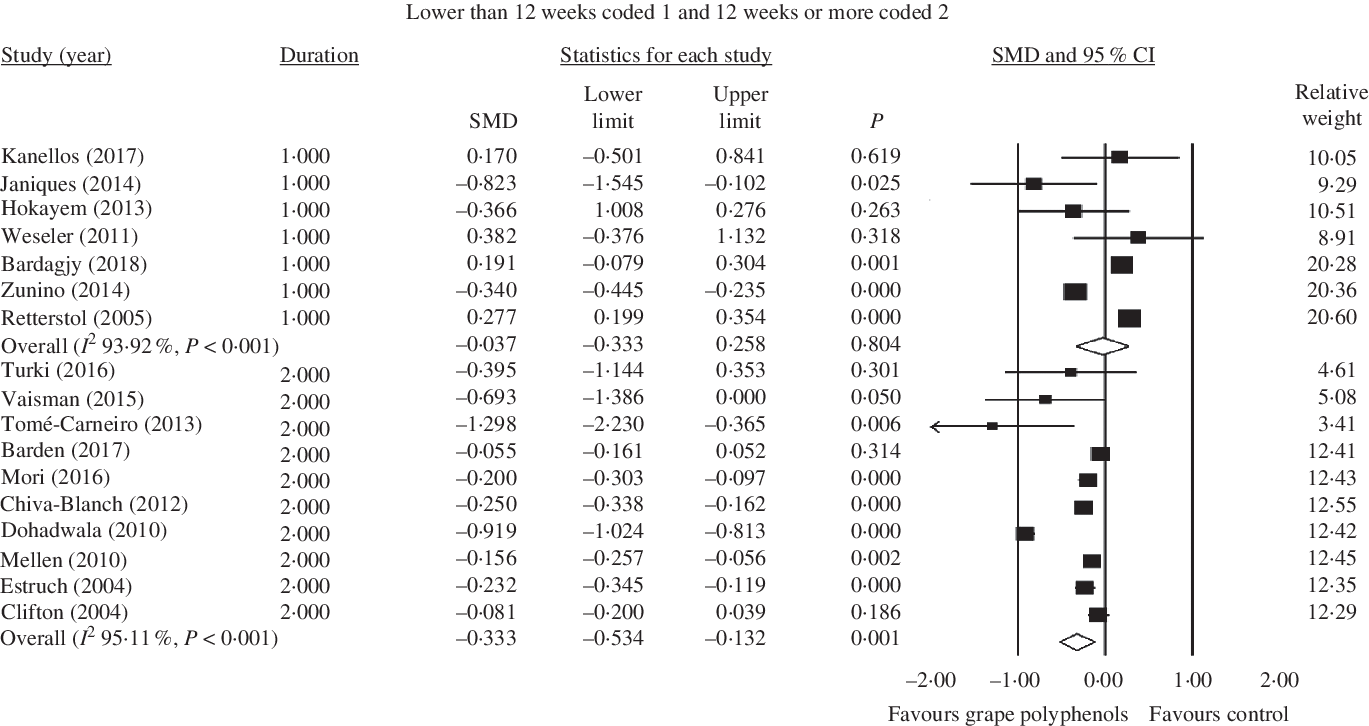
Forest plot of the effect of grape polyphenol intake on C-reactive protein levels in studies with a duration of 12 weeks or more and lower than 12 weeks. SMD, standardised mean difference.
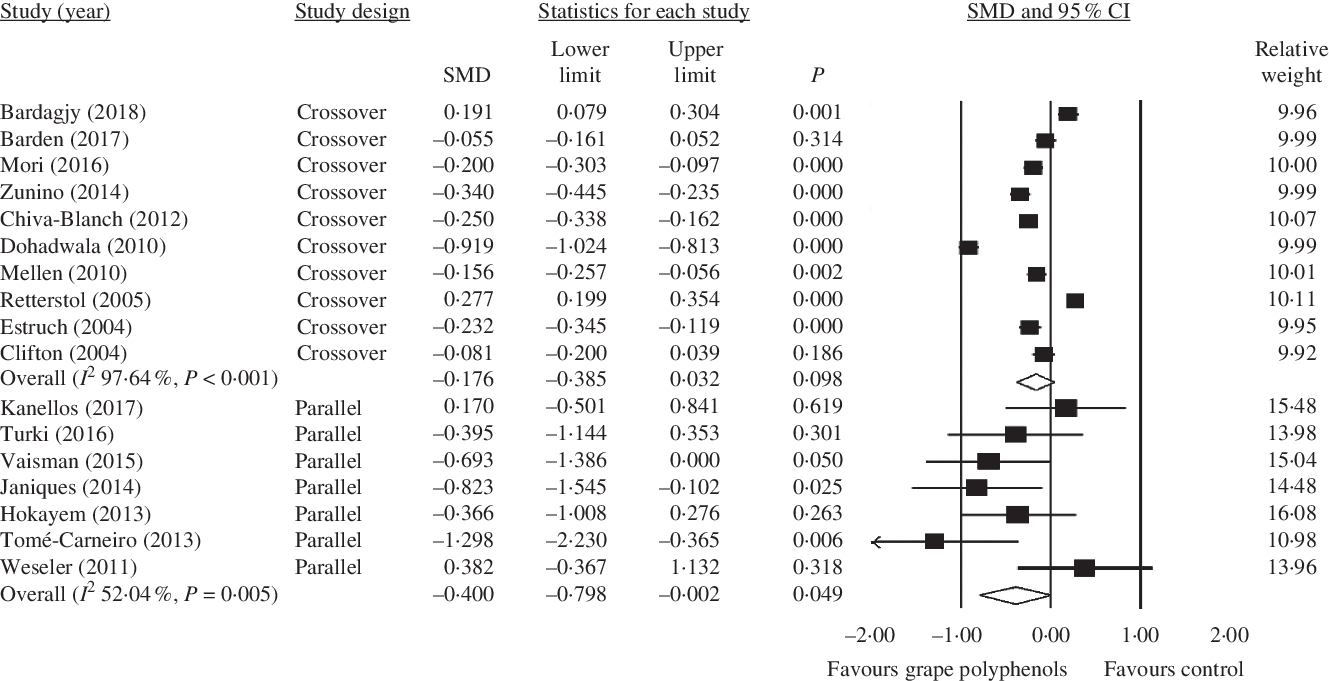
Forest plot of the effect of grape polyphenol intake on C-reactive protein levels in studies with parallel and crossover designs. SMD, standardised mean difference.
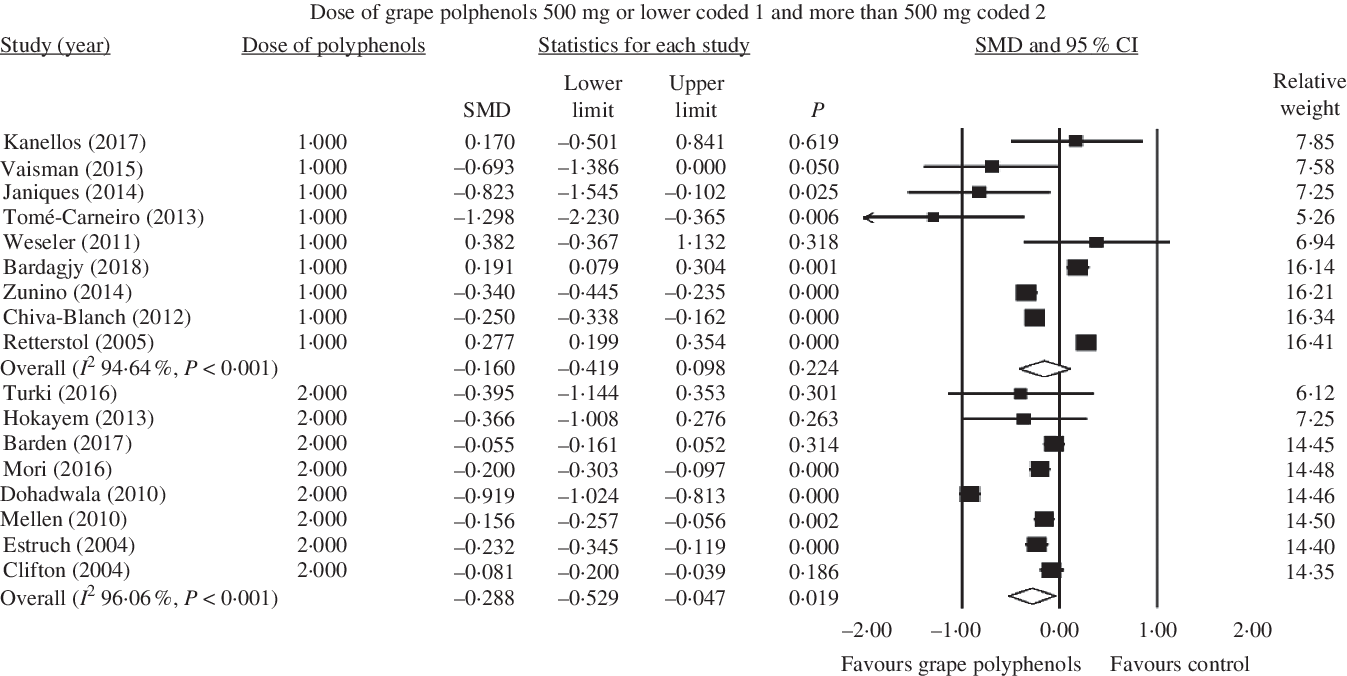
Forest plot of the effect of grape polyphenol intake in doses of 500 mg/d or lower and more than 500 mg/d on C-reactive protein levels. SMD, standardised mean difference.
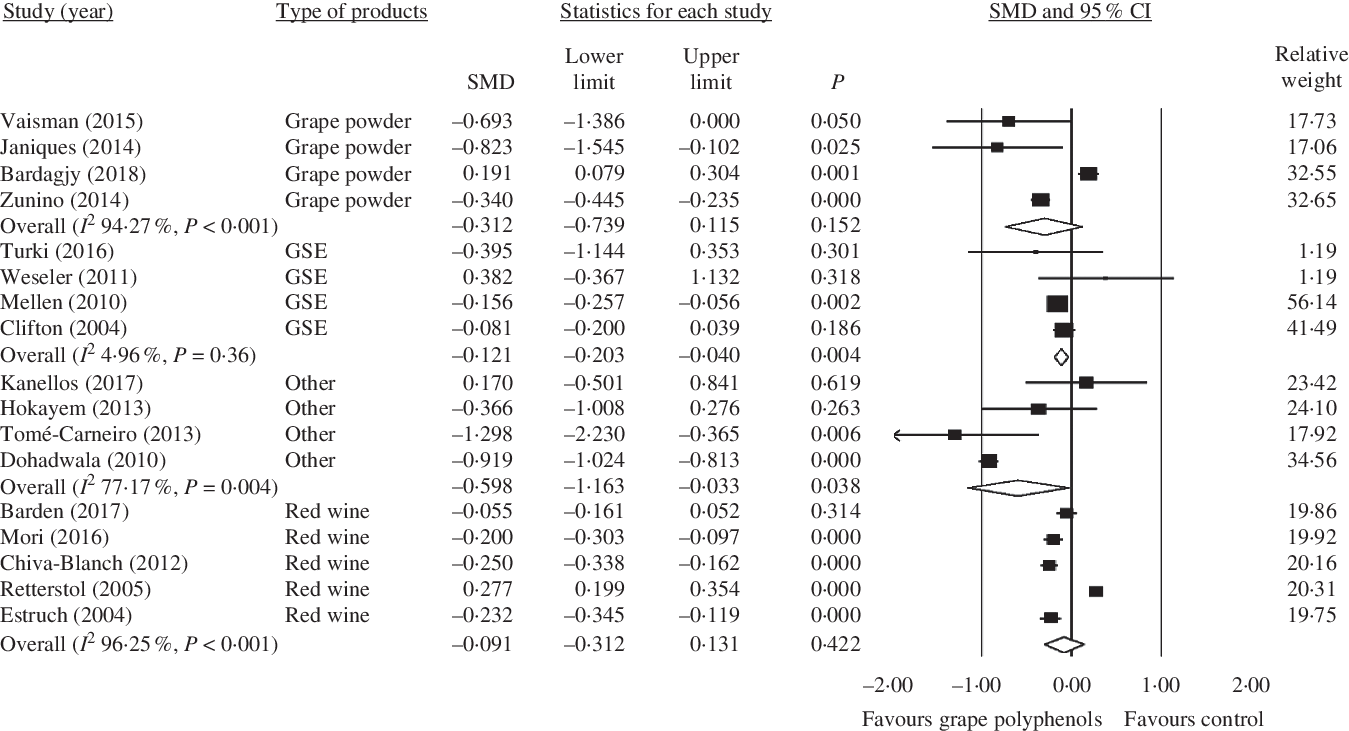
Forest plot of the effect of grape polyphenol intake on C-reactive protein levels in different grape products contain polyphenols. SMD, standardised mean difference; GSE, grape seed extract.
Subgroup analysis based on health status
Higher concentrations of grape polyphenols could significantly decrease CRP levels in patients with a clinical condition (healthy subject: SMD = −0·166; 95 % CI −0·49, 0·16; P = 0·315, Cochran’s Q test, Q statistic = 374·75, P < 0·001, I 2 98·13; patients with a clinical condition: SMD = −0·204; 95 % CI −0·31, −0·10; P < 0·001, Cochran’s Q test, Q statistic = 18·39, P = 0·018, I 2 56·50) (Fig. 3).
Subgroup analysis based on study duration
Also, grape polyphenols could significantly decrease the concentration of CRP in studies with duration of above 12 weeks (<12 weeks: SMD = −0·037; 95 % CI −0·33, 0·26; P = 0·804, Cochran’s Q test, Q statistic = 98·76, P < 0·001, I 2 93·92; ≥ 12 weeks: SMD = −0·333; 95 % CI −0·53, −0·13; P = 0·001, Cochran’s Q test, Q statistic = 184·25, P < 0·001, I 2 95·11) (Fig. 4).
Subgroup analysis based on study design
In parallel studies, grape polyphenols have a significant decreasing effect on the CRP concentration (crossover: SMD = −0·176; 95 % CI −0·38, 0·03; P = 0·098, Cochran’s Q test, Q statistic = 381·91, P < 0·001, I 2 97·64; parallel: SMD = −0·400; 95 % CI −0·80, −0·002; P = 0·049, Cochran’s Q test, Q statistic = 12·51, P = 0·05, I 2 52·04) (Fig. 5).
Subgroup analysis based on doses of grape polyphenols
Besides, a significant lowering on the concentration of CRP was found in higher dose of grape polyphenols (≤500 mg/d: SMD = −0·160; 95 % CI −0·42, 0·10; P = 0·224, Cochran’s Q test, Q statistic = 149·24, P < 0·001, I 2 94·64; >500 mg/d: SMD = −0·288; 95 % CI −0·53, −0·05; P = 0·019, Cochran’s Q test, Q statistic = 177·94, P < 0·001, I 2 96·06) (Fig. 6).
Subgroup analysis based on type of grape products
Moreover, among different kinds of grape products, GSE and other kinds of grape products (raisins, grape polyphenols, grape extract and juice) showed a significant decrease in CRP concentration (GSE: SMD = −0·121; 95 % CI −0·20, −0·04; P = 0·004, Cochran’s Q test, Q statistic = 3·15, P = 0·36, I 2 4·96; Other: SMD = −0·598; 95 % CI −1·16, −0·03; P = 0·038, Cochran’s Q test, Q statistic = 13·14, P = 0·004, I 2 77·17), but red wine and grape powder did not have any significant effect in this regard (red wine: SMD = −0·091; 95 % CI −0·31, 0·13; P = 0·422, Cochran’s Q test, Q statistic = 106·84, P < 0·001, I 2 96·25; grape powder: SMD = −0·312; 95 % CI −0·74, 0·11; P = 0·152, Cochran’s Q test, Q statistic = 52·36, P < 0·001, I 2 94·27) (Fig. 7).
Meta-regression
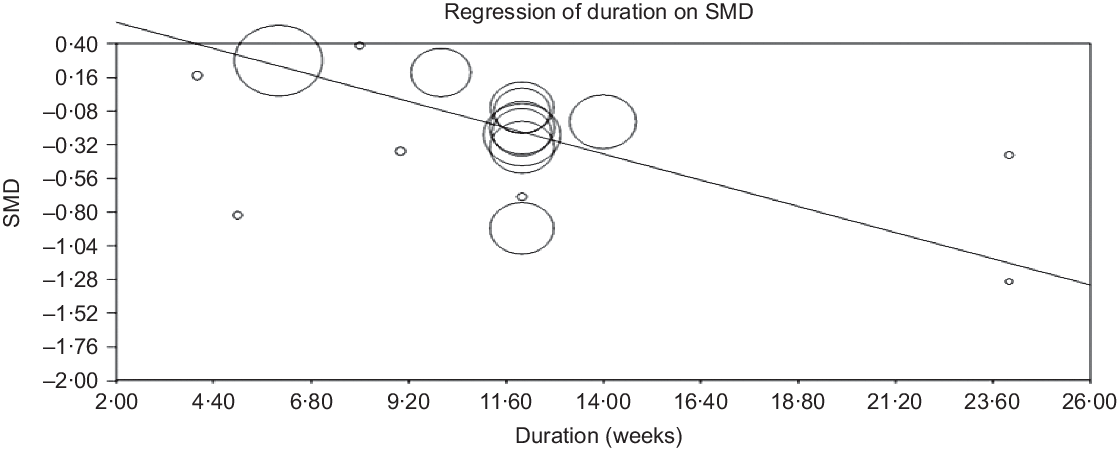
Random effect meta-regression was conducted to assess the association of estimated effect size with dose of grape polyphenols and duration of trial. The results showed that changes in CRP concentrations were dependent on the dose of grape polyphenol intake (slope −0·00031; 95 % CI −0·0003, −0·0002; P < 0·001) (Fig. 8) and duration of trial (slope –0·07793; 95 % CI –0·09, −0·06; P < 0·001) (Fig. 9). Based on the findings, an increase in the dose of administered grape polyphenols and duration of trial can significantly change the concentrations of CRP.
Meta-regression plots of the association of standardised mean difference (SMD) in plasma C-reactive protein concentrations values and intake of grape products containing polyphenols with doses of grape polyphenols. The size of each circle is inversely proportional to the variance of change.

Meta-regression plots of the association of standardised mean difference (SMD) in plasma C-reactive protein concentrations values and intake of grape products containing polyphenols with duration of trial. The size of each circle is inversely proportional to the variance of change.
Publication bias
Funnel plots did not show any publication bias for the effect of grape products containing polyphenols on CRP levels (online Supplementary Fig. S2); asymmetry tests confirmed the same results (Begg’s test, P = 0·65 and Egger’s test, P = 0·55).
Discussion
The findings showed that grape products containing polyphenols decreased the CRP levels significantly. The results of subgroup analysis indicated that higher doses of grape polyphenols (>500 mg/d), longer intervention periods (≥12 weeks) and parallel study designs affected the CRP levels significantly. According to our findings, grape products such as GSE and other kinds of grape products (such as raisins, grape polyphenol, grape extract and juice) had significant effects on CRP levels. However, grape powder and red wine did not have any significant effect on the CRP levels. Moreover, the effect of grape polyphenols on CRP was significantly different between the healthy participants and patients with a clinical condition. To the best of our knowledge, the present study was the first meta-analysis investigating the effect of grape polyphenols on CRP concentrations.
In the same line with our results, other systematic reviews and meta-analyses showed significant effects of supplementation with grape polyphenols on decreasing systolic blood pressure(Reference Li, Zhao and Tian105) and increasing the endothelial function(Reference Li, Tian and Zhao106). However, a systematic review indicated that grape polyphenols did not have any significant effect on glycaemia, blood pressure and lipid profile in the MetS patients(Reference Woerdeman, Van Poelgeest and Ket107). In this regard, some limited evidences suggested a positive effect of grape polyphenols on insulin sensitivity(Reference Woerdeman, Van Poelgeest and Ket107). Moreover, a meta-analysis showed that supplementation with purified anthocyanin or anthocyanin-rich extract did not have any significant effect on the CRP levels. Although changes in CRP concentrations had no association with the trial duration, a significant relationship was found between anthocyanin dosage and CRP level(Reference Sangsefidi, Hasanizadeh and Hosseinzadeh108). Other meta-analyses over the effect of resveratrol on concentration of serum inflammatory mediators indicated that resveratrol might be able to reduce CRP secretion(Reference Koushki, Dashatan and Meshkani109,Reference Haghighatdoost and Hariri110) . Significant improvement in inflammatory markers supported that resveratrol was an adjunct to pharmacological management of metabolic diseases. In agreement with the results of this research, grape products containing polyphenols had a significant effect on the reduction of CRP concentrations in some animal(Reference Terra, Pallarés and Ardèvol44,Reference Terra, Montagut and Bustos45,Reference Brunner, Kivimäki and Witte111) and trial(Reference Kar, Laight and Rooprai47–Reference Sacanella, Vázquez-Agell and Mena55,Reference Irandoost, Ebrahimi-Mameghani and Pirouzpanah112) studies. The researchers concluded that supplementation with grape polyphenolic products decreased the CRP levels significantly not only in patients with diabetes(Reference Kar, Laight and Rooprai47,Reference Marfella, Cacciapuoti and Siniscalchi48) , the MetS(Reference Ábel, Blázovics and Wimmer50), and overweight or obesity(Reference Irandoost, Ebrahimi-Mameghani and Pirouzpanah112) but also among healthy participants(Reference Torres, Cachofeiro and Millan49,Reference Estruch, Sacanella and Badia51–Reference Sacanella, Vázquez-Agell and Mena55) .
In contrast to the results of our study, grape products containing polyphenols had no significant effect on CRP either in people with type 2 diabetes(Reference Mori, Burke and Zilkens63,Reference Tome-Carneiro, Larrosa and Yanez-Gascon71,Reference Bantle, Thomas and Bantle82) , chronic kidney disease(Reference Turki, Charradi and Boukhalfa59,Reference Corredor, Rodríguez-Ribera and Coll113) , haemodialysis(Reference Janiques, Leal and Stockler-Pinto70,Reference Castilla, Echarri and Dávalos114,Reference Castilla, Dávalos and Teruel115) , hypertension(Reference Dohadwala, Hamburg and Holbrook66,Reference Vaisman and Niv68,Reference Ward, Hodgson and Croft116) , obesity(Reference Hokayem, Blond and Vidal62,Reference Zunino, Peerson and Freytag67) , overweight(Reference Rankin, Andreae and Chen117), the MetS(Reference Kelishadi, Gidding and Hashemi118), smoking habit(Reference Weseler, Ruijters and Drittij-Reijnders61), high risk for CVD(Reference Chiva-Blanch, Badimon and Estruch119) and CVD(Reference Mellen, Daniel and Brosnihan65,Reference Albers, Varghese and Vitseva120,Reference Rifler, Lorcerie and Durand121) or in healthy participants(Reference Zern, Wood and Greene30,Reference Kanellos, Kaliora and Protogerou57,Reference Toscano, Tavares and Toscano60,Reference Chiva-Blanch, Urpi-Sarda and Llorach64,Reference Barden, Chavez and Phillips69,Reference Retterstol, Berge and Braaten72–Reference Barden, Shinde and Phillips74,Reference Kerr, Penfold and Zouwail122–Reference Rajdl, Racek and Trefil130) . Some of these studies were only investigated in our systematic review and were not included in our meta-analysis because they did not meet our inclusion criteria(Reference Zern, Wood and Greene30,Reference Kar, Laight and Rooprai47–Reference Ábel, Blázovics and Wimmer50,Reference Queipo-Ortuño, Boto-Ordóñez and Murri52–Reference Sacanella, Vázquez-Agell and Mena55,Reference Toscano, Tavares and Toscano60,Reference Noguer, Cerezo and Donoso Navarro73,Reference Barden, Shinde and Phillips74,Reference Bantle, Thomas and Bantle82,Reference Irandoost, Ebrahimi-Mameghani and Pirouzpanah112–Reference Kelishadi, Gidding and Hashemi118,Reference Albers, Varghese and Vitseva120–Reference Rajdl, Racek and Trefil130) . These discrepancies were attributed to the amount of administered grape product, participants’ primary CRP level, various dietary habits(Reference Retterstol, Berge and Braaten72), type of diet(Reference Rifler, Lorcerie and Durand121,Reference Mezzano, Leighton and Martinez127) , consumption of polyphenols containing products with food(Reference Estruch, Sacanella and Badia51,Reference Sierksma, Van Der Gaag and Kluft131) , poor compliance(Reference Mori, Burke and Zilkens63), participants’ sex and small sample size of studies(Reference Retterstol, Berge and Braaten72).
In patients with a clinical condition, the baseline CRP levels may be more influenced by grape polyphenol products(Reference Retterstol, Berge and Braaten72). In concordance with our results, Li et al. found that the effect of grape polyphenols was more pronounced on improvement of the endothelial function in people with cigarette smoking and coronary artery diseases(Reference Li, Tian and Zhao106). Furthermore, grapes or their products were effective in lowering blood pressure in individuals with clinical conditions(Reference Pezzuto132). In addition, the results of subgroup analysis showed that higher doses of grape polyphenols (>500 mg/d) were associated with a significant decrease in CRP levels. In contrast to our results, a meta-analysis over the effects of grape polyphenols on blood pressure showed that lower doses of polyphenols reduced systolic blood pressure significantly(Reference Li, Zhao and Tian105). Retterstol et al. indicated that consumption of red wine had a U-shaped association with systemic markers of inflammation (CRP)(Reference Retterstol, Berge and Braaten72). Another study over the association between different doses of red wine and blood pressure indicated that moderate drinkers had greater reductions of the systolic blood pressure than those who drank higher doses of wine(Reference Filho, Pereira and Teixeira-Araújo133). This may be due to the threshold effect of the grape polyphenols on inflammatory factors such as CRP(Reference Retterstol, Berge and Braaten72).
Grape polyphenols apply their anti-inflammatory effects through various mechanisms. One of these mechanisms is gene expression(Reference Kris-Etherton, Lefevre and Beecher134), such as reducing the expression of anti-inflammatory cytokines genes of TNF-α, IL-6(Reference Pezzuto132) and CRP(Reference Kaur, Rao and Agrawal42 ,Reference Terra, Montagut and Bustos45 ). The production of CRP in liver cells is regulated by IL-6, IL-1 and TNF-α (Reference Yuan, Konstantopoulos and Lee40). NF-κB is responsible for increasing the expression of inflammatory cytokines genes(Reference Chen, Peng and Tsai135–Reference Terra, Valls and Vitrac137), including TNF-α, IL-6, IL-1β and IL-8(Reference Chuang and McIntosh41). Grape polyphenols inhibit NF-κB pathway signals(Reference Fernandes, Freitas and Chisté138,Reference Overman, Bumrungpert and Kennedy139) , which can reduce CRP production. In addition, various grape products containing polyphenols have a beneficial effect on intestinal microbiota, such as increase of bifidobacteria(Reference Pezzuto132), which is positively associated with reduction of CRP among consumers of these products(Reference Queipo-Ortuño, Boto-Ordóñez and Murri52). Moreover, grape and its products reduce inflammation and decrease the production of reactive species by inhibiting enzymes, such as nucleotide adenine dinucleotide phosphate oxidase(Reference Xia, Deng and Guo2,Reference Castilla, Dávalos and Teruel115) . It was also clearly confirmed that grape phenols had chemoprophylaxis effects(Reference Yang and Xiao140). Modulation of chronic inflammation is affected by grape phenolics, since induction of inflammatory cells’ apoptosis can cause resolution of inflammation(Reference Fernandes, Freitas and Chisté138).
The present study contained some strengths. The source of grape polyphenols was almost consistent among the investigated trials (five red wine studies, four grape powder studies, four GSE studies and four studies of other products). Moreover, subgroup analysis was conducted on the study type (parallel and crossover) and duration (<12 and ≥12 weeks), products’ type (GSE, grape powder, red wine, etc.), dose of grape polyphenols (≤500 and >500 mg/d), as well as participants’ health status (healthy participants and patients with a clinical condition). The conducted sensitivity analyses showed that the overall result was not affected by any particular study. So, the results can be considered robust as even with different decisions they remain the same. Moreover, studies that included other interventions or a special diet along with grape polyphenol supplementation were excluded since they might influence the net impact of grape polyphenols on CRP.
The present study had some limitations. First, CRP was evaluated as the ‘secondary outcome’ in most RCT. The subgroup analysis showed that the effect of grape products containing polyphenols on CRP levels was significant in higher doses of grape polyphenols and longer intervention periods. So, further clinical trials are needed over the effect of grape polyphenol on the CRP or other inflammatory factors as primary outcome using higher doses and longer duration. Most of the investigated studies did not evaluate the participants’ physical activity, diet, genetic background and possible polymorphisms that might mediate the effect of grape polyphenol on CRP that are suggested for future studies. Some of the included studies did not report the doses of pure polyphenols in grape products and serum levels of polyphenols in study population; polyphenol contents in grape products are varied widely because many factors influence their contents, such as grape cultivars, season, processing, storage condition and duration. Future researchers are suggested to report the amount of grape polyphenol in their test products and serum levels of polyphenols in participants. Moreover, the standardised polyphenol extracts are recommended to control for the influence of non-polyphenol compounds. Although we performed a subgroup analysis based on pre-specified subgroup, we identified a heterogeneous group of studies and by subgrouping for health status of participants, type and doses of grape products, design and duration of studies, none of the plausible factors that might explain heterogeneity do so, with the exception of grape seed products. Moreover, NutriGrade score indicating low confidence in the effect estimate, which shows further research, will provide important evidence on the confidence and likely change the effect estimate. Therefore, the overall conclusions of the present study should be interpreted with caution and more studies are needed in this area.
Conclusion
The current systematic review and meta-analysis of RCT demonstrated the significant effect of grape polyphenols on CRP concentrations. However, this effect depends on the administered dosage and type of grape polyphenols, the study duration and the participants’ health status. In this regard, to investigate the effectiveness of grape polyphenols on CRP levels, further well-designed RCT are required with larger sample sizes and longer durations.
Acknowledgements
The authors thank Hassan Mozaffari-Khosravi who checked the extracted data and contributed to the meta-analysis.
The study was funded by the Nutrition and Food Security Research Center, Shahid Sadoughi University of Medical Sciences, Yazd, Iran.
The authors’ responsibilities were as follows: S. S.-K. H. and M. H. designed the study. S. S.-K. H. and M. H. performed systematic research and study selection; S. S.-K. H. and M. H. independently evaluated the methodological quality of the included articles according to Cochrane risk of bias tools. The data collected and extracted by S. S.-K. H. and M. H. S. S.-K. H. and M. H. performed the statistical analysis. S. S.-K. H. wrote the draft of the manuscript. M. H. critically revised the manuscript and approved the final version of manuscript to be submitted. All authors read and approved the final version of the article.
The authors declare no conflicts of interest to report regarding the present study.
Supplementary material
For supplementary material/s referred to in this article, please visit https://doi.org/10.1017/S0007114520003591


