


Highlights
-
• Noninvasive tPCS was well tolerated in all patients.
-
• Active tPCS in PD patients improved postural tremor severity and stride velocity variability significantly compared to sham stimulation.
-
• tPCS caused minimal side effects and can be an additive management option in PD patients.
Introduction
The options for the management of advanced Parkinson’s disease (PD) are limited. Medical management, although beneficial early in the disease, requires polypharmacy and regular adjustments of multiple medications. An increased risk of medication-induced side effects, involvement of the non-dopaminergic circuits and refractory symptoms add further to this challenge.Reference Benninger and Hallett1 PD patients with refractory motor fluctuations and dyskinesias that cannot be managed pharmacologically can be treated with device aided therapies including deep brain stimulation of the subthalamic nucleus or globus pallidus interna.Reference Hariz2 In addition to being invasive, the need for highly specialized treatment centers, strict patient eligibility and lack of response of axial and gait symptoms further limits accessibility of this therapeutic option.Reference Lozano, Lipsman and Bergman3 These concerns highlight the need for alternative non-pharmacological and noninvasive, easily available therapeutic options in the management of fluctuations in PD. Noninvasive stimulation like repetitive transcranial magnetic stimulation (rTMS), transcranial direct current stimulation (tDCS) and transcranial alternating current stimulation (tACS) have been studied in PD patients as a therapeutic approach.Reference Strafella, Ko and Monchi4,Reference Nitsche, Lampe and Antal5 The improvement in clinical scores with the noninvasive stimulation in the limited number of studies is largely insufficient, but the ease of administration and minimal side effects make it an increasingly investigated therapeutic technologies in PD. rTMS and tDCS have been extensively studied in PD.Reference Fricke, Duesmann and Woost6,Reference Liu, Liu and Liu7 A novel stimulation technique involves transcranial pulsed current stimulation (tPCS). While tDCS uses a weak constant electrical current for anodal or cathodal stimulation, tPCS, on the other hand, uses a unidirectional pulsed flow of current causing phasic effects and possibly modulating the polarization of the membranes and changes in neurotransmitter effects, thereby indirectly altering the subcortical circuits.Reference Ganguly, Murgai, Sharma, Aur and Jog8,Reference Barra9 Anodal tPCS is seen to modify neuronal excitability by a combination of tonic and phasic effects. The tonic effects are due to the direct current component, while phasic effects of tPCS are due to the on/off nature of pulsatile currents. There is an inter-pulse interval between the constant unidirectional current flow, and long and short inter-pulse intervals can be applied.Reference Ganguly, Murgai, Sharma, Aur and Jog8 An earlier study showed the safety profile and acute, temporary beneficial effects of tPCS in patients with advanced PD and gait abnormalities.Reference Alon, Yungher, Shulman and Rogers10 Electromagnetically applied tPCS also showed improvement in movement speed and sit-to-stand tasks when delivered for over an 8-week period.Reference Jensen, Malling, Schmidt, Meyer, Morberg and Wermuth11 Since treatment of motor fluctuations remains a major unmet need in a large percentage of patients with PD, the safety, tolerability and the clinical and electrophysiological effects of tPCS were tested in this single-blinded study. This was compared with sham stimulation and levodopa on PD patients. It was postulated that tPCS, owing to its mechanism of conversion of direct current into pulsed flow and hence modulating neuronal activity through its static and dynamic effects, would lead to an improvement in PD symptoms and can be an additive therapeutic option in PD. Additionally, scalp electroencephalography (EEG) and its quantitative analysis were used as a tool to evaluate the physiological effects of tPCS and compare it with sham stimulation and levodopa administration.
Materials and methods
Ten patients with idiopathic PD (IPD) were recruited from the London Movement Disorders Centre in London, Ontario, for this pilot study (Research Ethics Board approved study: Western ethics number 114200). IPD was diagnosed by a movement disorder specialist in the out-patient visit using the Movement Disorder Society (MDS) clinical diagnostic criteria for PD.Reference Postuma, Berg and Stern12 Those with atypical Parkinsonism, drug-induced PD and advanced PD (modified Hoehn and Yahr stage 3 and above) and those who did not agree to consent for the study were excluded. Participants completed three visits with 1-month interval between visits. For each visit, all participants came in the levodopa drug OFF state (restricted levodopa intake for 12 hours prior to their visit) and completed the clinical evaluation including an MDS-sponsored Unified PD Rating Scale (UPDRS) revision (MDS-UPDRS) part 3 motor scoring, bradykinesia and tremor assessment using Xsens whole-body suit and gait examination on a gait carpet (Zeno Walkway way, Protokinetics LLC). Kinematic data pertaining to upper limb movements during reaching tasks were recorded using a robotic device (KINARM, BKIN technologies limited). After the initial assessment, a 5-minute EEG (quantitative EEG, qEEG) was performed in a quiet and dark room with each participant advised to sit comfortably on a chair and relax with their eyes closed during the EEG recording. Once the 5-minute EEG recording was over, the patients were given a 20-minute session of active tPCS stimulation (AddBrain® device), sham stimulation or levodopa, respectively, in the three visits and were then reassessed after a 40-minute break. In their first visit, patients received active stimulation. The second visit involved sham stimulation (electrode placements were the same as active tPCS, but the current was ramped down after 5 seconds), while in the third visit, the assessments were done before and after levodopa (no tPCS). In the first two visits, all participants were blinded to the type of tPCS stimulation (active or sham). The third visit was not blinded. After the 40-minute break, a 5-minute qEEG was repeated. This was followed by clinical and electrophysiological assessments for gait, bradykinesia and tremors. In all three visits, qEEG was again repeated at the end of each visit (approximately 2 hours post-tPCS/3 hours post-levodopa) (Figure 1).
Flow diagram of study protocol.

Gait analysis
Participants (n = 9 out of the total 10 participants completed the walking tasks, patient no 4 had severe knee joint pain secondary to knee joint osteoarthritis and hence did not agree to the walking task) performed 3 passes across the 6.10 m × 0.6 m Protokinetics Zeno Walkway gait analysis (Protokinetics LLC, Havertown, PA). At the end of each pass, participants turned and walked on the floor before starting on the walkway to complete one loop; a total of three self-paced walking loops were conducted. Footfalls were captured in real-time using the Protokinetics software (PKMAS). Partial footfalls at the start and end of the walkway were excluded from the analysis (∼5% of footfalls). Spatiotemporal gait parameters, including step length (cm), cadence (steps/min), stride velocity (cm/sec), walk ratio (step length/cadence), and the coefficient of variability (CV%) values of stride velocity and walk ratio were extracted offline using PKMAS. Normalized step length, cadence and velocity were calculated using each participant’s height using the formulas as outlined by Gauelle et al.Reference Gouelle, Norman, Sharot, Salabarria, Subramony and Corti13 These gait parameters were also computed for the age-matched healthy control group (n = 26) as a reference for the computation of z-scores. For each participant, a z-score representing the number of standard deviations separating the participant from the reference group’s mean z-score ([participant mean – control group mean] / control group standard deviation) for mean normalized velocity, normalized walk ratio, CV of stride velocity and CV of walk ratio were computed.
Objective measures of upper limb tremor and bradykinesia
Participants wore the Xsens whole-body suit, and the MVN®software (Xsens Technologies, Enschede, Netherlands) captured upper limb tremor and bradykinesia. The tremor severity score (TSS),Reference Delrobaei, Memar, Pieterman, Stratton, McIsaac and Jog14 measured in degrees (Deg), was assessed per upper limb in rest and postural positions (UPDRS-III items 20 and 21). TSS is assessed at each body joint, and tremor severity can be segmented based on the limb of interest. The motion capture system measures the angular displacement of all body joints, and non-tremor movements are eliminated. Thus, through the device, a full body tremor severity and segmental scores can both be calculated. For each upper limb, the forearm bradykinesia index (BKI) (the inverse BKI equation was utilized to clearly depict a higher BKI score representing worse bradykinesia severity)Reference Delrobaei, Tran, Gilmore, McIsaac and Jog15 was measured while participants performed a rapid hand pronation-supination task (UPDRS-III item 25). Briefly, upper limb motion was assessed at each joint angle in terms of standard deviation of the signal, variability in terms of time and amplitude and angular velocity. BKI was then calculated as the square root of the product of standard deviation and angular velocity divided by the product of variability in the time and amplitude.Reference Delrobaei, Tran, Gilmore, McIsaac and Jog15 TSS and BKI scores were extracted using custom-written MATLAB® codes as previously reported.Reference Delrobaei, Memar, Pieterman, Stratton, McIsaac and Jog14,Reference Delrobaei, Tran, Gilmore, McIsaac and Jog15
KINARM assessment
The participants were assessed using a two-joint manipulandum equipped with a virtual reality platform (KINARM endpoint robot). The robot allows the movement of the arm in two dimensions along a horizontal plane. The participants could see their fingertip position along with the virtual objects related to the tasks, while the vision of the subject’s arm was blocked using a black screen between the virtual reality screen and the subject’s arm. The robot calibration procedure was performed each time before starting the experimental procedure.
The participants were tested using a custom reaching task and were asked to perform a total of 40 trials on the subject’s right and left arm. The time limit for each trial was 5 seconds before which the subjects must reach the target, and the system would automatically continue with the next trial after the time limit. The task was divided into three categories: (1) reaching without perturbations, (2) reaching with continuous perturbations and (3) reaching with discontinuous perturbations. The force applied during these perturbations ranged between 1N and 4N. The data of the more affected limb were analyzed as the stimulation was done contralateral to the more affected side, and we did not want to analyze the assessment parameters of the other limb, which may not be influenced by the stimulation.
The data acquisition module in the robotic device collected the kinematic data pertaining to upper limb movement. The sampling rate for the data collected from the robot was 1000Hz. Using these kinematic data, the following five features were extracted to assess the effect of stimulation: target reach percentage (mean percentage of targets reached), mean velocity (mean velocity throughout the entire task), peak velocity (maximum velocity throughout the entire task), movement time (time taken from the movement onset to the end) and reaction time (time required to reach 10% of the total distance).
EEG recording
Resting condition eyes-closed qEEG data were recorded using 32 channels g. Nautilus g.tec’s wireless bio signal acquisition system. All data were recorded with a 256 Hz frequency sampling rate and stored on a personal computer. Both artifact detection and quantitative analyses were then carried out offline. The participant’s state of vigilance was controlled by visual inspection of EEG traces that include slow eye movements, appearance of sleep spindles and epochs with ocular, muscular and other types of artifacts, and these were not included in the analyses. During the offline analysis, each EEG recording was divided into 2-second artifact-free epochs, and a fast Fourier transform (FFT)-based spectral power analysis was performed for the following frequency EEG bands: delta (0.5–4 Hz), theta (4–8 Hz), alpha (8–13 Hz), beta (13–32 Hz) and gamma (32–100 Hz). The qEEG analysis from the patients was compared with the qEEG data from healthy participants that were available in our movement disorder laboratory from a previous database.
tPCS stimulation
The tPCS AddBrain® device delivered a monophasic pattern waveform with a pulse duration of 1 ms, intensity of 1 mA and modulation frequency of 1 Hz through a pair of saline-soaked surface sponge electrodes (25 cm2) (Figure 2). The anode was placed on the scalp over the left or right primary motor region (M1) contralateral to the more affected side assessed clinically, and the cathode was placed over the mid-thoracic spine. Each participant received 1 mA active stimulation in the first visit and sham stimulation in the second visit in a single-blinded fashion. Each participant was assessed before and after a single session of 20-minute stimulation (real/sham).
tPCS device.

Statistical analysis
The changes in pre- and post-active or sham tPCS, post-active and post-sham tPCS and post-active or post-sham tPCS and levodopa ON state were analyzed to determine the utility of tPCS as a therapeutic option in PD. Shapiro–Wilk test was used to examine the normalcy of the clinical scoring tool (UPDRS part 3 motor score). A two-sided paired t-test with unequal variance was used to compare the clinical scores pre- and post-tPCS and pre (OFF) and post (ON) levodopa in all participants. Nonparametric Wilcoxon signed-rank test was utilized (p < 0.05) to compare TSS and BKI scores per limb and normalized and variability spatiotemporal gait parameters before and after levodopa intake and pre- and post-active and sham tPCS (IBM® SPSS® statistical software, version 21). Wilcoxon signed-rank test was also utilized to compare KINEMATIC assessment between pre-active and pre-sham and between post-active and post-sham tPCS and between ON levodopa state and post-active or post-sham tPCS conditions.
Results
The demographic profiles of the participants are summarized in Table 1. tPCS stimulation was well tolerated by all participants. The only physiological effects noted with active and sham stimulation were tingling sensation over the parieto-occipital region in seven patients and mild dysgeusia in six. These were observed in both active and sham stimulation, subsided in a few minutes of stimulation, and participants could not differentiate between active and sham stimulation based on these sensations.
Demographic characteristics of the study population

LEDD = levodopa equivalent daily dosage; MoCA = Montreal cognitive assessment score.
Clinical assessment
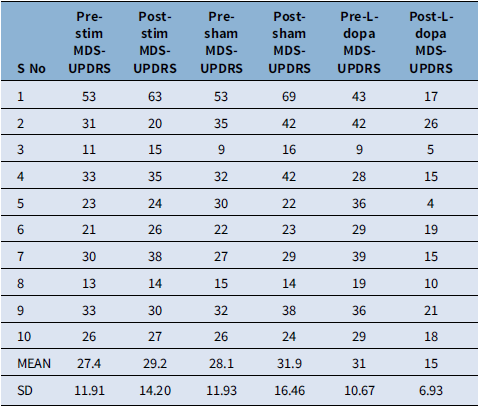
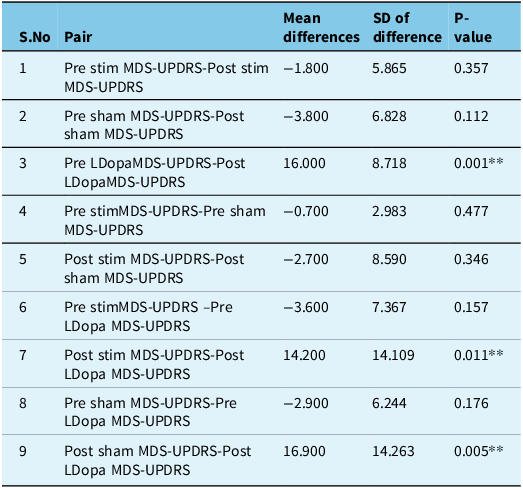
The pre- and post-intervention revised UPDRS part 3 motor score is presented in Table 2. Four patients had predominant left side involvement, while six patients presented with right-sided symptoms. The mean difference in pre- and post-levodopa UPDRS scores was statistically significant (p = 0.001). Pre- and post-active stimulation and pre- and post-sham stimulation UPDRS scores did not show any statistical difference (p = 0.357, p = 0.112, respectively); however, the mean difference between post-active stimulation and post-levodopa and between post-sham stimulation and post-levodopa was also statistically significant favoring the levodopa intake (p = 0.011, p = 0.005, respectively) (Table 3).
The MDS-UPDRS part 3 motor scores in the participants; pre- and post-active stimulation, pre- and post-sham stimulation and pre- and post-levodopa

MDS-UPDRS = Movement Disorder Society Unified Parkinson’s Disease Rating Scale.
Paired t-test showing significant difference in mean of the MDS-UPDRS motor scores between pre and post levodopa, post stimulation and post levodopa and post sham stimulation and post levodopa. (MDS-UPDRS – Movement Disorder Society Unified Parkisnon’s Disease Rating Scale)

P < 0.05* significant.
Tremor and bradykinesia outcomes
Assessment done post-levodopa significantly reduced upper limb rest tremor severity (Z = -2.366, p = 0.018) by 70.8% from 0.23 ± 0.19 Deg to 0.07 ± 0.05 Deg. Tremor severity during rest and postural positions was not significantly different between pre-active and pre-sham tPCS conditions per upper limb. No significant changes in tremor severity were observed pre/post-active or sham tPCS conditions. However, upper limb postural tremor severity was significantly lower (Z = -2.410, p = 0.016) by 45.5% following active tPCS (0.06 ± 0.05 Deg) compared to sham tPCS (0.11 ± 0.18 Deg) conditions. There were no significant differences in tremor severity during rest and postural positions in both upper limbs between the ON levodopa state (0.11 ± 0.24 Deg) and following active (0.13 ± 0.19 Deg) and sham stimulation (0.14 ± 0.17 Deg) (p > 0.05). No significant changes were observed in the forearm BKI score following the levodopa intake challenge and pre/post-active and sham tPCS conditions. The forearm BKI was not significantly different between pre-active and pre-sham tPCS conditions per upper limb. The forearm BKI score was significantly improved (Z = -2.028, p = 0.043) by 16.7% following active tPCS (1.03 ± 0.67) compared to sham tPCS (1.23 ± 0.68). No significant differences in the forearm BKI score were observed between the ON levodopa state (0.90 ± 0.34 BKI) and following either active (0.96 ± 0.56 BKI) or sham (1.05 ± 0.66 BKI) stimulation conditions.
Gait outcomes
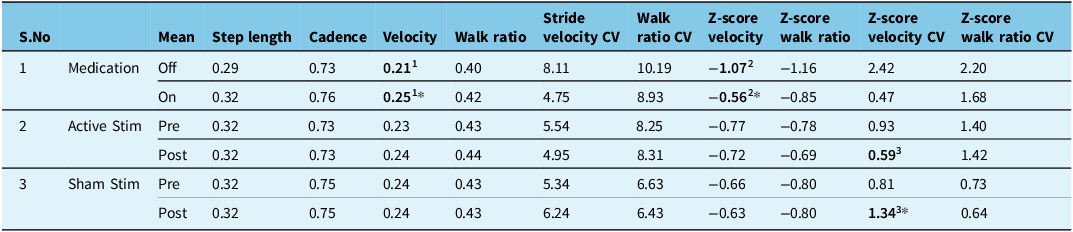
The levodopa challenge significantly increased (Z = -2.073, p = 0.038) normalized stride velocity by 15.2% in PD participants (Table 4). No significant changes in step length, cadence, walk ratio and variability of velocity and walk ratio post-levodopa were observed. No significant changes in gait measures were observed pre/post-active or sham tPCS conditions and between pre-active and pre-sham tPCS conditions. However, stride velocity variability was significantly improved by 20.7% following active tPCS (5.0 ± 3.0%) compared to sham tPCS (6.2 ± 3.1%) conditions. There were no significant differences in normalized step length, cadence, velocity and walk ratio between ON levodopa state and following active and sham tPCS conditions.
Normalized spatiotemporal gait parameters and z-scores of normalized and variability of stride velocity and walk ratio gait outcomes following the levodopa challenge (medication), active and sham Transcranial pulsed current stimulation (tPCS)

CV: coefficient of variability; 1, 2 & 3 represent the pairs where paired comparisons were made for statistical significance and were found significant (p < 0.05*).
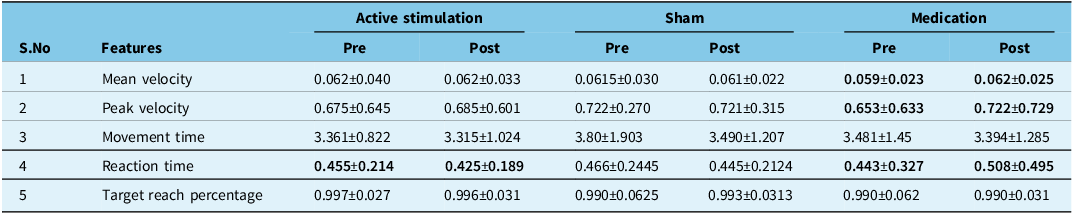
KINARM testing (Table 5)
The PD patients post-levodopa exhibited a statistically significant 5.7% increase in mean velocity, 9.97 % increase in peak velocity and 13.76 % reduction in reaction time compared to their pre levodopa scores. There was a statistically significant difference in the reaction time (p = 0.036) when comparing pre- and post-tPCS active stimulation. There was no statistically significant difference in the pre- and post-sham stimulation groups. There was a 4.7% reduction in reaction time after sham stimulation.
Patient performance before and after each visit on KINARM testing

Values in bold represent statistically significant differences (p<0.05) for paired comparisons made between pre- and post- results.
Comparing the performance of participants between the post-levodopa, post-active stimulation and post-sham stimulation, PD participants were also able to reach the target much quicker after active stimulation compared to sham. However, there was no statistically significant change in any of the features when comparing the post-component of the three visits.
EEG analysis
Compared to the baseline, there was an overall transitory increase of electrical activity after tPCS. The most significant increase occurred in the alpha bandpower (p = 7.95*10-07; z val: -4.93). The maximum effect was seen in the Brodmann area 5 (BA5) at the Cz electrode. Alpha bandpower also increased in the occipital lobe cortex BA19 at PO3 and PO4 electrodes. After sham, the overall transitory increase of alpha bandpower was significantly lower compared to tPCS (p = 7.19*10-06; z val: -4.48). Also, an overall increase of alpha bandpower was observed after levodopa administration; however, the increase was significantly lower than the increase generated by tPCS (p = 5.52*10-06; z val: 4.5438). Levodopa administration triggered a significant increase in the delta bandpower compared to baseline (p = 1.31*10-05; z val: -4.35). The maximum effect was in the frontopolar prefrontal cortex, BA10 at FP2, in the BA5 at Cz and over Broca’s area at FC5. An overall increase of delta bandpower was observed after sham stimulation; however, the increase was significantly lower than the increase generated by levodopa administration (p = 0.0035, z val: -2.9170). Importantly, tPCS did not increase delta bandpower in PD patients (p = 0.77; z val: -0.28).
Discussion
The clinical and electrophysiological effects of a single session of active tPCS stimulation, sham tPCS stimulation and levodopa were compared in this pilot project in 10 patients with chronic PD. The results were compared between and within groups. The tPCS procedure did not cause any major side effects in the participants. As highlighted earlier, the minor side effects of tingling and dysgeusia subsided in a few minutes. The clinical and objective-based assessments of PD symptoms showed a significant improvement with levodopa as compared to active or sham tPCS technique. This was expected, and it is a well-known fact that levodopa provides the best symptomatic relief in PD.Reference Ferreira, Katzenschlager and Bloem16,Reference Connolly and Lang17 There was an improvement in the reaction time post-tPCS on KINARM testing. These differences were not noticeable on clinical examination as represented by the lack of changes in the MDS-UPDRS part 3 motor scores. Objective evaluation using tool-based technology can provide granularity and precision in measuring symptoms that may not be possible during clinical examination. The active stimulation group showed an improvement in tremor and stride velocity variability as compared to sham tPCS. Both active and sham stimulation produced a positive neuromodulatory effect that was not significant on within group comparisons (pre- and post-evaluation). However, post-stimulation, the between group stimulation was significantly in favor of active stimulation on the parameters of tremor and stride velocity variability. With 10 participants in the pilot trial, it is difficult to explain this observation. However, we can hypothesize that the baseline parameters during the two evaluations at a gap of 1 month were not the same. The net difference, however, in the pre- and post-active stimulation, when compared to the same on sham stimulation, brought about a significant improvement. This could have been neutralized if the baseline (pre-stimulation) parameters in the two arms were similar, but re-assessment at 1-month interval in a disease as variable and fluctuating as PD makes this assessment difficult.
Noninvasive stimulation with ttDCS over motor and prefrontal cortices have been studied in PD, and these studies have shown improvement in gait and bradykinesia scores.Reference Benninger, Lomarev and Lopez18,Reference Valentino, Cosentino and Brighina19 Benninger et al. performed eight sessions of tDCS in levodopa “ON” state, delivering 2 mA of anodal tDCS through electrodes placed over prefrontal and premotor cortices.Reference Benninger, Lomarev and Lopez18 Likewise, Valentino et al., in 10 PD patients with freezing of gait, applied anodal tDCS for 5 consecutive days over the primary motor cortex delivering 2 mA current for 20 minutes and noticed a reduction in the number and duration of the freezing episodes. The authors postulated that the long-term changes in the synaptic plasticity induced by repetitive sessions lead to the clinical improvement after tDCS.Reference Valentino, Cosentino and Brighina19 Fregni et al. demonstrated an improvement in MDS-UPDRS part 3 motor score and simple reaction time in their patients after a single session of anodal tDCS delivering 1 mA current for 20 minutes over the left motor cortex. The beneficial effect was not seen on anodal stimulation of left dorsolateral prefrontal cortex or cathodal stimulation of left motor cortex.Reference Fregni, Boggio and Santos20 tDCS causes a sub-threshold shift of the resting membrane potential toward depolarization or hyperpolarization, depending on the direction of the current relative to the orientation of the tracts in the central nervous system.Reference Nitsche and Paulus21 These studies show promise that noninvasive stimulation may improve cardinal PD motor symptoms and that repetitive stimulation sessions may possibly be offered for longer lasting symptom relief. tACS and rTMS are other noninvasive modalities of cortical stimulation, with each modality having its own electrophysiological parameters and mechanisms for altering the cortical excitabilityReference Strafella, Ko and Monchi4,Reference Nitsche, Lampe and Antal5 (Table 6).
Comparison of various non-invasive stimulation techniques

Transcranial pulsed current stimulation (tPCS), delivers current as unidirectional or bidirectional pulses of short duration and varying frequencies.Reference Alon, Roys, Gullapalli and Greenspan22 It offers less impedance to current flow as compared to tDCS, thereby supposedly causing more pronounced and less variable effects when compared to tDCS.Reference Alon, Roys, Gullapalli and Greenspan22 Alon et al. tested 10 patients with tPCS alone, treadmill alone and tPCS and treadmill walk. A 20-minute tPCS session increased gait velocity and stride length significantly compared with treadmill and tPCS and treadmill combined.Reference Alon, Yungher, Shulman and Rogers10 Likewise, Jensen BR et al. showed improvement in motor speed and bradykinesia in 16 patients who were given long-duration tPCS for 3 home-based sessions of 30 minutes each for 8 weeks with a 1 week pause in between.Reference Jensen, Malling, Schmidt, Meyer, Morberg and Wermuth11 Unlike our experiment, where a single session of tPCS was delivered, their study assessed patients after repetitive sessions of tPCS. We tested the effects of tPCS not only on the gait but also on other cardinal symptoms of PD, bradykinesia and tremors. Also, we compared the effects of active stimulation to levodopa, considered to be the gold standard drug in the management of PD patients, and to sham stimulation, to eliminate the placebo effect, which has not been done before. A proposed mechanism leading to improvement in the network circuits is the upregulation of the motor drive through a positive electric charge.Reference Polania, Nitsche and Paulus23 Studies on noninvasive stimulation in chronic pain patients have shown that the immediate beneficial effects in pain relief are mediated through the release of neurotransmitters, notably endorphins and monoamines.Reference Airapetov, Zaichik and Trukhmanov24,Reference Gabis, Shklar and Geva25 If a similar mechanism of neurotransmitter release aids in improvement of some parameters, it can only be hypothesized at this point in time and needs to be substantiated with a detailed study and a larger patient group before drawing any significant conclusions. We did a quantitative scalp EEG using FFT-based spectrum power analysis to see the changes brought about by tPCS stimulation and levodopa. A baseline qEEG analysis was followed by repeating the qEEG after 40 minutes of intervention. A repeat qEEG analysis was performed at the end of the study in each visit to see if the physiological effects of the intervention lasted till the end of each patient’s assessment. In an earlier study by Schoellmann et al., qEEG assessments in PD patients after tDCS were studied. They did an EEG pre-stimulation, immediately after and 30-minute post-stimulation and found positive effects on the neuronal circuitry post-tDCS. We kept a time limit of 40-minute post-stimulation as the time of EEG recording.Reference Schoellmann, Scholten and Wasserka26 Since this was a novel approach to stimulation, and not many studies in literature existed as to when the changes would be best observed, hence it was decided on acute rather than chronic observation, and we chose 40 minutes as a reasonable amount of time to avoid prolonged fatigue-related effects. Patients spent a substantial amount of time in the laboratory in this study, and therefore, we wanted to avoid the fatigue effect.
In our patients’ group, resting state eyes-closed EEG showed a significant increase in delta bandpower on levodopa administration. On active stimulation, a significant increase occurred in the alpha bandpower. Compared with healthy controls, PD patients show an increase in delta bandpower.Reference Dubbelink, Stoffers and Deijen27,Reference Guner, Tiftikcioglu and Tuncay28 The increase of delta bandpower is also present in greater cognitive decline, a decline in the Rey Auditory-Verbal Learning Test dementia.Reference Caviness, Hentz and Evidente29,Reference Caviness, Hentz and Belden30 The increase in delta bandpower after levodopa administration cannot be explained in our group of patients. All our included patients had a normal MoCA score, and a significant clinical improvement was noted in the MDS-UPDRS part 3 motor score post-levodopa, contrary to the earlier observations. Since a decrease in alpha band is significantly related to cognitive decline in PD patients, the increase in alpha bandpower after tPCS may help to delay or decrease the cognitive decline.Reference Guner, Tiftikcioglu and Tuncay28,Reference Caviness, Hentz and Belden30 The effect of levodopa is transitory in nature determined by a fast increase of dopamine that occurs in less than 30 minutes after the drug administration and on average lasts 3–4 hours. Soon after levodopa administration, alpha and beta rhythms increase in the centroparietal regions.Reference Henderson-Smith, Fisch and Hua31 The effects after repeated noninvasive stimulation (if tPCS is repeated for 2 weeks) are likely to result in quasi-permanent (structural) brain changes, which may take days to occur and can last about 1 month. Cognitive changes (improvements) and even motor improvements are unlikely to occur immediately during the transitory regime after tPCS during the 2–3 hours time frame of our monitoring. Hence, it can be inferred that tPCS and dopamine provide improvements potentially in different ways within very different time frames, and this makes tPCS a promising adjunct therapy to dopamine in PD management.
There are major limitations with our pilot trial. Though randomization is the standard practice in intervention trials, our active and sham stimulation sessions were not randomized; however, our patients were blinded to the kind of stimulation they were receiving in their visits. We excluded patients with advanced PD because levodopa response diminishes in advanced disease. We wanted to compare the effects of active tPCS with levodopa, and hence, we selected early PD patients having a good ON levodopa response. A single 20-minute session appears to be too weak to draw conclusions on any significant changes being introduced in a chronic neurodegenerative disease. Repeat sessions are needed to study the best therapeutic response in these patients. The site of stimulation was specified to the contralateral primary motor area and assessed clinically. This may not have been the best option as PD involves several brain regions, and the site of stimulation should be determined by the most troublesome and bothering symptom to get the best beneficial effects. However, we wanted to establish the safety and efficacy of tPCS in PD patients before it could be offered to a larger patient group with repeated, at-home-based sessions. These shortcomings will guide us to direct further studies aimed to determine if tPCS can be used as an adjunct therapy to improve PD motor symptom management.
Conclusions
Our pilot study with noninvasive stimulation was well tolerated by all subjects. A single 20-minute session showed an improvement in some physiological parameters using objective tools and quantitative EEG though true clinical benefits were not obvious. With an established safety profile of tPCS, a larger study group with repeat sessions and different stimulation sites based on the clinical manifestations should be planned to determine the maximum therapeutic advantage of this novel modality.
Author contributions
DK: Manuscript preparation, clinical evaluation, data analysis; OS: gait analysis and gait experiments, EEG recording, manuscript preparation; YT: KINARM measurements and data interpretation; JG: Manuscript preparation, clinical analysis; DA: quantitative EEG analysis and interpretation; MJ study design, sstudy conceptualization, manuscript editing.
Funding statement
None.
Competing interests
None to declare.


Target article
Transcranial Pulsed Current Stimulation (tPCS) in Parkinson’s Disease: A Pilot Trial
Related commentaries (1)
Reviewer Comment on Kulshreshtha et al. “Transcranial Pulsed Current Stimulation (tPCS) in Parkinson’s Disease: A Pilot Trial”