


Early research suggested that education was a major factor in structuring rates of political participation. Better educated citizens were more likely to vote and to engage in other civic activities (e.g. Almond and Verba Reference Almond and Verba1963; Campbell et al. Reference Campbell, Converse, Miller and Stokes1960; Merriam and Gosnell Reference Merriam and Gosnell1924; Milbrath Reference Milbrath1965; Nie, Junn, and Stehlik-Barry Reference Nie, Junn and Stehlik-Barry1996). The effect was large and remarkably persistent in individual-level cross-sectional analyses probing political behavior. One review of the literature concludes, “the relationship between education and political participation is perhaps the most well-established relationship that exists in research on political behavior” (Persson Reference Persson2015: 689). Similar conclusions have been drawn with respect to the impact of education on other aspects of social capital such as connectedness, social trust, and political knowledge (Alesina and Ferrara Reference Alesina and Ferrara2000; Glaeser and Sacerdote Reference Glaeser and Sacerdote2008; Helliwell and Putnam Reference Helliwell and Putnam2007).
Over the past decade, scholars have begun to question this venerable causal claim.Footnote 1 Skeptics note that the empirical evidence is associational and thus subject to unmeasured confounders. Indeed, there are good reasons to suspect that education may be proxying for underlying characteristics of the population that have nothing to do with education per se. Genetic or personality characteristics, early childhood socialization, or peer groups may encourage individuals to pursue education and to engage in civic activity. In addition to these individual-level confounders, there are potential geographic confounders. In areas where educational opportunities are plentiful, opportunities to engage in civic activities may also be plentiful. As is common with observational research, the potential confounders are difficult to identify, measure, and test.
In a notable study, Kam and Palmer (Reference Kam and Palmer2008) use propensity score matching to balance on various pretreatment characteristics and find that there is little or no relationship between higher education attainment and political participation. They interpret these findings as showing that education serves as a proxy for other characteristics that are related to participation. Kam and Palmer’s findings were later critiqued by Henderson and Chatfield (Reference Henderson and Chatfield2011) and Mayer (Reference Mayer2011), who argue that pretreatment covariate imbalance remains (and perhaps even worsens) after Kam and Palmer’s matching. They argue that as covariate imbalance is ameliorated, estimates of the impact of education on participation converge to positive values rather than the null effect estimated by Kam and Palmer. Overall, this exchange highlights the difficulty of learning about the effects of education using observational data.
To remedy these deficiencies, recent work on the subject enlists stronger research designs. This includes panels designs (Highton Reference Highton2009), field experiments (Sondheimer and Green Reference Sondheimer and Green2010) as well as exogenous instruments suitable for instrumental variable (IV) or regression discontinuity (RD) designs based on draft lotteries (Berinsky and Lenz Reference Berinsky and Lenz2011), compulsory school reforms (Milligan, Moretti, and Oreopoulos Reference Milligan, Moretti and Oreopoulos2004), discontinuities in school entry age (Persson, Lindgren, and Oskarsson Reference Persson, Lindgren and Oskarsson2016), or exam scores with a cutoff for entry to a university track (Hangartner et al. Reference Hangartner, Schmid, Ward and Boes2020).
Findings from these studies are mixed. A recent review concludes, “this is an unsettled issue on which different studies show contradictory results” (Persson Reference Persson2015: 696). It could be that conflicting findings result from shortcomings in research design (Hangartner et al. Reference Hangartner, Schmid, Ward and Boes2020; Persson Reference Persson2015). Or it could be that education has differing effects depending upon the context. Heterogeneity may arise across different countries or regions, different periods, different sorts of respondents, or different schools, for example.
In any case, high-quality studies cover a limited empirical terrain. They are generally situated in rich countries with long democratic histories and focus mostly on primary and secondary education. Only two (Berinsky and Lenz Reference Berinsky and Lenz2011; Hangartner et al. Reference Hangartner, Schmid, Ward and Boes2020) centers on university education, where prior work suggests the strongest impact on social capital might arise. Treatments in these studies were administered in the postwar era (1950s–1970s), which makes them ideal for examining long-term effects but precludes the analysis of short-term effects or contemporary effects. (Plausibly, higher education has a different effect today than it did several decades ago.)
In conclusion, despite a mountain of observational work and several studies that exploit random or as-if random treatments we do not know whether, or under what circumstances, education might enhance social capital. A question that once seemed settled now seems unsettled.
In this study, we enlist a unique research setting in Romania, which allows for a fuzzy RD design separating those qualified to matriculate to university from those unqualified to do so. The advantages of this design relative to other recent studies may be briefly noted. In our discussion, we pay special attention to Hangartner et al (Reference Hangartner, Schmid, Ward and Boes2020), which represents the state-of-the-art RDD approach to this topic.
First, the treatment occurs at the point of graduation from high school, on the eve of applications to university. This means that estimates of the treatment effect are focused narrowly on tertiary education, as distinguished from primary and secondary education.
Second, we are able to compare those who receive a university education with those who (in most cases) receive no university education at all. This is because private and public universities generally apply the same criteria – passage of a nationwide baccalaureate exam (the bac) – and there are few alternate paths to higher education in Romania. By contrast, aspiring college students in richer countries have many options available to them. Our study, therefore, features a stronger treatment and one that accords with an important theoretical and policy question: Does university education per se affect social capital?
Third, the sample is drawn from a cross section of Romanians whose scores on the bac fall just above and below the cutoff. This is known because the Romanian government posted test results and the names of each test taker after every bac, a unique practice (to our knowledge). Students whose bac scores fall within our chosen bandwidth comprise a large group whose sociological and economic characteristics are known and can be compared to population averages (based on post-survey questions). It is also the group of greatest policy relevance. Note that any expansion (contraction) of tertiary education is likely to include (exclude) marginal students. So, the impact of education on these students is more policy relevant than the hypothetical impact of higher education on students who are highly likely, or highly unlikely, to obtain a post-secondary degree, regardless of government policy (loosely speaking, always takers and never takers).
Fourth, because the sample is large and the measurement of exam scores is relatively fine-grained, it is plausible to employ a continuity-based approach to analyzing the RD design (with appropriate modifications and robustness checks as discussed below). By contrast, Hangartner et al. (Reference Hangartner, Schmid, Ward and Boes2020) employ an exam with a less differentiated scoring system, which they regard as discrete rather than continuous.
Fifth, because the number of exam takers is enormous (roughly 150,000 each year), we are able to focus on a very narrow bandwidth: ± 0.2 around the cutoff on a 10-point scale. We are, therefore, able to ex ante concentrate our statistical power on estimating the relationship between the score variable and dependent variable close to the threshold. Furthermore, the assumptions of our research design may be considered more plausible given this narrow bandwidth for our data. By contrast, Hangartner et al. (Reference Hangartner, Schmid, Ward and Boes2020) employ a wide bandwidth that stretches across 5 points (± 2.5 of the cutoff) on an 18-point scale.
The present study was initiated at this journal as a registered report, and was also preregistered at EGAP.Footnote 2 A few small deviations from the pre-analysis plan are noted below.
We find that university attendance in Romania increases social capital as measured by our composite index, corroborating the main hypothesis. A subsidiary hypothesis pertaining to monotonicity in this effect over time (as exposure to university accrues) cannot be confirmed. There is some evidence in favor of the second subsidiary hypothesis pertaining to heterogeneous effects: among subjects from poor families the (positive) impact of higher education on social capital appears to be greater than among subjects from richer families. An exploratory analysis (not preregistered) disaggregates the composite index of social capital. Here, it is discovered that university attendance has a stronger apparent effect on voting and trust than on membership in organizations and other sorts of participatory activities, though the latter may be a product of a lumpy scale.
The sections that follow lay out our theory and hypotheses (Section I), research design (Section II), analysis of the primary hypothesis (Section III), analyses of the subsidiary hypotheses (Section IV), exploratory analysis (Section V), and a discussion of interpretation and generalizability (Section VI).
Theory and hypotheses
For present purposes, the concept of social capital encompasses a variety of individual-level behavioral and attitudinal outcomes including political participation, civic participation (e.g. membership in voluntary associations), network centrality, feelings of political efficacy, and social and political trust. These outcomes tend to co-vary and are also presumably causally interrelated. Moreover, theorizing about the impact of education on these outcomes tends to invoke a similar set of assumptions and expectations. Thus, from both empirical and theoretical perspectives, it makes sense to treat these outcomes as components of the same overall phenomenon.
There are good reasons for imagining that education might have a positive impact on social capital (so defined). Education enhances knowledge and skills – the “cognitive proficiency” (Nie, Junn, and Stehlik-Barry Reference Nie, Junn and Stehlik-Barry1996: 6) – needed for engaging in political and civic activity (Almond and Verba Reference Almond and Verba1963). As such, it should enhance feelings of efficacy (Jackson Reference Jackson1995: 280). Education may also instill a civic culture, perhaps through peer effects (Klofstadt Reference Klofstad2007), according to which participation in political and civic life is highly valued (Galston Reference Galston2001). Education, finally, may enhance an individual’s network position, which in turn affects one’s probability of engaging in political and civic activities (Nie, Junn, and Stehlik-Barry Reference Nie, Junn and Stehlik-Barry1996; Sondheimer and Green Reference Sondheimer and Green2010).
The literature on these subjects is vast and nearly uniform in its theoretical expectations. There is some disagreement over whether education is a positional good (Nie, Junn, and Stehlik-Barry Reference Nie, Junn and Stehlik-Barry1996) or an absolute (non-rival) good (Persson Reference Persson2015: 690–92). But expectations derived from either model suggest that education should have a positive impact on social capital considered at individual levels. Even those who are dubious of the positive impact of education on social capital do not argue the contrary. What they doubt is whether the treatment (education) is sufficiently strong to outweigh other – perhaps more deeply rooted – features of individuals, families, and societies. In other words, there is a positive hypothesis and a null hypothesis; there is no negative hypothesis, at least none that we have encountered in the published literature. Accordingly, we hypothesize that university education – considered as a binary treatment – enhances social capital. We do not attempt to set forth specific, testable hypotheses about the causal mechanisms at work in this relationship as the causal hypothesis is highly uncertain (as our review of the literature amply demonstrates).
In addition, we offer two subsidiary hypotheses.
First, we hypothesize that university education – measured by the number of years of tertiary education completed – has a monotonic effect on social capital. If education matters, more education should matter more (or at least not less), even if each additional step on the educational ladder is not equal. (Plausibly, the first and last years, or the start and completion of a degree, maybe the most decisive thresholds.) We are not in a position to judge the long-term impact of higher education as our sampling frame begins in 2015, as explained below. Thus, whether the university effect attenuates overtime after graduation will not be testable in the current study (though it is something we hope to test in follow-up studies of the research group).
Second, we hypothesize that the impact of education on social capital is greatest for individuals from low socioeconomic backgrounds. This is consistent with research showing that educational investments and interventions often have differential effects on students from different social classes, with the least advantaged enjoying the greatest gains (Ashenfelter and Rouse Reference Ashenfelter and Rouse1998; Palardy Reference Palardy2008; but see Altonji and Dunn Reference Altonji and Dunn1996; Hastings et al. Reference Hastings, Neilson and Zimmerman2013). It goes against findings from Hangartner et al. (Reference Hangartner, Schmid, Ward and Boes2020), who find no differential class effects on political participation from university attendance. However, their study, based in Switzerland, probably does not include many subjects who would qualify as poor so a variation on this key background factor may be limited.
The measurement of our main hypothesis and two subsidiary hypotheses is addressed below.
Research design
In most countries, tertiary education is a decentralized good, allocated in a variety of unstandardized ways. There are many ways to get into college, and thus many characteristics that might distinguish university students (or former students) from those who do not matriculate. This makes it difficult to estimate the causal effect of a college education, as noted. Even where random or as-if random treatments are discovered, the subpopulations exposed to these treatments are often small and idiosyncratic, and therefore difficult to generalize upon.
Romania is a middle-income country in Central Europe with a legacy of communist rule and a fairly educated populace (see Section VI). One of the legacies of the Soviet era is an education system run largely by the state, access to which rests on a nationwide high school exit exam. The bac is the final assessment that high school students in Romania take at graduation. The results of the exam determine eligibility for college education as well as chances of admission to a student’s university and major of choice.
Two exams are administered each year, in July and August–September, respectively. The second session is only for students who did not pass or did not qualify to sit the bac in the first session. High school graduates are entitled to take the bac free of charge twice. If the student does not pass either of the two attempts, she can continue to sit the exam but must pay a fee. All high school students in good standing are automatically registered for the first session of the bac, and students have nothing to lose by taking the bac, even if they fail. Accordingly, attendance at this annual test taking ritual is nearly universal: nearly, all graduating seniors take the first session of the bac. (Naturally, this does not include students who attrit prior to completing high school; however, dropout rates are low in Romania.Footnote 3 )
Most bac takers sit for three different subjects, which determine the final average and the student’s qualifications to progress to university. Exams are marked from 1 to 10. A grade of at least 5 on each of the three subjects and an overall average of at least 6 is required to pass. Graduates of high schools where the language of instruction is in an ethnic minority language (Hungarian or German) must pass an additional exam in their mother language and literature. We exclude these students (of whom 1,133 fulfill our other criteria), restricting our sample to those whose schooling is conducted in Romanian.
Exam administration
Written exams are administered in large centers incorporating 250–450 students, and is led by an examination commission composed of teachers and university professors. The location is heavily monitored with security cameras. To further ensure the integrity of the process, the content of each exam is randomly extracted on the day of the exam on national television. Completed exams are sent to 41 centers (1 center per county) across the country to be graded. Exams are anonymized, and the allocation of exams to examiners is randomized.
Any student who is not happy with the results can challenge grades assigned to individual exams. (One may not challenge the overall grade.) In the first session of 2017, roughly 22% of bac sitters challenged their grades on at least one of the subjects. In this instance, the exam is regraded by a county-level committee. In order to avoid complications due to challenges, we define our score variable based on the initial (pre-challenge) overall exam grade.Footnote 4
Cheating and other possible manipulation
Cheating on the bac might pose a challenge to the assumption of as-if random assignment across the cutoff. If those who barely pass did so by cheating, and those who barely fail did not cheat, then the treatment and control groups identified by the RD design are unlikely to be similar on background characteristics. While cheating has historically been a problem in the administration of the bac (Borcan, Lindahl, and Mitrut Reference Borcan, Lindahl and Mitrut2017), the practice appears to have largely ended by 2015. While there may still be sporadic cases, we are confident that they will not bias our analysis.
Two major events account for this change. First, a new law in 2011 introduced the use of large exam centers, supervised by cameras, for written exams. Prior to that, examinations took place in high schools across the country with no centralized system of supervision. The impact of this reform can be seen in the national success rate of bac takers, which dropped from 67.4% in 2010 (Neagu Reference Neagu2010) to 44.5% in 2011 (BAC 2011). Most observers believe that the reform had its intended effect, making cheating much more difficult (Borcan, Lindahl, and Mitrut Reference Borcan, Lindahl and Mitrut2017: 182). Second, the Romanian anti-corruption agency investigated the problem in 2012–2013, leading to the criminal investigation of hundreds of collaborators, most of whom were teachers (Craciun Reference Crăciun2013). The importance of these criminal investigations in altering behavior was emphasized in discussions with Valentina Dimulescu of the Romanian Academic Society, the most important NGO monitoring corruption in Romania (Dimulescu Reference Dimulescu2018).
Thus, we have good reason to believe that cheating is now rare. Even so, we must be concerned if any remaining cheating allows students to sort themselves on either side of the cutoff for our treatment variable, which measures a student’s score on their first attempt (prior to any challenges they might make). Fortunately, most methods of cheating would not have this effect. In-exam cheating (e.g. “cheat sheets” or students copying each other’s answers) is not limited to students who fall just below the cutoff for the simple reason that students do not know whether they fall into that category. In-exam cheating, if effective, is likely to result in a high score, pulling cheaters outside our narrow window.
Post-exam cheating is potentially more threatening to our design because in this situation students know their score, which means that those who fall just below have a greater incentive to cheat than those who fall above the passing score. However, this sort of cheating is very difficult to accomplish under the current system. It is also much more likely to occur after the first round of testing when students discover that their opportunities for college are foreclosed. (Our fuzzy RD design focuses only on the first exam, so anything that occurs after the first exam should not introduce systematic bias.) Insofar as post-exam cheating exists, we presume that cheating students – who presumably sacrifice a considerable sum of money and risk prosecution – will want more than a very small bump in their score; they will want a “good” score, well above the threshold required for admission to the university. (Bear in mind that only the less competitive universities and departments of study are available to those who barely pass the bac.) For this reason, as well, post-exam cheating is unlikely to jeopardize the results of our analysis.
Ex Ante Evaluations of Threats to as-if random assignment
Before collecting our survey data, the unique nature of our data and design allow us to conduct a more general, albeit less direct, test of possible manipulation of exam scores around the cutoff. Using the Romanian government’s public website, we have obtained the publicly available bac scores for all students who took the exam between 2004 and 2019. If sorting is occurring around the cutoff, it seems likely that it is primarily in the direction of passing. In this scenario, we ought to observe a break in the density of observed exam scores. By contrast, a more encouraging pattern would be if the distribution of exam scores varied relatively smoothly around this threshold.
Figure 1 presents histograms of students’ overall bac scores, separated into the periods before and after anti-cheating measures were fully in place (2004–2014 and 2015–2019, respectively). Informally, we should focus on whether the difference between the histogram bins immediately above and below the threshold is notably larger in magnitude than that between other adjacent bins across the distribution. In the earlier time period, there is a noticeable jump at the threshold. Indeed, it is the largest jump across all adjacent bins in the histogram. Although not definitive, this suggests problematic sorting around the cutoff and is consistent with descriptions of widespread cheating prior to 2015. By contrast, the histogram in the right panel of the figure shows a difference between the height of the two bins around the threshold that is fairly typical of those throughout the rest of the histogram, suggesting that sorting across the threshold was minimal between 2015 and 2019.
Histograms of Student Average Bac Scores.
NOTES: Left (right) panel shows histograms of overall bac scores among students scoring at least 5.0 on each component for those taking the exam from 2004 to 2014 (2015–2019). Vertical dashed line indicates 6.0 threshold for passage.

The histograms presented in Figure 1 offer an informal diagnostic with respect to possible sorting. As a complement, we conduct manipulation tests following Cattaneo, Jansson, and Ma (Reference Cattaneo, Jansson and Ma2018).Footnote 5 These tests estimate the density of the score variable in a neighborhood below and, separately, above the threshold, providing a formal test of the hypothesis that the density immediately to the right and left of the threshold are different. Figure 2 shows the results of this analysis. The left panel includes tests for the period 2004–2014, which we do not plan to use given the abovementioned concerns about cheating as well as a mix of different exam policies and grading rules. The right panel shows tests for the period 2015–2019, which we plan to use for our analyses. As is evident from these results, the data from the earlier period shows evidence that is strongly consistent with manipulation around the threshold of 6.00. The t-statistic for the null hypothesis of no jump in the density is 17.2 (p < .0001) in the earlier period. By contrast, the data from 2015 to 2019 shows only a small jump in the density at this threshold – one that does not reach the standard .05 significance level. This does not prove that there was no sorting around this cutoff in the later period, and it should be noted that the p-value for our test here is 0.15, which provides at most weak evidence of a small jump.
Nonparametric Density Estimates on Either Side of Exam Score Threshold.
NOTES: Left (right) panel shows estimated density with 95% confidence interval for individual student bac scores from 2004 to 2014 (2015–2019), estimated separately above and below passage threshold using approach introduced by Cattaneo, Jansson, and Ma (Reference Cattaneo, Jansson and Ma2018). Note that their approach uses different methods for point estimates and confidence intervals, which can result in estimates (lines) falling outside of confidence bounds (shaded regions). This is due to the differing optimality criteria for point estimation and inference. Accordingly, in addition to this MSE optimal point estimate (dashed line), we also plot an estimate constructed simply by taking the average of the upper and lower bounds for the confidence interval at each point (solid line). Our ultimate inferences about possible sorting, which are based on the confidence interval rather than point estimates, however, are unaffected by this decision.

Although we cannot dismiss the possibility of cheating entirely, it seems unlikely that there are very many rule breakers in the more recent time period (2015–2019) from which we draw our sample.
Admission to university
The process of admission to university occurs in two rounds, in July and September, respectively. As such, bac takers from both the June to July and August to September sessions may be eligible for university admission. However, the September round of university admissions is meant to fill the allotted spots unoccupied after the July round, thus making it more difficult for the bac takers from the August to September session to be admitted to the university. The admissions process is strict and explicit, as each course of study in each university has a precise formula for admission. Most majors in most universities use the final grade from the bac as the sole entrance criterion; some adopt additional criteria.
While the exam strongly affects students’ college attendance, obtaining an average of at least 6 on the bac is neither a strictly necessary nor sufficient condition for a candidate to be admitted to her university of choice. Students who pass the exam could decide against attending university, perhaps because they did not get into their most preferred school or due to events in their personal lives. Conversely, a student who failed the bac on her first attempt could retake it and ultimately pass, subsequently matriculating to university. Alternatively, because our score variable is the initial exam average, students could improve their initial score by challenging the results of one or more of their subject exams, which may result in an average above the 6.0 threshold.
The formulas for admission (i.e. how much weight the bac and the special exam have in the final decision) are known in advance, and admission results are public. Tuition is waived for candidates with the best test scores; the rest must pay. However, tuition fees are rather low and not prohibitive for most families. For instance, yearly tuition at the University of Bucharest ranged between 2,500 ($614) and 4,000 lei ($980) per annum for 2017–2018 (Dumitru Reference Dumitru2017), less than the national average monthly salary (Calculator salarii 2019).
Students who do not pass the bac can still enroll in vocational schools (scoala postliceala) where they learn skills that prepare them for blue-collar jobs. These vocational programs are shorter (1–3 years) than university programs and are usually organized within high schools. The curricula include narrow subjects related to specific skills that require less intellectual ability than university courses. Subjects are taught by high school teachers. In the nomenclature of the Ministry of Education of Romania, this form of education is considered preuniversity, i.e. part of secondary education (Ministerul Educaţiei Naţional). A few Romanians are privileged to attend school outside the country; however, they are unlikely to secure a place in foreign universities – where standards are generally stricter – unless they also pass the bac.
Noncompliance, cutoff, bandwidth
In summary, two problems of compliance arise in this RD design. Recall that the cutoff is defined by a student’s score on her first exam. Some students retake the exam, eventually manage to pass it, and matriculate to university, thus receiving the treatment of theoretical interest. Likewise, not everyone who passes the exam chooses to continue their education at the university level. Although those who pass the exam are not formally guaranteed a position at a university, in practice there are typically enough spaces for all passers who want to attend, even though they may not all be able to attend the university of their choice. And although tuition costs are minimal, there are opportunity costs to pursuing a university education.
Thus, the treatment is not assigned perfectly based on a student’s bac score as it would be in a sharp RD. It is difficult to say, ex ante, how large these compliance problems might be, i.e. how much slippage there is on either side of the cutoff. However, it is clear that it is much easier for students to attend university if they pass the bac than if they do not. Therefore, we expect a large jump (discontinuity) in the probability of attending university between those who barely fail and those who barely pass, which creates an occasion for a “fuzzy” RD design. Our causal estimand is, therefore, the effect of treatment (college attendance) among compliers, where a complier is understood as someone who would have gone to college if they passed the bac and would not have gone to college if they failed.
Passing the bac requires obtaining at least a 5 on each part of the exam and at least a 6 for the average of all parts. Within this group, there is a single cutoff (at 6) for exam passage, facilitating a straightforward RD setup in which overall bac average is the score (or running) variable and university attendance is the treatment variable. The bandwidth is defined narrowly as scores falling within 0.2 of the cutoff. Between 2015 and 2019, 462,943 students took the bac for the first time and graduated from Romanian (nonminority) high schools. Of these, 19,402 obtained scores that fell between 5.8 and 6.2 and scored at least 5 on each part of the exam. This is the population of immediate interest.
Recruitment
Until 2020, the Romanian Ministry of Education posted all bac exam results complete with each exam taker’s name, score, and high school.Footnote 6 In this fashion, we identify the students who fall within our sampling frame (N = 19,402). Recruitment into the survey involved several steps.
First, we identify those high schools with at least one student in our target population (N = 1,321), and randomly assign them a number (from 1 to 1,321). This determines the order in which high schools are contacted. Second, we search for students in our sampling frame through Facebook (FB). FB usage is high in Romania, especially among our target population. An analysis conducted in January 2017 found that 93.2% of Romanians between the ages of 15 and 24 use FB.Footnote 7 Third, we invite these individuals to be FB friends with one of our online accounts (labeled “Social Attitudes in Romania”). The invitation mentions that they are invited as graduates of their high school, which was randomly selected for our study. Fourth, we send messages to each of the graduates from their high school FB account inviting them to participate in the survey.
This procedure raises several potential problems. First, there is a problem of identifying the correct individuals from each high school given that some names (even within the same high school) are likely to be identical. To alleviate this problem, we ask respondents to name the high school from which they graduated and their year of graduation. If these responses do not match records drawn from the government website – or if a survey is begun but not completed – it is eliminated. Slightly over 100 surveys (N = 102) are eliminated on this basis, roughly 0.07% of the total.
The second anticipated problem was that women would be harder to identify, as they are likely to change their last name after marriage. As it turns out, FB has mechanisms for identifying women who may have changed their last names which meant that we were able to contact women at roughly the same rate as men. Response rates were also similar – 10.2% for women and 12.2% for men.
The third issue is that participation in FB may be posttreatment, a product of entering university. To address this potential bias, we calculated the percentage of those sampled whom we were able to locate on FB, above and below the cutoff. The two statistics are very close: 86.75% above the threshold and 86.8% below the threshold. Accordingly, there is no indication that attending a university affects one’s propensity to engage on FB. We also tried to retrieve information about the date that each FB account was opened (as per our PAP), but we were unable to do so.
Our final dataset includes 1,515 correctly identified respondents from 893 high schools. Summary statistics describing this sample are displayed in Table B1. Sample size is somewhat lower than the target that we initially envisioned.Footnote 8 The reason for this shortfall is twofold. First, the process of recruitment was slower than anticipated. Second, the arrival of COVID-19, and subsequent shuttering of universities across Romania in March, 2020, meant that the treatment of theoretical interest was altered (from in-person to online instruction and from on-campus to at-home residence). We continued recruitment for several months (through October, 2020), but ultimately decided that it would be injudicious to continue as there was no sign of university life returning to normal.
Measuring social capital
Our main dependent variable of interest is a social capital measure based on responses to 20 survey items, as shown in Appendix A.Footnote 9 Survey questions are randomized in order to avoid priming effects. We divide up the topic of social capital into four components: voting (two items), other modes of political participation (seven items), membership in voluntary associations (nine items), and trust (two items). Respondents who answer less than half of these items were dropped from the analysis (N = 4) and for those who answered most but not all items, missing responses were imputed (N = 302).Footnote 10
We create each of the four component indices by (a) standardizing each question and orienting so that higher values correspond to more social capital, (b) taking a simple average of all items within the component, and (c) standardizing the resulting component index (so that each component contributes similarly to the overall index). To construct an index of overall social capital we take a simple average of the four subcategory indices, then subtract off the sample mean and divide by the sample standard deviation to produce an easily interpretable measure of social capital that has a mean of 0 and a standard deviation of 1. This social capital index represents our main dependent variable.
Main hypothesis
Our principal hypothesis is that university education increases social capital. To make the comparison between treated and untreated groups as clear as possible, we exclude respondents who graduated high school in 2019 (following our PAP), some of whom have received little or no university education by the time they take the survey.Footnote 11 The remaining respondents are coded in a binary fashion: 0 = no university education, 1 = at least some university education, generating the treatment of theoretical interest.
The central analysis employs a fuzzy RD design, with some unique attributes given our application. First, because we knew the score variable values (bac scores) for all members of the population, even before conducting the survey, we focused our survey sampling on people either narrowly above or below the passage threshold, specifically those with scores between 5.8 and 6.2, as described above. This means that our sample has a little variation on our score variable, making RD analyses that rely on including several polynomial terms to flexibly estimate the relationship between the score variable and potential outcomes infeasible.Footnote 12 Another approach would be to employ the local randomization framework for RD but it was unclear ex ante whether we would have to discard most or all of the observations if the local randomization assumptions did not appear to be met. Given the difficulty of locating, contacting, and surveying these respondents, this was potentially problematic. Therefore, our preregistered analysis plan proposed to use a continuity-based framework suitable for analyzing data within a small distance of the score variable threshold while allowing for some adjustment for possible differences between respondents with different bac scores, even within our narrow bandwidth. It should be noted that in the appendix, we also present the results of the local randomization approach (along with several robustness checks) and these results are generally similar to those in our main analyses presented here.
To estimate the causal effect we use the rdrobust function from the rdrobust R package (Calonico, Cattaneo, and Titiunik 2015) with standard options for a fuzzy RD setup except as noted below. Because our score variable is not fully continuous but instead slightly lumpy, we follow Lee and Card (Reference Lee and Card2008) in clustering standard errors by exam score.Footnote 13 The treatment variable of theoretical interest is university attendance and the score variable is the overall average bac score. Because our survey sampling procedure selects only respondents with scores very close to the threshold, we do not use standard bandwidth selection approaches; instead, we include all data points in the analysis.
In order for the RD design to estimate the treatment effect of interest, there must be a jump in the probability of treatment (attending university) at the score variable threshold (here scoring at least 6 on the bac). To investigate this, the first panel of Figure 3 plots the proportion of respondents who attended university at each unique bac score. It is clear that respondents with scores of 6 or more are much more likely than those with scores below 6 to attend university. In fact, the proportions attending university above and below the cutoff are 0.86 and 0.21, respectively, a difference of 0.65. This represents a large jump in the probability of treatment at the threshold and in this respect, the data appear well suited for a fuzzy RD analysis.
Relationship of Bac Score with Treatment and Social Capital.
NOTES: Left panel shows proportion attending university among respondents having each unique value of bac score. Right panel shows average social capital levels among respondents having each unique value of bac score. Vertical line denotes (fuzzy) treatment threshold of 6. Horizontal lines on each panel show averages for all respondents above/below the threshold. The size of each point is proportional to the number of observations at that bac score value.

The right panel of Figure 3 displays a plot of average social capital values for respondents at each unique bac score in our bandwidth. This provides both an intuitive visual depiction of our research design as well as an informal way of estimating our treatment effect of interest. Corresponding to the jump in probability of treatment at bac scores of 6 or greater, we also observe a jump in respondents’ average social capital. This suggests a large causal effect. To establish this more conclusively, we need a formal statistical analysis. It should also be noted that, given that our RD setup involves imperfect treatment assignment (a “fuzzy” RD design), the plot probably understates the true effect, something that will be adjusted for in the results presented below.
Table 1 shows the estimated causal effect, using the R function rdrobust as described above. Note that our fuzzy RD setup produces estimates of the average effect of university attendance on social capital for compliers (those who would have attended university if they scored at least a 6 but who would not have attended if they had scored lower) at the threshold (i.e. those scoring 6.0 on the bac exam).Footnote 14 The point estimate of the effect is 0.86. Recall that our social capital index has a mean of 0 and a standard deviation of 1, meaning that the causal effect is close to one standard deviation – a very substantial effect. The 95% confidence interval ranges from 0.37 to 1.26, which, while somewhat wide, is limited to effects that are positive and quite large in magnitude. Furthermore, the p-value from null hypothesis test of zero effect is below 0.001, meaning we can strongly reject the null hypothesis of zero effect.
RD Estimate of the Main Effect

NOTES: Analysis using rdrobust function from rdrobust R package (version 0.99.9) clustering standard errors by bac score, using all of the data in our sampling bandwidth of 5.8–6.2, and otherwise using the function’s default arguments. Confidence interval and p-value are based on robust bias-corrected results. N = 1,210 (542 obs. below the threshold and 668 obs. above the threshold).
Robustness checks and RD design validation
Appendix C presents a variety of robustness tests and design validation tests.
First, we employ the local randomization framework (Cattaneo, Titiunik, and Vasquez-Bare Reference Cattaneo, Titiunik and Vazquez-Bare2016) for estimation and inference. As described above, these analyses require the assumption that in a small neighborhood around the treatment threshold, we can consider the RD analysis as if it were a randomized experiment. This means that respondents within some bandwidth around the treatment threshold on the score variable are “as-if randomized” on either side of the passage threshold. (This contrasts with the assumptions of our main, continuity-based analysis, where the central assumption is that the relationship between the score variable and the expectation of each potential outcome is smooth within the bandwidth.)
Appendix Table C3 shows the results of this local randomization analysis, which also produces highly significant estimates suggesting that university attendance has a substantively large positive effect on social capital (point estimates of 0.43 and 0.49, both with p < 0.001 when using either our entire data or an automated bandwidth selection procedure as described in the appendix). Although these estimates are smaller in magnitude than the main continuity-based results presented in Table 1, this should give us added confidence in our finding that university education increases social capital.
Results are also robust with a local randomization analysis using only respondents with the two closest score values to the passage threshold (5.98 and 6), where we see a relatively large magnitude. This might be viewed as a strong robustness check since if the local randomization assumptions hold at all for our design they must hold at this narrowest possible bandwidth.
Appendix C also presents the results of several other robustness checks including estimating the effect of treatment based on varying bandwidths and the so-called “donut hole” approach (e.g. Bajari et al. Reference Bajari, Hong, Park and Town2011), which excludes observations very close to the cutoff, assessing how estimates change when varying the exclusion threshold. For both the varying bandwidths and donut hole analyses, the estimated treatment effect shows little meaningful variation, suggesting that the estimated effects are fairly robust to these changes. Estimated effects are positive, statistically significant, and of roughly similar magnitude across all bandwidths analyzed. Furthermore, excluding observations near the cutoffs in the donut hole analyses produces positive effect estimates in all cases considered, albeit with insignificant results for larger donut hole radiuses that discard much of the data.
A key validation test for RD analyses is whether observations immediately below and above the cutoff on the score variable are the same on average on relevant pretreatment characteristics. While we cannot directly verify that this is the case for all possibly relevant variables, we can assess two widely acknowledged potential confounders: father’s education and childhood family socioeconomic status (SES). We view the education measure as most important given that it is more clearly pretreatment and also likely to be more closely tied to students’ decisions related to their own education.Footnote 15
Formally, we will conduct an RD falsification test substituting each of these pretreatment variables as the dependent variable, using the same assumptions and modeling choices as in our central analyses above. If the assumptions of our design hold, we should see similar levels of parental education for those narrowly passing and narrowly failing the bac. Similarly, we should also see similar SES for these two groups. The results of these analyses (Appendix Figures C3 and C4, Tables C1 and C2) show highly insignificant point estimates near zero (−0.05 and 0.01, with p-values of 0.72 and 0.96) for the estimated effect of university attendance on the two pretreatment covariates of interest.
While it is not generally possible to prove that the assumptions underlying a natural experiment are true, the results discussed in this section broadly support the validity of our RD design.
Subsidiary hypotheses
In addition to the main hypothesis, our pre-analysis plan included two subsidiary hypotheses. One concerns monotonicity and the other focuses on treatment heterogeneity. Both these analyses require subsetting the data – in the first case by time and in the second case by SES status. Doing so strains the capacity of our moderately sized sample, meaning that these analyses are likely to be underpowered. Any conclusions one might draw should be qualified accordingly.
Monotonicity
Our first subsidiary hypothesis concerns monotonicity in the relationship: the effect of university attendance should be stronger (or at least not weaker) for those who have attended university longer.
To test this, we separate our data based on the year respondents took the bac, creating five different samples. We assume that virtually all students take the bac in the summer after graduating from high school, so these year-based samples correspond to years of potential exposure to the treatment (university education): 2019 (0–1 years), 2018 (1–2 years), 2017 (2–3 years), 2016 (3–4 years), and 2015 (3–4 years).Footnote 16 Variations in the bracket refer to the window across which our survey is administered, which begins in October, 2019, and finishes in October, 2020.
To test for monotonicity, we replicate the fuzzy RD analysis described above for the full sample (see Table 1), and this time separately for each of these graduation years. Our hypothesis is that the effect will be larger among those who took the bac farther in the past, and therefore have attended university for a longer period of time.
Results shown in Figure 4 are ambiguous and difficult to interpret. It would appear that once the data are broken into subsamples, there is inadequate power to estimate each subgroup effect precisely enough to learn which are larger and which are smaller. Accordingly, we must report inconclusive findings.
Effect of University Attendance on Social Capital by Year of HS Graduation.
NOTES: Points show estimated treatment effect (with vertical bars showing robust 95% confidence intervals) using only respondents who graduated in the specified year, analyzed in the same way as the main results in Table 1.

Initially, we planned to conduct an even more fine-grained analysis. Specifically, we intended to compare treatment effects for those graduating high school seniors who were surveyed in the period after the bac and before the start of the university semester with those surveyed after the start of the university semester. In this fashion, we could have observed whether passing the bac has any impact on social capital prior to matriculation. In the event, it took us longer than expected to finalize the recruitment protocol, which meant that we were unable to gather a sufficient number of respondents prior to the start of the academic year to conduct this quasi-placebo test.
Heterogeneity
The second subsidiary hypothesis concerns possible heterogeneity in the relationship: low SES students may experience greater gains in social capital than high SES students.
Caution is required in dealing with current evaluations of social class, which may be posttreatment. To minimize potential bias, we rely on two questions pertaining to the status of the respondent’s family:
-
1. What is the highest educational level that your father attained?
-
2. Would you describe your family – when you were growing up – as belonging to the upper class, upper middle class,…?
To test the possible interaction of social class with university education, we replicate the benchmark RD analysis with data subset on responses to these two questions, i.e. reported childhood SES and father’s education level. (As specified in our preregistration, we collapse father’s education, which has 11 response categories in the survey, into 4 categories, in a fashion that generates the most evenly balanced subsets, with roughly one-quarter of respondents in each category.) Figure 5 plots the estimated effects and confidence intervals from these analyses.
Treatment Effects by Childhood SES and Father’s Education.
NOTES: Points show estimated treatment effect (with vertical bars showing robust 95% confidence intervals) using only respondents in the specified category of each covariate, analyzed in the same way as the main results in Table 1.
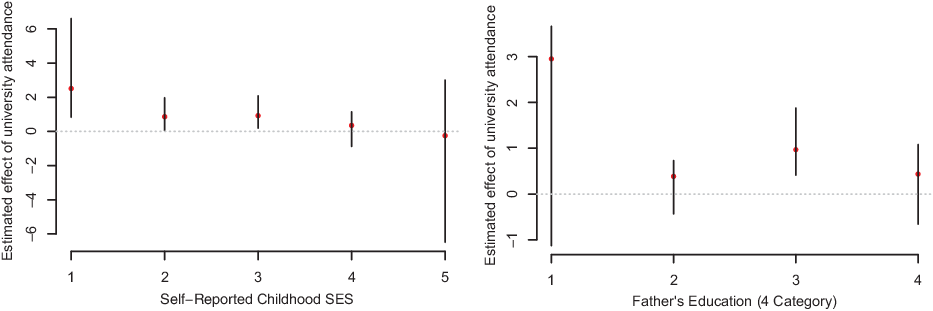
The left panel of Figure 5 plots results by the father’s education level. Here, we find some evidence consistent with a stronger effect for lower SES respondents. This would seem plausible given that these are the type of people who might be exposed to the most novel environment at university as compared to their experiences growing up and through high school. The largest estimated effect is among the lowest SES group, although this effect is estimated with quite a bit of uncertainty.
In the right panel of Figure 5, we examine treatment effects by father’s education level. Here, we see a similar pattern but with much more uncertainty. The largest estimated effect is for respondents with the least educated fathers. However, this estimate is very imprecise, with a confidence interval that overlaps zero. Furthermore, the pattern of estimates for other education categories is inconsistent and also estimated imprecisely.
Overall, the results in this section provide some corroborating evidence for our hypothesis: social capital effects from university attendance appear to be largest for people who grew up in less advantaged environments. However, high uncertainty – no doubt partly a product of small sample sizes – means that this finding should be regarded as suggestive rather than conclusive.
Exploratory analysis
Our principal analysis, presented in Section III, shows fairly dramatic treatment effects with respect to a composite index of social capital. In this section, we explore the components of that index: voting, trust, membership in organizations, and other political participation. We did not have a prior hypothesis about this research question, so the following analyses should be viewed as inductive.
We begin by examining the association of these four components with each other, as shown in Table 2. Surprisingly, they are not highly correlated, suggesting that voting, trust, membership in organizations, and other political participation constitute separate dimensions of social capital.
Correlations Among Social Capital Components

NOTES: Entries show sample correlations (Pearson’s r) between social capital components.
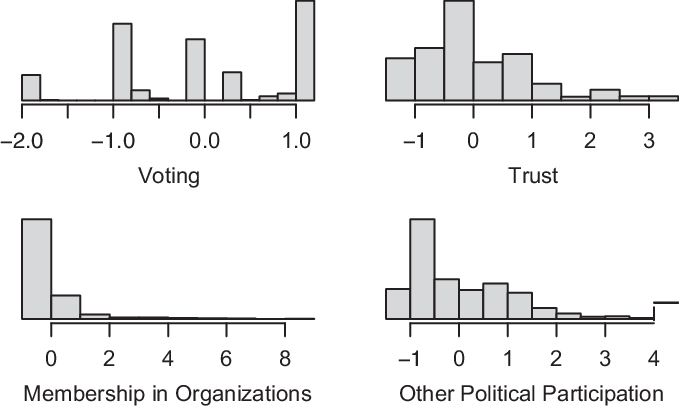
The low correlations may also be a product of limited variability on some of these outcomes. A histogram of the four components, shown in Figure 6, reveals that membership is highly skewed. Most respondents have few memberships to report, perhaps because they are young. In fact, over 70% of respondents claimed they had no membership (active or inactive) with any of the nine types of groups asked about, and only 6% of respondents claimed any sort of membership with more than two of them. Other components, such as trust and (nonvoting) political participation show more variability among our sample respondents.
Distribution of Social Capital Components.
NOTES: Histograms show distributions for each of the four components that make up the overall social capital index used in the main analyses above. Each component is standardized to have a mean of 0 and standard deviation of 1 for interpretation.
To investigate the relationship between university attendance and each social capital component, Table 3 shows the results of four separate RD analyses, each using the same approach as our main RD analysis (Table 1).
RD Estimates of Effect of University Attendance on Social Capital Components

NOTES: Analysis using rdrobust function from rdrobust R package (version 0.99.9) clustering standard errors by bac score, using all of the data in our sampling bandwidth of 5.8–6.2, and otherwise using the function’s default arguments. Confidence interval and p-value are based on robust bias-corrected results. N = 1,210 (542 obs. below the threshold and 668 obs. above the threshold).
Recall that each of the four components is standardized with a mean of 0 and standard deviation of 1, making interpretation more straightforward. The estimated effect of university attendance on the voting component (a composite of two vote-related items) is equal to roughly half of a sample standard deviation, with the robust 95% confidence interval ranging from 0.09 to 1.08. This suggests that university attendance strongly impacts voting.
Bear in mind that the voting component combines responses to two questions – whether the respondent voted in the 2019 European Union election (0/1), and whether the respondent never, sometimes, or always votes. The first question is more specific, and also mirrors standard survey questions about turnout, and these respects might be considered more informative. Accordingly, we estimate a treatment effect of university attendance on reported turnout in the EU election using the benchmark analysis. We find a treatment effect of 0.19 with a robust 95% confidence interval of (−.01, .43). This result, while not quite reaching conventional significance levels (p = .055) provides reasonably strong evidence of a positive effect, and the point estimate is substantively large in magnitude. By way of comparison, a recent meta-analysis of get-out-the-vote experiments finds an average treatment effect of 0.043 (Green and Gerber Reference Green and Gerber2015: 188) – though it should be noted that the latter studies are generally based on verified votes rather than self-reported voting, an issue we return to in the concluding discussion.
The trust component has a highly significant and substantively large positive effect equal to roughly one sample standard deviation. We can also consider the estimated effect of university attendance on each of the two questions that make up the trust component index. Each of these items uses a 5-point ordinal response scale ranging from “Fully disagree” (=1) to “Fully Agree” (=5). The first item taps general interpersonal trust, asking about the statement “Most people can be trusted,” while the second asks about the statement “Political leaders can be trusted.” To further explore the effect estimated on trust, we conduct two additional RD analyses, both following the setup of our main analysis but using one of the individual trust items as the dependent variable. The estimated effect of university attendance on both of these items is statistically significant and substantively quite large, nearing 1 point on the 5-point response scale. Specifically, the effect on general interpersonal trust is estimated to be 0.93 with a robust 95% confidence interval of (0.98, 1.80), while the effect on trust for political leaders is estimated to be 0.85 with a robust 95% confidence interval of (0.41, 0.96). These results provide another, perhaps more apprehensible, way of understanding the magnitude of the estimated effect of university attendance on our trust index.
By contrast, the two other components – membership in organizations and other political participation – do not register significant effects in our benchmark analysis. In the case of membership in organizations, this is unsurprising once we consider the distribution of the measure, as discussed. It is possible that university attendance affects the trajectory of membership over the life cycle, in which case differences are likely to emerge later in life between university attenders and nonattenders. Our research design, which focuses only on young adults, cannot detect this.
The estimated effect of university attendance on the component for other political participation is also very close to zero. It is not clear whether this might change over the life-cycle. Thus, we do not have evidence that university attendance affects political activity other than voting.
Discussion
Does university attendance boost social capital? In this study, we implemented a RD design to address a question usually addressed with observational data. We found strong corroboration for the conventional thesis: Romanian students who scored just above the threshold on a national baccalaureate exam – and therefore were more likely to attend university – registered higher scores on a composite index of social capital. The size of the estimated effect, and the strength of the research design, suggest that this is a product of attending university and not of background factors that might serve as confounders (Section III).
Subsidiary hypotheses yielded more ambiguous results, primarily because these analyses require subsetting the sample and thus reduced power. We can neither confirm nor disconfirm the hypothesis of monotonicity. We find some evidence of causal heterogeneity, with low-SES respondents registering greater gains in social capital; however, a great deal of uncertainty is associated with these estimates (Section IV).
In exploratory analyses focused on the four components of our social capital index, we find that the strongest effects are registered for voting and trust, while organization membership and “other political participation” show little evidence of causal effect. In the case of organization membership, this may be due to the limited variability in responses, as noted (Section V). We cannot discount the possibility of stochastic factors since these outcomes were not part of our original design.
Our main interest, in any case, is in the main effect. In this final section, we discuss issues of interpretation and generalizability.
Interpretation
The outcomes of interest in this study are self-reported, raising the possibility of error and bias. In particular, one may wonder whether the impact of a university education on answers to our survey questions reflects social acceptability bias rather than actual differences of behavior. For most of our outcomes, this does not appear to be a danger. There are no well-established norms in Romania that might dictate appropriate responses to questions about whether politicians, or people in general, can be trusted; whether respondents are members of particular groups; or whether they engage in other forms of political action. Perhaps one or two of these activities might be viewed as commendatory, or questionable, by some people; but most would likely be viewed as broadly acceptable, a matter of individual choice.
With respect to voting, however, there is a clear norm in favor of participation and many might view it as a strong social obligation. Here, the problem of social acceptability bias is more serious and that respondent might exaggerate their own rates of political participation. This poses a problem for our analysis only if the bias is uneven across treatment and control groups. Specifically, one must worry that university education enhances the norm without enhancing the practice. However, this seems rather unlikely. If college-educated persons in Romania are more susceptible to norms about voting it seems likely that those norms will also influence their behavior. After all, voting brings few (if any) material rewards and is therefore a largely norm-governed act. But it is possible that some people will be influenced enough by norms to answer a survey question about voting differently but not influenced enough to actually vote. We cannot entirely discount this possibility.
Generalizability
Having considered the internal validity of our study from numerous angles, we turn to the problem of external validity. What might our findings say about the impact of higher education on social capital outside Romania?
Out-of-population validity (“transportability”) is always speculative; but in this instance, we can gather clues from observational data. Plausibly, the impact of higher education is different in countries with varying levels of educational attainment. To compare Romania along this dimension, we focus on the percent of 15–24-year olds who have completed at least partial tertiary education, as this approximates the sample explored in our RDD. Data collected by Barro and Lee (Reference Barro and Lee2013) includes 146 countries observed in 2010 (the most recent year). Across this global sample, Romania ranks 80th, just slightly below the global mean (see Appendix F).
Next, we employ the World Values Survey (WVS) to conduct a naïve regression analysis of the impact of university education on social capital. As it happens, many of the questions on our survey are drawn directly from the WVS, offering a basis for comparison. To obtain a composite measure of social capital we combine questions on (a) voting, (b) trust, (c) membership in organizations, and (d) other modes of political participation. The resulting index mimics the measure of social capital in our main analysis, with two exceptions. First, the WVS data only includes one question on voting (Do you usually vote?), while our survey also includes a question on voting in the most recent elections. Second, the WVS includes only one question on trust (Most people can be trusted?), while our survey also includes a question on trust in politicians. This WVS social capital index is standardized for the entire (cross-country) sample to aid interpretation of the results. We then regress this measure on a binary indicator of university education (indicating the successful completion of a university degree) for each country in WVS that offers sufficient data on the chosen covariates. The resulting sample of 50 countries, although not random, includes the most sizeable countries in the world and thus represents most of the world’s population.
Results of these regression tests – one per country – are shown in Figure 7. It will be seen that in all but a few countries university education is strongly associated with higher social capital. Of course, we cannot compare these causal effects directly with our RD estimate because the populations are dissimilar. The RD analysis is restricted to young adults whose test scores fall near the threshold while the WVS analysis includes adults of all ages and intellectual abilities.
Social Capital Regressed on University Education for 50 Countries.

However, we can compare the placement of Romania within the cross-country sample. According to this naïve regression analysis university education appears to have an effect on social capital in Romania that is very close to the sample average, which we intuit is probably fairly close to the global average (if data for all countries in the world were included). Moreover, when this bivariate analysis is replicated with a fuller set of background controls – including age, gender, SES – results are very similar, as shown in Appendix D.
Entries are estimates from country samples drawn from the WVS in which a composite measure of social capital is regressed against a dummy variable measuring completion of university. Bars denote 95% confidence intervals.
This suggests that if our RDD were replicated in a random sample of countries, results would center on those reported in this study. Of course, to draw this conclusion from the naïve regression analysis shown in Figure 7, we must also assume that confounders hiding behind the effects registered in Figure 7 are similar across countries – a questionable assumption. Nonetheless, we have more faith in the generalizability of a study situated in Romania than in a study located in one of the countries at the top or bottom of Figure 7, whose effect sizes are extraordinarily high, or low.
Available data suggests that Romania lies near the middle of the distribution with respect to educational attainment and the possible causal effect of university education on social capital. By these measures, it is a “typical” country. To be sure, the only way to test generalizability is to replicate our analysis across different settings. In practical terms, this means identifying countries where access to higher education is allocated by a nationwide test with a specified cutoff, where test takers cannot precisely sort themselves on either side of the threshold, where the identity of test takers falling on either side of the threshold is known, and where there is a mechanism for contacting those individuals (and thereby inviting them to a survey). We suspect that there are such opportunities, though these may require formal partnership with an education ministry (in cases where the identity of test takers is confidential).
Opportunities for social experiments also arise in cases where fellowship opportunities can be randomized across applicants. However, several difficulties may arise. If fellowship winners are exceptionally gifted, they are likely to find their way into a university with or without the fellowship; as such, the fellowship is a weak instrument hampered by a good deal of noncompliance. Winning a fellowship also introduces compound-treatment problems. Winners may regard themselves differently, which may, in turn, change attitudes and behavior – separate and apart from their attendance at university. Likewise, the terms of the fellowship, especially if it is generous, may set winners apart from non-winners in ways that have nothing to do with university life. In these respects, fellowship experiments may be difficult to interpret.
By contrast, the natural experiment posed by exam scores, if rigidly adhered to, offers a real-life setting that is easy to interpret and also of great policy relevance. As we noted, attempts by a government to expand or contract tertiary education are likely to focus on marginal students who barely passed, or barely failed, qualification requirements. It is the impact of university education on these students that policymakers ought to be most concerned about, for this is the pool their education reforms are most likely to affect.
Supplementary Material
To view supplementary material for this article, please visit https://doi.org/10.1017/XPS.2021.6.


