

The most up-to-date dietary reference intakes for vitamin D are from the US Institute of Medicine (IOM), which set an Estimated Average Requirement (EAR) for vitamin D of 10 μg/d (400 IU/d) for all ages above 1 year( 1 ). However, intakes in children and teenagers in European countries and internationally (summarised in Table 1) are frequently well below this recommendation( Reference Kiely and Black 2 ). Mean daily vitamin D intakes in 4–18-year-olds participating in Years 1 and 2 of the National Diet and Nutrition Survey (NDNS) rolling programme in the UK ranged from 1·9 to 2·4 μg from food sources and from 2·2 to 2·7 μg when supplements were included( 3 ). In European countries participating in the European Nutrition and Health Report (ENHR), mean daily intakes in children aged 4–14 years ranged from 1·2 to 6·5 μg( Reference Elmadfa, Meyer and Nowak 4 ). Intakes were highest in the north region, including Sweden, Norway, Finland and Denmark, which may be explained by a traditionally high consumption of oily fish and fish liver( Reference Welch, Lund and Amiano 5 ) and the widespread fortification of milk and margarine in Finland and Sweden. In the USA, where milk and cereals are commonly fortified with vitamin D, mean daily vitamin D intakes were reported as 8·3 μg from all sources and 6·1 μg from food sources in 2–18-year-olds participating in the National Health and Nutrition Examination Survey (NHANES) 2003–2006( Reference Fulgoni, Keast and Bailey 6 ). In Canada, where vitamin D-fortification of margarine and milk is mandatory, mean daily vitamin D intakes were reported from the Canadian Community Health Survey (CCHS) Cycle 2·2 as 7·3 and 5·4 μg in 9–18-year-old boys and girls, respectively( Reference Vatanparast, Calvo and Green 7 ).
Vitamin D intakes (μg/d) in children and teenagers from selected national nutrition surveys

IQR, interquartile range; NHANES, National Health and Nutrition Examination Survey; CCHS, Canadian Community Health Survey; NDNS, National Diet and Nutrition Survey; DNFCS, Dutch National Food Consumption Survey; ENHR, European Nutrition and Health Report 2009; Children's Survey, Australian National Children's Nutrition and Physical Activity Survey; NR, not reported.
*All = intake from food and supplements; Food = intake from food only; Base diet = intake from unfortified foods only; Mixed = may include intake from both food and supplements.
†Includes data from the UK and the Netherlands.
‡Range.
The serum 25-hydroxyvitamin D (25(OH)D) concentration considered by the IOM as adequate for bone health in >97 % of individuals is 50 nmol/l, while the risk of rickets increases below 30 nmol/l( 1 ). Looker et al. ( Reference Looker, Johnson and Lacher 8 ) reported that 29 and 34 % of boys and girls aged 14–18 years from the NHANES 2001–2006 had 25(OH)D concentrations <50 nmol/l. In four European countries (Denmark, Finland, Ireland and Poland), 92 % of girls aged 11–13 years were <50 nmol/l at the end of winter( Reference Andersen, Molgaard and Skovgaard 9 ). In the Irish subgroup of that sample, the prevalence of serum 25(OH)D <50 nmol/l was 9 % in summer and 85 % in winter, while 30 % were between 12·5 and 25 nmol/l. Reports of concomitant low dietary vitamin D intakes and inadequate 25(OH)D concentrations in children and teenagers are concerning, since childhood and adolescence are times of accelerated skeletal growth and adequate vitamin D status is required to optimise calcium absorption. Therefore, the identification and prioritisation of feasible public health measures to increase vitamin D intakes, and reduce the prevalence of vitamin D inadequacy, are urgently required.
Previously, vitamin D intakes in Irish children aged 5–10 years were reported alongside data from various European countries( Reference Flynn, Hirvonen and Mensink 10 ); however, vitamin D intakes from fortified foods were not presented. The current study reports vitamin D intakes in nationally representative samples of Irish children and teenagers aged 5–17 years. We updated the food composition data for vitamin D for the current analysis from published international analytical values, and paid particular attention to the contribution of nutritional supplements and fortified foods.
Methods
The Irish Children's and Teens’ Food Consumption Surveys were carried out in 2004 and 2006, respectively. These were cross-sectional dietary intake surveys carried out in children aged 5–12 years (n 594) and teenagers aged 13–17 years (n 441) from twenty-eight primary schools and thirty-two secondary schools throughout the Republic of Ireland. The surveys were designed to provide quantitative habitual food and beverage consumption data in representative samples of children and teenagers in Ireland and were conducted by the nutrition surveillance centres at University College Cork and University College Dublin. Ethical approval was obtained separately for each survey from the Clinical Research Ethics Committee of the Cork University Teaching Hospitals.
Sampling and recruitment methodology
Schools were selected from a database of primary schools obtained from the Department of Education and Science (n 1194 and n 722 for primary schools and secondary schools, respectively). All schools in the database were classified according to size, sex, disadvantaged/not disadvantaged and location, and a number of schools were randomly selected from each category (e.g. medium, mixed, not disadvantaged, urban). Over 90 % of schools selected for the Children's Survey, and over 95 % of schools selected for the Teens’ Survey, agreed to participate. Students were randomly selected from each school and were excluded if they were not aged between 5 and 17 years, if they belonged to an age/sex/location/sociodemographic category for which the appropriate number of children had already been recruited, or if another member of their household had already been recruited for participation in the survey. The overall response rate was 66 % in children and 63 % in teenagers. In the final sample, the percentage of surveyed children and teenagers reflected the percentage attending each of the categories of schools according to the database of primary and secondary schools obtained from the Department of Education and Science. Compared with census data( 11 ), the sample was representative of Irish children and teenagers with respect to age, sex, social class, socio-economic group and geographical location.
Food consumption data
Food and beverage intake data were collected throughout 2004 in the Children's Survey using a 7 d weighed food diary and throughout 2007 in the Teens’ Survey using a 7 d semi-weighed food diary. The participants (and/or their parent/guardian in the case of the Children's Survey) were asked to record detailed information regarding the amount and types of all foods, beverages and supplements consumed over the 7 d period and, where applicable, the cooking method used, the brand name of the food consumed, packaging size and type, and details of recipes and any leftovers. The methodology used to collect food intake data was based on the protocols established during the North/South Ireland Food Consumption Survey, described in detail by Harrington et al. ( Reference Harrington, Robson and Kiely 12 ).
Vitamin D composition data
Food consumption data were converted to nutrient intakes on a food-by-food basis from food diaries, using customised nutritional analysis software (Weighed Intake Software Package (WISP©)). WISP© incorporated food composition data from McCance & Widdowson's The Composition of Foods Sixth Summary Edition ( 13 ) and supplement editions( Reference Chan, Brown and Buss 14 – Reference Holland, Welch and Buss 22 ), and the Irish food composition database, which includes data for Irish brands, fortified foods, nutritional supplements and composite dishes( Reference Black, Ireland and Moller 23 ).
For some important sources of vitamin D (e.g. white fish, smoked salmon, milk, ham, mushrooms), vitamin D composition values were unreported in The Composition of Foods. For these foods, alternative analytic composition values were sought in order to ensure a more accurate estimation of vitamin D intakes in the population. The US Department of Agriculture's National Nutrient Database for Standard Reference SR23 (September 2010) was used to update food codes for white fish, smoked salmon, processed meat (including ham) and mushrooms. Since milk is mostly fortified in the USA, data from the Danish Food Composition Databank version 7·01 (2009) were used to update values for milk: the fat content of milk in Denmark is equivalent to those in Ireland according to Council Regulation (EC) No. 1234/2007 and Danish milk has been recently analysed for vitamin D. The updated values for fish, mushrooms and milk were used to recalculate commonly consumed composite dishes that were based on these foods.
For nutritional supplements and brand-level manufactured products, including fortified fat spreads and ready-to-eat-breakfast cereals (RTEBC), the vitamin D values were updated based on current market data. Values for generic and unfortified fat spreads were updated based on analytic values previously reported by this group( Reference Hill, Flynn and Kiely 24 ), since the dairy content and fortification levels of fat spreads vary widely between countries. The vitamin D contents of 124 food codes in the Children's Survey and 113 food codes in the Teens’ Survey were updated, representing 14 % of all vitamin D-containing food codes.
Identification of vitamin D-fortified foods
Vitamin D-fortified foods were identified by checking every manufactured food product that could have been potentially fortified for the addition of vitamin D. Foods which contained added vitamin D, including fat spreads and milks, were considered to be fortified, with the exception of cooking margarine, which was not considered a fortified food, as vitamin D is added to margarine on a mandatory basis in the UK and Ireland for the purposes of nutrient restoration. To assess the impact of fortified foods on vitamin D intakes, the level of vitamin D that would naturally be present in the fortified food was determined based on the composition data for an unfortified equivalent of the food.
Data analysis
Data analysis was conducted using the statistical software package SPSS® for Windows™ version 18·0. A participant who consumed a vitamin D-containing supplement at any time over the recording period was considered a user of vitamin D-containing supplements and a participant who consumed a vitamin D-fortified food at any time during the recording period was considered a consumer of vitamin D-fortified foods. The percentage use of total vitamin D-containing supplements and vitamin D-fortified foods was compared between sexes using Pearson's χ 2 test.
The vitamin D intake from each food and supplement reported as consumed was quantified by multiplying the weight of the food (g) by the vitamin D content (μg/100 g). The mean daily intake of vitamin D for each person was calculated by averaging his/her intake over the 7 d. The distribution of vitamin D intakes was estimated by sex and age groups (5–8, 9–12 and 13–17 years) for the total population, for users of vitamin D-containing supplements, for non-users of vitamin D supplements who consumed vitamin D-fortified foods and for non-users of vitamin D supplements who did not consume vitamin D-fortified foods. Since the recording period was for 7 d, intakes were assumed to reflect the usual intake sufficiently well( Reference Willett 25 ). Differences in vitamin D intakes between sexes were compared using the Mann–Whitney U test. A significance level of P < 0·05 was used throughout.
The EAR for vitamin D, defined by the IOM as 10 μg/d for all ages above 1 year( 1 ), was used as a cut-off point to estimate the prevalence of inadequate vitamin D intakes. This method is considered effective in assessing the prevalence of nutrient inadequacy in a group( Reference Carriquiry 26 ). The risk of excessive intake of vitamin D was evaluated at the 95th percentile using the Tolerable Upper Intake Level (UL) of vitamin D, which is reported by the IOM committee as 75 μg/d for ages 4–8 years and 100 μg/d for ages ≥9 years( 1 ).
Food group contributions to vitamin D intake were calculated using the population proportion method as defined by Krebs-Smith et al. ( Reference Krebs-Smith, Kott and Guenther 27 ). This method yields information about the sources contributing to the nutrient intake in the population as a whole and determines the impact of a food group relative to that of other food groups. The population proportion is the method of choice when determining important food sources of a nutrient in a population. The percentage contribution of specific food groups to the total vitamin D intake at population level was estimated by summing the amount of vitamin D from a particular food group for all participants and dividing this value by the sum of the vitamin D from all foods for all participants( Reference Krebs-Smith, Kott and Guenther 27 ). Food group contributions were calculated for the total population, for users of vitamin D-containing supplements, for non-users of vitamin D supplements who consumed vitamin D-fortified foods and for non-users of vitamin D supplements who did not consume vitamin D-fortified foods.
Results
Use of vitamin D-containing supplements and consumption of vitamin D-fortified foods
A total of 21 % of 5–8-year-olds, 16 % of 9–12-year-olds and 15 % of 13–17-year-olds consumed a vitamin D-containing supplement at least once during the recording days and there was no significant difference in the prevalence of total vitamin D-containing supplement use between boys and girls (Table 2). There was no significant difference in the prevalence of total vitamin D-containing supplement use between boys and girls. Multinutrient preparations were the main type of supplements consumed (11–19 %). Consumption of cod-liver oil preparations was low (2–5 %) and calcium + vitamin D preparations were consumed by only one participant in the Children's Survey. Boys aged 5–8 years were twice as likely (20 %) to consume a multinutrient preparation than 13–17-year-old boys (9 %).
Prevalence (%) of vitamin D-containing supplement use and vitamin D-fortified food consumption in Irish children and teenagers, stratified by age group
RTEBC, ready-to-eat-breakfast cereals.
No significant difference (P ≥ 0·05) between boys and girls in the prevalence of total supplement use and in the prevalence of total fortified food consumption.
*Biscuits (n 4), yoghurt (n 4), cheese (n 1), milk alternative (n 1), cereal bar (n 1), milk drink (n 1), juice (n 1), soup powder (n 1).
A total of fifty-two vitamin D-fortified foods were recorded during the Children's Survey (3 % of all foods, excluding supplements), of which 37 % were RTEBC, 33 % were fat spreads and 4 % were milks. During the Teens’ Survey, forty-one vitamin D-fortified foods were recorded (2 % of all foods, excluding supplements), of which 44 % were RTEBC, 37 % were fat spreads and 2 % were milks. A total of 71 % of 5–8-year-olds, 70 % of 9–12-year-olds and 63 % of 13–17-year-olds consumed a vitamin D-fortified food at least once during the recording days, mainly RTEBC and fat spreads (Table 2). Vitamin D-fortified milk was consumed by <5 % of participants. There was no significant difference in the prevalence of total vitamin D-fortified food consumption between boys and girls.
Vitamin D intakes
Median daily vitamin D intakes from all sources were 1·9, 2·1 and 2·4 μg in ages 5–8, 9–12 and 13–17 years, respectively (Supplementary Materials, Supplementary Table 1). Teenage boys had the highest intakes (2·7 μg/d), which were significantly higher than in teenage girls (1·9 μg/d; Fig. 1). From food sources only, median daily vitamin D intakes were 1·6, 1·9 and 2·2 μg in ages 5–8, 9–12 and 13–17 years, respectively. When the contribution from the added vitamin D component of fortified foods was excluded, median daily vitamin D intakes were 1·1, 1·3 and 1·5 μg in ages 5–8, 9–12 and 13–17 years, respectively. Intakes in teenage boys were significantly higher than in teenage girls from all sources and from food sources, with and without the added vitamin D component of fortified foods (Supplementary Materials, Supplementary Table 1).
Median daily intakes of vitamin D (μg/d) in Irish boys and girls, stratified by age group, use of vitamin D-containing supplements and consumption of vitamin D-fortified foods. (a) Boys (total population, n 517; users of vitamin D-containing supplements, n 92; users of vitamin D-containing supplements, vitamin D-fortified food consumers, n 280; non-users of vitamin D-containing supplements, non-consumers of vitamin D-fortified foods, n 145). (b) Girls (total population, n 518; users of vitamin D-containing supplements, n 82; non-users of vitamin D-containing supplements, vitamin D-fortified food consumers, n 289; non-users of vitamin D-containing supplements, non-consumers of vitamin D-fortified foods, n 147). *Median values were significantly different from those of girls in the same age group: P < 0·05
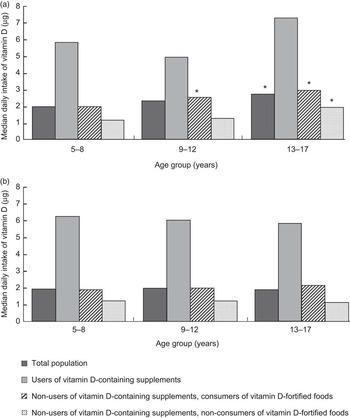
In users of vitamin D-containing supplements, median daily vitamin D intakes were 6·1, 6·0 and 6·7 μg in ages 5–8, 9–12 and 13–17 years, respectively, with no significant differences between boys and girls (Supplementary Materials, Supplementary Table 2). From food sources only, median daily vitamin D intakes ranged from 1·6 μg in 5–8-year-olds to 2·5 μg in 13–17-year-olds. When the contribution from the added vitamin D component of fortified foods was excluded, median daily vitamin D intakes ranged from 1·1 μg in 5–8-year-olds to 1·7 μg in 13–17-year-olds. In non-users of vitamin D-containing supplements who consumed vitamin D-fortified foods, median daily vitamin D intakes were 1·9, 2·2 and 2·5 μg in ages 5–8, 9–12 and 13–17 years, respectively (Supplementary Materials, Supplementary Table 3). In non-users of vitamin D-containing supplements who did not consume vitamin D-fortified foods, median daily vitamin D intakes were 1·2, 1·2 and 1·4 μg in ages 5–8, 9–12 and 13–17 years, respectively.
Adequacy of intakes
In the total population, 97–99 % of boys and 98–99 % of girls had inadequate intakes, defined as a mean daily intake below the EAR of 10 μg/d. In users of vitamin D-containing supplements, 88–96 % of boys and 88–90 % of girls had inadequate intakes. In non-users of vitamin D-containing supplements who did not consume vitamin D-fortified foods, 100 % of boys and girls had inadequate intakes. At the 95th percentile, vitamin D intakes were well below the UL of 75 μg/d for ages 4–8 years and 100 μg/d for ages ≥9 years – the highest mean daily vitamin D intake of any participant was <16 μg.
Dietary sources of vitamin D
The main food groups contributing to total vitamin D intake in 5–12-year-olds were supplements (26 %), meat and meat products (17 %), breakfast cereals (15 %) and milk and yoghurts (13 %; Fig. 2). From the supplements group, multinutrient preparations were by far the greatest contributor to total vitamin D intake, contributing 27 % to total vitamin D intake in 5–8-year-olds and 19 % to total vitamin D intake in 9–12-year-olds (Supplementary Materials, Supplementary Table 4). The contribution of 15 % from breakfast cereals was solely from RTEBC, while most of the contribution from the milk and yoghurts food group was from unfortified whole milk.
Users of vitamin D-containing supplements aged 5–12 and 13–17 years obtained 65 % and 56 %, respectively, of their vitamin D from supplements (Figs 2 and 3), particularly multinutrient preparations, which contributed 40–59 % of vitamin D intakes (Supplementary Materials, Supplementary Table 4). RTEBC contributed 21–28 % of vitamin D in children and teenagers who were non-users of vitamin D-containing supplements and consumed vitamin D-fortified foods (data not shown). It is important to note that the actual contributions of fish, meat and milk/yoghurt to vitamin D intakes were between 0·1 and 0·7 μg/d regardless of supplementation practices or use of fortified foods, reflecting the low vitamin D intakes from the base diet.
Mean percentage (and actual contribution, μg/d) of food groups to vitamin D intakes in Irish children aged 5–12 years, stratified by use of vitamin D-containing supplements and consumption of vitamin D-fortified foods. (a) Total population (mean daily intake (MDI) 2·8 μg; n 594). (b) Users of vitamin D-containing supplements (MDI 6·1 μg; n 108). (c) Non-users of vitamin D-containing supplements, vitamin D-fortified food consumers (MDI 2·4 μg; n 338). (d) Non-users of vitamin D-containing supplements, non-consumers of vitamin D-fortified foods (MDI 1·3 μg; n 148). *Grains, rice, pasta and savouries; breads/rolls; creams, ice creams and desserts; cheese; potatoes/potato products; vegetables/vegetable dishes; fruit/fruit dishes; beverages; confectionery/preserves; soups, sauces and miscellaneous; nuts/seeds

Mean percentage (and actual contribution, μg/d) of food groups to vitamin D intakes in Irish teenagers aged 13–17 years, stratified by use of vitamin D-containing supplements and consumption of vitamin D-fortified foods. (a) Total population (mean daily intake (MDI) 3·2 μg; n 441). (b) Users of vitamin D-containing supplements (MDI 6·8 μg; n 66). (c) Non-users of vitamin D-containing supplements, vitamin D-fortified food consumers (MDI 3·1 μg; n 231). (d) Non-users of vitamin D-containing supplements, non-consumers of vitamin D-fortified foods (MDI 1·7 μg; n 144). *Grains, rice, pasta and savouries; breads/rolls; creams, ice creams and desserts; cheese; potatoes/potato products; vegetables/vegetable dishes; fruit/fruit dishes; beverages; confectionery/preserves; soups, sauces and miscellaneous; nuts/seeds

Discussion
The median daily intakes of vitamin D from all sources ranged from 1·9 to 2·4 μg in children and teenagers aged 5–17 years, corresponding to a 98–99 % prevalence of inadequate intakes. Teenage boys had the highest vitamin D intakes reflecting a higher food intake overall: teenage boys consumed 9439 kJ (2256 kcal) daily compared with 7096 kJ (1696 kcal) in girls( 28 ). Vitamin D intakes in Irish children and teenagers were similar to those recently reported in the UK( 3 ) but were substantially lower than intakes reported in the USA and Canada. Bailey et al. ( Reference Bailey, Dodd and Goldman 29 ) reported mean daily intakes in US boys and girls aged 4–18 years ranging from 3·8 μg to 6·4 μg from food sources, and from 5·0 μg to 9·3 μg when supplements were included. These higher intakes can be attributed primarily to fortification and supplementation, since the mean daily vitamin D intake from the base diet was 1·7 μg in the same participants( Reference Fulgoni, Keast and Bailey 6 ), which is similar to intakes from the base diet in Ireland. The median daily intake of vitamin D was also substantially higher (5·6 μg) in Canadian children and teenagers compared with Irish children and teenagers, which may reflect the mandatory fortification of milk and margarine in Canada( Reference Vatanparast, Calvo and Green 7 ). Compared with intakes in the USA and Canada, current fortification practices in Ireland are insufficient to impact substantially on vitamin D intakes in Irish children and teenagers.
Prevalence of supplement use was based on year-round data, accounting for potential seasonality in supplement consumption, although this was not observed. Fewer than 20 % of Irish children and teenagers used a vitamin D-containing supplement during the 7 d recording period. There was a decrease in the use of multinutrient preparations as age increased, particularly in boys. A similar pattern was found in US children and teenagers by Bailey et al. ( Reference Bailey, Dodd and Goldman 29 ), who reported a decrease in the prevalence of vitamin D-containing supplement use between ages 4 and 18 years. Among those who used vitamin D-containing supplements, the median daily intake of vitamin D (6·0–6·7 μg) was substantially higher than in the total population. The differences in vitamin D intakes between users and non-users of vitamin D-containing supplements were attributable solely to the contribution from supplements and not to any differences in intakes from fortified foods or supplements, which were similar regardless of the use of vitamin D-containing supplements. However, the prevalence of inadequate intakes remained high among users of vitamin D-containing supplements at 88–94 %, depending on age group.
The majority of children and teenagers (>60 %) consumed vitamin D-fortified foods – primarily RTEBC and fat spreads – while vitamin D-fortified milk was not widely consumed (≤5 %). The vitamin D added by voluntary fortification contributed approximately 25 % to vitamin D intakes in the total population. In non-users of vitamin D-containing supplements, the consumption of vitamin D-fortified foods increased median intakes from approximately 1·3 μg/d to >2 μg/d. At the 5th percentile of intakes, consumers of vitamin D-fortified foods had approximately double the vitamin D intake of those who did not consume fortified foods. However, intakes were extremely low at this end of the distribution at <1 μg/d in non-consumers of vitamin D-fortified foods. The impact of fortified foods on reducing the prevalence of inadequate intakes was negligible: almost all non-users of vitamin D-containing supplements had inadequate intakes of vitamin D, regardless of fortified food use. This finding is consistent with other studies which report that, although fortification increases vitamin D intakes in children and teenagers, the increase is not sufficient to achieve recommended intakes( Reference Lehtonen-Veromaa, Mottonen and Leino 30 , Reference Piirainen, Laitinen and Isolauri 31 ).
Despite the low prevalence of vitamin D-containing supplement use, supplements were the major source of vitamin D in 5–8- and 9–12-year-olds, followed by meat. In teenagers aged 13–17 years, meat made the greatest contribution to total vitamin D intake, followed by supplements. Other important food group contributors were milk and yoghurts (primarily unfortified whole milk) and RTEBC. In the present study, the vitamin D composition values for fluid milks were updated based on analytic data from the Danish Food Composition Databank, allowing the contribution from unfortified milk to be estimated. Unfortified whole milk was an important contributor (18 %) to vitamin D intakes in children aged 5–12 years who neither used vitamin D-containing supplements nor consumed vitamin D-fortified foods. Fish was not a major contributor to vitamin D intakes (approximately 7 %) in Irish children and teenagers. The contribution of oily fish, the richest natural source of vitamin D, was a low 3–4 %, indicating that it was not widely consumed by Irish children and teenagers.
It is widely accepted that misreporting (particularly energy under-reporting) is a major problem in dietary intake surveys in children. However, we did not exclude under-reporters in the current study for several reasons. First, the Goldberg cut-off technique( Reference Goldberg, Black and Jebb 32 ), which was originally designed for screening the energy intake data of adults, cannot be applied directly to the energy intake of children and teenagers and may distort a data set by overestimating the extent of dietary misreporting in these age groups( Reference Livingstone, Robson and Wallace 33 ). Although age- and sex-specific cut-offs may be applied to the energy intake of children and teenagers, a major limitation of this technique is the use of a single cut-off based on a sedentary physical activity level. Since under-reporting occurs at all levels of energy expenditure, different levels of physical activity would have to be accounted for when using physical activity cut-offs. A second consideration is that the validation of dietary intakes against energy expenditure identifies bias in reporting energy intake only: this method does not elucidate whether there is a bias in estimating nutrient intakes( Reference Livingstone, Robson and Wallace 33 ). The under-reporting of food intake tends to be selective and vitamin D is not generally contained in snack foods or desserts, which are known to be prone to under-reporting( Reference Black, Prentice and Goldberg 34 , Reference Livingstone, Prentice and Strain 35 ). Until the issue of misreporting in children and teenagers is adequately characterised, dietary intake data should be evaluated with caution and reported intakes should be considered as minimum true intakes( Reference Livingstone, Robson and Wallace 33 ).
A further consideration in assessing adequacy of vitamin D intakes in children and teenagers is the paucity of data on which the Dietary Reference Intake (DRI) for these age groups was based. To assign a DRI for vitamin D, the IOM committee developed a model simulating the response of serum 25(OH)D concentrations to total vitamin D intake using data from randomised controlled trials (RCT) in northern Europe and Antarctica during their respective winter seasons to ensure a minimal effect of sun exposure. A single, combined regression analysis was carried out since there was no apparent age effect in the response of serum 25(OH)D concentration to vitamin D intake. Based on this model, the IOM committee assigned an EAR of 10 μg/d for all ages above 1 year to achieve a median serum 25(OH)D concentration of 40 nmol/l above which approximately half the population might meet its vitamin D requirement( 1 ). However, the model developed by the IOM incorporates data coming mainly from trials in adults, while only three RCT provided data from children and teenagers; a combined total sample of 292 participants aged 6–14 years. Of the three RCT in children and teenagers used in the IOM model, one was conducted in a small group of twenty participants( Reference Schou, Heuck and Wolthers 36 ), one was conducted in 1988( Reference Ala-Houhala, Koskinen and Koskinen 37 ) and the largest was conducted more recently in 2006 in 228 adolescent girls( Reference Viljakainen, Natri and Karkkainen 38 ).
A recent retrospective analysis of a previous study by Cashman et al. ( Reference Cashman, FitzGerald and Viljakainen 39 ) used individual winter-time 25(OH)D concentrations from 11–12-year-old girls in Denmark and Finland (n 144) to estimate the distribution of vitamin D intakes that would maintain serum 25(OH)D concentrations above proposed cut-points. The authors reported that 6·3 μg/d would maintain serum 25(OH)D >40 nmol/l in 50 % of the sample. This estimate is substantially lower than the EAR of 10 μg/d proposed by the IOM committee and would have a pronounced impact on the prevalence of inadequate intakes reported here. RCT designed a priori to estimate the dietary requirement for vitamin D in children and adolescents are urgently required to specify DRI for these age groups based on quality experimental data. The implications of low vitamin D intakes for status estimates in children in Ireland are unknown, as there are no representative serum 25(OH)D data. We previously reported a prevalence of serum 25(OH)D <50 nmol/l of 46 % during winter in a large cohort of Northern Ireland boys and girls aged 12 and 15 years, with a diet similar to the children surveyed here( Reference Hill, Cotter and Mitchell 40 ).
Compared with the EAR of 10 μg/d, intakes of vitamin D in children and teenagers in Ireland are low and, despite a liberal policy of voluntary food fortification, not one individual in the current study was identified as having intakes that approached the UL. Natural food sources of vitamin D are few and infrequently consumed and, although supplementation is an effective method of increasing intakes in the individuals who take them, the proportion of supplement users is low. This low uptake, particularly among adolescents, proves that in this population supplementation is not an effective public health strategy to reduce vitamin D inadequacy. With thoughtful planning and well-informed modelling of food intake data, food fortification (using a combination of bio-fortification and nutrient addition) has the potential to increase intakes at the low end of the distribution (i.e. in non-supplement users) without incurring risk of excessive intakes at the upper end of the distribution. Vitamin D-fortified foods can increase 25(OH)D concentrations in a dose-dependent manner( Reference Black, Seamans and Cashman 41 ); however, careful consideration must be given to the range of products used, and the level of vitamin D added, in order to ensure efficacy while minimising the risk of excessive intakes. This can only be achieved by modelling food consumption intakes in representative samples and subsequently carrying out community-based RCT that measure the impact of fortified foods on 25(OH)D concentrations. In the meantime, data from targeted RCT in children and teenagers are required to establish dietary requirements in these age groups prior to making major modifications to the food supply.
Acknowledgements
Sources of funding: The National Nutrition Surveys of children and teenagers in Ireland were funded by the Irish Government, Department of Agriculture, Food and the Marine. The present analysis was carried out with partial financial support from the Commission of the European Communities, specific RTD Programme ‘Quality of Life and Management of Living Resources’, within the 6th Framework Programme (contract no. FP6-036196-2 EURRECA: EURopean micronutrient RECommendations Aligned). This paper does not necessarily reflect the views of the Commission and in no way anticipates future policy in this area. Conflict of interest: The authors have no conflicts of interest. Authors’ contributions: M.K. designed the research; L.J.B. conducted the analysis; L.J.B. and M.K. wrote the paper; A.F. was the Principal Investigator of the two national nutrition surveys on which the analysis is based; J.W. was involved in implementation of the two surveys; M.K. had responsibility for final content; all authors read and approved the manuscript.
Supplementary Materials
For Supplementary Materials for this article, please visit http://dx.doi.org/10.1017/S1368980013000359


