

Malnutrition in children under 5 years of age (under-5s) is an important cause of childhood morbidity and mortality in low- and middle-income countries( Reference Lim, Vos and Flaxman 1 , Reference Black, Victora and Walker 2 ). Reduction of malnutrition may increase child survival and is of great importance for better human and economic development and social equity( Reference Pelletier and Frongillo 3 ). It is widely argued that interventions to alleviate malnutrition are an effective approach to achieve several sustainable development goals( 4 ).
The burden of malnutrition in under-5s can be geographically heterogeneous. The prevalence of malnutrition may vary between countries because of such factors as gross national product, per capita national income, per capita food availability, governmental social support, national immunization rate, quality of the country’s health environment, total child population, female education, female literacy rate, women’s status relative to men’s and presence of democracy( Reference Frongillo, de Onis and Hanson 5 – 8 ). Within a country prevalence of malnutrition may vary among communities because of different levels of socio-economic development, community water and sanitation infrastructure, availability and accessibility to health and education services, cultural practices regarding food, community employment and social participation, and the education level of the community( Reference Corsi, Chow and Lear 9 , Reference Griffiths, Madise and Whitworth 10 ). Moreover, communities with a high prevalence of malnutrition are likely to be surrounded by others with similar levels, giving rise to spatial clustering of malnutrition( Reference Gebreyesus, Mariam and Woldehanna 11 ).
Spatial cluster analysis is a method used to quantify geographical aggregation of disease and thus allows identification of priority areas that require interventions. Several nutritional studies have applied spatial cluster analysis to identify geographical areas with a high rate of overweight/obesity( Reference Michimi and Wimberly 12 , Reference Pouliou and Elliott 13 ) and high rate of low birth weight( Reference Tu, Tedders and Tian 14 ). However, the application of this method in identifying high-prevalence areas of childhood malnutrition has so far been limited. Moreover, those that examined geographical disparities in malnutrition endemicity draw different conclusions. For example, some reported low, or moderately low, spatial clustering of stunting and wasting at national and sub-national levels, and highlighted limited benefits of geographically targeted nutrition interventions( Reference Morris 15 , Reference Fenn, Morris and Frost 16 ); whereas others reported spatial clustering at the district level and concluded that geographically targeted interventions could be implemented along with individual- or household-level interventions( Reference Gebreyesus, Mariam and Woldehanna 11 ). The question as to whether spatial clustering of malnutrition exists at national and sub-national levels within a country and whether this has evolved over time in the face of continuing interventions remains poorly understood. Such an approach will generate important evidence for implementing interventions that are geographically targeted to areas that have historically been unable to reduce malnutrition prevalence.
Bangladesh is a country in South Asia with high prevalence of childhood malnutrition. Over the years, the Government of Bangladesh, non-governmental organizations and other development agencies have implemented several nutrition interventions such as the National Nutrition Services, nutrition surveillance and homestead food production, the Vulnerable Group Development Programme and others to tackle maternal and child malnutrition( Reference Muiruri, Hulcome and Schumacher 17 ). These initiatives helped Bangladesh reduce childhood malnutrition during the past decades. However, the pace of reduction was uneven across socio-economic groups and geographical divisions( Reference Hasan, Soares Magalhaes and Williams 18 ) (a division is the first administrative tier in the People’s Republic of Bangladesh). While some divisions such as Khulna and Rajshahi are doing well in reduction of malnutrition, others such as Sylhet division is doing worse. The geographical discrepancy in effectiveness of malnutrition interventions could be associated with the presence of spatial clustering of malnutrition and the way nutrition interventions are currently delivered in each division of the country. For instance, if in a division, the prevalence of malnutrition is high and also spatially clustered, this would mean that a targeted geographical deployment of interventions would provide maximum benefit compared with a random intervention. Previous research conducted in Bangladesh documented why interventions implemented under National Nutrition Services failed to provide maximum benefit to improve nutrition situation in the country( Reference Saha, Billah and Menon 19 ); however, researchers are yet to explore the best delivery approach (i.e. geographically targeted v. random) to tackle malnutrition at the national and sub-national (divisional) levels in Bangladesh.
In the present study we investigated whether malnutrition indicators (stunting, underweight and wasting) in Bangladesh were spatially clustered at national and sub-national levels, and whether these patterns changed between 1999 and 2011. The findings of our study can help public health practitioners to better understand the geographical distribution of the prevalence of stunting, underweight and wasting at small spatial scales in Bangladesh and to increase the effectiveness of the delivery format (geographically targeted deployment of interventions v. random deployment of interventions) within each division of the country.
Methods
Data sources
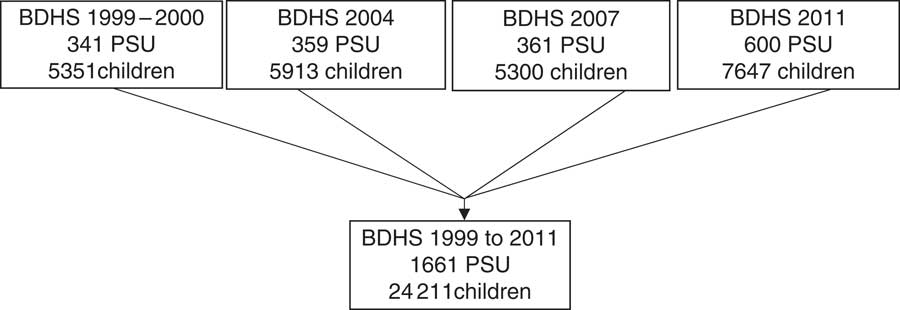
We used data from four Demographic and Health Surveys (DHS) conducted in 1999–2000, 2004, 2007 and 2011 in Bangladesh involving 24 211 under-5s. For analysis of spatial clustering for stunting, underweight and wasting at the national level, we used 341 primary sampling units (PSU) from the 1999–2000 survey, 359 PSU from the 2004 survey, 361 PSU from the 2007 survey and 600 PSU from the 2011 survey. The flowchart of the sample selection is provided in Fig. 1. Bangladesh has seven administrative divisions: Barisal, Chittagong, Dhaka, Khulna, Rajshahi, Rangpur and Sylhet( 20 ). Rangpur division was formed from the greater Rajshahi division in 2010. For analysis at the sub-national (division) level, we excluded information of eighty-five PSU from the 2011 survey for the Rangpur division because data were available for this division only for the most recent survey (2011). This exclusion allowed us to compare changes in spatial clustering of malnutrition indicators for the remaining six divisions for all survey years.
Flowchart of the sample selection for the present study: primary sampling units (PSU) and children under 5 years of age from the Bangladesh Demographic and Health Surveys (BDHS) 1999–2000, 2004, 2007 and 2011
PSU (small geographical units that typically include 120–130 households) serve as the first sampling unit in the multistage stratified sampling used by the DHS to draw nationally representative sample of households in Bangladesh( 20 , 21 ). Longitude and latitude for each of these PSU have been provided by DHS since the 1999–2000 survey in Bangladesh. More detailed information about the DHS global positioning system data collection is available elsewhere (http://www.dhsprogram.com/What-We-Do/GPS-Data-Collection.cfm).
We assessed malnutrition status (stunted, underweight and wasted) of the sampled children based on their anthropometric indices data (height/length-for-age Z-score (HAZ), weight-for-age Z-score (WAZ) and weight-for-height/length Z-score (WHZ))( 22 ). The prevalence of stunting (HAZ<−2), underweight (WAZ<−2) and wasting (WHZ<−2) at each PSU site and for each survey year were estimated based on the WHO child growth standards( 23 ). We applied sampling weights based on the unit of analysis (children) that accounts for disproportionate sampling and non-response of the DHS data.
Statistical analyses
We performed analyses in two steps: first, to visualize the spatiotemporal distribution of malnutrition across the country, we generated maps showing the observed prevalence of stunting, underweight and wasting at each PSU site in a geographical information system (ArcGIS version 10.2; ESRI). We categorized the observed prevalence based on the WHO classifications for assessing severity of malnutrition by prevalence ranges at the population level (for stunting: low (less than 20 %), medium (20–29 %), high (30–39 %), very high (at least 40 %); for underweight: low (less than 10 %), medium (10–19 %), high (20–29 %), very high (at least 30 %); for wasting: low (less than 5 %), medium (5–9 %), high (10–14 %), very high (at least 15 %))( Reference De Onis and Blössner 24 ). Second, we quantified the extent of spatial clustering of stunting, underweight and wasting both at the national and sub-national (division) levels using semivariograms. A semivariogram is a plot used to examine spatial dependence between pairs of data points( Reference Cressie 25 ) and is described by three important parameters (the range, sill and nugget)( Reference Cressie 25 , Reference Soares Magalhães and Clements 26 ). The nugget describes spatially uncorrelated (random) variation in the data, the partial sill (the sill minus the nugget) describes spatially autocorrelated variation in the data, and the range represents the distance at which spatial autocorrelation ceases( Reference Soares Magalhães and Clements 26 ). The range is useful for measuring the average size of disease clusters, whereas the sill is useful for understanding geographical clustering( Reference Soares Magalhães and Clements 27 ). We also calculated the proportion of variation due to spatial clustering (propensity of clustering) as follows: the sill divided by the sum of the sill and nugget. The geoR package of the statistical software R was used to examine spatial clustering( Reference Ribeiro and Diggle 28 ).
Results
Overall spatiotemporal distribution of malnutrition indicators
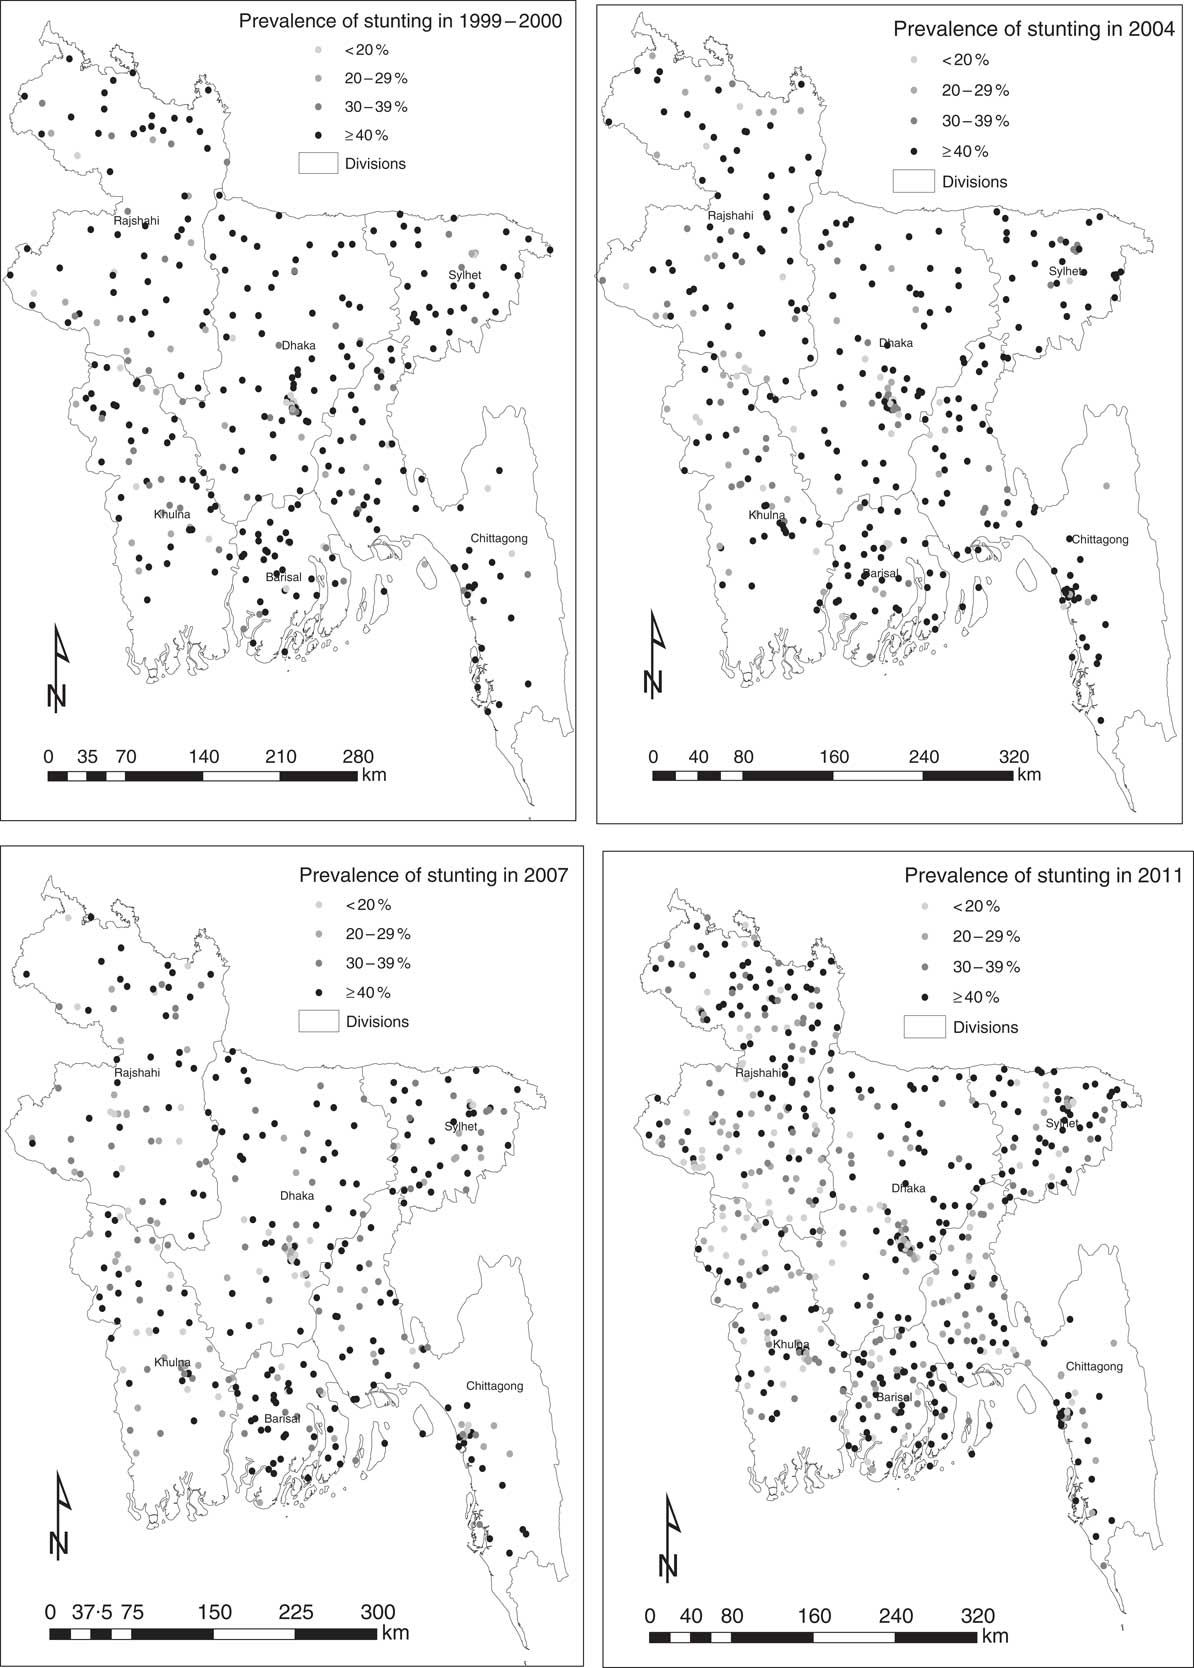
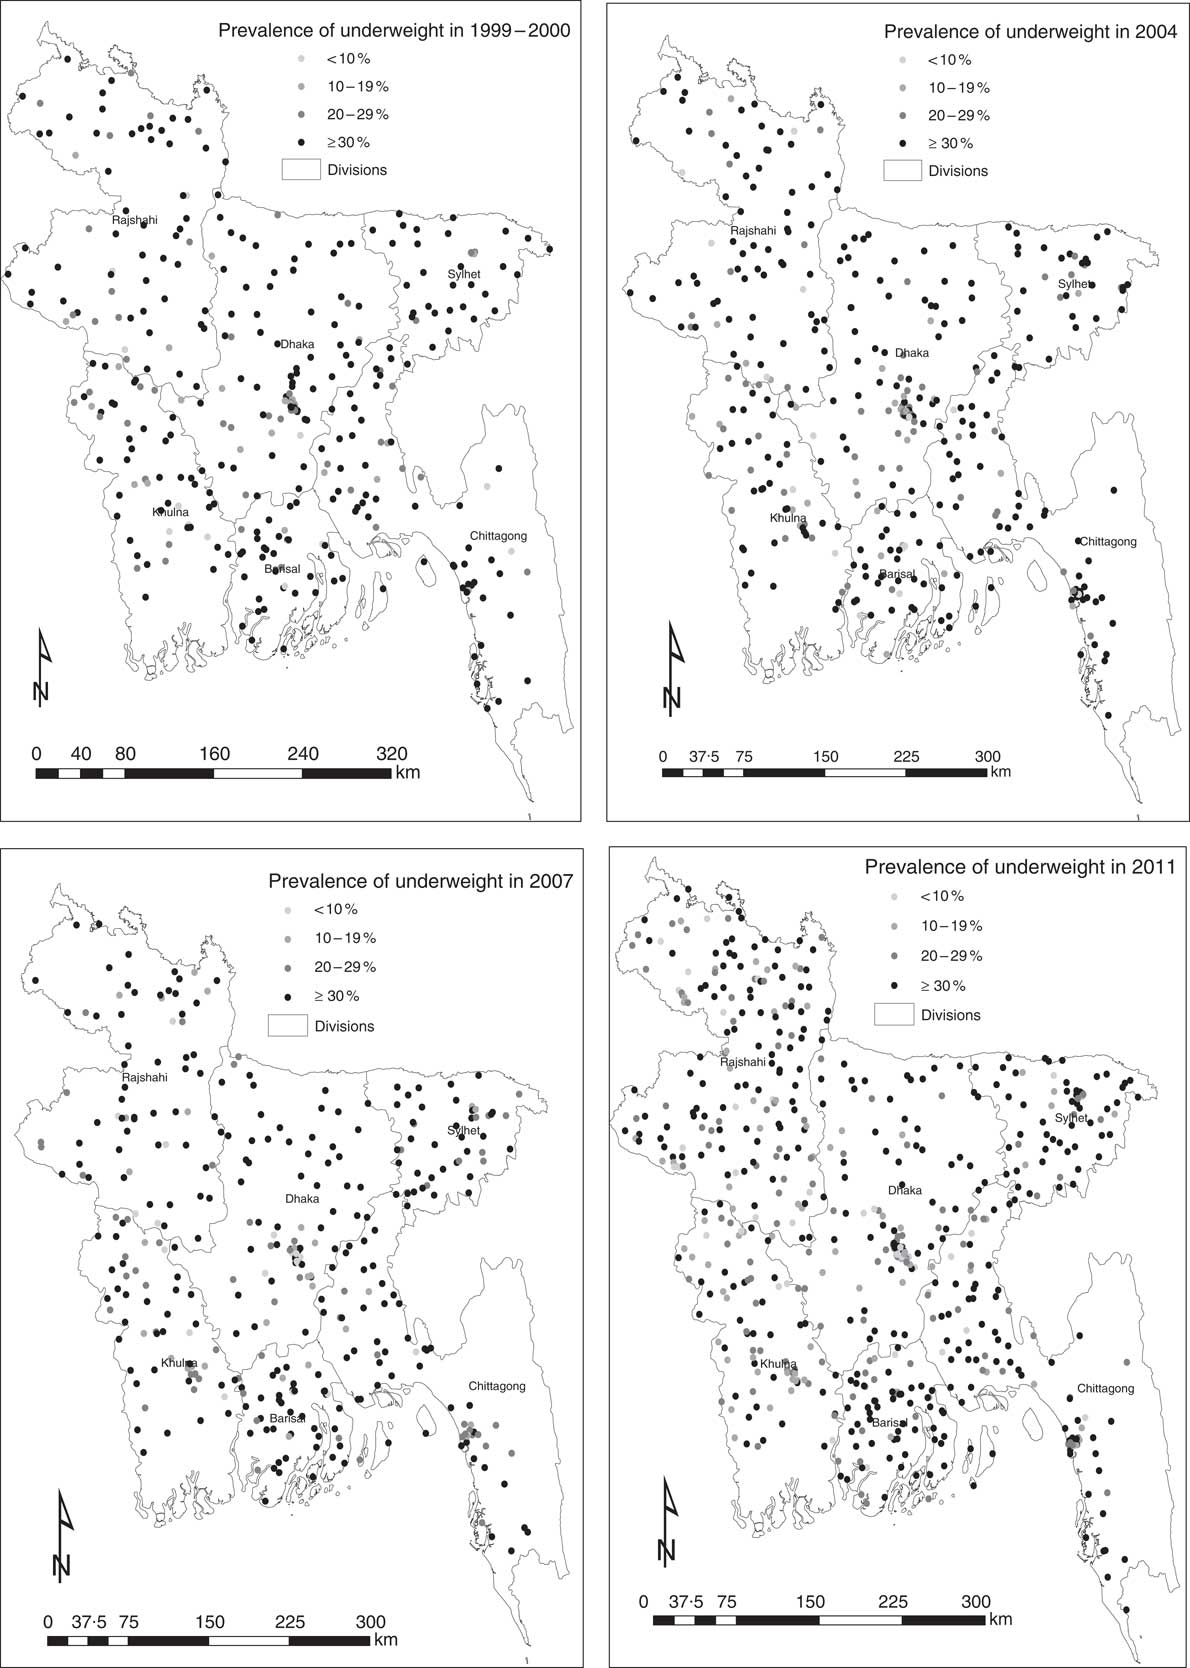
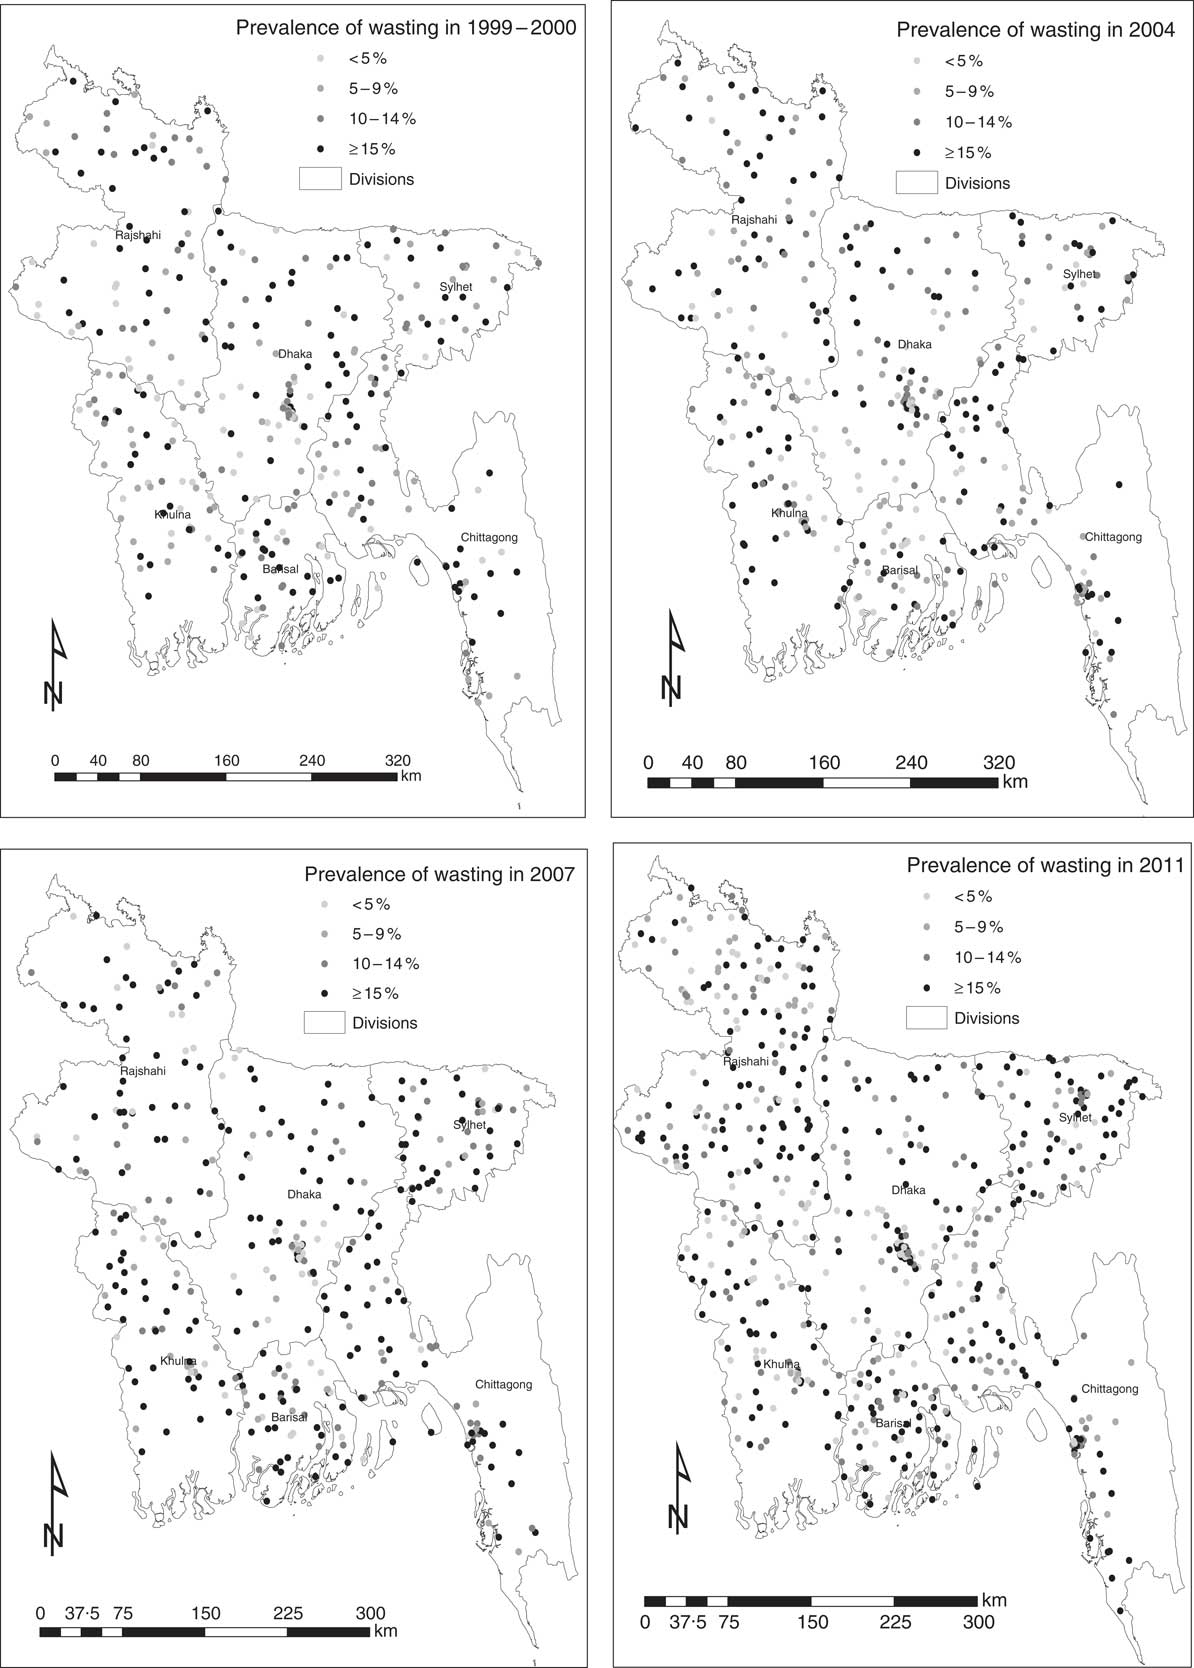
We included 1661 PSU with complete malnutrition data for a total of 24 211 under-5s from Bangladesh. The spatial distribution of observed prevalence of stunting, underweight and wasting among under-5s for each survey year is presented in Fig. 2, 3 and 4, respectively. Results indicate very high prevalence of stunting (at least 40 %) and underweight (at least 30 %) in most PSU across the country in 1999 based on the WHO cut-offs. In contrast to stunting and underweight, the level of wasting did not decrease over time. In 2011, the prevalence of wasting was very high (at least 15 %) in most PSU throughout Bangladesh.
Prevalence of stunting among 24 211 children under 5 years of age at 1661 primary sampling units: Bangladesh Demographic and Health Surveys 1999–2000, 2004, 2007 and 2011
Prevalence of underweight among 24 211 children under 5 years of age at 1661 primary sampling units: Bangladesh Demographic and Health Surveys 1999–2000, 2004, 2007 and 2011
Prevalence of wasting among 24 211 children under 5 years of age at 1661 primary sampling units: Bangladesh Demographic and Health Surveys 1999–2000, 2004, 2007 and 2011
Spatial clustering of malnutrition indicators at national level
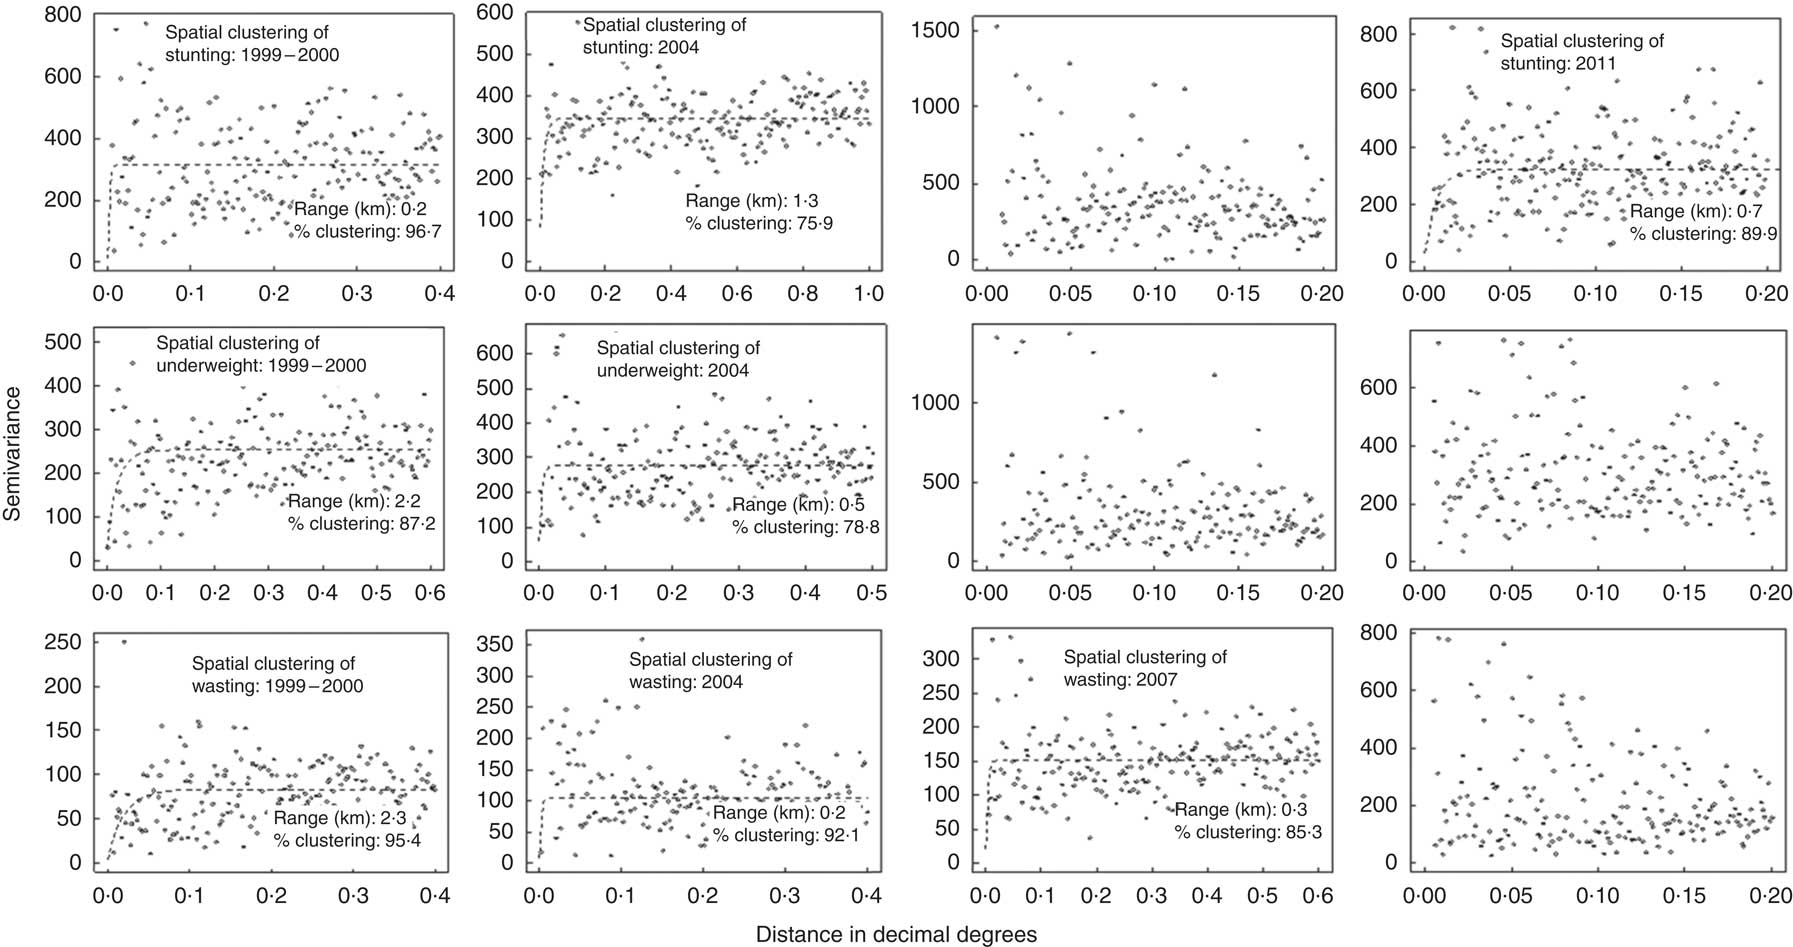
The semivariograms for prevalence of stunting, underweight and wasting at the national level are presented in Fig. 5. Spatial clustering in the prevalence of stunting was observed in all survey years except 2007. The average size of clusters was greater in 2004 (range 1·3 km) compared with 1999–2000 (0·2 km) and 2011 (0·7 km). The propensity for clustering decreased from 96·7 % in 1999–2000 to 75·9 % in 2007 but then increased to 89·9 % in 2011. Spatial clustering in the prevalence of underweight was observed in 1999–2000 and in 2004. The size and propensity for clustering were larger in 1999–2000 (range 2·2 km, propensity 87·2 %) compared with 2004 (0·5 km, 78·8 %). Spatial clustering in the prevalence of wasting was observed in all survey years except 2011. The size of clusters decreased from 2·3 km 1999–2000 to 0·3 km in 2007. The propensity for clustering also decreased from 95·4 % in 1999–2000 to 85·3 % in 2011.
Trends in spatial clustering of stunting, underweight and wasting at national level among 24 211 children under 5 years of age: Bangladesh Demographic and Health Surveys 1999–2000, 2004, 2007 and 2011
Spatial clustering of malnutrition indictors at sub-national (division) level
Table 1 shows semivariogram parameter estimates for prevalence of stunting, underweight and wasting at the sub-national (division) level for each survey year. The corresponding semivariograms are provided in the online supplementary material. Spatial clustering in the prevalence of stunting was observed in all survey years in the capital (Dhaka division), south-west region (Khulna division), mid-western region (Rajshahi division) and north-east region (Sylhet division) of the country (Table 1). The size of clusters and the propensity of clustering in prevalence of stunting varied substantially across the regions. In Dhaka, the size of clusters decreased steadily from 2·1 km in 1999–2000 to 0·3 km in 2011. The propensity of clustering increased from 87 % in 1999–2000 to 100 % in 2011. In Rajshahi and Sylhet, the size of clusters also decreased (2·4 and 16·3 km, respectively, in 1999–2000 to 1·7 and 1·2 km, respectively, in 2011). The propensity of clustering, however, remained unchanged.
Trends in spatial clustering of stunting, underweight and wasting at sub-national (division) level among 24 211 children under 5 years of age: Bangladesh Demographic and Health Surveys (BDHS) 1999–2000, 2004, 2007 and 2011
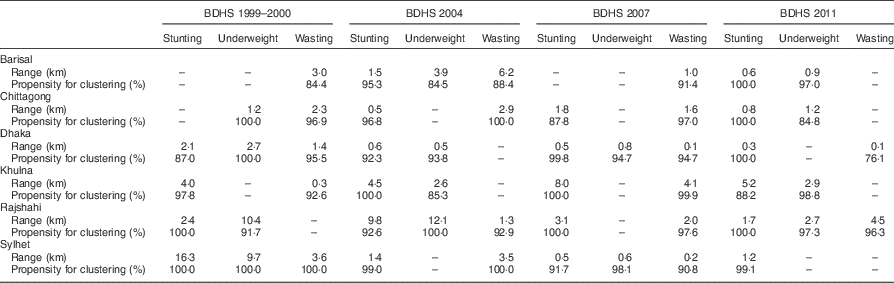
Spatial clustering in the prevalence of underweight was observed in Chittagong, Dhaka, Rajshahi and Sylhet divisions in 1999–2000. This trend changed in 2011 when only two divisions (Chittagong and Rajshahi) exhibited spatial clustering. Between 1999 and 2011, the size of clusters remained unchanged in Chittagong division whereas it decreased in Rajshahi division. Clustering of prevalence of underweight was also observed in Barisal and Khulna divisions in 2004 and in 2011 with varying size of clusters and propensity for spatial clustering.
Spatial clustering in the prevalence of wasting was observed in all divisions except Rajshahi in 1999–2000. This trend continued until 2007 for three divisions – Barisal, Chittagong and Sylhet. The size of clusters decreased between 1999 and 2007 in the three divisions: Barisal, 3·0 to 1·0 km; Chittagong, 2·3 to 1·6 km; and Sylhet, 3·6 to 0·2 km. Propensity of clustering increased in Barisal and Chittagong divisions from 1999 to 2007 whereas it decreased in Sylhet division. In 2011, clustering of wasting occurred only in Dhaka and Rajshahi divisions. The size of clusters was 0·1 km in Dhaka and 4·5 km in Rajshahi division.
Discussion
The present study is the first to report the spatial distribution and changes in spatial clustering in the prevalence of stunting, underweight and wasting in Bangladesh during the past 12 years (1999 to 2011). In 1999 most PSU throughout Bangladesh experienced malnutrition indicators which exceeded the WHO cut-offs. By 2011, severity of malnutrition generally decreased, although in two of the six divisions (Barisal and Sylhet) PSU still exhibited higher levels of malnutrition compared with other divisions of the country.
We found spatial clustering in the prevalence of stunting, underweight and wasting both at national level and at sub-national (division) level. At the national level, spatial clustering in the prevalence of stunting was found at the 1999–2000, 2004 and 2011 surveys; underweight at the 1999–2000 and 2004 surveys; and wasting at the 1999–2000, 2004 and 2007 surveys. The finding that the prevalence of stunting showed more clustering than the prevalence of underweight and wasting is in line with previous study findings( Reference Morris 15 ). Stunting, also known as chronic malnutrition, is closely associated with socio-economic status and therefore exhibits more clustering( Reference Fenn, Morris and Frost 16 , Reference Bogin 29 ). Several contextual factors such as poverty, poor sanitation and poor access to health-care services are associated with increased risk of stunting in children( Reference Adekanmbi, Kayode and Uthman 30 ). Although Bangladesh has witnessed steady economic progress over the last two decades, still 31 % of the population lives below the poverty line and wide income disparities exist between urban and rural areas( Reference Ferdousi and Dehai 31 ). Only 34 % of households have access to an improved toilet facility (not shared)( 20 ) and significant inequity remains in accessing health services, with people from the higher wealth quintiles enjoying the most benefits of both public and private health services( 32 ). Thus, it is expected that clustering for stunting might continue to exist until proper socio-economic development of the communities is achieved. Nevertheless, to tackle stunting on an urgent basis, the Government of Bangladesh needs to pay special focus to tackle poverty and economic inequality. In addition, it is important to adopt appropriate strategies to ensure that every household has access to sanitation and health-care services. Regarding tackling of wasting, which remained highly clustered until 2007, we should note that it is indicator of acute malnutrition – a short-term deficiency in food supply or a recent episode of illness may cause wasting in children( Reference Ajao, Ojofeitimi and Adebayo 33 ). It is possible to reduce the burden of wasting by improving household income, food security, caring practices and controlling of infectious diseases( Reference Ajao, Ojofeitimi and Adebayo 33 – 35 ).
At the divisional level, clustering in the prevalence of stunting was observed in all survey years in four of the six divisions – Dhaka, Khulna, Rajshahi and Sylhet. In 2011, the size of clusters varied substantially, with the average minimum size found in Dhaka division (0·3 km) and the maximum size in Khulna division (5·2 km). These findings indicate that if a community with high prevalence of stunting is identified in Dhaka division, nutrition interventions can be implemented within 0·3 km radius from it; for Khulna division, this intervention needs to be implemented within 5·2 km radius from the affected community. Unlike the four divisions (Dhaka, Khulna, Rajshahi and Sylhet), clustering in the prevalence of stunting was not observed in Barisal division (in 1999 and 2007) and in Chittagong division (in 1999), which may suggest that stunting was more evenly distributed in these two divisions compared with the four divisions (Dhaka, Khulna, Rajshahi and Sylhet) where stunting remained concentrated in certain pockets of areas. The socio-economic condition of the households in different divisions might be associated with these changing patterns. In addition, geographical location of the different divisions might have played a role. For example, Barisal division has the highest incidence of poverty and is considered the most vulnerable to natural hazards and frequent disasters compared with the other divisions, which makes its inhabitants – especially children – vulnerable to food security, leading to chronic malnutrition( Reference Ferdousi and Dehai 31 , Reference Akter, Mukherjee and Khan 36 ).
We also observed spatial clustering in the prevalence of underweight in Chittagong and Rajshahi divisions in 1999 and 2011. The size of clusters decreased in Rajshahi division from 10·4 km in 1999 to 2·7 km in 2011, whereas it remained unchanged in Chittagong division. The reduction in cluster size in Rajshahi division might be associated with faster reduction in household poverty and improvements in vaccination coverage and maternal education( 20 , 37 , 38 ). It is possible that in 1999 childhood underweight was highly prevalent among large population groups and in vast areas of Rajshahi division, thus generating a large geographical trend. However, over time, as a result of socio-economic improvements, high prevalence of underweight remained concentrated among fewer population groups and in small areas, thus generating a small geographical trend. This is also evident from the decreasing trend in the prevalence of underweight in Rajshahi division from 43·3 % in 1999 to 34·1 % in 2011( Reference Hasan, Soares Magalhaes and Williams 18 ). In Chittagong division the size of clusters of underweight remained unchanged and small (1·2 km) over time, perhaps because of the high population density and presence of urban slums.
For wasting, we found spatial clustering in two divisions (Dhaka and Rajshahi) in 2011 compared with spatial clustering in all divisions in 2007. The size of clusters in the two divisions also decreased between 2007 and 2011. This might indicate an improvement in the nutritional status of under-5s in 2011 compared with 2007, during which a major flood seriously affected more than half of Bangladesh. Dhaka, the capital of Bangladesh, is home to many slums which are characterized by a higher prevalence of malnutrition, anaemia and other poor health outcomes compared with other areas( Reference Muiruri, Hulcome and Schumacher 17 ). It is possible that geographical clusters observed in the present study include those slums. Similarly, Rajshahi division located in the north of Bangladesh is the second poorest division of Bangladesh( 38 ) where many of its population experience a seasonal pattern of food shortages called monga ( Reference Rudolph 39 ). It is possible that the geographical clusters include monga areas; this requires further investigation. Nevertheless, it should be noted that an absence of spatial clustering in the prevalence of wasting in Sylhet division in 2011 does not indicate that the problem is less severe, rather it may indicate that the problem is widespread and thus more evenly distributed across Sylhet division than in Dhaka and Rajshahi divisions.
The results of our study have important public health implications. Our divisional level semivariogram findings combined with divisional level malnutrition prevalence can provide a means to understand the type of interventions (geographically targeted interventions v. random interventions) required to tackle malnutrition in different divisions of the country. For instance, a division with a high prevalence of malnutrition indicators and a high tendency for spatial clustering means that programme planners should prioritize interventions to that division and the interventions will have to be geographically targeted because malnutrition in the division is very likely to be clustered; in this case random intervention delivery within the division would likely be ineffective. Thus, interventions targeting chronic malnutrition (stunting) can be implemented in high-prevalence communities across all divisions of Bangladesh with varying geographical scales (depending on the size of clusters). For childhood underweight, geographically targeted nutrition interventions can be implemented in high-prevalence communities of Barisal, Chittagong, Khulna and Rajshahi divisions. For childhood wasting, geographically targeted nutrition interventions can be implemented in high-prevalence communities of Dhaka and Rajshahi divisions. Previous studies have shown the influence of characteristics of communities, such as community hygiene and community socio-economic status, on the nutritional outcomes of children( Reference Griffiths, Madise and Whitworth 10 , Reference Uthman 40 – Reference Fotso and Kuate-Defo 42 ); some of these characteristics are spatially variable. A population-based study conducted in Bangladesh identified community levels of education, employment and social participation as important determinants of HAZ and WAZ among children( Reference Corsi, Chow and Lear 9 ). Thus, spatial variation in social context is likely to be associated with local spatial variation in malnutrition outcomes and therefore it is necessary to promote health education and disease prevention at the community level( Reference Uthman 40 ).
A potential limitation of our study is that while PSU were used as proxies for the communities( Reference Fenn, Morris and Frost 16 , Reference Boco 43 ), it is possible that clustering exhibits a smaller spatial scale.
Conclusion
In conclusion, our study shows that malnutrition indicators are spatially heterogeneous across geographic divisions in Bangladesh. Future planning of delivery of nutrition interventions (geographically targeted interventions v. random interventions) should consider the spatial clustering of malnutrition indicators observed in the present study.
Acknowledgements
Acknowledgements: The authors would like to thank The DHS Program for granting permission to use the Bangladesh DHS data. Financial support: This research received no specific grant from any funding agency in the public, commercial or not-for-profit sectors. Conflict of interest: None. Authorship: M.T.H. designed the study, formulated the research question, conducted the statistical analysis, interpreted the findings and wrote the first draft; A.A.M. and G.M.W. contributed to the interpretation, writing and critical revision; R.J.S.M. designed the study, interpreted the findings, and contributed to writing and critical revision. Ethics of human subject participation: This study used publicly available secondary Bangladesh DHS data sets (1999–2000, 2004, 2007 and 2011). Ethical approval was not required.
Supplementary material
To view supplementary material for this article, please visit https://doi.org/10.1017/S136898001700341X


