Dietary carbohydrate sources range from simple monosaccharides to disaccharides to complex polysaccharides. Among these carbohydrate sources, dietary disaccharides and polysaccharides are broken down to monosaccharides before being transported into the intestinal epithelial cells, and delivered to the liver via the portal blood(Reference Neuschwander-Tetri1). In the livers, they were metabolised to provide substrates for the biosynthesis of fatty acids and TAG(Reference Iizuka, Bruick and Liang2,Reference Uyeda and Repa3) . Increasing evidences have shown that the biosynthesis of hepatic fatty acids from carbohydrates contributes to excessive lipid deposition and the development of fatty liver diseases, and the increased intake of dietary carbohydrate is the reason of these diseases(Reference Neuschwander-Tetri1,Reference Morral, Edenberg and Witting4) . These have attracted wide attentions in unravelling the regulation of lipogenic genes in response to dietary carbohydrate signals. The biosynthesis of fatty acids and TAG involves many enzymes, such as NADPH-generating enzymes, fatty acid synthase (FAS), stearoyl-CoA desaturase 1 (SCD1), acetyl-CoA carboxylase (ACC) and lipoprotein lipase (LPL), to induce de novo lipogenesis for the storage of energy source(Reference Morral, Edenberg and Witting4,Reference Foretz, Pacot and Dugail5) . On the other hand, several transcription factors, such as carbohydrate-responsive element binding protein (ChREBP), sterol regulatory elements binding protein 1 (SREBP1), PPAR and liver X receptor (LXR), are important candidates for the induction of lipogenesis(Reference Foretz, Pacot and Dugail5–Reference Postic, Dentin and Denechaud7). They modulate the transcription of many genes relevant to fatty acid metabolism and accordingly play key roles in lipid homoeostasis(Reference Brown and Goldstein8). At present, the impacts of dietary carbohydrate on the control of these enzymes and genes are not well understood(Reference Foretz, Pacot and Dugail5,Reference Kim, Sarraf and Wright9) . A thorough understanding into the mechanisms of carbohydrate affecting gene expression will help build the nutritional preventive pathways for diseases involving the metabolic dysfunction in the livers, such as the metabolic syndrome and fatty liver diseases(Reference Morral, Edenberg and Witting4).
Genes and proteins involved in lipid metabolism are acutely controlled at the transcriptional and post-translational levels. Among the post-translational modification, small ubiquitin-related modifier (SUMO) modification acts as an important mechanism affecting the cellular localisation, activities and stabilities of the target proteins(Reference Flotho and Melchior10,Reference Guo and Henley11) . Four SUMO isoforms, SUMO1, SUMO2, SUMO3 and SUMO4, have been detected in mammals, but only SUMO1, SUMO2 and SUMO3 can be conjugated to their target proteins. SUMO-activating enzyme subunit 1 (SAE1) and SAE1 subunits activate SUMO proteins(Reference Johnson, Schwienhorst and Dohmen12). Activated SUMO proteins are transferred to ubiquitin-conjugating enzyme 9 (UBC9), the E2-conjugating enzyme, and they are conjugated to specific lysine residues in the target proteins(Reference Desterro, Rodriguez and Hay13). The Protein Inhibitor of Activated STAT (PIAS) family work as the E3 ligases, which contribute to the SUMOylation substrate specificity and efficiency(Reference Johnson, Schwienhorst and Dohmen12,Reference Rytinki, Kaikkonen and Pehkonen14) . SUMOylation is a highly dynamic process, which can be revised by SUMO-specific proteases (SENP)(Reference Hay15). At present, several transcription factors involved in lipid metabolism were reported for SUMOylation modification, including PPARγ(Reference Pascual, Fong and Ogawa16) and SREBP(Reference Hirano, Murata and Tanaka17). However, the effect and the underlying mechanism of their SUMOylation modifications on lipid metabolism are largely unknown.
Here, we explored the influences of dietary carbohydrate sources on lipid metabolism in the liver tissues of yellow catfish; by using its primary hepatocytes, the mechanism of glucose incubation up-regulating lipogenesis and lipid deposition was also investigated. Our findings provide evidences that SREBP1 is an important regulator of lipid metabolism and that its SUMOylation modification acts as a molecular switch to influence gene expression in response to dietary glucose signals.
Materials and methods
Our study is divided into two parts, an in vivo study and an in vitro study. The experimental protocols were approved by the Committee of Huazhong Agricultural University on the Ethics of Laboratory Animal Experiments.
Expt 1: in vivo study
Experimental procedures
The experimental protocols for fish culture and management have been described in our parallel study(Reference Zhao, Yang and Chen18). Briefly, yellow catfish from a local fish farm (Wuhan, China) were subjected to a 2-week acclimation in the indoor tanks. Then, 450 uniform-sized fish (4·68 (se 0·02 g)) were stocked in fifteen tanks (300 litres in water volume), thirty fish for each tank. Five diets were formulated to contain 25 % of carbohydrates, based on our published studies(Reference Ye, Tan and Chen19). Dietary carbohydrate sources consisted of glucose, maize starch, sucrose, potato starch and dextrin, and they were all purchased from Aladdin company. Each diet was assigned to three tanks, and the feeding was similar to our recent study(Reference Zhao, Wu and Hogstrand20). The feeding experiment continued for 10 weeks. Then, prior to sampling, all fish were fasted for 24 h. They were euthanised, dissected on ice to obtain the liver tissues for the analysis of TAG and glycogen contents, histology, enzymatic activities, mRNA and protein expression assays and RNA sequencing.
Expt 2: in vitro study
Part 1. Isolation and culture of primary hepatocytes from yellow catfish
The hepatocytes were isolated from yellow catfish and cultured according to our previous studies(Reference Zhao, Wu and Hogstrand20). Three glucose concentrations, control (5·44 mm), 15 mm (15·60 mm) and 30 mm (29·84 mm), were used to incubate these hepatocytes at 28°C. Sampling occurred at the 48-h incubation for the following analyses: TAG content, enzymatic activity, quantitative PCR and immunoblotting. In addition, immunoprecipitation was conducted to analyse the mechanism of glucose influencing the SUMOylation of SREBP1. Each treatment was performed in triplicate.
Part 2. Hela cell culture and treatment
Here, we performed the two independent experiments. The first experiment was conducted to explore the SREBP1’s SUMOylation. Hela cells were transfected with SREBP1-Flag, SUMO1-6 × His and UBC9-6 × His plasmids by Lipofectamine 2000. The second experiment was conducted to explore the SUMOylation sites of SREBP1. Hela cells were transfected with SUMO1-6 × His, UBC9-6 × His and the mutations of SREBP1-Flag. The protocols for transfection followed the manufacturer’s instructions. After 48 h, the Hela cells were collected for the analysis of Western blot and immunoprecipitation.
Sample analysis
RNA sequencing and bioinformatics. In this study, the liver tissues from fish fed glucose (monosaccharide) and maize starch (polysaccharide) were selected for transcriptome analysis because the liver of fish fed the two groups of diets showed significantly different TAG contents. RNA library sequencing was conducted according to our recent publications(Reference Zhao, Wu and Hogstrand20,Reference Pan, Zhuo and Li21) . Six RNA libraries from two treatments were built and read on the Illumina HiSeq 4000 platform by the Novogene company. Differentially expressed genes were sieved by the DEseq software, and the parameters were designated below: P value <0·05 and the absolute value of log2 ratio > 1 (Anders & Huber, 2010). We performed Kyoto Encyclopedia of Genes and Genomes pathway enrichment analysis to identify these enriched metabolic pathways. Furthermore, fifteen candidate genes were arbitrarily selected for real-time quantitative PCR validation. Primers are showed in online Supplementary Table S1. We have chosen a set of eight housekeeping genes (β-actin, ribosomal protein L7 (rpl7), tubulin alpha chain (tuba), beta-2-microglobulin (b2m), TATA-box-binding protein (tbp), glyceraldehyde-3-phosphate dehydrogenase (gapdh), 18S rRNA and translation elongation factor (elfa)) from the literature so as to analyse their expression stabilities. The 2−ΔΔCt method was performed to calculate the fold variations in their relative expression(Reference Pfaffl22).
Histological and histochemical observation. Haematoxylin–eosin and Oil Red O stainings were conducted based on our recent publication(Reference Zhao, Yang and Chen18).
Cell viability, TAG, glucose, glycogen contents and enzymatic activities assays. Cell viability was measured according to our recent publication(Reference Yang, Tan and Zhang23). The contents of TAG, glucose and glycogen were measured by commercial kits (Nanjing Jiancheng Bioengineering Institute, Nanjing, China). The activities of lipogenic enzymes (glucose 6-phosphate dehydrogenase (G6PD), 6-phosphogluconate dehydrogenase (6PGD), malic enzyme (ME), isocitrate dehydrogenase (ICDH) and FAS) were measured as previously described(Reference Wu, Luo and Hogstrand24). Soluble protein concentrations were detected with the Bradford Protein Assay Kit (Nanjing Jiancheng Bioengineering Institute, Nanjing, China).
mRNA expression analysis (quantitative PCR). Quantitative PCR assays were performed according to Yang et al. (Reference Yang, Tan and Zhang23). The primers are given in online Supplementary Table S1. Eight housekeeping genes (β-actin, rpl7, tuba, b2m, tbp, gapdh, 18S rRNA and elfa) were selected to test their transcription stability. The relative gene expression was analysed with the 2−ΔΔCt method when normalising to the geometric mean of the best combination of two genes, based on the geNorm(Reference Yang, Tan and Zhang23).
Plasmid construction. We constructed SUMO1-6 × His, UBC9-6 × His and SREBP1-Flag plasmids based on the methods described previously(Reference Xu, Tan and Xu25). Mutants with the K145R, K254R, K264R, K392R and K419R mutations were obtained from wild-type SREBP1 after the site-directed mutagenesis. All the primers are listed in online Supplementary Table S1.
Western blot analysis. Western blot analysis was performed according to our recent publication(Reference Zhao, Yang and Chen18). Antibodies against SREBP1 (ab28481; Abcam), SUMO1 (ab32058; Abcam), SCD1 (ab19862; Abcam), LXRα (ab41902; Abcam), GAPDH (10494-1-AP; Proteintech Group) and IgG (Alexa Fluor® 647, ab150079; Abcam) were used to measure the expression of the corresponding proteins. We visualised the protein bands using the Vilber Fusion FX6 Spectra imaging system (Vilber Lourmat) and quantified them by the software Image-Pro Plus 6.0.
Immunoprecipitation. We used immunoprecipitation to analyse the SUMOylation level of SREBP1, based on Lee et al. (Reference Lee, Jang and Lee26). At first, we prepared for whole-cell lysates with modified radioimmunoprecipitation buffer containing 1 % SDS, 1 μm phenylmethylsulfonyl fluoride, 10 mm N-ethylmaleimide and 0·1 % protease inhibitor cocktail. We performed the immunoprecipitation by using the antibody indicated above. The immunoprecipitated complexes were then subjected to Western blot analysis. IgG was used as the loading control.
Statistical analysis
All the results are presented as means and their standard errors. Before the statistical analysis, all data were tested for normality of distribution using the Kolmogorov–Smirnov test. Data were evaluated using one-way ANOVA. Duncan’s multiple range tests were used to compare the differences among more than three groups, and Student’s t test was used to analyse the differences between two groups. The analysis was carried out using SPSS 19.0 for Windows (SPSS), and differences were considered statistically significant at P < 0·05.
Results
Expt 1: in vivo study
Histology, histochemistry, glycogen and TAG contents
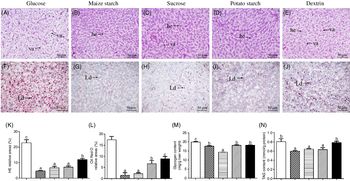
Yellow catfish fed with maize starch, sucrose and potato starch had normal histological structures, and the hepatocytes possessed the round nucleus with obvious nucleolus. In contrast, yellow catfish fed with dietary glucose and dextrin resulted in the vacuolisation in hepatocytes (Fig. 1(A)–(E)) and had more lipid droplets (Fig. 1(F)–(J)). These observations were confirmed by the quantitative analysis for vacuoles in the haematoxylin–eosin and lipid droplets in Oil Red O staining (Fig. 1(K) and (L)). Hepatic glycogen content was the highest for yellow catfish fed the glucose, and the lowest for yellow catfish fed the sucrose (Fig. 1(M)). TAG contents from the glucose and dextrin groups were higher than those in other three groups (Fig. 1(N)).
Effect of dietary carbohydrate sources on histology, histochemistry, glycogen and TAG content in the liver tissues of yellow catfish. Liver histology (haematoxylin–eosin; H&E) (A–E) and histochemistry (Oil Red O staining) (original magnification 200×, bars 50 μm) (F–J). (K) Relative areas for hepatic vacuoles in H&E staining; (L) relative areas for lipid droplets in Oil Red O staining; (M) glycogen content; (N) TAG content. Values are means with their standard errors (for analysing glycogen/TAG content, n 3 replicate tanks and six fish were sampled for each tank; for analysing H&E and Oil Red O staining, n 3 replicate tanks and three fish were sampled for each tank). a,b,c Unlike letters indicate significant differences among the five groups (P < 0·05). he, Hepatocytes; va, vacuoles; Ld, lipid droplet. ![]() , Glucose;
, Glucose; ![]() , maize starch;
, maize starch; ![]() , sucrose;
, sucrose; ![]() , potato starch;
, potato starch; ![]() , dextrin.
, dextrin.

Enzyme activities and gene expression
Dietary carbohydrate sources significantly influenced enzymatic activities and gene expression. Generally speaking, activities of G6PD, ME and ICDH were higher in dietary glucose group than other groups. 6PGD activities were higher in dietary glucose, maize starch and potato starch groups than those in the sucrose and dextrin groups. FAS activity for fish fed the potato starch was higher than those from other groups (Fig. 2(A)).
Effect of dietary carbohydrate sources on lipid metabolism in the liver tissues of yellow catfish. (A) Activities of lipogenic enzymes; (B) mRNA expression of genes. Values are means with their standard errors, n 3 replicates of six fish. a,b,c,d Unlike letters indicate significant differences among the five groups (P < 0·05). acc, Acetyl-CoA carboxylase; cpt 1, carnitine palmitoyltransferase 1; FAS, fatty acid synthase; G6PD, glucose 6-phosphate dehydrogenase; ICDH, isocitrate dehydrogenase; ME, malic enzyme; 6PGD, 6-phosphogluconate dehydrogenase. (A, B) ![]() , Glucose;
, Glucose; ![]() , maize starch;
, maize starch; ![]() , sucrose;
, sucrose; ![]() , potato starch;
, potato starch; ![]() , dextrin.
, dextrin.

The fas mRNA abundances were the highest for yellow catfish fed glucose and dextrin and lowest for fish fed the maize starch. The mRNA expression of pparγ was the highest for yellow catfish fed the sucrose and maize starch and the lowest for yellow catfish fed glucose and potato starch. Among three lipolytic genes (accb, cpt1 and pparα), accb mRNA abundances were the highest for yellow catfish fed the dextrin and lowest for yellow catfish fed glucose and maize starch (Fig. 2(B)). Cpt1 mRNA levels were higher in fish fed dextrin than those for fish fed glucose, maize starch and potato starch. Pparα mRNA levels were the highest for yellow catfish fed the dextrin and lowest for yellow catfish fed the glucose.
Dietary carbohydrate sources significantly influenced the mRNA abundances of SUMOylation-related genes (Fig. 3). Among five dietary carbohydrate sources, mRNA expression of sumo2 and sumo3 was relatively lower for yellow catfish fed the glucose than other four dietary carbohydrate sources. Sumo1 mRNA expression was lower in yellow catfish fed the glucose and maize starch than those fed potato starch and dextrin. mRNA levels of SUMO-activating enzyme subunit 2 (uba2), protein inhibitor of activated STAT1 (pias1), senp2 and senp3 were lower for yellow catfish fed the glucose than those for yellow catfish fed the dextrin. ubc9 mRNA levels were higher for fish fed potato starch and dextrin than those for fish fed glucose, maize starch and sucrose. sae1 and senp1 mRNA expression showed no significant differences among five treatments.
Effect of dietary carbohydrate sources on mRNA expression of SUMOylation-related genes in the liver tissues of yellow catfish. Values are means with their standard errors, n 3 replicates of six fish. a,b,c Unlike letters indicate significant differences among the five groups (P < 0·05). pias1, Protein inhibitor of activated STAT1; sae1, SUMO-activating enzyme subunit 1; senp, sentrin-specific protease; sumo, small ubiquitin-related modifier; uba2, SUMO-activating enzyme subunit 2; ubc9, ubiquitin-conjugating enzyme 9. ![]() , Glucose;
, Glucose; ![]() , maize starch;
, maize starch; ![]() , sucrose;
, sucrose; ![]() , potato starch;
, potato starch; ![]() , dextrin.
, dextrin.

Transcriptomic analysis of the liver of yellow catfish fed the diets containing glucose and maize starch
Since hepatic TAG content possessed significant differences in fish fed the glucose and maize starch, we performed RNA-seq to examine the molecular mechanisms of TAG changes in fish fed the two carbohydrate sources. The RNA-seq data were uploaded to the Sequence Read Archive and could be accessed on https://www.ncbi.nlm.nih.gov/sra/PRJNA624795 (accession number: PRJNA624795). Three hundred sixteen unigenes were identified as the differentially expressed genes, including 178 up- and 138 down-regulated genes (online Supplementary Fig. S1). The GO (online Supplementary Fig. S2) and Kyoto Encyclopedia of Genes and Genomes (online Supplementary Fig. S3) database were utilised to perform the pathway analysis. We validated our RNA-seq data by our quantitative PCR, which indicated that RNA-seq data were reliable (online Supplementary Tables S2 and S3 and Fig. S4). All these results indicated that, compared with dietary maize starch, dietary glucose impacted the hepatic physiological function. The Kyoto Encyclopedia of Genes and Genomes found that dietary glucose significantly up-regulated the expression of genes related to lipogenesis (scd1, elovl6), down-regulated the expression of gene related to fatty acid transport (lpl) and adipocytokine signalling pathway (socs3); dietary glucose significantly influenced the expression of genes related to citrate cycle (up-regulated: suclg2; down-regulated: mdh1) (online Supplementary Fig. S5). These results confirmed that dietary glucose activated lipogenesis and promoted the TAG accumulation.
Expt 2: in vitro study
Cell viability and TAG content
Glucose incubation did not adversely affect cell viability (Fig. 4(A)). TAG content in 30 mm glucose group was significantly higher than those in the control and 15 mm glucose (Fig. 4(B)).
Effects of 48-h glucose incubation on cell viability and TAG content in primary hepatocytes from yellow catfish. (A) Cell viability, (B) TAG content. Values are means with their standard errors, n 3 (replicates of three biological experiments). a,b Unlike letters indicate significant differences among the three groups (P < 0·05). (A, B) ![]() , Control;
, Control; ![]() , 15 mm;
, 15 mm; ![]() , 30 mm.
, 30 mm.

Enzyme activities and gene expression
Activities of lipogenic enzymes (G6PD, 6PGD and ME) increased with increasing glucose concentration (Fig. 5(A)). ICDH activity was higher in 30 mm glucose than those in the control and 15 mm glucose. FAS activity showed no marked difference among the three groups.
Effects of 48-h glucose incubation on enzymatic activities and gene expression in primary hepatocytes from yellow catfish. (A) Enzymatic activities, (B) gene expression. G6PD, glucose 6-phosphate dehydrogenase; 6PGD, 6-phosphogluconate dehydrogenase; ICDH, isocitrate dehydrogenase; ME, malic enzyme; FAS, fatty acid synthase; chrebp, carbohydrate-responsive element binding protein; lxr, liver X receptor; srebp1, sterol regulatory elements binding protein 1; accα, acetyl-CoA carboxylase α; scd1, stearoyl-CoA desaturase 1; lpl, lipoprotein lipase. Values are means with their standard errors, n 3 (replicates of three biological experiments). a,b,c Unlike letters indicate significant differences among the three groups (P < 0·05). (A, B) ![]() , Control;
, Control; ![]() , 15 mm;
, 15 mm; ![]() , 30 mm.
, 30 mm.

The mRNA levels of chrebp, srebp1 and fas were higher for 15 mm glucose than those of other two groups (Fig. 5(B)). The mRNA levels of pparγ, lxrα and accα were significantly higher in 15 and 30 mm glucose than those in the control. The mRNA levels of scd1 and lpl showed no obvious discrepancies among the three groups.
Protein expression of liver X receptor α, sterol regulatory elements binding protein 1 and stearoyl-CoA desaturase 1
The SREBP1 protein expression was the highest for 30 mm glucose and showed no significant differences between other two groups (Fig. 6). The protein levels of SCD1 increased with glucose concentration. The protein levels of LXRα showed no significant differences among three groups.
Effects of 48-h glucose incubation on protein levels of liver X receptor α (LXRα), sterol regulatory elements binding protein 1 (SREBP1) and stearoyl-CoA desaturase 1 (SCD1) in primary hepatocytes from yellow catfish. (A) Western blot analysis of LXRα, SREBP1 and SCD1 expression. GAPDH, glyceraldehyde-3-phosphate dehydrogenase. (B) Protein levels of LXRα, SREBP1 and SCD1. Values are means with their standard errors, n 3 (replicates of three biological experiments). a,b Unlike letters indicate significant differences among the three groups (P < 0·05). (B) ![]() , Control;
, Control; ![]() , 15 mm;
, 15 mm; ![]() , 30 mm.
, 30 mm.

Small ubiquitin-related modifier 1 modification and the SUMOylation sites of sterol regulatory elements binding protein 1
Studies indicated that the transcription factors that were conjugated with SUMO proteins often inhibited transcription(Reference Gill27). Thus, we analysed whether the potential SUMO-targeted lysines in SREBP1 could be SUMOylated. At first, to test whether SREBP1 was a target for SUMOylation modification, we analysed whether SREBP1 could be modified by SUMO1. SREBP1 and SUMO1 coexpression produced a shifted band whose size corresponded to the estimated size of SUMOylated SREBP1, and immunoblotting analysis of the immunoprecipitated complex with SREBP1 (anti-Flag) against SUMO1 (anti-6 × His) confirmed the SUMOylated SREBP1 (Fig. 7(A)), indicating that SREBP1 was a target for SUMOylation. Then, SUMOplot 2.0 software was used to analyse the putative SUMOylation site(s) of SREBP1 protein sequence, and five potential SUMOylation sites were mapped at Lys145, Lys254, Lys264, Lys392 and Lys419 in yellow catfish SREBP1 (Fig. 7(B)). The Clustal-W multiple alignment algorithm indicated that four potential SUMOylation sites (K254, K264, K392 and K419) were conserved (online Supplementary Fig. S6). Domains were analysed by online CDD tool at NCBI (http://www.ncbi.nlm.nih.gov/Structure/cdd/wrpsb.cgi) and the SMART programme (http://smart.embl-heidelberg.de/). The P. fulvidraco SREBP1 consisted of three domains, such as mSin3A-associated proteins 130 C-terminus (SAP130-C), PUFA synthase PfaA (n-3 PfaA) domain and basic Helix-Loop-Helix-zipper domain (bHLH-zip), and these domains included four potential SUMOylation sites, such as K145, K254, K264 and K392 (online Supplementary Fig. S7).
Small ubiquitin-related modifier 1 (SUMO1) modification and the SUMOylation sites of sterol regulatory elements binding protein 1 (SREBP1). (A) Schematic representation of wild-type (WT) SREBP1 protein and the indicated mutant proteins. AA, amino acid; (B) HeLa cells were transfected with SREBP1-Flag, SUMO1-6 × His and Ubc9-6 × His. Immunoprecipitation (IP) of SREBP1-Flag was probed for SUMOylation using an anti-Flag antibody. The levels of SREBP1 protein in total cell lysates are also shown; (C) HeLa cells were transfected with SUMO1/Ubc9-6 × His and either WT SREBP1-Flag or the K145R, K254R, K264R, K392R or K419R mutant of SREBP1-Flag. Immunoprecipitation of SREBP1-Flag was probed for SUMOylation using an anti-SREBP1 antibody. (D) SUMOylation levels of WT SREBP1-Flag or the K145R, K254R, K264R, K392R or K419R mutant of SREBP1-Flag. Values are means with their standard errors, n 3 (replicates of three biological experiments). * Differences are significant between the two groups (P < 0·05).

Each of these five lysine residues of SUMOylation sites of SREBP1 was then replaced by arginine, and they were analysed for SUMOylation modification. The mutation at K254R and K264R alleviated the SUMO1 modification of SREBP1, whereas the K145R, K392R and K419R SREBP1 mutants still exhibited SUMO conjugates similar to those in wild-type SREBP1 (Fig. 7(C)). According to the greyscale value, we confirmed that the SUMOylation site of SREBP1 was Lys264 (Fig. 7(D)).
Glucose mediated the SUMOylation of sterol regulatory elements binding protein 1
Immunoblotting analysis of the immunoprecipitated complex with SREBP1 against SUMO1 found that 30 mm glucose reduced the SUMOylation levels of SREBP1 (Fig. 8(A) and (B)). In contrast, 30 mm glucose incubation increased the protein levels of SREBP1 (Fig. 8(C) and (D)).
Forty-eight-hour glucose incubation changed the SUMOylation levels of sterol regulatory elements binding protein 1 (SREBP1) and influenced the protein expression of SREBP1 in primary hepatocytes from yellow catfish. (A) Immunoprecipitation of SREBP1 was probed for SUMOylation using an anti-SREBP1 antibody. (B) SUMOylation levels of SREBP1. (C) Levels of SREBP1 protein in total cell lysates are also shown. GAPDH, glyceraldehyde-3-phosphate dehydrogenase. (D) Protein expression of SREBP1. Values are means with their standard errors, n 3 (replicates of three biological experiments). * Differences are significant between the two groups (P < 0·05). (B, D) ![]() , Control;
, Control; ![]() , 30 mm.
, 30 mm.

Discussion
A perfect understanding of the regulatory mechanism of lipid metabolism will be essential in both physiology and physiopathology of vertebrates(Reference Postic, Dentin and Denechaud7). In the present study, we found that dietary glucose increased lipid deposition by up-regulating fatty acid biosynthesis and lipogenesis, and down-regulating lipolysis in the livers. Similarly, Morral et al. (Reference Morral, Edenberg and Witting4) found that glucose disposal activated the transcription of key genes in lipogenic pathways, accompanied by down-regulation of many genes involved in fatty acid oxidation. Here, high-throughput sequencing of liver tissues from dietary glucose and dietary maize starch further confirmed these. Accordingly, the enhanced lipogenesis and inhibited lipolysis increased hepatic TAG accumulation yellow catfish.
To decipher the mechanism for dietary glucose inducing lipid accumulation in yellow catfish, several key transcriptional factors were analysed. ChREBP, SREBP1, PPARγ and LXRα are key transcriptional factors and they transcriptionally regulate many key enzymes (such as ACC, FAS and SCD1) of de novo fatty acid and TAG synthesis(Reference Postic, Dentin and Denechaud7,Reference Joseph, Laffitte and Patel28–Reference Yao, Luo and He30) . We found that glucose incubation up-regulated the mRNA levels of chrebp, srebp1, pparγ and lxrα, similar to many other studies(Reference Kawaguchi, Takenoshita and Kabashima31–Reference Hasty, Shimano and Yahagi34). In the present study, glucose-induced up-regulation of mRNA expression of these transcriptional factors was paralleled by an increase in gene transcription of these enzymes, indicating that the activation of these transcriptional factors induced the expression of lipogenic genes, in agreement with several reports(Reference Foretz, Pacot and Dugail5,Reference Sandberg, Fridriksson and Madsen32,Reference Mitro, Mak and Vargas35) . We also found that dietary glucose addition tended to reduce mRNA expression of three SUMO proteins (sumo1, sumo2 and sumo3); mRNA levels of uba2 and pias1 were lower for yellow catfish fed the glucose than those fed the dextrin, and ubc9 mRNA levels were lower for yellow catfish fed the glucose than those fed potato starch. SUMO1, SUMO2 and SUMO3 are SUMO proteins, and they can be linked to target proteins mediated by several enzymes, including SUMO activating enzymes (E1), conjugating enzyme (E2, UBC9) and ligases (E3)(Reference Johnson, Schwienhorst and Dohmen12,Reference Desterro, Rodriguez and Hay13,Reference Hay15) . PIAS were initially considered to be inhibitors of the STAT family of transcription factors(Reference Liu, Liao and Rao36) and possessed the activity of SUMO E3 ligase(Reference Hochstrasser37). Here, glucose-induced down-regulation of these genes meant that dietary glucose tended to reduce mRNA expression of genes associated with SUMO modification. SUMO1 and SUMO2/3 act as cellular stress proteins in response to high glucose, and they mediates various translational modifications of many signalling proteins. Through the SUMOylation suppression, we speculate that high glucose influenced many signalling pathways. Similarly, Zhang et al. (Reference Zhang, Gan and Huang38) reported that the mRNA expression of hepatic PIAS1 and PIAS3 was inversely linked with those of lipogenic genes in mouse models with diet-induced obesity. Our recent study indicated that dietary carbohydrate levels affected their mRNA expression in a dose-dependent manner(Reference Yang, Tan and Zhang23). In contrast, Huang et al. (Reference Huang, Xu and Zhou39) pointed out that high glucose up-regulated the expression of SUMO1 and SUMO2/3. We did not know the reason for these differences. However, the carbohydrate-induced variations of their expression will influence lipid metabolism, as suggested by other studies(Reference Lee, Jang and Lee26,Reference Zhang, Gan and Huang38,Reference Huang, Xu and Zhou39) .
On the other hand, SENP desumoylase family catalyses the de-conjugation of SUMO from their substrate. Our study indicated that senp2 and senp3 mRNA levels were lower for yellow catfish fed the glucose than those fed the dextrin. In contrast, Jung et al. (Reference Jung, Kang and Park40) found that the expression of Senp2, but not Senp1, was triggered by chronic high-glucose stimulation in insulin-producing cells. Moreover, Jung et al. (Reference Jung, Kang and Park40) pointed out that the induction of different SENP needed different stimulations according to cell types. In response to glucose, the expression of SENP2 was predominant in the cytoplasm than in the nucleus(Reference Jung, Kang and Park40). Obviously, the physiological importance of the senp in SUMOylation needs to be clarified, and further studies were needed to elucidate the molecular mechanism of the senp transcriptional repression by glucose.
SREBP1 is a key transcription factor which regulates lipogenesis. Studies have shown that the SUMOylation modification of transcription factors often inhibits transcription(Reference Gill27). In this work, P. fulvidraco SREBP1 possessed three distinct domains, including the SAP130-C domain, the n-3 PfaA domain and the bHLH-zip domain. The SAP130-C domain interacts with the mSin3A-histone deacetylase complex and appears to function with acetylation(Reference Fleischer, Yun and Ayer41). The n-3 PfaA domain reveals to be involved in polyketide-like biosynthetic mechanisms of PUFA biosynthesis(Reference Allen and Bartlett42). The bHLH-zip domain found in SREBP1 and other similar proteins. SREBP1 is a member of bHLH-zip transcription factor family that recognises sterol regulatory element 1 (SRE-1) and acts as a transcriptional activator required for lipid homoeostasis(Reference Parraga, Bellsolell and Ferre-DAmare43). Thus, next, we explored whether the lysine residue in SREBP1 could be SUMOylated. Here, we found that SREBP1 was a target for SUMOylation and that the SUMOylation site of SREBP1 was Lys264. Since Lys264 mapped at the SAP130-C domain of SREBP1, and studies indicated that NAD-dependent deacetylase sirtuin-1 (SIRT1) deacetylates the SREBP1(Reference Ponugoti, Kim and Xiao44). It suggests that sumoylation and acetylation work together to regulate the activity of SREBP1. Thus, further work should be clarified to explore the mechanism of two posttranslational modifications modulating SREBP1 activity. Lee et al. (Reference Lee, Jang and Lee26) found that the SUMO E3 ligase sumoylated SREBP1c at Lys98, suppressing the lipogenic programme in response to fasting. SUMOylation plays versatile functions in transcriptional regulation. It influences the localisation of transcription factors and other post-translational modifications(Reference Desterro, Rodriguez and Hay13,Reference Muller, Matunis and Dejean45–Reference Yang, Heaton and Brevig47) . More studies are needed to investigate the effects of SUMO1 modification on the subnuclear localisation of SREBP1. Studies pointed out that SUMO attachment sites have been shown to be critical functional components of transcriptional inhibitory domains, and transient SUMO attachment may mediate transcriptional repression(Reference Girdwood, Tatham and Hay48). Moreover, our studies found that 30 mm glucose reduced the SUMOylation levels of SREBP1, but increased the protein levels of SREBP1. These results indicated that glucose-mediated SUMOylation of SREBP1 might regulate de novo lipogenesis resulting in TAG accumulation. Similarly, Hirano et al. (Reference Hirano, Murata and Tanaka17) found that residues Lys123 and Lys418 of SREBP1a acted as potential SUMO1 acceptor sites, and SUMO1 can negatively regulate the transactivation function of SREBP. Other studies also indicated that SUMO modification inhibited the transcriptional activities of target nuclear receptors(Reference Gill27,Reference Girdwood, Tatham and Hay48,Reference Sentis, Le Romancer and Bianchin49) . Lee et al. (Reference Lee, Jang and Lee26) found SREBP1c sumoylation might repress hepatic lipogenic pathways. In the present study, since glucose incubation increased SUMO1 expression, it is reasonable to speculate that glucose-induced reduction of SREBP1 SUMOylation was attributable to the up-regulation of SUMO1 expression. Although our studies suggested the regulatory functions of SUMOylation modification in CCAAT/enhancer binding protein (C/EBP) proteins, the underlying mechanism is not yet clear. Further definition of the relevant mechanism will provide insights into the roles of SUMOylation in regulating SREBP1 function.
Conclusion
In summary, our data elucidated the molecular mechanism of dietary glucose increasing lipid deposition and up-regulating lipogenesis. The present study is the first one to elucidate the SUMO1 modification of SREBP1 and SREBP1 SUMOylation at Lys264. High glucose incubation decreased the SUMOylation level of SREBP1 and enhanced the SREBP1 expression in primary hepatocytes, indicating that glucose-mediated SUMOylation of SREBP1 affected its transcriptional activity and protein expression, which further regulated its target genes involving lipogenesis.
Acknowledgements
This study was supported by the National Natural Science Foundation of China (NSFC, 31572605) and National Key R&D Program of China (2018YFD0900400).
X.-Y. T. and S.-B. Y. designed the experiment; S.-B. Y. conducted the feeding and analytical experiment with the skillful help of T. Z., L.-X. W. and Y.-C. X.; S.-B. Y. analysed the data and X.-Y. T. provided some critical suggestions for the analysis of the data; S.-B. Y. drafted the manuscript and X.-Y. T. revised the manuscript; all of the authors read and approved the manuscript.
No conflict of interest is declared.
Supplementary material
For supplementary materials referred to in this article, please visit https://doi.org/10.1017/S0007114520002408