

Introduction
One of the outstanding questions in biology remains: How do patterns in species diversity arise and persist over space and time? Explanations for diversity gradients have frequently emphasized regional or temporal differences in diversification rates (e.g., Jablonski et al. Reference Jablonski, Roy and Valentine2006; Weir and Schluter Reference Weir and Schluter2007; Mittelbach et al. Reference Mittelbach, Schemske, Cornell, Allen, Brown, Bush, Harrison, Hurlbert, Knowlton, Lessios, McCain, McCune, McDade, McPeek, Near, Price, Ricklefs, Roy, Sax, Schluter, Sobel and Turelli2007; Rolland et al. Reference Rolland, Condamine, Jiguet and Morlon2014). One hypothesized mechanism for long-term variation in speciation and extinction rates is the influence of tectonic activity and broadscale landscape changes on species’ geographic ranges and diversification dynamics (Cracraft Reference Cracraft1985; Badgley Reference Badgley2010; Hoorn et al. Reference Hoorn, Wesselingh, ter Steege, Bermudez, Mora, Sevink, Sanmartin, Sanchez-Meseguer, Anderson, Figueiredo, Jaramillo, Riff, Negri, Hooghiemstra, Lundberg, Stadler, Sarkinen and Antonelli2010; Moen and Morlon Reference Moen and Morlon2014; Badgley et al. Reference Badgley, Smiley, Terry, Davis, DeSantis, Fox, Hopkins, Jezkova, Matocq, Matzke, McGuire, Mulch, Riddle, Roth, Samuels, Strömberg and Yanites2017). The generation of topographic complexity and geographic barriers during tectonic activity reduces habitat continuity while increasing environmental heterogeneity along elevational gradients (e.g., Mulch Reference Mulch2016). These landscape changes can isolate populations, thereby promoting population divergence, allopatric speciation, and high species turnover at the regional scale (e.g., Coblentz and Riitters Reference Coblentz and Riitters2004; Renema et al. Reference Renema, Bellwood, Braga and Bromfield2008; Moen and Morlon Reference Moen and Morlon2014). The present-day biogeographic pattern resulting from these evolutionary, ecological, and historical processes has been termed the topographic diversity gradient, or TDG (Badgley et al. Reference Badgley, Smiley, Terry, Davis, DeSantis, Fox, Hopkins, Jezkova, Matocq, Matzke, McGuire, Mulch, Riddle, Roth, Samuels, Strömberg and Yanites2017). Examples of the TDG in birds, plants, and mammals have been found on all continents where gradients in modern species richness strongly align with gradients in topographic complexity at the regional scale, resulting in elevated species richness in high-relief and often tectonically active regions (Badgley and Fox Reference Badgley and Fox2000; Barthlott et al. Reference Barthlott, Mutke, Rafiqpoor, Kier and Kreft2005; Ruggiero and Hawkins Reference Ruggiero and Hawkins2008; Badgley Reference Badgley2010).
Approaches for investigating macroevolutionary processes governing diversity patterns such as the TDG have traditionally relied on inference from the fossil record, using occurrence data to quantify speciation and extinction over time and space (e.g., Stanley Reference Stanley1979; Sepkoski et al. Reference Sepkoski, Bambach, Raup and Valentine1981; Foote Reference Foote2000; Alroy Reference Alroy2009). In recent years, phylogenetically based methods have been developed that use relationships among extant taxa to reconstruct the tempo and mode of diversification through time (e.g., Ricklefs Reference Ricklefs2007; Stadler Reference Stadler2011; Rabosky Reference Rabosky2014). These approaches have also been employed to quantify regional differences in diversification rates and explain broadscale diversity gradients (e.g., Weir and Schluter Reference Weir and Schluter2007; Rolland et al. Reference Rolland, Condamine, Jiguet and Morlon2014). Both phylogenetic and fossil occurrence–based approaches have their strengths and limitations, and a growing number of studies demonstrate the advantages of integrating molecular and fossil data into diversification analyses (Purvis et al. Reference Purvis, Orme, Toomey and Pearson2009; Liow et al. Reference Liow, Quental and Marshall2010; Quental and Marshall Reference Quental and Marshall2010; Fritz et al. Reference Fritz, Schnitzler, Eronen, Hof, Böhning-Gaese and Graham2013). Although methods for estimating diversification rates based on either phylogenies of extant taxa or the fossil record rely on model assumptions, an advantage of the fossil record is that knowledge of past diversity allows rates to be estimated directly rather than inferred from tree topology (Foote Reference Foote2000; Rabosky Reference Rabosky2009). However, preservation and sampling can dampen, accentuate, or even erase patterns in the fossil record (Raup Reference Raup1979; Foote and Raup Reference Foote and Raup1996; Smith et al. Reference Smith, Lloyd and McGowan2012). In response to these effects, methods have been developed that subsample or standardize fossil data sets (e.g., rarefaction, shareholder quorum subsampling) or infer sampling probabilities (e.g., Alroy Reference Alroy2014; Liow and Finarelli Reference Liow and Finarelli2014) to assess the robustness of observed patterns to sampling processes (Raup Reference Raup1975; Alroy et al. Reference Alroy, Marshall, Bambach, Bezusko, Foote, Fursich, Hansen, Holland, Ivany, Jablonski, Jacobs, Jones, Kosnik, Lidgard, Low, Miller, Novack-Gottshall, Olszewski, Patzkowsky, Raup, Roy, Sepkoski, Sommers, Wagner and Webber2001; Alroy Reference Alroy2010).
Various diversification analyses and subsampling techniques have been applied to the North American fossil record to evaluate the history of the strong TDG found in mammals (Barnosky and Carrasco Reference Barnosky and Carrasco2002; Kohn and Fremd Reference Kohn and Fremd2008; Finarelli and Badgley Reference Finarelli and Badgley2010; Badgley and Finarelli Reference Badgley and Finarelli2013). Today, mammals are twice as diverse within the topographically complex western region compared with the low-relief Great Plains (Badgley and Fox Reference Badgley and Fox2000; Badgley Reference Badgley2010). Multiple lines of evidence suggest that the evolution of extant rodent clades was closely linked with the Neogene history of tectonic activity in western geological provinces (e.g., Riddle Reference Riddle1996; Hafner et al. Reference Hafner, Light, Hafner, Hafner, Reddington, Rogers and Riddle2007; Riddle et al. Reference Riddle, Jezkova, Hornsby and Matocq2014). In particular, landscape relief increased significantly during tectonic extension and the development of the Basin and Range Province over the last 30 Myr (Horton and Chamberlain Reference Horton and Chamberlain2006; McQuarrie and Wernicke Reference McQuarrie and Wernicke2005; Dickinson Reference Dickinson2006). The most intense interval of landscape change occurred during the middle Miocene from ~18 to 14 Ma in response to the subduction of the spreading margin between the Farallon and Pacific tectonic plates (Atwater and Stock Reference Atwater and Stock1998; Sonder and Jones Reference Sonder and Jones1999).
Diversification analyses of the mammalian fossil record show a consistent pattern: diversity was higher in the tectonically active region than in the quiescent region during this interval of intense extension and increased landscape relief (Barnosky and Carrasco Reference Barnosky and Carrasco2002; Kohn and Fremd Reference Kohn and Fremd2008; Finarelli and Badgley Reference Finarelli and Badgley2010). Additionally, the TDG was not persistent through time and may have emerged when interactions between topographic complexity and climate warming (i.e., the middle Miocene Climatic Optimum; Zachos et al. Reference Zachos, Dickens and Zeebe2008) facilitated elevated species richness. The middle Miocene peak in mammal diversity occurred across taxonomic groups, but in particular among rodents (Fig. 1; Badgley and Finarelli Reference Badgley and Finarelli2013; Badgley et al. Reference Badgley, Smiley and Finarelli2014). The rodent fossil record is notable for its excellent geographic coverage, and analysis of diversification rates for the tectonically active west compared with the quiescent Great Plains has revealed significantly elevated rates of rodent diversification in the active region during this time interval as well (Finarelli and Badgley Reference Finarelli and Badgley2010; Badgley and Finarelli Reference Badgley and Finarelli2013). However, large gaps in this record do exist, especially within the Basin and Range Province prior to ~18 Ma (Barnosky et al. Reference Barnosky, Bibi, Hopkins and Nichols2007; Badgley et al. Reference Badgley, Smiley and Loughney2015).
Rodent species diversity through time for 1 Myr time bins for the active region (west of the Rocky Mountain Front Range) in transparent gray and for the quiescent region (Great Plains and east) outlined in black. Peak mammal diversity for the active region coincided with intense tectonic extension and global warming during the middle Miocene. The quiescent region did not show a corresponding peak during that interval. Both records were dynamic through time, and the TDG was only intermittently present. Species diversity was calculated assuming that species ranged through first and last occurrences within a region and using the methods of Finarelli and Badgley (Reference Finarelli and Badgley2010). Fossil-occurrence data were obtained from the MIOMAP database for North American fossil mammals (Carrasco et al. Reference Carrasco, Barnosky, Kraatz and Davis2007).

Given the concurrent, dynamic histories of tectonic activity, mammal diversification, and fossil preservation, the aim of this study was to use simulations of the fossil record to evaluate the reciprocal impacts of variability across these records. To do so, I first assessed the origination rates of fossil rodents in the Basin and Range Province using standard rate calculations (per capita, three-timer, and capture–mark–recapture [CMR]). I then developed theoretically plausible diversification models for the origin of the TDG in relation to tectonic history, simulated five fossilization scenarios based on those models, and used these same three methods to quantify diversification dynamics. Finally, I examined to what degree different and variable preservation scenarios limit our ability to correctly infer underlying dynamics.
Diversification and Preservation Models
Within the context of tectonic activity and development of topographic complexity, four plausible diversification hypotheses for the origin and maintenance of high diversity within the tectonically active region are as follows (Fig. 2A). The first model is akin to a mountains-as-cradle model, in which time-invariant but elevated speciation rates generate high species richness in the region of tectonic activity. This constant model also represents a scenario in which variation in diversification rates derived from the fossil record arises only from stochastic processes or changes in preservation probability through time. In contrast, two alternative models incorporate variation in speciation rates through time. The tectonic-pulse model has two shifts in speciation rate over the history of the record, an instantaneous increase that coincides with the onset of intensified tectonic extension (18 Ma) and an instantaneous decrease at the end of this interval (14 Ma). The tectonic-constraint model is a more complex version of the tectonic-pulse model and assumes five different rate regimes. In this model, speciation rate through time is determined as a function of the area gained over 6 Myr time intervals during tectonic extension in the southern Basin and Range Province (McQuarrie and Wernicke Reference McQuarrie and Wernicke2005). A 50–200% increase in land area in different regions of western North America resulted from the rotation and displacement of fault-bounded blocks during Neogene extension and increased large-scale basin-and-range relief as the landscape broadened (e.g., Snow and Wernicke Reference Snow and Wernicke2000; Horton and Chamberlain Reference Horton and Chamberlain2006). Quantifying relief remains a difficult problem in the geologic past (Clark Reference Clark2007; Mulch Reference Mulch2016); therefore, I used area gained as a proxy for change in topographic complexity over the Neogene. For example, the interval of greatest block faulting was also the interval that experienced the largest increase in land area (McQuarrie and Wernicke Reference McQuarrie and Wernicke2005). Because speciation rates are higher than extinction rates in each of these scenarios, species richness increases through time in an exponential or episodic manner.
A, Theoretically plausible diversification models for generating the TDG. The constant model refers to time-invariant but elevated speciation rate, λ, through the Neogene. The tectonic-pulse model simulates a single interval of elevated speciation rates in relation to intense block-faulting and tectonic activity in the Basin and Range Province from 18 to 14 Ma, while the tectonic-constraint model uses area change over 6 Myr intervals in the Basin and Range Province to derive a variable speciation rate curve through time. Each of these three models results in exponentially increasing diversity patterns through time. In contrast, the diversity-dependent model experiences logistic growth through time, and speciation and extinction rates are equal once the species carrying capacity is reached. Diversification analyses were carrying out during this equilibrium phase, in which species richness does not change (unless due to preservation). B, Each diversification model was preserved as a fossil record under six scenarios of varying completeness. Complete preservation (R100%, not shown), constant, low preservation probability (R30%), increasing preservation probability (IncR), and pulsed preservation probability related to tectonically driven basin development (PulseR) are hypothetical preservation scenarios. FreqR refers to preservation probability derived from fossil rodent occurrences, and StratR refers to preservation probability based on the area of the rock record in the active region extracted from the Macrostrat database (Peters Reference Peters2008).
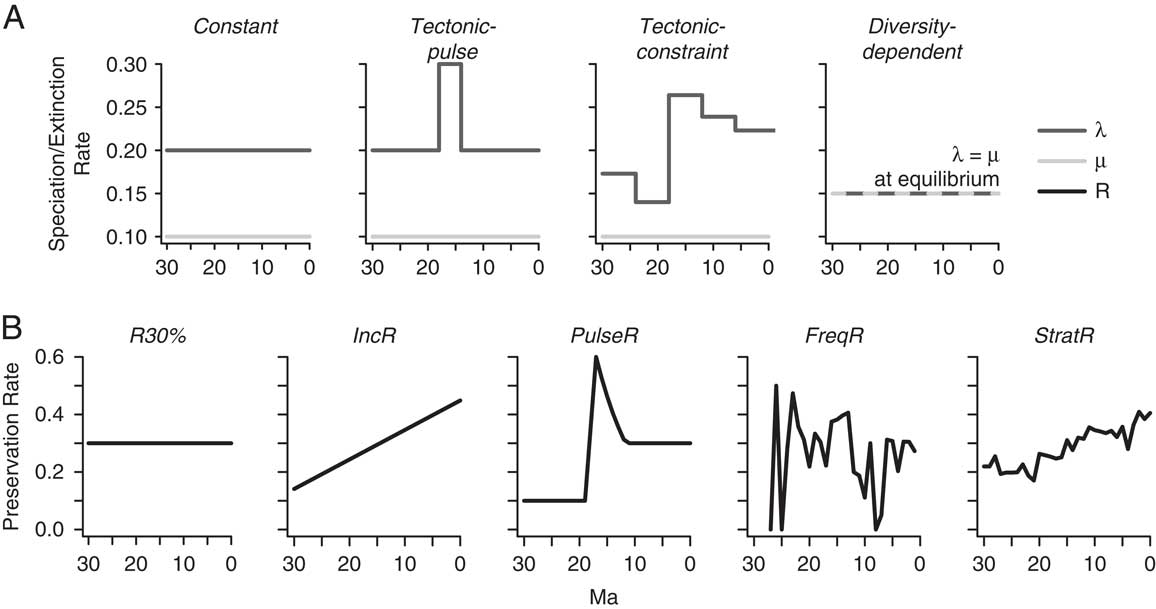
The final model assumes a different history of diversity over the Neogene. In the diversity-dependent model, the speciation rate initially exceeds the extinction rate, and then changes linearly as a function of the number of species. While extinction rate remains constant through time, the speciation rate slows down until an equilibrium number of species is maintained, and the speciation rate remains constant and equal to the extinction rate. In this diversification scenario, I focus on the diversification dynamics after species equilibrium has been reached, as the ability of the fossil record to capture the initial diversity-dependent slowdown in speciation rates has already been evaluated elsewhere (Liow et al. Reference Liow, Quental and Marshall2010). Although I do not specify the underlying mechanism for diversity-dependent diversification, this model could generate the TDG if the species carrying capacity in mountainous regions exceeded that of nearby low-relief regions, and if diversification declined over time. Diversification rates may decrease due to filling up of ecological space or less opportunity for allopatric speciation over time in relation to increasingly finer subdivision of the available land area during tectonic activity (Moen and Morlon Reference Moen and Morlon2014).
In contrast to varying speciation rates, extinction rate is held constant in each of the four models. This simplifying assumption enables the direct assessment of how variable preservation impacts our ability to identify changes in speciation rates, without the influence of simultaneous changes in extinction rates. However, it should be noted that tectonically driven landscape changes likely also influenced extinction rates. Therefore, these four scenarios are not the only possible models for generating the TDG, and a fuller suite of models and parameter settings that includes variation in extinction rates could be tested in the future.
Preservation and sampling can affect estimates of diversity for reasons ranging from a heterogeneous rock record through time to nonuniform sampling effort by researchers (Raup Reference Raup1975; Foote and Raup Reference Foote and Raup1996; Peters and Heim Reference Peters and Heim2010; Smith et al. Reference Smith, Lloyd and McGowan2012). For the Neogene mammal record, an unconformity in the rock record over most of western North America represents a significant gap in our knowledge from ~23 to 18 Ma (e.g., Barnosky et al. Reference Barnosky, Bibi, Hopkins and Nichols2007; Badgley et al. Reference Badgley, Smiley and Finarelli2014). For these reasons, I evaluate the fidelity of the simulated diversification records under different preservation scenarios that are either predetermined or empirically derived from the fossil and rock records (Fig. 2B). Preservation can distort estimates of diversity and diversification rates, and even diversification metrics that are robust to several different sampling biases remain sensitive to variable preservation rates through time (Alroy Reference Alroy1996; Foote Reference Foote2000; Peters and Foote Reference Peters and Foote2001). Comparing fossil records simulated with alternative preservation scenarios, I assess how well the observed variation in speciation and extinction rates reproduces the true underlying diversification dynamics and how much variation should be attributed to differences in preservation probability (e.g., Liow et al. Reference Liow, Quental and Marshall2010). I evaluate diversification rates using three different metrics—per capita rates (Foote Reference Foote2000), three-timer rates (Alroy Reference Alroy2008), and CMR rates (Nichols and Pollock Reference Nichols and Pollock1983; Connolly and Miller Reference Connolly and Miller2001; Liow and Finarelli Reference Liow and Finarelli2014)—each of which accounts for preservation in different ways. While it is not the goal of this paper to reproduce the TDG over time—to do so would require extensive consideration of variation in speciation, extinction, immigration, and preservation rates through time and across space—I aim to demonstrate how variation in one parameter, speciation, could contribute to this distinctive pattern in the fossil record and how inferred records of origination rates may be influenced by variation in fossil preservation.
Methods
Evaluating Diversification Rates from the Fossil Record
I compiled species-occurrence records from the MIOMAP database of North American fossil mammals (Carrasco et al. Reference Carrasco, Barnosky, Kraatz and Davis2007; accessed July 2017) to calculate standing diversity in the tectonically active versus quiescent regions for 1 Myr intervals from 35 to 5 Ma (Fig. 1). I then applied three approaches to calculating diversification rates for fossil occurrences found within the tectonically active Basin and Range Province (Fig. 3).
Origination dynamics from the fossil record of rodents in the Basin and Range Province from 35 to 5 Ma. The light gray bar indicates the timing of intense tectonic extension and land area gain in the province from 18 to 14 Ma (e.g., McQuarrie and Wernicke Reference McQuarrie and Wernicke2005). A, Per capita rates (Foote Reference Foote2000), with 95% confidence intervals in dark gray, assuming taxa range through first and last occurrence data. B, Per capita rates using three age assumptions due to uncertainty in fossil locality age data: the age of fossil occurrences are equivalent to the maximum (Max; solid black line) or minimum (Min; dashed black line) age of the fossil locality or a randomly selected age (Rand; gray solid line) within the locality age range. C, Three-timer rates (Alroy Reference Alroy2008), and D, CMR rates (e.g., Connolly and Miller Reference Connolly and Miller2001; Liow and Finarelli Reference Liow and Finarelli2014), using the same three age assumptions as in B. The 95% confidence intervals for each minimum, maximum, and random age assumption are shown in Supplementary Figs. 1–3. These estimates are based on fossil occurrence and locality data from the MIOMAP database for North American fossil mammals (Carrasco et al. Reference Carrasco, Barnosky, Kraatz and Davis2007).

First, I calculated the instantaneous per capita origination ( $\hat{p}$
) and extinction (
$\hat{p}$
) and extinction ( $\hat{q}$
) rates according to the following equations (Foote Reference Foote2000):
$\hat{q}$
) rates according to the following equations (Foote Reference Foote2000):
 $$\hat{p}\, {\equals}\, {\rm ln}\left( {{{N_{{\rm t}} } \over {N_{{{\rm bt}}} }}} \right)/{\triangle}t,$$
 $$\hat{q}\, {\equals}\, {\rm ln}\left( {{{N_{{\rm b}} } \over {N_{{{\rm bt}}} }}} \right)/\,{\triangle}t,$$
where N
t is the number of taxa that cross the top of the interval only (i.e., first appearance datum, or FAD), N
b is the number of taxa that cross the bottom of the interval only (i.e., last appearance datum, or LAD), N
bt is the number of taxa that cross both the top and the bottom of the time interval, and the time interval, Δt, is 1 Myr for these analyses. Following previous analyses (e.g., Finarelli and Badgley Reference Finarelli and Badgley2010; Badgley and Finarelli Reference Badgley and Finarelli2013; Badgley et al. Reference Badgley, Smiley and Loughney2015), I used lineage range-through assumptions and excluded taxa that occurred in one time interval only (singleton taxa) from rate calculations. Singleton taxa can represent either poorly sampled faunas or, if concentrated in one temporal bin, a disproportionately well-sampled interval. They can thus generate spurious results that are dominated by variable preservation rather than accurate changes in diversification rates (Foote Reference Foote2000). Diversification rate ( $\hat{d}$
) represents the net change in diversity as extinction rates are subtracted from speciation rates:
$\hat{d}$
) represents the net change in diversity as extinction rates are subtracted from speciation rates:
 $$\widehat{{d{\rm }}}\, {\equals}\, \hat{p}\, {\minus}\, \hat{q},\ \ {\rm or}$$
 $$\widehat{{d{\rm }}}\, {\equals}\, {\rm ln}\left( {{{N_{{\rm t}} } \over {N_{{\rm b}} }}} \right)/\,{\triangle}t$$
In addition, I implemented two rate calculations that explicitly incorporate gaps in the fossil record. The first is the three-timer approach, wherein taxa are not assumed to range through FAD and LAD and internal occurrences or absences are used to inform estimates of diversification rates and sampling (Alroy Reference Alroy2008, Reference Alroy2010). Three-timer origination and extinction rate calculations are based on taxa sampled in two consecutive intervals (two-timers), three consecutive intervals (three-timers), or at the start and end of the interval but not within it (part-timers). Per 1 Myr-bin occurrence data are also used to estimate sampling probability, which is used as a correction factor to achieve more accurate and less volatile rate estimates. Extensive explanation of the three-timer method, including rate equations, can be found in Alroy (Reference Alroy, Bottjer, Foote, Fürsich, Harries, Hendy, Holland, Ivany, Kiessling, Kosnik, Marshall, McGowan, Miller, Olszewski, Patzkowsky, Peters, Willier, Wagner, Bonuso, Borkow, Brenneis, Clapham, Fall, Ferguson, Hanson, Krug, Layou, Leckey, Nürnberg, Powers, Sessa, Simpson, Tomašovych and Visaggi2008, Reference Alroy2010, Reference Alroy2014). This method was developed and has been applied to global data sets of marine invertebrates (Alroy et al. Reference Alroy, Bottjer, Foote, Fürsich, Harries, Hendy, Holland, Ivany, Kiessling, Kosnik, Marshall, McGowan, Miller, Olszewski, Patzkowsky, Peters, Willier, Wagner, Bonuso, Borkow, Brenneis, Clapham, Fall, Ferguson, Hanson, Krug, Layou, Leckey, Nürnberg, Powers, Sessa, Simpson, Tomašovych and Visaggi2008) and carnivorans (Liow and Finarelli Reference Liow and Finarelli2014) to limit edge effects, such as the Signor-Lipps effect (Signor and Lipps Reference Signor and Lipps1982) and the Pull of the Recent (Raup Reference Raup1979).
Finally, I calculated diversification rates using CMR methods, which also use information about the internal occurrences of taxa and have been shown to perform well under incomplete and variable sampling (Connolly and Miller Reference Connolly and Miller2001). Borrowed from the ecological literature to infer per individual probabilities of capture, birth, and death (e.g., Pollock et al. Reference Pollock, Nichols, Brownie and Hines1990), CMR approaches have been adapted to paleontological data sets by substituting “capture history” with fossil “sampling history,” or the time interval in which a taxon was extant (in between FAD and LAD) and sampled (Nichols and Pollock Reference Nichols and Pollock1983; Conroy and Nichols Reference Conroy and Nichols1984). Following the methodology in Liow and Finarelli (Reference Liow and Finarelli2014), I used the Pradel model (Reference Pradel1996) to jointly infer per taxon probabilities of sampling, origination, and extinction per 1 Myr interval from 35 to 5 Ma. The mechanics and assumptions underlying the application of CMR methods to paleontological data sets are further outlined in Connolly and Miller (Reference Connolly and Miller2001, Reference Connolly and Miller2002) and Liow and Nichols (Reference Liow and Nichols2010).
Data input for per capita rate estimates rely only on FAD and LAD, whereas the three-timer and CMR rates require occurrence data for each 1 Myr time bin through a taxon’s duration. Age uncertainty for some Cenozoic fossil localities (and thus fossil occurrences) can often extend across multiple 1 Myr time bins; for example, a locality may be dated to within a North American Land Mammal Age (NALMA) such as the Barstovian, extending from 16.3 to 13.6 Ma. Traditionally, locality age uncertainty has been incorporated into the lineage duration of fossil taxa to calculate per capita rates (e.g., Finarelli and Badgley Reference Finarelli and Badgley2010). In addition to this approach, I calculated three versions of the per capita, three-timer, and CMR origination rates by assigning fossil occurrence ages based on the maximum age estimate, the minimum age estimate, and a randomly drawn age within the age range of the fossil locality. In this way, taxa are not smeared across multiple intervals due to poor temporal resolution and, importantly for the three-timer and CMR analyses, gaps can be retained.
Spatial assignment of fossil localities was done in R (R Core Team 2017) using physiographic data from the USGS and R packages ‘sp’ (Bivand et al. Reference Bivand, Pebesma and Gomez-Rubio2013), ‘rgeos’ (Bivand and Rundel Reference Bivand and Rundel2017), and ‘maptools’ (Bivand and Lewin-Koh Reference Bivand and Lewin-Koh2017). Diversification rates were analyzed in R, following code provided by Liow and Finarelli (Reference Liow and Finarelli2014, Reference Liow and Finarelli2017) and using newly generated functions for the purposes of this study. CMR rate analysis also used the program MARK (Cooch and White Reference Cooch and White2006) and the R package ‘RMark’ (Laake Reference Laake2013).
Determining Model Parameters for Fossil Record Simulations
Three parameters potentially influence the simulated fossil record: speciation rate (λ), extinction rate (μ), and preservation probability (R) through time (Fig. 2A). The range of speciation rates (λ = 0.14–0.30 species/LMA) employed in these simulations is representative of rates yielded by previous fossil and some molecular analyses. For example, Alroy (Reference Alroy2009) found an origination rate of 0.23 species/LMA for North American fossil mammals, while Zelditch et al. (Reference Zelditch, Li, Tran and Swiderski2015) used the BAMM program (Bayesian Analysis of Macroevolutionary Mixtures; Rabosky Reference Rabosky2014) to infer variation in lineage diversification rates centered around ~0.20 species/Myr for Sciuridae (squirrels) from a consensus tree derived from molecular data (Fabre et al. Reference Fabre, Hautier, Dimitrov and Douzery2012). To simplify the diversification modeling process, I assumed a constant extinction rate, μ, equal to 0.1 L/Lmyr (lineage per lineage million years) throughout the simulated record (e.g., Liow et al. Reference Liow, Quental and Marshall2010). These values yielded approximately the same number of species present in the tectonically active region of North America today (n = ~160; Wilson and Reeder Reference Wilson and Reeder2005).
For the constant model, one speciation rate (λ=0.2) was applied. For the tectonic-pulse model, two speciation rates were applied as I increased the speciation rate for a 4 Myr interval corresponding with elevated tectonic activity in the geologic record. For the tectonic-constraint model, variation in speciation rate through time was determined as a function of the area gained over 6 Myr intervals during tectonic extension in the southern Basin and Range Province. To estimate area gained over geologic time, I used the output from the kinematic models of McQuarrie and Wernicke (Reference McQuarrie and Wernicke2005). Specifically, I calculated the area of the tectonic reconstructions (bounded by the geographic distribution of fossil localities) and assessed changes in total area for successive time intervals. Thus, area gained served as a proxy for tectonic activity and the development of topographic complexity and was directly correlated with speciation rates in this simulation. For the diversity-dependent model, the speciation rate was initially similar to that of the constant model, but decreased over time as a function of the number of species in the clade. In this logistic-growth model, speciation and extinction rates varied stochastically around a single value (λ=μ) to yield the equilibrium number of species. The window of analysis was restricted to this equilibrium period of diversification.
I imposed five preservation scenarios (Fig. 2B) to remove species randomly from the simulated fossil record under each diversification model (removal process described in “Simulating Diversification and Preservation Scenarios”). The preservation probability (R) refers to the remaining proportion of occurrences (taxa present and preserved per unit time) and is not dependent on additional factors, such as taxon abundance in the fossil record. Two of the preservation scenarios represent general patterns in the fossil and rock records. In the first scenario, I applied a low, constant preservation probability of 30% throughout the record (R30%). This preservation probability is consistent with previous estimates for Cenozoic mammal species, which range from 25% to 37% (e.g., Foote Reference Foote1997; Foote et al. Reference Foote, Hunter, Janis and Sepkoski1999). In the second scenario, fossil preservation improved linearly from 10% to 50% within progressively younger rocks (Raup Reference Raup1979; Kidwell and Holland Reference Kidwell and Holland2002), resulting in increasing preservation probability through time (IncR). This trend reflects a secular change in the rock record, where older rock formations have potentially undergone increased erosion and/or physical and chemical alternation that increasingly limits the preservation of fossils. This trend need not be a linear increase, and alternative increasing preservation scenarios could be tested. The third preservation scenario was based on the idea that relief, and therefore sediment accumulation and preservation probability, was highest during the interval of intense faulting and extension and declined subsequently (PulseR). Two additional scenarios were derived from gap analysis of fossil-rodent occurrence data (Foote and Raup Reference Foote and Raup1996; Foote Reference Foote2000) and from the number and duration of rock-unit packages in western North America (Peters Reference Peters2008). Gap analysis refers to an approach for estimating variation in preservation probability based on the temporal distribution of fossil occurrences compared with lineage durations, assuming that species range through their first and last occurrences in the fossil record (e.g., Foote and Raup Reference Foote and Raup1996). The ratio of species-level occurrences to tallied diversity per interval in the North American rodent record provided a frequency-based approach to estimating preservation probability (FreqR). It is also possible to derive an independent estimate of preservation potential based on the geographic and temporal distribution of the rock record (e.g., Smith et al. Reference Smith, Lloyd and McGowan2012). For the fifth scenario, I used the Macrostrat database (Version 0.3; accessed April 2016) to assess the maximum possible extent of nonmarine rock units for 1 Myr intervals over the Neogene (StratR). The geospatial analysis was restricted to the tectonically active region only, and the proportional area of rock of a given age was used to estimate preservation probability through the Neogene. This estimate served as a coarse first approximation, however, and more precise filtering of the rock record (e.g., fluvial, fossiliferous sediments) may produce a different preservation curve. I compared results from these five preservation scenarios with a sixth preservation scenario with complete fossil preservation or no loss of fossil occurrences through time (R100%).
Simulating Diversification and Preservation Scenarios
Using a stochastic birth–death process developed by Silvestro et al. (Reference Silvestro, Schnitzler, Liow, Antonelli and Salamin2014b), I simulated 1000 fossil records per diversification model. Each run was initiated with 10 taxa to limit the effect of having too few taxa from which to infer rates early in the clade history, speciation rates could vary through time, and extinction rate was constant in all simulations. The fossil simulator produced a lineage duration for each taxon (i.e., 1 Myr interval of first appearance and last appearance). In these simulations, first appearances were treated as speciation events and not as immigration events; however, in a regional-scale analysis of the fossil record, a first appearance, or origination event, could be interpreted as either without additional biogeographic information. Time was divided into discrete, 1 Myr intervals to match previous analyses of the North American fossil mammal record over the Cenozoic (e.g., Finarelli and Badgley Reference Finarelli and Badgley2010). Simulations were run for 40 Myr, but results of downstream analyses were retained for the middle 30 Myr to avoid significant edge effects (Foote Reference Foote2000) and to correspond temporally with the interval of tectonic extension in western North America (30 Ma to present; McQuarrie and Wernicke Reference McQuarrie and Wernicke2005). The diversity-dependent model was evaluated for longer than 40 Myr to ensure that the model would reach equilibrium (constant diversity through time within each 1 Myr time bin). The initial period of decreasing speciation rates was removed prior to diversification analyses, as were 5 Myr intervals on either end of the analysis window to avoid edge effects and match the methods implemented in the prior three models. In comparison to complete preservation (R100%), I imposed the five different preservation scenarios described earlier (Fig. 2B) on the simulated fossil records. Taxa present within a 1 Myr window were randomly sampled according to the corresponding preservation probability, R, for that interval. In this way, lineage first (FAD) or last (LAD) appearance data or any of the intervening 1 Myr intervals could be lost from the record. Simulated fossil records were generated using a Python script developed by Silvestro et al. (Reference Silvestro, Schnitzler, Liow, Antonelli and Salamin2014b), while preservation scenarios were executed in R (R Core Team 2017). See Supplementary Material for links to the available code for all diversification and preservation simulations and rate calculations.
Evaluating Fidelity of the Fossil Record
For each simulated record, I applied the three approaches described earlier (see “Evaluating Diversification Rates from the Fossil Record”) to calculate origination ( $\hat{p}$
), extinction (
$\hat{p}$
), extinction ( $\hat{q}$
), and diversification (
$\hat{q}$
), and diversification ( $\hat{d}$
) rates in comparison to true speciation (λ) and extinction (μ) values from the underlying diversification model (Fig. 2A). For per capita rate calculations, range-through assumptions were applied (Foote Reference Foote2000); therefore, if an occurrence of a lineage was lost between the FAD and LAD, it was still considered present through sampling gaps and thereby contributed to the diversity count and diversification rate analysis of those intervening intervals. Additionally, singleton taxa were removed from rate calculations. In contrast, internal gaps in the fossil record and singleton taxa were retained for rate calculations using the three-timer and CMR methods.
$\hat{d}$
) rates in comparison to true speciation (λ) and extinction (μ) values from the underlying diversification model (Fig. 2A). For per capita rate calculations, range-through assumptions were applied (Foote Reference Foote2000); therefore, if an occurrence of a lineage was lost between the FAD and LAD, it was still considered present through sampling gaps and thereby contributed to the diversity count and diversification rate analysis of those intervening intervals. Additionally, singleton taxa were removed from rate calculations. In contrast, internal gaps in the fossil record and singleton taxa were retained for rate calculations using the three-timer and CMR methods.
Beyond visual inspection of rate variation through time, I also examined how well the simulated fossil record retained the original diversification pattern under each preservation scenario using two primary tests. First, I evaluated the accuracy of the rate estimates under the constant diversification model. Because diversification rates were uniform through time, the average estimated origination rate should reflect the true λ value; deviation from this value could be the result of preservation or assumptions of the approach used for calculating rates. I used the nonparametric Wilcoxon rank-sum test to evaluate the null hypothesis: the mean value of the estimated origination rates under each preservation scenario are equivalent to the true λ value. Even if rates calculated using the per capita, three-timer, or CMR approaches did not reproduce the accurate estimates (e.g., estimated rates were systematically higher or lower than the true λ), variation in λ and estimated $\hat{p}$
rates should still be correlated. To investigate whether the simulated fossil record provided a reliable signal of temporal variation in underlying diversification rates, I applied Spearman’s rank correlation analysis to test for significant, positive correlations between true λ and calculated mean origination rates for the simulated and preserved records.
$\hat{p}$
rates should still be correlated. To investigate whether the simulated fossil record provided a reliable signal of temporal variation in underlying diversification rates, I applied Spearman’s rank correlation analysis to test for significant, positive correlations between true λ and calculated mean origination rates for the simulated and preserved records.
Results
In this section, I first discuss estimated origination rates from the North American (specifically, from the Basin and Range Province) fossil record of rodents. I then describe the empirical preservation probabilities that were used in the modeling framework. Finally, I present results from four diversification models under six preservation scenarios to assess the fidelity of the simulated fossil records.
North American Rodent Record
Origination rates of fossil rodents from the Basin and Range Province, which has experienced a high degree of landscape change (area gain and increased relief) due to tectonic extension during the Neogene, were estimated based on three alternative metrics (Fig. 3, Supplementary Figs. 1–3). Excluding intervals without sufficient data for rate calculations, the mean per capita origination rate from 35 to 5 Ma is 0.51±0.57 (±1 SD), the mean three-timer origination rate is 0.27 ± 0.55, and the mean CMR origination probability is 0.48±0.58 species per 1 Myr interval. The per capita (Fig. 3A,B) and CMR (Fig. 3D) metrics demonstrate significantly elevated (95% confidence interval>0) origination rates slightly preceding and during intense Basin and Range tectonism from 18 to 14 Ma, while the three-timer (Fig. 3C) metric does not have enough data to calculate rates throughout the whole interval. Maximum, minimum, and random ages for fossil occurrences using the per capita approach are significantly correlated; in contrast, the three-timer and CMR approaches appear quite different through time. While rate estimates under each age assumption are not correlated, the timing of major peaks and dips in the CMR record roughly correspond.
Empirical Preservation Probabilities
To simulate the impact of preservation on diversification models, I employed both hypothetical preservation probabilities (R100%, R30%, IncR, and PulseR) and empirically derived preservation curves (FreqR and MacroR). Empirical estimates of preservation probabilities, R, through time were derived from gap analysis of the actual fossil record and from rock area extracted from the Macrostrat database (Version 0.3; Peters Reference Peters2008). Fossil-based preservation probability (FreqR) was highly variable through time (Fig. 2B). A weak but significant relationship was found between diversity and FreqR preservation probability (Spearman’s r=0.45, p=0.02), suggesting that variability in preservation may be contributing to the volatile pattern of Neogene rodent diversity in western North America. These findings contrast with previous studies assessing the North American rodent diversity record, which did not find significant sampling biases based on the correlation between the number of fossil localities and diversity or through shareholder quorum subsampling (Alroy Reference Alroy2010; Finarelli and Badgley Reference Finarelli and Badgley2010; Badgley et al. Reference Badgley, Smiley and Finarelli2014). The areal extent of the rock record may be an independent measure of preservation probability (e.g., Smith et al. Reference Smith, Lloyd and McGowan2012), and data from Macrostrat reflected the common trend of increasing rock area toward the present (Fig. 2B). Somewhat surprisingly, this rock record did not signal a pulse of sediment accumulation associated with tectonic activity and basin development in western North America during the middle Miocene. This finding may be a result of the coarse geographic and lithological resolution of this analysis.
Simulated Diversification
The six preservation scenarios had different effects on diversification dynamics inferred from simulated fossil records. Similarly, the three approaches for calculating rates had distinct strengths and weaknesses under different preservation scenarios. Two aspects of these approaches to estimating diversification rate from the fossil record were assessed: the accuracy of the estimated origination rates and the ability of each metric to reliably estimate constant or variable origination rates through time under different preservation histories. Mean estimates—per capita, three-timer, and CMR—for origination, extinction, and diversification rates from 1000 simulated records are presented for each diversification model (Figs. 4–7), with each row representing a different preservation scenario.
Results from 1000 simulated fossil records under the constant diversification model. The true origination, extinction, and net diversification rates are represented by thick gray lines. Mean per capita (solid black line), three-timer (dashed black line), and CMR (dotted black line) rates of origination, extinction, and diversification per 1 Myr time intervals were calculated according to Foote (Reference Foote2000), Alroy (Reference Alroy, Bottjer, Foote, Fürsich, Harries, Hendy, Holland, Ivany, Kiessling, Kosnik, Marshall, McGowan, Miller, Olszewski, Patzkowsky, Peters, Willier, Wagner, Bonuso, Borkow, Brenneis, Clapham, Fall, Ferguson, Hanson, Krug, Layou, Leckey, Nürnberg, Powers, Sessa, Simpson, Tomašovych and Visaggi2008), and Liow and Finarelli (Reference Liow and Finarelli2014), respectively, for a perfect fossil record and five realistic preservation scenarios.

Results from 1000 simulated fossil records under the tectonic-pulse diversification model. The true origination, extinction, and net diversification rates are represented by thick gray lines. Mean per capita (solid black line), three-timer (dashed black line), and CMR (dotted black line) rates of origination, extinction, and diversification per 1 Myr time intervals were calculated according to Foote (Reference Foote2000), Alroy (Reference Alroy, Bottjer, Foote, Fürsich, Harries, Hendy, Holland, Ivany, Kiessling, Kosnik, Marshall, McGowan, Miller, Olszewski, Patzkowsky, Peters, Willier, Wagner, Bonuso, Borkow, Brenneis, Clapham, Fall, Ferguson, Hanson, Krug, Layou, Leckey, Nürnberg, Powers, Sessa, Simpson, Tomašovych and Visaggi2008), and Liow and Finarelli (Reference Liow and Finarelli2014), respectively, for a perfect fossil record and five realistic preservation scenarios.

Results from 1000 simulated fossil records under the tectonic-constraint diversification model. The true origination, extinction, and net diversification rates are represented by thick gray lines. Mean per capita (solid black line), three-timer (dashed black line), and CMR (dotted black line) rates of origination, extinction, and diversification per 1 Myr time intervals were calculated according to Foote (Reference Foote2000), Alroy (Reference Alroy, Bottjer, Foote, Fürsich, Harries, Hendy, Holland, Ivany, Kiessling, Kosnik, Marshall, McGowan, Miller, Olszewski, Patzkowsky, Peters, Willier, Wagner, Bonuso, Borkow, Brenneis, Clapham, Fall, Ferguson, Hanson, Krug, Layou, Leckey, Nürnberg, Powers, Sessa, Simpson, Tomašovych and Visaggi2008), and Liow and Finarelli (Reference Liow and Finarelli2014), respectively, for a perfect fossil record and five realistic preservation scenarios.

Results from 1000 simulated fossil records under the diversity-dependent diversification model. The true origination, extinction, and net diversification rates are represented by thick gray lines. Mean per capita (solid black line), three-timer (dashed black line), and CMR (dotted black line) rates of origination, extinction, and diversification per 1 Myr time intervals were calculated according to Foote (Reference Foote2000), Alroy (Reference Alroy, Bottjer, Foote, Fürsich, Harries, Hendy, Holland, Ivany, Kiessling, Kosnik, Marshall, McGowan, Miller, Olszewski, Patzkowsky, Peters, Willier, Wagner, Bonuso, Borkow, Brenneis, Clapham, Fall, Ferguson, Hanson, Krug, Layou, Leckey, Nürnberg, Powers, Sessa, Simpson, Tomašovych and Visaggi2008), and Liow and Finarelli (Reference Liow and Finarelli2014), respectively, for a perfect fossil record and five realistic preservation scenarios.

As these figures demonstrate, true rate values and temporal variation in rates (or lack thereof) were reproduced by simulated fossil records with perfect preservation (R100%). Edge effects on diversification rate calculations at the beginning and end of the simulated fossil record were mostly avoided by running the simulations over 40 Myr (or longer to reach equilibrium for the diversity-dependent model) and then removing the initial and final 5 Myr of results. However, for diversification scenarios with increasing diversity through time, one common feature of these simulations is that the 95% confidence intervals around rate estimates narrow toward the present, indicating that lower diversity at the start of the simulated histories (n initial=10 taxa) leads to more variable rate estimates (see results from 1000 simulated records per diversification model for each preservation scenario and diversification metric presented in Supplementary Figs. 4–15). Low diversity at the start of the simulated fossil record in combination with low preservation rates (e.g., R = 10%) had the greatest impact on CMR rate estimates, leading to unrealistically high estimates of origination and extinction rates (Figs. 4–6, IncR and PulseR). With constant, high diversity through time, the diversity-dependent model does not exhibit this behavior, suggesting that the number of species present within a given time bin may influence simulated diversification dynamics and model uncertainty. Under perfect preservation (R100%), the convergence of rate estimates on the true rates with time (and increased number of taxa) supports the notion that species richness affects rate accuracy. To compare the accuracy of each method for estimating rates using fossil taxa, I evaluated origination rates under the constant diversification model (Table 1). Across the different preservation scenarios, the CMR and three-timer approaches yielded accurate rate estimates more often than the per capita approach. Per capita rate estimates were systematically higher than model parameter values, while three-timer origination and extinction estimates tended to be lower and more variable than the true rates.
Results from Wilcoxon rank-sum test of estimated origination rates compared with the true origination rate (λ = 0.2) under the constant diversification model. A nonsignificant p-value (in bold) indicates higher accuracy for each method of rate calculation under different preservation (R) scenarios. Values in square brackets for CMR (IncR, PulseR, and StratR) are the p-values after excluding the interval from 30 to 20 Ma of the simulation, during which rate estimates are spuriously high due to low species richness and low preservation probability.

I describe the patterns observed for each diversification model in the following paragraphs; correlation results between true and estimated rates and between estimated rates and preservation probability are provided in Supplementary Tables 1 and 2, respectively. Under the constant diversification model, both mean speciation and mean extinction rates were time-invariant throughout the Neogene, a pattern that remained consistent in three of the five incomplete preservation scenarios (Fig. 4). Surprisingly, variable preservation rates (e.g., IncR, StratR) alone were not responsible for notable deviations from the true diversification dynamics. Only large jumps in preservation rate, such as those imposed by the PulseR and FreqR scenarios, seriously compromised the fidelity of the simulated fossil record. Highly variable preservation probabilities had a greater impact on per capita and three-timer rates than on CMR rates. However, as mentioned earlier, CMR rate estimates suffered from low species richness and low preservation probability during the first ~10 Myr of the IncR and PulseR preservation scenarios; this is true of the following two diversification scenarios (tectonic-pulse and tectonic-constraint) as well. The effects of preservation impacted all diversification metrics; however, the net diversification rate, $\hat{d}$
, exhibited less variability through time.
$\hat{d}$
, exhibited less variability through time.
In the tectonic-pulse diversification model, increased speciation rates over a 4 Myr interval can be detected under all preservation scenarios, although to varying degrees depending on the method used to calculate diversification rates (Fig. 5). With perfect preservation (R100%), the mean origination estimates, $\hat{p}$
, for each metric were positively correlated with the true origination rate, λ (Spearman’s rank correlation, p<0.05; see Supplementary Table 1). Using the per capita rate approach, the origination pulse was present, albeit dampened (R30%, IncR, StratR) or accentuated (PulseR, FreqR), depending on the preservation dynamics. In all scenarios except for FreqR, a significant, positive correlation between λ and mean per capita
$\hat{p}$
, for each metric were positively correlated with the true origination rate, λ (Spearman’s rank correlation, p<0.05; see Supplementary Table 1). Using the per capita rate approach, the origination pulse was present, albeit dampened (R30%, IncR, StratR) or accentuated (PulseR, FreqR), depending on the preservation dynamics. In all scenarios except for FreqR, a significant, positive correlation between λ and mean per capita $\hat{p}$
was found (via Spearman’s rank correlation coefficient, p<0.01), indicating that underlying diversification dynamics could be recovered despite moderate variation in preservation probability. Results from three-timer and CMR approaches did not always reflect the origination pulse; however, these metrics were less impacted by large jumps in preservation probability (e.g., see diversification estimates under the PulseR preservation scenario in Fig. 5 and correlation results in Supplementary Table 2). In the FreqR preservation scenario, spurious origination and extinction rate peaks also arose for all three metrics, with the three-timer and the CMR estimates being the most and less variable, respectively.
$\hat{p}$
was found (via Spearman’s rank correlation coefficient, p<0.01), indicating that underlying diversification dynamics could be recovered despite moderate variation in preservation probability. Results from three-timer and CMR approaches did not always reflect the origination pulse; however, these metrics were less impacted by large jumps in preservation probability (e.g., see diversification estimates under the PulseR preservation scenario in Fig. 5 and correlation results in Supplementary Table 2). In the FreqR preservation scenario, spurious origination and extinction rate peaks also arose for all three metrics, with the three-timer and the CMR estimates being the most and less variable, respectively.
The tectonic-constraint model—based on area change during Neogene extension in western North America as a proxy for tectonic activity and corresponding temporal variation in λ—had more complex behavior under the different diversification scenarios (Fig. 6) than the previous two diversification models. Variation in per capita origination rates was observed and significantly, positively correlated with λ (Spearman’s rank correlation, p<0.01; see Supplementary Table 1) in all the preservation scenarios; however, rates were distorted under the PulseR and FreqR scenarios. If the first 10 intervals with unreliable, inflated CMR origination rates are removed from the IncR, PulseR, and StratR preservation scenarios, the CMR approach also reflects the true underlying diversification dynamics (Spearman’s rank correlation, p<0.05; see Supplementary Table 1). Overall, the three-timer rate calculations do not perform well in capturing the true rates, suggesting that diversification histories with several rate shifts may be difficult to detect in the fossil record using this method, regardless of preservation probabilities through time. Rate estimates under all diversification scenarios improved during younger intervals (Supplementary Figs. 4–15), again suggesting a bias toward false rates during older intervals when diversity is low. The similarity of these findings across all three models may reflect an artifact of the modeling process but should prompt caution when applying metrics to data sets with very low species richness. Early in the simulated histories, diversification dynamics are more volatile, and the addition or loss of species appears to have a greater proportional impact, even on per capita rates or three-timer and CMR rates that explicitly account for sampling probabilities.
Finally, the diversity-dependent model exhibited behavior distinct from the previous three models, in part due to a different underlying diversity pattern (Fig. 7). Because the total number of species in sequential 1 Myr time bins remained roughly constant and high, the diversity-dependent model represented an equilibrium diversification scenario, with λ = μ, and a net diversification rate of approximately zero. When preservation probability was constant through time (e.g., R30%), equilibrium diversity was reduced but preserved. Not surprisingly, simulated diversity dynamics under variable preservation scenarios closely matched preservation probability through the Neogene, with false peaks in species richness occurring during intervals of elevated preservation. Despite this, simulated origination and extinction rates remained roughly constant and equal under all but two of the preservation scenarios, PulseR and FreqR (Fig. 7). Similar to the previous three diversification models, under the variable PulseR and FreqR preservation scenarios, the fossil record inaccurately reflected the true underlying rates and could lead to the misidentification of significant changes in speciation and extinction rates through time. However, preservation effects on speciation and extinction rates tended to cancel out, and diversification rates under all scenarios remained tightly clustered around zero, as expected during the maintenance of equilibrium diversity (Fig. 7). The three-timer rate estimates were the most variable under each incomplete preservation scenario, while the per capita rate estimates exhibited the most prominent impact of preservation on the net diversification rates (e.g., see diversification estimates under the PulseR and FreqR preservation scenarios in Fig. 7 and correlation results in Supplementary Table 2).
Discussion
North American Rodent Record in Relation to Tectonic History
The fossil record provides a crucial picture of diversification dynamics in the past and leading to present-day diversity gradients. The origin of the topographic diversity gradient, or TDG, is explored here, with a focus on the exceptional rodent record of western North America. In particular, I examined how changes in tectonic activity during basin extension may have promoted speciation events and thus contributed to variability in diversification rates throughout the evolutionary history of mammalian faunas in this region (e.g., Badgley Reference Badgley2010; Badgley et al. Reference Badgley, Smiley, Terry, Davis, DeSantis, Fox, Hopkins, Jezkova, Matocq, Matzke, McGuire, Mulch, Riddle, Roth, Samuels, Strömberg and Yanites2017). Increased diversity in the tectonically active, western North America compared with the tectonically quiescent Great Plains (Fig. 1) and elevated origination rates (for some, but not all metrics) in the Basin and Range Province (Fig. 3) are a feature of the rodent fossil record during the middle Miocene from 18 to 14 Ma. These results agree with findings from similar studies of rodents (Finarelli and Badgley Reference Finarelli and Badgley2010; Badgley and Finarelli Reference Badgley and Finarelli2013; Badgley et al. Reference Badgley, Smiley and Finarelli2014), rodents and lagomorphs (Samuels and Hopkins Reference Samuels and Hopkins2017), predominantly large mammals (Barnoksy and Carrasco Reference Barnosky and Carrasco2002), and ungulates and carnivores (Kohn and Fremd Reference Kohn and Fremd2008) within tectonically active regions of western North America during the Neogene. The strength of the origination peak depends both on the approach used to estimate rates and the assumed age for fossil localities. Per capita rates (Fig. 3A,B) are highest immediately preceding the 18–14 Ma interval, possibly due to a backward “smearing” effect found using this approach to calculate rates (e.g., Alroy Reference Alroy2014), and remain significantly elevated during the Miocene Climatic Optimum. CMR rates are also high during and just before this interval; however, age assumptions lead to different inferences about the exact timing and magnitude of the origination peak (Fig. 3D). Because the three-timer approach calculates rates according to the presence of species across multiple time bins, there is insufficient data before and at the start of this interval to calculate origination rates during the onset of intense, regional tectonic extension in the Basin and Range Province (Fig. 3C). These results in relation to the middle Miocene species richness peak and prominent TDG highlight two main findings. First, using the same underlying fossil occurrence data, these metrics can produce strikingly different inferred diversification histories; therefore, metric selection should be carefully considered. Simulations, such as those presented herein, help to better understand the impact of preservation on each metric separately (e.g., Holland and Patzkowsky Reference Holland and Patzkowsky1999; Holland Reference Holland2000). Second, three-timer and CMR rate calculations, which retain and use internal gaps, present unique challenges when the age uncertainty for some or all fossil localities exceeds the per bin interval length of the analysis or when occurrence data are lacking for time bins adjacent to the interval of interest (e.g., the gap in the fossil record just prior to 18–14 Ma). Therefore, a trade-off exists between the potential benefits of using range-through assumptions to calculate per capita rates and the benefits of jointly estimating and correcting for sampling probabilities under the three-timer and CMR approaches.
While the fossil record provides evidence of past diversity beyond what we would be able to retrieve from molecular phylogenies alone (e.g., Quental and Marshall Reference Quental and Marshall2010), diversification dynamics, such as the strengthening and weakening of the TDG, can be distorted by preservation (e.g., Foote Reference Foote2000). Qualitative inspection of the empirically derived preservation scenarios through time (Fig. 2B) indicates that the Neogene mammal diversity curve in North America (Fig. 1) is not a direct product of frequency-based fossil occurrences or the temporal distribution of the rock record. Likewise, the middle Miocene diversity peak is not correlated with the number of localities in the fossil record or lost when subsampled (Badgley et al. Reference Badgley, Smiley and Finarelli2014). Therefore, the elevated species richness west of the Rocky Mountains during this interval remains a pattern demanding explanation. The fact that we do not find a corresponding peak in the adjacent, but tectonically quiescent Great Plains region would suggest that tectonic activity and the generation of topographic complexity through geographical isolation of populations and increased speciation rates (e.g., tectonic-pulse and tectonic-constraint scenarios) play a role in promoting species diversity (Cracraft Reference Cracraft1985; Renema et al. Reference Renema, Bellwood, Braga and Bromfield2008; Badgley Reference Badgley2010; Badgley et al. Reference Badgley, Smiley, Terry, Davis, DeSantis, Fox, Hopkins, Jezkova, Matocq, Matzke, McGuire, Mulch, Riddle, Roth, Samuels, Strömberg and Yanites2017). Concurrent global warming during the Miocene Climatic Optimum may have facilitated range shifts into intermontane regions, further contributing to the peak in diversity during this time.
Simulating the Fossil Record
Findings from these simulations emphasize the insight that can be gained from investigating not only diversity patterns through time, but also teasing apart the mechanisms driving those patterns. In particular, I explore how preservation probabilities, especially nonuniform preservation through time, impact inference about diversification dynamics. Several excellent examples from the marine record of fossil invertebrates demonstrate how assessing the quality of the record (e.g., taphonomic filters and stratigraphic setting) and accounting for variable preservation through time produce better estimates of diversification dynamics (e.g., Kidwell and Holland Reference Kidwell and Holland2002; Peters Reference Peters2008; Smith et al. Reference Smith, Lloyd and McGowan2012; Holland Reference Holland2016). In comparison, such work within terrestrial settings is currently underdeveloped. Therefore, to simulate the impact of preservation on diversification models, I employed both idealized preservation probabilities and empirically derived preservation curves. In these simulations, the parameter values used are plausible if basic.
Under most preservation scenarios, the simulated fossil records reflected the temporal variation in the true underlying diversification dynamics. Stability in speciation and extinction rates was recovered for the constant and diversity-dependent diversification models, while variation in speciation rates was evident for the tectonic-pulse and tectonic-constraint models, despite low constant (R30%) and variable, but increasing (IncR, StratR) preservation probabilities (Figs. 4–7). However, preservation scenarios with large jumps in preservation probability from one temporal bin to the next (PulseR, FreqR) generated false peaks in speciation and extinction rates. In general, deviations from the original model were limited to the intervals of pronounced preservation change; however, the degree of rate variability elsewhere in the record depended on the metric used for calculating diversification rates. Importantly, these metrics—per capita, three-timer, and CMR—did not respond in similar fashion in response to different preservation histories. While per capita rates tended to best reproduce the underlying origination dynamics (Supplementary Table 1), these rates suffered the most from large jumps in preservation rates (e.g., PulseR and FreqR; Supplementary Table 2). This effect was additionally observed in the per capita net diversification rates, whereas the two other metrics dampened this preservation “noise.” Three-timer and CMR rates were more accurate than per capita rates (Table 1); however, the behavior of these metrics, especially when species richness and preservation probability was low, was sometimes erratic and unreliable. These results indicate that all three metrics provide useful information but are not guaranteed to correspond even with similar underlying fossil occurrence data and preservation history. Finally, as demonstrated for North American rodents (Fig. 3), some metrics may not produce results during certain time intervals due to a lack of sufficient data or may have certain limitations depending on the age resolution of fossil localities. It is therefore advisable to assess at least three primary factors regarding the quality of the fossil record of interest when determining which approach to use: total species richness and uniformity across the record, age uncertainty of fossil localities in relation to the temporal-bin length of analysis, and whether the preservation history is expected to be highly variable through time.
Preservation probability varies not only over time, but also over space, physical environments, and across clades. These preservation issues were avoided in the record simulated here; for instance, small-mammal teeth have similar taphonomic properties (Hibbard Reference Hibbard1941), and with the exception of Quaternary cave deposits (e.g., Terry Reference Terry2010), small-mammal fossils are typically found by screen-washing retrieval methods that are frequently applied to alluvial sediments (e.g., Lindsay Reference Lindsay1972; Badgley et al. Reference Badgley, Downs and Flynn1998). How to reconcile variability in diversification rates with heterogeneous preservation remains a challenging but important problem in paleoecology and macroevolution (e.g., Foote Reference Foote2000), especially given that preservation rates are often treated as time-invariant or assumed to follow a common trajectory with respect to lineage duration across the history of a clade (e.g., Liow et al. Reference Liow, Quental and Marshall2010; Silvestro et al. Reference Silvestro, Schnitzler, Liow, Antonelli and Salamin2014b). Some of this simplification occurs so as to avoid over-parameterization of complex models (Silvestro et al. Reference Silvestro, Salamin and Schnitzler2014a). However, if preservation parameters that are independent from lineage history (e.g., based on rock-record estimates from Macrostrat) are applied, some of these simplifying assumptions can be reconciled, thus enhancing our capability to recover the actual dynamics underpinning diversity patterns over time (e.g., Holland and Patzkowsky Reference Holland and Patzkowsky1999; Smith et al. Reference Smith, Lloyd and McGowan2012).
Alternative Diversification Models and Approaches
The modeling framework presented here is simplified to distinguish the impacts of variation in two model parameters. Several other diversification processes are not only plausible, but also necessary to produce the diversity patterns we observe through time. For small-mammal species richness to rise and fall over the Neogene within the two regions of North America (Fig. 1) requires that extinction rates vary and even exceed origination rates at times (Alroy Reference Alroy2009; Finarelli and Badgley Reference Finarelli and Badgley2010; Badgley et al. Reference Badgley, Smiley and Finarelli2014). Alternatively, under a diversity-dependent model, once an equilibrium number of species has been reached, large-scale variation in preservation alone could produce a highly variable species richness pattern through the Cenozoic. Evidence for exponential species increase, as modeled in the constant, tectonic-pulse, and tectonic-constraint diversification scenarios, is not typically recovered from the fossil record (e.g., Alroy et al. Reference Alroy, Koch and Zachos2000). Fossil and molecular records alike support the concept of diversification slowdowns over time (Alroy Reference Alroy2009; Rabosky Reference Rabosky2013). The mechanisms for these slowdowns, or diversity-dependent diversification as modeled here, are often debated; however, factors related to both biotic interactions and changes in the geographic template are likely to play an important role in limiting the total number of species that a region can both generate and support (Moen and Morlon Reference Moen and Morlon2014; Rabosky and Hurlbert Reference Rabosky and Hurlbert2015). Importantly, Neogene tectonic activity in western North America led to increased topographic complexity regionally and substantial gains in land area, both of which could have promoted elevated species richness (Cracraft Reference Cracraft1985; Rosenzweig Reference Rosenzweig1995).
Diversity-dependent diversification can be a compelling mechanism for explaining diversity patterns over space and time; however, the volatile record of North American rodent diversity is not necessarily consistent with this process. Depending on the spatial and temporal scale of the analysis, the North American mammal record has been used to infer both diversity-dependent dynamics (e.g., driven by biotic interactions) and landscape-driven dynamics (Alroy et al. Reference Alroy, Koch and Zachos2000; Barnosky Reference Barnosky2001). In the second case, various analyses have coupled variation in diversity and diversification rates with changes in tectonic activity (e.g., extension), climate (e.g., the Miocene Climatic Optimum), and vegetation heterogeneity (e.g., Vrba Reference Vrba1992; Barnosky and Carrasco Reference Barnosky and Carrasco2002; Kohn and Fremd Reference Kohn and Fremd2008; Finarelli and Badgley Reference Finarelli and Badgley2010; Eronen et al. Reference Eronen, Janis, Chamberlain and Mulch2015). These different mechanisms are not mutually exclusive, and the changing nature of species ecology, geographic distributions, and community assembly over a topographically and environmentally complex and dynamic landscape is likely to be a product of the interactions between biotic and abiotic factors (Badgley Reference Badgley2010; Blois and Hadly Reference Blois and Hadly2009; Hoorn et al. Reference Hoorn, Wesselingh, ter Steege, Bermudez, Mora, Sevink, Sanmartin, Sanchez-Meseguer, Anderson, Figueiredo, Jaramillo, Riff, Negri, Hooghiemstra, Lundberg, Stadler, Sarkinen and Antonelli2010). For example, diversification dynamics in mountainous regions may follow a diversity-dependent pattern during the development of topographic complexity as (1) species diversify to fill up ecological space along elevational gradients, and (2) geographic opportunities for vicariance decline through time in response to finer subdivision of the available landscape (Moen and Morlon Reference Moen and Morlon2014). Therefore, even under a diversity-dependent scenario, one might expect dynamic species richness and nonequilibrium diversity from the fossil record during an interval of intense tectonic activity. In addition to evidence from the fossil record, quantifying rate variation from comparative phylogenetic methods may illuminate underlying diversification mechanisms (e.g., Stadler Reference Stadler2011; Zelditch et al. Reference Zelditch, Li, Tran and Swiderski2015). For example, approaches such as BAMM (Rabosky Reference Rabosky2014) could be implemented for North American rodents and may yield interesting differences in speciation and extinction rates between clades found predominantly in the tectonically active or quiescent regions. Ideally, fossil data can be integrated as tip taxa or direct ancestors (e.g., via BioGeoBEARS; Matzke Reference Matzke2013) into such comparative methods (Liow et al. Reference Liow, Quental and Marshall2010; Quental and Marshall Reference Quental and Marshall2010).
A vital biogeographic process governing species distributions and diversity patterns is absent from the modeling framework of this study. In addition to in situ speciation, immigration and geographic-range expansions are major processes that add new species to a region (Jablonski et al. Reference Jablonski, Roy and Valentine2006; Martin et al. Reference Martin, Peláez-Campomanes, Honey, Fox, Zakrzewski, Albright, Lindsay, Opdyke and Goodwin2008; Riddle et al. Reference Riddle, Jezkova, Hornsby and Matocq2014). Examples of speciation, extinction, and immigration feature prominently in the North American record throughout the Neogene, influencing regional diversification, faunal composition, and turnover (e.g., Davis Reference Davis2005; Alroy Reference Alroy2009; DeSantis et al. Reference DeSantis, Beavins Tracy, Koontz, Roseberry and Velasco2012; Badgley and Finarelli Reference Badgley and Finarelli2013; Badgley et al. Reference Badgley, Smiley and Loughney2015). At regional spatial scales, the origination metric, $\hat{p}$
, includes both speciation and immigration (Finarelli and Badgley Reference Finarelli and Badgley2010), but distinguishing these two processes in the fossil record is challenging. However, an increase in faunal similarity across spatial scales in the active region from 17 to 14 Ma suggests that range shifts were contributing to species richness patterns (Badgley et al. Reference Badgley, Smiley and Loughney2015). Spatially explicit modeling approaches (e.g., Pires et al. Reference Pires, Silvestro and Quental2015; Silvestro et al. Reference Silvestro, Zizka, Bacon, Cascales-Miñana, Salamin and Antonelli2016) that can incorporate species exchange between the tectonically active and quiescent regions—for instance, due to climate warming and range shifts to higher elevations—may elucidate the biogeographic processes contributing to the strengthening and weakening of the TDG gradient over geologic time. Given high-resolution temporal and spatial coverage of fossil occurrences, it is possible to track the geographic distribution of lineages throughout their history to identify immigration events and range shifts over regional scales (Jablonski et al. Reference Jablonski, Roy and Valentine2006; Stigall and Lieberman Reference Stigall and Lieberman2006; Maguire and Stigall Reference Maguire and Stigall2008; Terry et al. Reference Terry, Li and Hadly2011).
$\hat{p}$
, includes both speciation and immigration (Finarelli and Badgley Reference Finarelli and Badgley2010), but distinguishing these two processes in the fossil record is challenging. However, an increase in faunal similarity across spatial scales in the active region from 17 to 14 Ma suggests that range shifts were contributing to species richness patterns (Badgley et al. Reference Badgley, Smiley and Loughney2015). Spatially explicit modeling approaches (e.g., Pires et al. Reference Pires, Silvestro and Quental2015; Silvestro et al. Reference Silvestro, Zizka, Bacon, Cascales-Miñana, Salamin and Antonelli2016) that can incorporate species exchange between the tectonically active and quiescent regions—for instance, due to climate warming and range shifts to higher elevations—may elucidate the biogeographic processes contributing to the strengthening and weakening of the TDG gradient over geologic time. Given high-resolution temporal and spatial coverage of fossil occurrences, it is possible to track the geographic distribution of lineages throughout their history to identify immigration events and range shifts over regional scales (Jablonski et al. Reference Jablonski, Roy and Valentine2006; Stigall and Lieberman Reference Stigall and Lieberman2006; Maguire and Stigall Reference Maguire and Stigall2008; Terry et al. Reference Terry, Li and Hadly2011).
Given the modeling framework provided here, it would be useful to consider what combination of model parameter values could potentially produce the diversification record observed in North American rodents. Tectonic activity may underpin variation in origination, extinction, immigration, and preservation (i.e., by enhancing sediment accumulation), leading to positive correlations among all three factors (e.g., Peters Reference Peters2008). Results from this study suggest that, although the nature of these correlations may differ across time periods and geographic regions, underlying diversification dynamics for the most part can be correctly inferred. In the future, Bayesian modeling approaches in which different hypotheses for diversification in relation to tectonic regimes are tested against fossil-occurrence data or the timing of major divergences inferred from molecular or full-evidence phylogenies may prove particularly illuminating (e.g., Rabosky Reference Rabosky2014; Silvestro et al. Reference Silvestro, Schnitzler, Liow, Antonelli and Salamin2014b, Reference Silvestro, Antonelli, Salamin and Quental2015). Likewise, explicit consideration of both the temporal and geographic distribution of the sedimentary record in relation to fossil localities is critical to better understand the influence of preservation on our reading of diversity patterns from the fossil record (Holland Reference Holland2016). Although different factors may drive the TDG diversity gradient at different times, topographic and climate interactions are likely to remain an important influence on diversification dynamics.
Conclusions
The fossil record can be used to robustly infer shifts in diversification rates when preservation and sampling are explicitly modeled. Rate estimates from simulated fossil records reliably reflected the underlying origination pulse under a variety of preservation scenarios. However, caution should be applied when estimating diversification rates during periods when preservation probability is considered to be highly variable between sequential time bins. Increased origination rates in relation to tectonic extension are hypothesized to have contributed to elevated mammal richness in western North America during the middle Miocene. While new species can be added to the region by speciation and immigration, basic models such as those explored herein can help constrain the processes that influence diversity patterns over geologic time. Ultimately, integration of data from fossil and molecular records combined with approaches that consider diversification (i.e., speciation and extinction) and biogeographic (i.e., immigration and geographic-range shifts) processes jointly will be necessary to understand the mechanistic underpinnings of diversity gradients such as the TDG.
Acknowledgments
This work was supported by the University of Michigan Rackham Predoctoral Fellowship. I thank Jonathan Mitchell, Tomasz Baumiller, and Dan Rabosky for valuable discussion of the concepts in this article and Catherine Badgley for thoughtful editing of this paper. I benefited greatly from helpful comments provided by Steve Holland, Michael Foote, and an anonymous reviewer. Finally, I am especially grateful to Pascal Title and Daniele Silvestro for providing guidance with R and Python code used for simulations and analyses.
Supplementary Material
Data available from the Dryad Digital Repository: http://dx.doi.org/10.5061/dryad.8k56k


 Open access