


Rainbow trout (Oncorhynchus mykiss) is an economically important fish species. Farmed trout are a valuable asset to the aquaculture industry, and there is significant pressure to reduce the use of protein-rich fishmeal-based diets currently fed to trout and other cultured species, and move towards a more sustainable plant-based meal as a means to reduce production costs and alleviate the burden on wild fish stocks(Reference Naylor, Goldburg and Primavera1, Reference New and Wijkstroem2). Furthermore, high-carbohydrate diets are desirable as they can increase growth rate and turnover rates in aquaculture practices, although how these enriched carbohydrate loads are metabolised and stored in trout remains controversial(Reference Moon3, Reference Hemre, Mommsen and Krogdahl4). Trout are carnivorous in nature with a limited ability to use digestible carbohydrates and are often classified as ‘glucose intolerant’(Reference Moon3). This is a well-established phenomenon characterised by prolonged hyperglycaemia and elevated plasma insulin levels after a carbohydrate-rich meal, and is similar in nature to the human metabolic disorder, type 2 diabetes(Reference Del sol Novoa, Capilla and Rojas5). Of particular interest to the present study is how a carnivorous fish, such as rainbow trout, can metabolise large quantities of carbohydrates and whether trout can be used as a model vertebrate species for the study of human metabolic disorders.
Recent mammalian studies reported that the dietary restriction of a single amino acid, methionine (Met), decreased mitochondria reactive oxygen species generation and oxidative damage in mice(Reference Sanz, Caro and Ayala6, Reference Caro, Gómez and López-Torres7), increased maximum longevity in rodents(Reference Orentreich, Matias and DeFelice8) and increased fat oxidation in human subjects with the metabolic syndrome(Reference Plaisance, Greenway and Boudreau9). In spite of the many studies examining the effects of Met restriction (MR), the direct mechanism involved in altering energy expenditure and metabolism by MR remains unknown. However, as a key methyl donor, Met may play a role in the epigenetic regulation of gene transcription. MR in rodents does reduce the hepatic content of S-adenosylmethionine, making an impact on the endogenous methyl donor pool, which has been demonstrated to decrease the degree of total DNA methylation(Reference Shivapurkar and Poirier10, Reference Pogribny, Ross and Wise11). Activation of normally silenced genes may be the driving force in relation to MR and altered energy expenditure and carbohydrate metabolism. To our knowledge, no study has examined the epigenetic effects of dietary Met manipulation in rainbow trout.
Supplementation of Met, and other essential amino acids such as l-leucine and l-lysine, is required for plant-based fish diets to match the nutritional and amino acid requirements of fish(12–Reference Cheng, Hardy and Usry14). Met supplementation is reported to improve the growth of rainbow trout(Reference Gaylord and Barrows15) and MR resulted in increased hepatic fatty acid synthase (FAS) activity, suggesting Met involvement in lipid metabolism(Reference Espe, Rathore and Du16). Furthermore, Lansard et al. (Reference Lansard, Panserat and Plagnes-Juan17, Reference Lansard, Panserat and Plagnes-Juan18) reported that manipulation of the aforementioned essential amino acids in trout hepatocytes regulated the expression of genes involved in carbohydrate and lipid metabolism. In fish, consumed carbohydrates in excess are converted to fats and stored in the liver, and recent evidence suggests that this de novo hepatic lipogenesis is dependent upon an insulin-stimulated pathway(Reference Polakof, Médale and Larroquet19). MR is reported to shift fuel utilisation from glucose to fat oxidation in rats(Reference Hasek, Stewart and Henagan20), and, by extension, we predict that MR in trout fed variable carbohydrate diets will have a similar impact on the transcripts involved in lipid and carbohydrate metabolism, as well as shifts in fuel usage, storage and energy availability.
The present study takes the initial steps in identifying the phenotypic impacts of MR in vivo, and provides further evidence of how carnivorous fish regulate ingested carbohydrates. Here, we fed trout semi-purified diets, in which known amounts of all amino acids, lipids and digestible carbohydrates were quantified. These diets consisted of a nominal (12 %) and high (22 %) carbohydrate load both with Met and MR. Transcripts involved in energy regulation (AMP-activated protein kinase (AMPK); carnitine palmitoyl transferase 1 (CPT1); PPARγ coactivator 1-α (PGC-1α); PPARα), glycolysis (glucokinase (GK); hexokinase (HK)), lipogenesis (FAS; sterol-regulatory element binding protein 1 (SREBP1)), and a newly identified regulator of glucose metabolism and fatty acid catabolism (adiponectin, Adipo) were assessed in both liver and muscle tissue. Parameters of growth, tissue metabolite concentrations of carbohydrates and lipids, liver GK and muscle HK activity, and adenylate energy charge (AEC) were determined for impacts on available fuels and energy pools. Finally, the epigenetic influence of MR was determined from total genomic DNA methylation status of muscle and liver tissues.
Materials and methods
Fish
Female rainbow trout (O. mykiss; n 32; eight per treatment) were purchased locally (Linwood Acres Trout Farm). Fish were initially sorted for weight (approximately 75 g) and acclimated to 13°C in 1·2 m3 tanks for 2 weeks before the start of the experiment. During this time, fish were fed ad libitum commercial trout feed (3 PT classic floating grower feed; Martin Mills). Tanks were supplied continuously with water from the City of Ottawa that was oxygenated and dechloraminated at the University of Ottawa Aquatic Care Facility. All fish were held under a photoperiod regime that mimicked the City of Ottawa natural light cycle. All experiments were conducted under a protocol approved by the University of Ottawa Animal Care Protocol Review Committee and undertaken in accordance with institutional animal care guidelines adhering to those of the Canadian Council on Animal Care.
Feeding experiment
Semi-purified diets were purchased from Dyets, Inc. Overall, four diets were purchased, which consisted of either 12 % or 22 % carbohydrate load with (1·5 % of total) or without (0 % of total) Met (+/ − , respectively). The 12 %+ group was considered the control group. The composition was modified across all experimental feeds to ensure that all diets were isoenergetic and isonitrogenous, by manipulating the essential oils and l-alanine concentrations (Table 1). Dietary composition analysis was conducted by the supplier and provided to us as total available energy (Table 1). The food was additionally coated with 1 % (w/v) cod liver oil (Carlson® Nutritional Supplements) to ensure palatability. Food intake was assessed with visual inspection of ingestion and daily accumulation of faeces at the bottom of the tank. Fish were fed diets amounting to 1 % body weight daily over a period of 8 weeks, after which the fish were terminally anaesthetised 6 h post-feeding on the final day, corresponding to the peak in blood glucose in trout(Reference Panserat, Skiba-Cassy and Seiliez21). Fish were weighed and sampled for blood, liver and white muscle tissue. A small blood sample was taken for haematocrit, and the remaining sample was immediately centrifuged, plasma separated and frozen at − 20°C. All tissues were freeze-clamped in liquid N2 and stored at − 80°C until processed.
Amino acid, lipid and carbohydrate content (g/100 g) of diets used in the study*
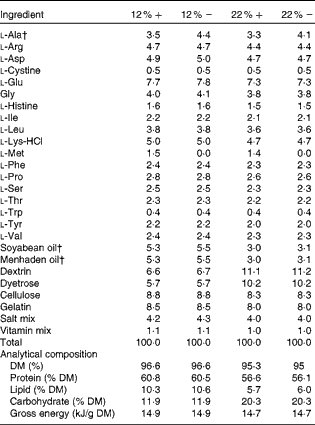
12 %+, 12 % Carbohydrate load with 1·5 % methionine content; 12 % − , 12 % carbohydrate load with 0 % methionine; 22 %+, 22 % carbohydrate load with 1·5 % methionine content; 22 % − , 22 % carbohydrate load with 0 % methionine.
* Dietary analysis was provided by Dyets, Inc.
† Lipids and l-alanine levels were adjusted to ensure that all diets were both isoenergetic and isonitrogenous.
Fish oxygen consumption
Before the termination of the feeding experiment, whole-tank oxygen consumption was determined 6 h post-feeding to assess differences in oxygen consumption between treatments. Briefly, tanks were covered with a plastic bag to ensure that there was a sufficient boundary between the surrounding air and tank water, and then a sympHony dissolved oxygen probe (VWR) was submerged into the tank and allowed to temperature-equilibrate. Following this, water and airflows were suspended to the tank and dissolved oxygen was recorded for a period of 1 h. This protocol was repeated for each tank (n 6) for the week leading up to the termination of the experiment. The tank-wise metabolic rate (MO2; mg O2/kg per h) was determined based on the total weight of fish within the tank.
Blood and tissue metabolites
All chemicals were purchased from Sigma-Aldrich, and the reaction buffers were prepared fresh daily. Liver and muscle tissues (n 8) were powdered under liquid N2 using a motor and pestle from which glucose and glycogen were extracted using approximately 50 mg of powdered tissue to 0·5 ml of ice-cold HClO4 (6 %) and homogenised for 20 s using a polytron-style homogeniser (Polytron PT2100; Kinematica). Aliquots used for glycogen analysis were neutralised with NaHCO3, enzymatically digested according to Hassid & Abraham(Reference Hassid, Abraham, Colowick and Kaplan22), and all samples were assayed for glucose spectrophotometrically following the protocol of Bergmeyer(Reference Bergmeyer23). Plasma glucose was analysed directly as mentioned previously. For the measurements of adenylates, a modified Vialight ATP assay was employed (Lonza). Briefly, 10–15 mg of powdered liver and muscle tissues were added to thirty volumes of lysis reagent (provided in the kit), and the tissues were allowed to lyse at room temperature for 10 min. For the determination of AMP, ADP and ATP, 100 μl of lysate were either enzymatically digested in 300 μl AMP tricine buffer (40 U/ml pyruvate kinase, 100 U/ml myokinase, 40 μm-phosphoenolpyruvate, 10 mm-KCl, 40 mm-tricine, pH 7·75), 300 μl ADP tricine buffer (40 U/ml pyruvate kinase, 40 μm-phosphoenolpyruvate, 10 mm-KCl, 40 mm-tricine, pH 7·75), or diluted in 300 μl ATP tricine buffer (10 mm-KCl, 40 mm-tricine, pH 7·75) for 10 min. Then, 150 μl of digest were transferred to a ninety-six-well luminescence plate and 100 μl of ATP monitoring reagent (provided in the kit) were added. The plate was incubated in the dark for 2 min and then read on an LMAXII 384 luminometer (Molecular Devices), and ATP concentrations were determined from a standard curve, spanning 10 nm to 10 μm, constructed from a purchased stock of standard specifically designed for bioluminescent determination of ATP (FLAAS-1VL, Sigma-Aldrich). AEC was calculated as: AEC = ((ATP)+0·5(ADP))/((ATP) +(ADP)+(AMP)).
Enzymatic activity
GK (EC 2.7.1.2) and HK (EC 2.7.1.2) enzymatic activities were assessed for both liver and white muscle, respectively. Activities were determined as described by Panserat et al. by coupling ribulose-5-phosphate formation from glucose-6-phosphate to the reduction of NADP+ at 340 nm. Activities were determined on a ninety-six-well microplate at 37°C and absorbance measured and recorded on a SpectraMAX PLus 384 microplate reader using SOFTmax software 4.6 (Molecular Devices). GK activity was corrected for glucose dehydrogenase activity (EC 1.1.1.47) as described(Reference Panserat, Medale and Blin24). Briefly, GK activity is determined as the total HK activity – low K m HK activity – 1/3 glucose dehydrogenase activity. Enzyme activity (U/mg protein) is defined as μmol of substrate converted to produced, per min, expressed per mg of soluble protein.
Lipid quantification
Lipids were extracted from the liver and muscle tissues (n 8) using a 2:1 chloroform–methanol (Folch) extraction protocol. Briefly, 5 ml of Folch were added to ground tissues, vortexed, and incubated for 20 min at room temperature; then, 2·5 ml 2 m-KCl buffered with 5 mm-EDTA were added, and the solution was vortexed and incubated for an additional 10 min before centrifugation at 2000 g for 3 min. The lower phase was placed in a clean glass tube and the liquid was evaporated under N2 until only the lipid residue remained. The extracted lipids were reconstituted in 0·5 ml ethylene glycol monomethyl diethyl ether. TAG and cholesterol were quantified from the tissue extracts using diagnostic kits, following the manufacturer's protocol (TECO Diagnostic). Plasma cholesterol and TAG were measured directly from the sample without extraction using the same kit. Phospholipids and total lipids were quantified using diagnostic kits from Wako Chemicals, following the manufacturer's protocol.
Genomic DNA extraction and methylation assessment
Liver and muscle tissues (n 5 per tissue) were ground in liquid N2 and approximately 50 mg of tissue were added to ten volumes of genomic DNA digestion buffer (100 mm-NaCl, 10 mm-Tris–HCl, 25 mm-EDTA, 0·5 % SDS, 0·1 mg/ml proteinase K, pH 8·0), and incubated for 18 h at 50°C. DNA was extracted from digested samples using standard phenol–chloroform–isoamyl alcohol (25:24:1), and DNA was precipitated with 7·5 m-ammonium acetate and 100 % ethanol. The final DNA pellet was washed in 70 % ethanol and re-suspended in TE buffer (10 mm-Tris–HCl, 1 mm-EDTA, pH 7·5). DNA was quantified using the Nanodrop ND-1000 (Fisher Scientific), diluted in TE buffer, and then re-quantified to ensure that 50–100 ng DNA were loaded into each well to assess DNA methylation status. The percentage of methylated DNA, as determined by the colorimetric quantification of 5-methylcytosine (5-mC), was measured using the MethylFlash™ Methylated DNA Quantification Kit (colorimetric; Epigentek), following the manufacturer's protocol.
Quantitative PCR
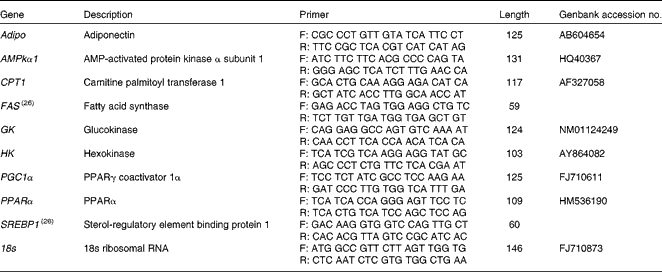
Total RNA from the liver and white muscle tissues (n 5 per tissue) was extracted using an RNeasy Lipid Tissue Mini Kit (Qiagen) to ensure quality total RNA from lipid-dense tissues. Total RNA concentrations were quantified using spectrophotometry, and RNA purity was verified using the Nanodrop ND-1000 (Thermo Scientific). First-strand complementary DNA (cDNA) was synthesised using QuantiTect Reverse Transcription Kit (Qiagen). mRNA expression was quantified in duplicate using a Stratagene MX3000P real-time PCR machine (Stratagene) using Brilliant III Ultra-Fast SYBR green qPCR mix (Agilent Technologies). Each reaction contained 10 μl SYBR mix, 1 μl forward and reverse primers (100 μm), 0·375 μl ROX reference dye (1:500 dilution), 6·7 μl RNase/DNase-free water, and 1 μl 5 × diluted cDNA template. Cycling conditions were: 3 min initial denaturation at 95°C, forty cycles of 95°C for 20 s, and 60°C for 20 s. To account for differences in amplification efficiencies between different cDNA, standard curves were constructed for each target gene using serial dilutions of quantified liver and muscle cDNA. To account for the differences in cDNA production and loading differences, all samples were normalised to the expression level of the housekeeping gene 18S, which did not change over the experimental treatments. Transcript expression data were calculated using the 2ΔΔ–C t method(Reference Livak and Schmittgen25). Both RNase/DNase-free water and non-reverse transcribed RNA were assayed on each plate to ensure no contamination was present in the reagents or in the primers used. Primers were either designed using Primer 3 software(Reference Rozen, Skaletsky, Krawetz and Misener26) or taken from previously validated primers sets(Reference Skiba-Cassy, Lansard and Panserat27). Target genes of interest were: Adipo, AMPKα subunit 1 (AMPKα1), CPT1, FAS, GK, HK, PGC1α, PPARα and SREBP1. Primers and accession numbers can be found in Table 2.
Forward (F) and reverse (R) primers used for quantitative PCR, including amplicon length
Statistical analyses
All data are presented as the mean with their standard errors. Statistical significance between all treatments was determined using a one-way ANOVA followed by a Tukey's post hoc test. Where appropriate, a Student's t test was applied to determine significant differences within a carbohydrate load (i.e. 12 %+v. 12 % − ). The level of significance for all tests was set at P< 0·05, and all statistical analyses were performed on SigmaPlot 11.0 software (Systat Software, Inc.).
Results
General parameters
Although all fish had significant weight gains over the course of the 8-week period, trout that were fed a 22 % carbohydrate diet, independent of MR, increased their mean body weight by 87·4 and 81·4 % (22 %+ and 22 % − , respectively) compared to the approximately 40 % increase seen in fish fed a diet composed of 12 % carbohydrate (Table 3). As an estimate of fish metabolic rate, whole-tank oxygen consumption was assessed 6 h post-feeding; whole-tank MO2 increased by 1·6-fold in the 22 % group, and value significantly different from any of the other treatments (Table 3). Hepatosomatic index, used as a measure of total hepatic energy storage, significantly increased in both the 12 % − and 22 % − groups, an increase significantly correlated with liver tissue glycogen (see Fig. 1(C); linear regression, R 2 0·548, P< 0·001). Haematocrit generally decreased with MR, although this was significantly different only in the 12 %+ group (Table 3). No significant changes occurred in plasma TAG levels, although a significant 1·7-fold decrease in circulating cholesterol levels in the 12 % − treatment compared to the 12 %+ group occurred. Similar trends in cholesterol content between the 22 % − and 22 %+ fish were observed, although neither treatments were different from their respective controls (Table 3).
Effects of varying carbohydrate load and methionine restriction in Oncorhynchus mykiss on weight (g); whole-tank metabolic rate (MO2; mg O2/kg fish per h); hepato-somatic index (HSI); haematocrit (HCT); plasma TAG and cholesterol (mmol/l); tissue TAG, cholesterol, phospholipids, and total lipids (mg/g tissue); adenylate energy charge (AEC) (Mean values with their standard errors and percentages)
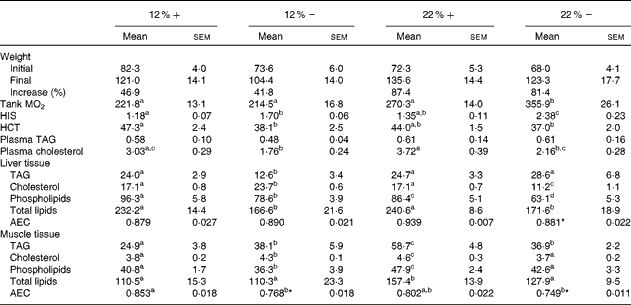
12 %+, 12 % Carbohydrate load with 1·5 % methionine content; 12 % − , 12 % carbohydrate load with 0 % methionine; 22 %+, 22 % carbohydrate load with 1·5 % methionine content; 22 % − , 22 % carbohydrate load with 0 % methionine.
a,b,cMean values within a row with unlike superscript letters are significantly different (one-way ANOVA and Tukey's post hoc test; P< 0·05).
* Mean values are significantly different within a given carbohydrate load (i.e. 12 %+v. 12 % − ; t test, P< 0·05).
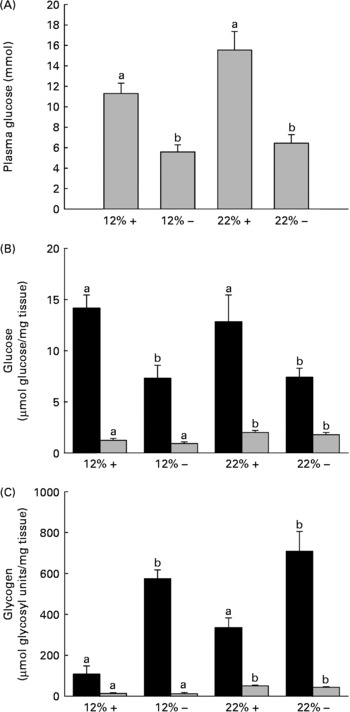
Effects of dietary manipulation of carbohydrate load and methionine restriction on (A) plasma glucose (mmol/l) and liver (■) and muscle ( ) tissue (B) glucose (μmol glucose/mg tissue) and (C) glycogen (μmol glycosyl units/mg tissue) levels 6 h post-feeding in Oncorhynchus mykiss. a,bMean values for a tissue (liver or muscle) with unlike letters were significantly different (P< 0·05; one-way ANOVA and Tukey's post hoc test). 12 %+, 12 % Carbohydrate load with 1·5 % methionine content; 12 % − , 12 % carbohydrate load with 0 % methionine; 22 %+, 22 % carbohydrate load with 1·5 % methionine content; 22 % − , 22 % carbohydrate load with 0 % methionine.
Lipids and adenylates
Fish fed MR diets at both carbohydrate levels significantly decreased total lipid content in the liver, attributed to the significantly decreased levels of cholesterol and phospholipid in the 22 % group, and decreased TAG in both MR treatments (Table 3). Despite a shift in fuel supply in the liver, the AEC remained unchanged across treatments. In muscle tissue, there is little change in the total lipid content, except for a significant increase in the 22 %+ group. However, there were significant changes associated with TAG, cholesterol and phospholipids in the treatment groups. At 12 % carbohydrate, MR significantly increased TAG and cholesterol levels, and decreased phospholipids (Table 3), while at 22 % carbohydrate all three parameters increased, which probably contributed to the total lipid increase. In contrast, the 22 % − group demonstrated no differences in total lipids, cholesterol or phospholipids when compared to the control group (12 % − ), even though TAG increased significantly. Thus, MR apparently contributed towards the reduction in total lipids when compared to the 22 %+ group (Table 3). Muscle adenylates were affected substantially by both dietary carbohydrate and MR, unlike in the liver tissue. AEC was significantly different in both MR groups.
Transcript expression
Expressed as a ratio of the 12 %+ treatment (control) group, variable expressional patterns of transcripts across treatments and between tissues persisted. Although there was no change in transcript expression of Adipo in the liver, the normalised expression level (not expressed as a ratio of the control group), was 3·1-times lower in the liver than transcript levels found in the muscle (12 %+ group comparison), suggesting that the primary site of expression of Adipo is muscle tissue as previously proposed for rainbow trout(Reference Kondo, Suga and Suda28). Expression of Adipo transcripts in the muscle decreased by 2–3-fold with MR, but increased 2-fold in the 22 %+ group (Table 4). AMPKα1 expression increased 2-fold in the liver of the 22 % − group, whereas transcripts increased by 2·1-fold in the muscle in the 12 % − diet, with non-significant changes noted in both 22 % carbohydrate diets. There was a 3-fold increase in CPT1 transcript levels in the livers of 22 % − fish, and white muscle CPT1 levels were approximately 3- to 5-fold higher with MR when compared to their respective carbohydrate load (Table 4). MR decreased FAS transcript level in the liver independent of carbohydrate load, while the expression did not change in the muscle. GK in the liver was significantly repressed in the trout fed MR diets, and HK in the muscle was attenuated only with MR in the 22 % carbohydrate treatment group. The 22 % carbohydrate diet increased PGC1α transcript levels, although MR attenuated this response. Likewise, MR decreased PGC1α transcript levels in the 12 % − treatment when compared to the 12 %+ group. MR imposed a significant depression on PPARα transcript levels in the liver independent of carbohydrate load. SREBP1 transcript levels varied, with MR decreasing expression levels when compared to their respective carbohydrate control. Likewise, the muscle displayed decreased transcription levels of SREBP1 with MR, and nearly a 2-fold significant increase in transcript content in the 22 %+ group.
Effects of varying carbohydrate load and methionine restriction in Oncorhynchus mykiss on the transcript expression in the liver and muscle tissue of adiponectin (Adipo); AMP-activated protein kinase α subunit 1 (AMPKα1); carnitine palmitoyl transferase 1 (CPT1), fatty acid synthase (FAS); glucokinase (GK; liver only); hexokinase (HK; muscle only); PPARγ coactivator 1α (PGC1α); PPARα; sterol-regulatory element binding protein 1 (SREBP1)* (Mean values with their standard errors)
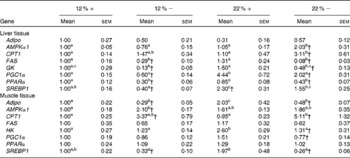
12 %+, 12 % Carbohydrate load with 1·5 % methionine content; 12 % − , 12 % carbohydrate load with 0 % methionine; 22 %+, 22 % carbohydrate load with 1·5 % methionine content; 22 % − , 22 % carbohydrate load with 0 % methionine.
a,b,cMean values within a row with unlike superscript letters are significantly different (one-way ANOVA and Tukey's post hoc test; P< 0·05).
* Transcript expression was normalised to 18S ribosomal RNA and values are expressed as a ratio of the 12 %+ treatment group.
† Mean values are significantly different within a given carbohydrate load (i.e. 12 %+v. 12 % − ; t test, P< 0·05).
Glucose and glycogen levels
One dramatic response to MR is the reduction in circulating plasma glucose 6 h post-feeding in a normally glucose-intolerant species (Fig. 1(A)). It should be noted that when compared alone, there is a significant difference (t test, P= 0·029) between the 12 %+ and 22 %+ groups (Fig. 1(A)). Consistent with this reduced plasma glucose content is a 50 % reduction in liver glucose independent of carbohydrate level and a 6–8-fold increase in glycogen content depending on the carbohydrate level fed to the trout (Fig. 1(B) and (C)). The response in the muscle was not as dramatic although here the level of carbohydrate fed dictated the observed increase in glucose and glycogen content; there were no MR-dependent effects.
Enzymatic activity
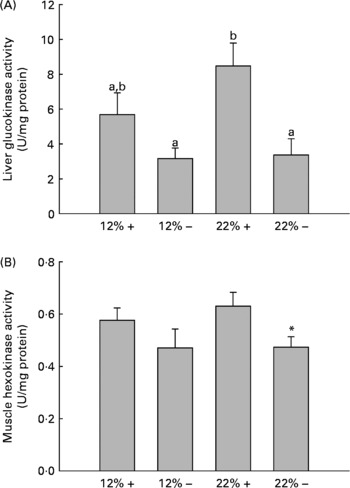
GK and HK activity was assessed in the liver and white muscle, respectively. MR appears to down-regulate GK activity in the liver, with a significant effect in the 22 % carbohydrate group (Fig. 2). Likewise, there is a depression in HK activity in the 22 % carbohydrate group with MR, and there were no significant changes in either tissue associated with a 12 % carbohydrate load.
Effects of dietary manipulation of carbohydrate load and methionine restriction on (A) liver glucokinase (GK) and (B) muscle HK activities measured as U/mg protein. a,bMean values with unlike letters were significantly different (P< 0·05; t test). * Mean value was significantly different from that for the 22 %+ condition (P< 0·05; t test). 12 %+, 12 % Carbohydrate load with 1·5 % methionine content; 12 % − , 12 % carbohydrate load with 0 % methionine; 22 %+, 22 % carbohydrate load with 1·5 % methionine content; 22 % − , 22 % carbohydrate load with 0 % methionine.
Total DNA methylation
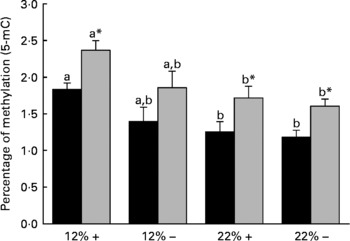
Diet is reported to significantly affect the extent of total DNA methylation. Thus the percentage of 5-mC was determined in both the liver and muscle tissues. Dietary carbohydrate content rather than Met content plays a more significant role in defining the overall methylation status of DNA, as the percentage 5-mC present in both 22 %+ and 22 % – groups significantly decreased in both the liver and muscle (Fig. 3). However, at nominal levels of carbohydrates (12 %), there is a general decrease associated with MR, which may indicate that Met may have some role in dictating total methylation.
Effects of dietary manipulation of carbohydrate load and methionine restriction on the percentage of methylation (5-methylcytosine; 5-mC) of genomic DNA in both liver (■) and muscle () tissues harvested from Oncorhynchus mykiss 6 h post feeding. a,bMean values for a tissue (liver or muscle) with unlike letters were significantly different (P< 0·05; one-way ANOVA and Tukey's post hoc test). * Mean value was significantly different from that for liver (P< 0·05; t test). 12 %+, 12 % Carbohydrate load with 1·5 % methionine content; 12 % − , 12 % carbohydrate load with 0 % methionine; 22 %+, 22 % carbohydrate load with 1·5 % methionine content; 22 % − , 22 % carbohydrate load with 0 % methionine.
Discussion
The aim of the present study was to expand our knowledge of carbohydrate handling in a carnivorous fish species, the rainbow trout, and to assess the phenotypic effects of Met-deficient (MR) diets primarily on glucose metabolism. The results demonstrated that rainbow trout fed an isoenergetic/isonitrogenous diet, but containing 22 % rather than 12 % digestible carbohydrate, nearly doubled their weight gain over an 8-week feeding regimen. Importantly, this weight gain occurred even though levels of fish oil in the 22 % diets were nearly 50 % of those in the 12 % diets. This weight gain was independent of Met, but the MR diet prevented the hyperglycaemia associated with glucose feeding irrespective of the carbohydrate load. In an effort to determine how glucose metabolism was altered with MR, phenotypic and transcriptional parameters related to carbohydrate and lipid metabolism were assessed in the muscle and liver tissues. Finally, since Met is a significant contributor to the total tissue methyl pool, total genomic DNA methylation was quantified, and results indicated that the higher carbohydrate content had a greater impact on decreasing DNA methylation than MR itself, indicating that diet has a significant role in the epigenetic regulation of gene transcription in the trout.
Carbohydrate and lipid metabolism
Glucose intolerance in carnivorous fish is well established(Reference Furuichi and Yone29, Reference Wilson and Poe30), and this is associated with carbohydrate-enriched meals increasing glycolytic capacity while failing to repress the gluconeogenic capacity of the liver(Reference Panserat, Medale and Blin24, Reference Panserat, Medale and Breque31–Reference Panserat, Plagnes-Juan and Kaushik33). Our studies with trout fed the 12 %+ and 22 %+ diets further support these findings, as the liver displayed significantly high glucose levels with reduced glycogen storage when compared to MR-fed trout (Fig. 1(B) and (C)). Likewise, there were increases in the glycolytic enzymes GK and HK in the liver and muscle associated with 22 %+ diet (Fig. 2). However, trout fed the MR diets reversed this trend, where there was a significant increase in liver glycogen stores and reduced glucose pools, with a significant repression in the glycolytic activity of liver GK and muscle HK, particularly in the 22 % group. As there was a significant decrease in glycaemia, the hepatic glucose pool may have been stored as glycogen, although further evidence is required. This hypoglycaemic-phenotype was also seen in rainbow trout fed metformin, an anti-diabetic drug prescribed in humans(Reference Rozen, Skaletsky, Krawetz and Misener26). However, this phenotype is associated with an increased lipogenic capacity, with increased mRNA levels for glucose-6-phosphate dehydrogenase and FAS in trout fed metformin+high carbohydrate load. The authors hinted at the potential for glucose biotransformation into fatty acids, a process demonstrated to be inefficient in rainbow trout(Reference Brauge, Corraze and Médale34); a further study by Polakof et al. (Reference Polakof, Médale and Larroquet19) did demonstrate excess carbohydrate storage as lipids. With significantly higher glycogen loads, biotransformation of glucose to fatty acids seems unlikely with MR. Also, contrary to the metformin studies, MR significantly reduced the total lipid pool in the liver, with reductions in phospholipids and TAG, although this effect was more pronounced in the 22 % group (Table 3). This may represent an increase in liver fat oxidation, as there was a significant reduction in hepatic lipogenic transcripts and in particularly FAS (Table 4). Although Plaisance et al. (Reference Plaisance, Greenway and Boudreau9) did not measure transcription responses to MR in human subjects, they reported increased fat oxidation and decreased hepatic lipid content associated with a 16-week MR diet in obese adults. Although our study took a cursory look at MR-associated lipid metabolism, further studies are warranted to examine significant changes in key lipogenic (FAS) and β-oxidation (CPT-1, 3-hydroxyacyl-CoA dehydrogenase) enzymes activities.
A hepato-centric approach is often taken when examining carbohydrate metabolism in fish, but attention to other peripheral tissues including white muscle is warranted. Although rainbow trout, and other carnivorous species, are deemed ‘glucose intolerant’, the mechanisms are not entirely clear, although peripheral tissues are probably involved as extensive work has examined insulin release and the increase in insulin receptor activity in peripheral tissues after a carbohydrate-rich meal(Reference Polakof, Médale and Larroquet19, Reference Gutierrez, Asgard and Fabbri35–Reference Polakof, Skiba-Cassy and Choubert38). Conclusions of these studies suggest that muscle tissues readily respond to elevated plasma insulin induced by large carbohydrate loads to absorb circulating glucose, thereby enhancing the capacity of the animal to deal with a high glucose load. Here, although circulating insulin levels were not assessed, trout responded to a 22 % carbohydrate load by increasing white muscle glucose and glycogen concentrations, irrespective of Met content (Fig. 1(B) and (C)). Likewise, there was a significant increase in total lipid content, although MR appears to have attenuated lipid accumulation in the muscle, specifically when comparing the 22 %+ and 22 % − treatments. Similar results are reported in mammalian studies where non-obese rats fed an MR diet did not accumulate fat over a 6-week feeding regimen, despite a paradoxical increase in food intake(Reference Hasek, Stewart and Henagan20). When obesity-prone rats were fed a similar MR diet, fat deposition was limited, and Hasek et al. (Reference Hasek, Stewart and Henagan20) suggested that increased energy expenditure was sufficient to compensate for the increased food intake and limit adiposity in both instances. The likely cause of this energy increase was deemed to be increased mitochondrial uncoupling, and a significant increase in uncoupling protein 1 was reported(Reference Hasek, Stewart and Henagan20). Trout fed a 22 % diet displayed a 60 % increase in tank-wise oxygen consumption, compared to the 12 %+ group, and a 30 % increase over the 22 %+ group (Table 3). Probably, the increased oxygen consumption, which signified increased energy expenditure beyond a nominal increase related to postprandial digestion, may contribute to the reduction in lipid in the white muscle of MR trout. Further examination of energy expenditure in MR fish is needed, with specific examination of mitochondrial uncoupling and expression of uncoupling proteins.
Transcript response
Several transcripts responsible for energy homeostasis and lipid metabolism were estimated in the liver and muscle. The recently characterised adipokine in rainbow trout, Adipo(Reference Skiba-Cassy, Lansard and Panserat27), is a hormone known to activate fatty acid oxidation, enhance glucose metabolism and regulate overall energy homeostasis in mammals(Reference Fantuzzi39–Reference Savino, Petrucci and Nanni41). Adipo in mammals is secreted from adipose tissue, but expression of Adipo transcripts was reported in the muscle and other tissues of rainbow trout but not adipose tissue(Reference Skiba-Cassy, Lansard and Panserat27). We find that absolute transcript levels were significantly higher in the white muscle compared to the liver in support of the report of Kondo et al. (Reference Kondo, Suga and Suda28). In the majority of mammalian studies, Adipo inversely correlates with percentage body fat, and elevated plasma Adipo stimulated glucose uptake and increased β-oxidation, effectively reducing metabolic syndromes such as type 2 diabetes(Reference Ukkola and Santaniemi42, Reference Nedvidkova, Smitka and Kopsky43). In the 22 %+ treatment, there was a 2-fold increase in Adipo expression in the muscle while the total lipid content increased, suggesting that the role of Adipo in lipid oxidation and glucose metabolism may differ in the fish species. Furthermore, MR appears to significantly reduce Adipo expression; further examination of Adipo transcript changes and its downstream effectors are required. However, the glycolytic transcripts, GK and HK, were significantly repressed, especially in hepatic tissues, and consistent with the enzymatic response of GK and HK in their respective tissues (Fig. 2).
Met reduction significantly reduced total liver lipid contents, which may indicate either a reduction in lipogenic capacity or an increase in fat oxidation, therefore reducing the overall hepatic lipid content. Hepatic mRNA transcripts for FAS, a regulator of fatty acid synthesis, and both hepatic and white muscle SREBP-1, a master regulator of cholesterol synthesis(Reference Brown and Goldstein44), were significantly reduced in fish fed MR diets. Likewise, there was a significant decrease in transcripts of PGC1α and PPARα, both regulators of fat oxidation capacity(Reference Puigserver and Spiegelman45, Reference Kersten, Seydoux and Peters46). Combined, these effects may suggest that MR diets result in reduced de novo synthesis of fatty acids and cholesterol, and additionally decreased β-oxidation, an indication that MR in trout may direct fuel usage away from fat oxidation towards carbohydrate usage, both factors that may help explain at least in part the observed reduction in lipid content of the liver. Moreover, CPT1, a key regulator of β-oxidation, was seen to increase in both the liver and muscle, especially with high carbohydrate loads, which suggests an increase in MR-associated fat oxidation. Although there is contradiction in the transcriptional response, caution is warranted in interpreting these data due to post-transcriptional modification and regulation. However, it is apparent that MR impacts the lipogenic and fat oxidation capacity in the liver and muscle of trout, and further in vitro validation of these mechanisms is currently being investigated.
Changes in fuel usage may impact energy availability. As a fuel source, fish utilise fats and proteins/amino acids more so than carbohydrates(Reference Murai, Yagisawa and Akiyama47, Reference Hilton and Atkinson48). Although carbohydrate-enriched diets are shown to increase energy availability(Reference Rozen, Skaletsky, Krawetz and Misener26), MR appears to decrease the available energy derived from carbohydrates. In the liver of 22 % − treated trout, there is a significant decrease in the AEC compared to the 22 %+ group, which is indicative of a decrease in overall ATP content and increased ADP and AMP concentrations. Likewise, we see a significant decrease in the AEC in the white muscle of both MR groups. AMPK is a master regulator of cellular metabolism, and is activated when cellular concentrations of AMP increase(Reference Hardie49). The mRNA transcript for the catalytic subunit of AMPK, AMPKα1, was significantly up-regulated in both the liver and muscle tissues under these conditions (Table 4). Despite sufficient energy stores, in the form of carbohydrates in both the liver and muscle, there is a distinct decrease in available ATP, signified by the reduction in AEC and increased expression of AMPKα1. As demonstrated by Polakof et al. (Reference Polakof, Médale and Larroquet19), such changes could significantly affect lipogenic activities in trout. As noted previously, Hasek et al. (Reference Hasek, Stewart and Henagan20) demonstrated that MR increased energy expenditure and mitochondrial uncoupling, which may contribute to the decrease in energy availability, although this warrants further investigation in trout.
DNA methylation
Diet is known to affect the epigenetic control of transcription, which in turn can dictate gene expression and physiological function(Reference Sandovici, Smith, Ozanne and Tost50, Reference Sandovici, Smith and Nitert51). DNA methylation is key to the regulatory control of gene transcription, and evidence supports hyper- and hypomethylated DNA-associated changes in gene expression(Reference Holliday and Pugh52, Reference Jenuwein53). The methyl pool necessary for DNA methylation is derived from S-adenosylmethionine, which is derived from Met adenylation(Reference Mudd and Poole54). One of our working hypotheses at the onset of this experiment was that if dietary Met was restricted, then a decrease in the degree of total DNA methylation, due to the lack of available methyl groups, would be observed. Interestingly, MR did not significantly affect total DNA methylation in either the liver or the white muscle of rainbow trout (Fig. 3). This suggests that MR may not limit the methyl pool available for DNA methylation, and may indicate other methyl sources or methylgenic pathways to compensate for the decrease in the methyl pool, such as betaine, choline and homocysteine re-methylation(Reference Stead, Brosnan and Brosnan55). A more detailed examination of these pathways under the influence of MR is planned for future experiments. Although MR did not affect total DNA methylation as predicted, trout fed with the 22 % carbohydrate diet had significantly reduced total DNA methylation in both the liver and muscle (Fig. 3). Diabetic rats have chronic alterations in methyl group metabolism with resulting genomic hypomethylation in hepatic tissues(Reference Williams, Garrow and Schalinske56). Although we abolished the primary ‘glucose intolerant’ phenotype with the reduction in postprandial plasma glucose in MR trout, fish fed carbohydrate-rich diets, irrespective of MR, still retained a glucose-intolerant phenotype with respect to DNA hypomethylation. A reduction in DNA methylation in trout fed the high-carbohydrate diet raises concerns related to gene expression, genomic stabilisation, and the possible development of secondary complications related to MR, such as cancer development(Reference Coughlin, Calle and Teras57–Reference Rousseau, Parent and Pollak59). Future efforts should be directed at understanding the methyl donor pathways and the effects of hypomethylation during MR in trout, which may provide greater insight into human-related metabolic syndromes.
Conclusions
Clearly, MR in rainbow trout elicits numerous phenotypic and transcriptional responses in the liver and white muscle tissue. Although we have not identified the direct pathways involved in the ability of MR to eliminate the glucose-intolerant phenotype in trout, it appears that the liver may play an essential role in the storage of excessive carbohydrates, which contributes to the abolishment of a hyperglycaemic phenotype after a carbohydrate-rich meal. However, peripheral tissues, such as white muscle, may be more important, as the mass of muscle tissue far exceeds that of the liver and probably provides a sink for the storage of excess carbohydrates in the form of lipids. Furthermore, there is a distinct possibility that MR-carbohydrate-enriched diets fed to fish initiate a switch in fuel usage, moving away from fat oxidation towards glucose metabolism, contrary to mammalian studies(Reference Hasek, Stewart and Henagan20). However, this switch related to MR appears to reduce the overall energy content available, particularly in the white muscle, suggesting uncoupled mitochondrial respiration. Finally, carbohydrate content does affect the overall hypomethylation status of genomic DNA in both liver and white muscle tissues. Further investigation into the enzymatic activity related to fat and glucose oxidation and examination of specific hypomethylated sites are required to understand the effects of MR in trout. Furthermore, trout fed MR diets provide useful systematic information for the better understanding of glucose-intolerant phenotypes and metabolic syndromes.
Acknowledgements
The authors wish to thank Bill Fletcher for his assistance in fish husbandry at the University of Ottawa. Thanks are also extended to Leslie Erdman for assistance in food preparation and feeding. P. M. C. designed and conducted the experiment and wrote the manuscript. T. W. M. provided experimental design and editorial input. The authors state that there is no conflict of interest associated with this paper. Funding was provided through a Natural Sciences and Engineering Council of Canada (NSERC) Discovery grant to T. W. M; P. M. C. is a recipient of an NSERC Postdoctoral Fellowship award.



