





Accurate assessment of protein and amino acid intake is vital in nutrition research due to their key roles in metabolism, cardiovascular health, mental health and chronic disease prevention(Reference Dong, Richie and Gao1–Reference Miyake, Tanaka and Okubo4). While total daily intake remains a fundamental measure, emerging evidence indicates that the temporal distribution of amino acids – that is, how intake is allocated across meals such as breakfast, lunch and dinner – may be equally critical for supporting optimal health outcomes(Reference Mamerow, Mettler and English5). For example, observational studies have shown that low amino acid or protein intake at breakfast is linked to reduced muscle protein synthesis and poorer metabolic regulation, while unbalanced intake across meals may impair cognitive function and increase the risk of metabolic disturbances(Reference Kinoshita, Otsuka and Takada6,Reference Massimino, Izzo and Castaldo7) . Collectively, these findings underscore the importance of developing and validating dietary assessment tools capable of capturing not only total amino acid intake but also its distribution across individual meals.
Notably, studies investigating the distribution of amino acid intake across meal times have relied on detailed dietary records (DR) and 24-h dietary recalls(Reference Kinoshita, Otsuka and Takada6–Reference Kinoshita, Otsuka and Nishita8). Although these are widely regarded as reference methods for dietary assessment, these approaches require detailed recording over multiple days. The substantial burden placed on participants can limit their feasibility in large-scale studies or population-based settings(Reference Okada, Nakade and Hanzawa9). Despite growing interest in the timing and distribution of amino acid intake, previous validation studies of dietary assessment questionnaires for amino acid estimation have employed instruments such as the FFQ(Reference Ishihara, Todoriki and Inoue10–Reference Iguacel, Perez-Cornago and Schmidt13) and Diet History Questionnaires (DHQ)(Reference Suga, Asakura and Sasaki14). These tools focus on total daily intake and are not designed to capture meal-specific consumption, thereby leaving a methodological gap in assessing dietary patterns related to amino acid intake distribution.
The Meal-based Diet History Questionnaire (MDHQ) has been developed as a more practical alternative for capturing habitual dietary intake across distinct meal occasions while reducing participant burden(Reference Murakami, Shinozaki and McCaffrey15). It is a self-administered questionnaire assessing dietary intake over the past month at six eating occasions (breakfast, morning snack, lunch, afternoon snack, dinner and night snack). Previous research has supported the MDHQ’s validity in estimating food and nutrient intake, as well as overall diet quality(Reference Murakami, Shinozaki and Kimoto16–Reference Murakami, Shinozaki and Kimoto18). However, its performance in assessing amino acid intake at each meal occasion remains unverified, primarily because the 2020 edition of Standard Tables of Food Composition in Japan (STFCJ)(19) provides incomplete amino acid coverage, with values unavailable for many foods. Although Suga et al. (Reference Suga, Murakami and Sasaki20) previously developed an amino acid database based on the earlier editions of the STFCJ, it does not cover all food items in the most recent edition, underscoring the need to first develop a comprehensive amino acid composition table before evaluating the MDHQ for amino acid intake.
Therefore, this study aimed to develop a comprehensive amino acid composition table for Japanese foods by supplementing the STFCJ (2020) with missing values through systematic approaches and to evaluate the relative validity of the MDHQ in assessing total and meal-specific amino acid intake, using a 4-d weighed DR as the reference.
Materials and methods
Study procedure and participants
Detailed information regarding the survey procedures and participant characteristics is available in previously published reports(Reference Murakami, Shinozaki and Kimoto18). This cross-sectional study was based on the data collected from fourteen (of the forty-seven) prefectures between August and October 2021. Recruitment and data collection were conducted by sixty-six research dietitians with expertise in DR data collection(Reference Asakura, Uechi and Masayasu21,Reference Murakami, Livingstone and Masayasu22) . Participants were recruited using a snowball sampling approach in each participating prefecture. First, community-dwelling women aged 30–69 years who were healthy, willing to participate and living with their husbands were identified and recruited. To ensure balanced representation across age groups, we predefined four 10-year age categories (30–39, 40–49, 50–59 and 60–69 years). In each prefecture, two women were selected from each age category, resulting in a total of eight women per prefecture. Subsequently, their husbands were also recruited regardless of age, forming eight couples per prefecture. This recruitment strategy resulted in a sample of 112 women and 112 men. Although collecting dietary data from cohabiting couples could potentially minimise sex-related differences in intake, all analyses in this study were pre-specified to be conducted separately by sex; therefore, this was not considered a methodological concern. The sample size was determined based on the recommendations by Cade et al., which suggest that validation studies should include at least fifty participants, and ideally 100 or more(Reference Cade, Thompson and Burley23). Participants were excluded if they were dietitians or lived with one, were receiving dietary counselling from a physician or dietitian, had diabetes and were undergoing insulin therapy, were receiving dialysis, lacked sufficient internet access, had difficulty completing the online questionnaire, or were pregnant or lactating. Because recruitment was conducted using snowball sampling, the total number of individuals approached and excluded could not be documented.
Each participant was first asked to complete the online MDHQ. After a 7-to 10-d interval to ensure proper completion, participants then recorded their dietary intake using a weighed DR on four non-consecutive days within a 2-week period. After an additional interval of at least 1 d, participants were asked to complete the paper MDHQ, which was then collected by the research dietitians. Ultimately, a total of 111 women aged 30–69 years and 111 men aged 30–76 years successfully completed the full study protocol. The study was conducted in accordance with the principles of the Declaration of Helsinki. All procedures involving human participants were approved by the Ethics Committee of the University of Tokyo Faculty of Medicine (Protocol No. 2020326NI; approved on 29 January 2021). Written informed consent was obtained from all participants prior to their involvement in the study.
Development of amino acid database
We searched for data on eighteen individual amino acids (isoleucine, leucine, lysine, methionine, cysteine, phenylalanine, tyrosine, threonine, tryptophan, valine, histidine, arginine, alanine, aspartic acid, glutamic acid, glycine, proline and serine) and developed a food composition table for 2478 foods listed in the STFCJ (2020)(19). Among these, amino acid values were available for 1936 foods (78·1 %). Foods with a total protein content of less than 1 g per 100 g edible portion (222 items) were considered negligible(Reference Suga, Murakami and Sasaki20), leaving 320 food items without amino acid values. To supplement these values, we used a stepwise data-gathering strategy, adapted from Suga et al. (Reference Suga, Murakami and Sasaki20) as outlined below.
Step 1. Previously developed amino acid database
We obtained a previously developed amino acid database compiled by Suga et al. (Reference Suga, Murakami and Sasaki20), which was based on the 2010 fifth edition of the STFCJ. Foods in this database were mapped to match the food codes and names used in the eight enlarged editions of the STFCJ. From this source, amino acid values were obtained for 157 food items.
Step 2. Literature sources of direct analytical values
A literature search was conducted in PubMed and CiNii using the keywords ‘amino acids’ along with specific food names to identify studies reporting direct analytical measurements of amino acid composition. As amino acid analysis is typically conducted using ion-exchange chromatography or HPLC(Reference Suga, Murakami and Sasaki20), we restricted our data sources to studies that measured total amino acid composition in foods using either an automatic amino acid analyser (ion-exchange chromatography) or HPLC. We restricted the literature sources to studies reporting total amino acid composition measured using these analytical methods to ensure consistency and reliability across data sources. Studies reporting only individual amino acids were not prioritised because such data were limited and inconsistently available across food items, which could compromise comparability. In contrast, total amino acid values were more uniformly reported and enabled a more standardised approach for data assignment. Two studies(Reference Fujihara, Sasaki and Aoyagi24,Reference Zhang, Herrera-Balandrano and Huang25) were identified, from which amino acid data were extracted and assigned to three food items.
Step 3. Amino acid values from the foreign country food composition database
For foods without available amino acid values in the literature, we used amino acid composition data for the identical form of the same foods from the US Department of Agriculture (USDA) food composition database(26) and the Korean National Institute of Crop and Food Science Composition database(27). To account for differences in nitrogen content between the Japanese food of interest and the reference food (USDA or Korean database), amino acid values were adjusted using the following equation:
Amino acid value (Japanese food) = Amino acid value (reference food) × [Nitrogen content (Japanese food) ÷ Nitrogen content (reference food)].
Using this method, amino acid values were successfully estimated for eight foods.
Step 4. Estimation from amino acid composition of similar foods
When amino acid data for a particular food were unavailable, values were estimated from a biologically similar food in the STFCJ (2020) – either from the same genus or family, or from the same food in a different form. Differences in nitrogen content between the food of interest and the reference food were taken into account by proportionally adjusting the amino acid values according to the ratio of their nitrogen contents. For different forms of the same food (e.g. raw, boiled, baked and dried), values were derived from the available form. In these cases, we assumed that cooking did not alter the relative proportions of amino acids and adjusted the values to reflect the change in nitrogen content between the raw and cooked forms. Using these approaches, amino acid values were estimated for fourteen foods based on biologically similar items and for twenty-four foods based on different forms of the same items.
Step 5. Calculation of multi-ingredient foods
For multi-ingredient foods, amino acid values were estimated based on their ingredient lists. The eight enlarged editions of the STFCJ (2020) provide both the ingredient names and their weight ratios for these foods. We calculated the amino acid profile by summing the contributions of each individual ingredient, weighted by its proportion in the product. The calculation was adjusted so that the total estimated amino acid content matched the protein value of the multi-ingredient food. Using this method, amino acid values were obtained for sixty-seven food items.
Using the above-mentioned methods, amino acid values remained unavailable for forty-seven food items. As none of these foods were reported as consumed by participants in DR, their exclusion was deemed to have a negligible impact on the estimation of total amino acid intake.
Meal-Based Diet History Questionnaire
A detailed description of the MDHQ has been published elsewhere(Reference Murakami, Shinozaki and McCaffrey15,Reference Murakami, Shinozaki and Masayasu28) . Briefly, the MDHQ is a self-administered questionnaire assessing dietary intake over the past month at six eating occasions (breakfast, morning snack, lunch, afternoon snack, dinner and night snack). It consists of three parts: Part 1 includes quantitative questions on the frequency of Tier 1 food groups (11–24 items per meal); Part 2 assesses the relative frequency of Tier 2 subgroups (up to nineteen items); and Part 3 collects information on eating behaviours and basic demographics. Portion size is not assessed, except for alcoholic beverages, because prior validation studies have shown that using fixed portion sizes does not reduce accuracy(Reference Kobayashi, Murakami and Sasaki29–Reference Schlundt, Buchowski and Hargreaves33). In the MDHQ, all food group items are associated with sex-and meal-specific fixed portion sizes, derived from 16-d weighed DR collected from a sample of 242 Japanese adults(Reference Murakami, Shinozaki and McCaffrey15).
The questionnaire was administered in both online and paper formats with identical content. Quality control procedures were implemented to ensure the completeness and accuracy of the data. The online MDHQ was administered using Google Forms with mandatory response settings, preventing missing data. All responses were automatically recorded and exported into a spreadsheet, minimising data entry errors. For the paper-based MDHQ, completed questionnaires were reviewed by trained research dietitians and study staff. Any missing or unclear responses were confirmed with participants either in person or by telephone. In addition, all paper MDHQ responses were entered into a database in duplicate, and discrepancies between entries were identified and resolved through verification. All responses were converted into a standardised dataset, and intakes of Tier 1 and Tier 2 food groups were calculated using predefined algorithms(Reference Murakami, Shinozaki and McCaffrey15).
Weighed dietary record
Details of the four non-consecutive day DR used as the reference method in this validation study have been described previously(Reference Murakami, Shinozaki and Kimoto18). In brief, the recording period consisted of three weekdays (Monday to Friday) and one weekend day (Saturday or Sunday) within a 2-week span. Each participating couple received recording sheets and a digital kitchen scale (KS-274, Dretec), which offers an accuracy of ±2 g for weights between 0–500 g and ±3 g for 500–2000 g. Participants were provided with both written and verbal instructions by trained research dietitians, along with a sample entry sheet for guidance. They were instructed to weigh and record all foods and beverages consumed during each recording day, including those eaten both at home and outside the home. In situations where weighing was not feasible – such as when dining out – participants were asked to provide as much detail as possible, including brand names, estimated portion sizes (using household measures) and any remaining leftovers.
Upon completion of the dietary recording period, participants submitted the recording forms for each survey day directly to the assigned research dietitian. The dietitian reviewed each form and, when necessary, followed up with participants by telephone or in person to clarify or revise incomplete or unclear entries. All DR were subsequently verified by both research dietitians and trained staff at the study centre. Portion sizes estimated using household measures were converted into gram weights following standard procedures, and each food item was coded using the STFCJ (2020)(19). As in the MDHQ, estimated amino acid intakes were calculated using food intake data and the eighth edition of the STFCJ(19). Calculations were conducted for each meal type, and total intake was obtained by summing the values across meal types. For all dietary variables, the mean daily intake over the 4-d period was used for each individual.
Statistical analysis
Statistical analyses were performed using the SAS software (version 9.4; SAS Institute Inc.). A two-tailed P-value of < 0·05 was considered statistically significant. All analyses were stratified by sex and conducted to assess both total daily amino acid intake (i.e. the sum of intakes from breakfast, morning snack, lunch, afternoon snack, dinner and evening snack) and meal-specific intake.
All dietary data were expressed as medians with corresponding 25th and 75th percentiles, as the distributions were skewed. Body height and weight were self-reported, and BMI was calculated as weight (kg) divided by height squared (m2). Energy intake was estimated from the 4-d DR, online MDHQ and paper MDHQ. The validity of amino acid intake values derived from the online and paper MDHQ was examined using the median values from the 4-d DR as the reference. As most intake values were not normally distributed, non-parametric tests were applied for both group-level comparisons and correlation analyses. To evaluate estimation accuracy at the group level, median values derived from the online MDHQ were compared with those from the DR using the Wilcoxon signed-rank test. To assess the MDHQ’s ability to rank individuals within the population, Spearman’s correlation coefficients between the MDHQ and DR estimates were calculated. Spearman’s correlation coefficients were interpreted as follows: poor (< 0·30), fair (0·30–0·49), moderate (0·50–0·59), moderately strong (0·60–0·79) and very strong (≥ 0·80)(Reference Chan34). In addition, concordance correlation coefficients (CCC) were computed to evaluate agreement between the MDHQ and DR. Analyses were conducted for crude values, energy-adjusted values (using the residual and density models) and the percentage contribution of each amino acid to the total protein intake (% protein). Additionally, agreement of the amino acid intake between the MDHQ and DR was assessed using Bland–Altman analysis(Reference Bland and Altman35). To examine the proportional bias between the MDHQ and DR, the Bland–Altman analysis was complemented by the linear regression analysis(Reference Montenij, Buhre and Jansen36). Leucine was selected for Bland–Altman analysis across all eating occasions (presented in table and plot formats) as a representative amino acid due to its biological relevance as an essential amino acid and its common use in nutritional research(Reference Wu37). Furthermore, its Spearman’s correlation coefficients and CCC were comparable to the median values across amino acids for total intake, meals and snacks, indicating that it reflected the overall pattern observed. The limits of agreement were set as 1·96 times the standard deviation of the differences.
Results
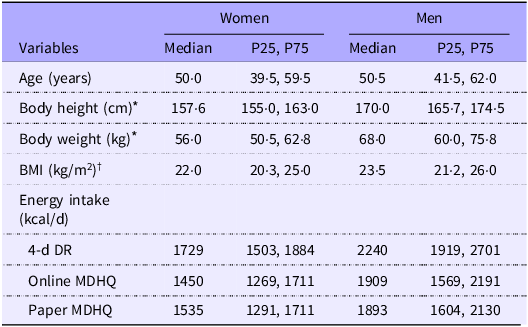
Table 1 presents the basic characteristics of the study participants. The median age was 50·0 years (25th–75th percentile: 39·5–59·5) for women and 50·5 years (25th–75th percentile: 41·5–62·0) for men. The median BMI was 22·0 kg/m2 for women and 23·5 kg/m2 for men. For both women and men, the median energy intakes estimated from the online and paper MDHQ were lower than those estimated from the DR.
Basic characteristics of the study participants

Table 1. Long description
The table compares basic characteristics of study participants by gender, including age, body height, body weight, BMI, and energy intake. It has two columns for women and men, each with median values and percentiles for age, body height, body weight, and BMI. The table also includes median energy intake values from different dietary assessment methods: 4-day dietary record (4-d DR), online MDHQ, and paper MDHQ. For women, the median age is 50.0 years, body height is 157.6 centimeters, body weight is 56.0 kilograms, and BMI is 22.0 kilograms per square meter. For men, the median age is 50.5 years, body height is 170.0 centimeters, body weight is 68.0 kilograms, and BMI is 23.5 kilograms per square meter. The median energy intakes from 4-d DR are 1729 kilocalories per day for women and 2240 kilocalories per day for men. The median energy intakes from online MDHQ are 1450 kilocalories per day for women and 1909 kilocalories per day for men. The median energy intakes from paper MDHQ are 1535 kilocalories per day for women and 1893 kilocalories per day for men. The table highlights that the median energy intakes estimated from the online and paper MDHQ are lower than those estimated from the DR for both women and men.
P25, 25th percentile; P75, 75th percentile; DR, dietary record; MDHQ, Meal-based Diet History Questionnaire.
* Based on self-report.
† Calculated from the self-reported body height and weight.
Results from the online Meal-based Diet History Questionnaire
Median estimation
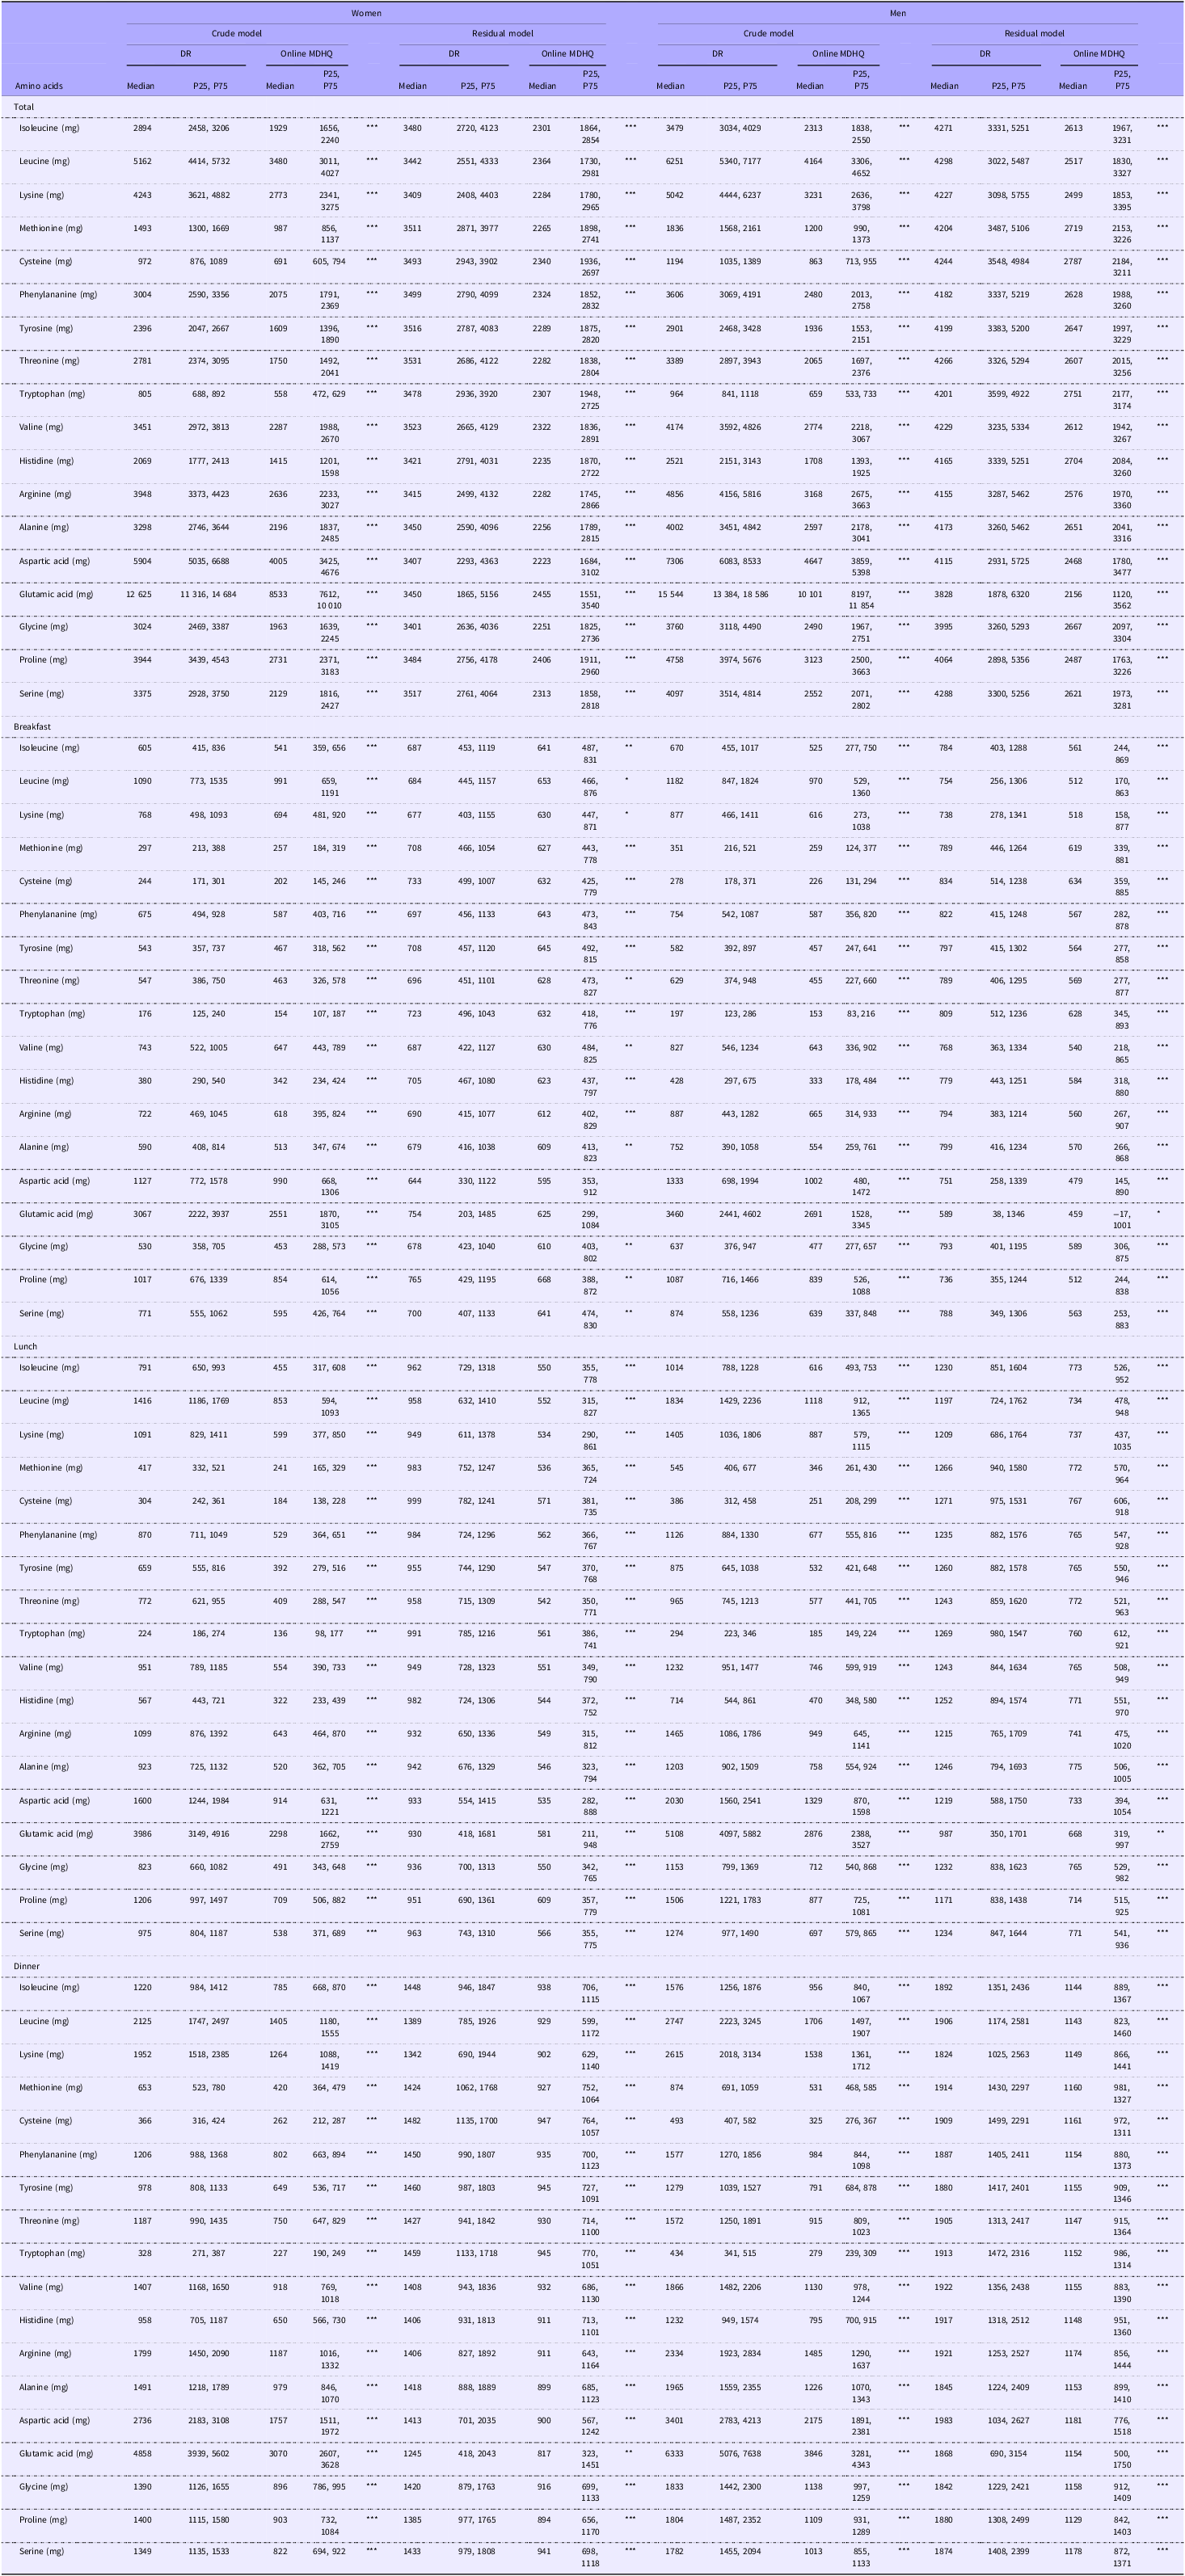
Table 2 presents the median estimates of crude and residual models for total and meal-specific (breakfast, lunch and dinner) amino acid intake derived from the DR and the online MDHQ. The median amino acid intakes estimated by online MDHQ tended to be lower than those estimated by the DR across all calculation methods in both women and men. All estimates showed statistically significant differences between online MDHQ and DR, except for aspartic acid and glutamic acid at breakfast in women when calculated using the residual model (P > 0·05). Online Supplementary Table S1 presents the median estimates of amino acid intake across snack occasions. Compared with DR, the amino acid intake estimates derived from the online MDHQ tended to be lower for morning snacks but higher for afternoon and evening snacks in both women and men, consistent across both the crude and residual methods. Online Supplementary Table S2 presents the median estimates of amino acid intake derived from DR and the online MDHQ, calculated using both the density model and the %protein method. In women, the online MDHQ values were relatively lower than those from DR, except for morning snacks when calculated using the %protein method. Among men, the online MDHQ values were also generally lower than DR, although relatively higher estimates were observed for morning snacks using the %protein method and for afternoon snacks using both the density and %protein methods.
Median estimates of amino acid intake (mg/d) derived from the 4-d weighed DR and the online MDHQ calculated with crude and residual models

Table 2. Long description
The table presents median estimates of amino acid intake in milligrams per day derived from a 4-day weighed dietary record (DR) and an online MDHQ, calculated using crude and residual models. It includes data for total intake and specific meals (breakfast, lunch, and dinner) for both women and men. The table shows that the median amino acid intakes estimated by the online MDHQ are generally lower than those estimated by the DR across all calculation methods. Significant differences between the online MDHQ and DR are noted, except for aspartic acid and glutamic acid at breakfast in women when calculated using the residual model. The table also highlights variations in amino acid intake estimates for morning, afternoon, and evening snacks, with the online MDHQ showing lower estimates for morning snacks but higher estimates for afternoon and evening snacks compared to the DR. Additionally, the table includes median estimates calculated using the density model and the percentage protein method, showing similar trends of lower estimates from the online MDHQ compared to the DR, with some exceptions.
DR, dietary records; MDHQ, Meal-based Diet History Questionnaire; P25, 25th percentile; P75, 75th percentile.
The values derived from the MDHQ were compared with those derived from the DR using the Wilcoxon signed-rank test: * P < 0·05, **P < 0·01, ***P < 0·001.
Spearman’s correlation
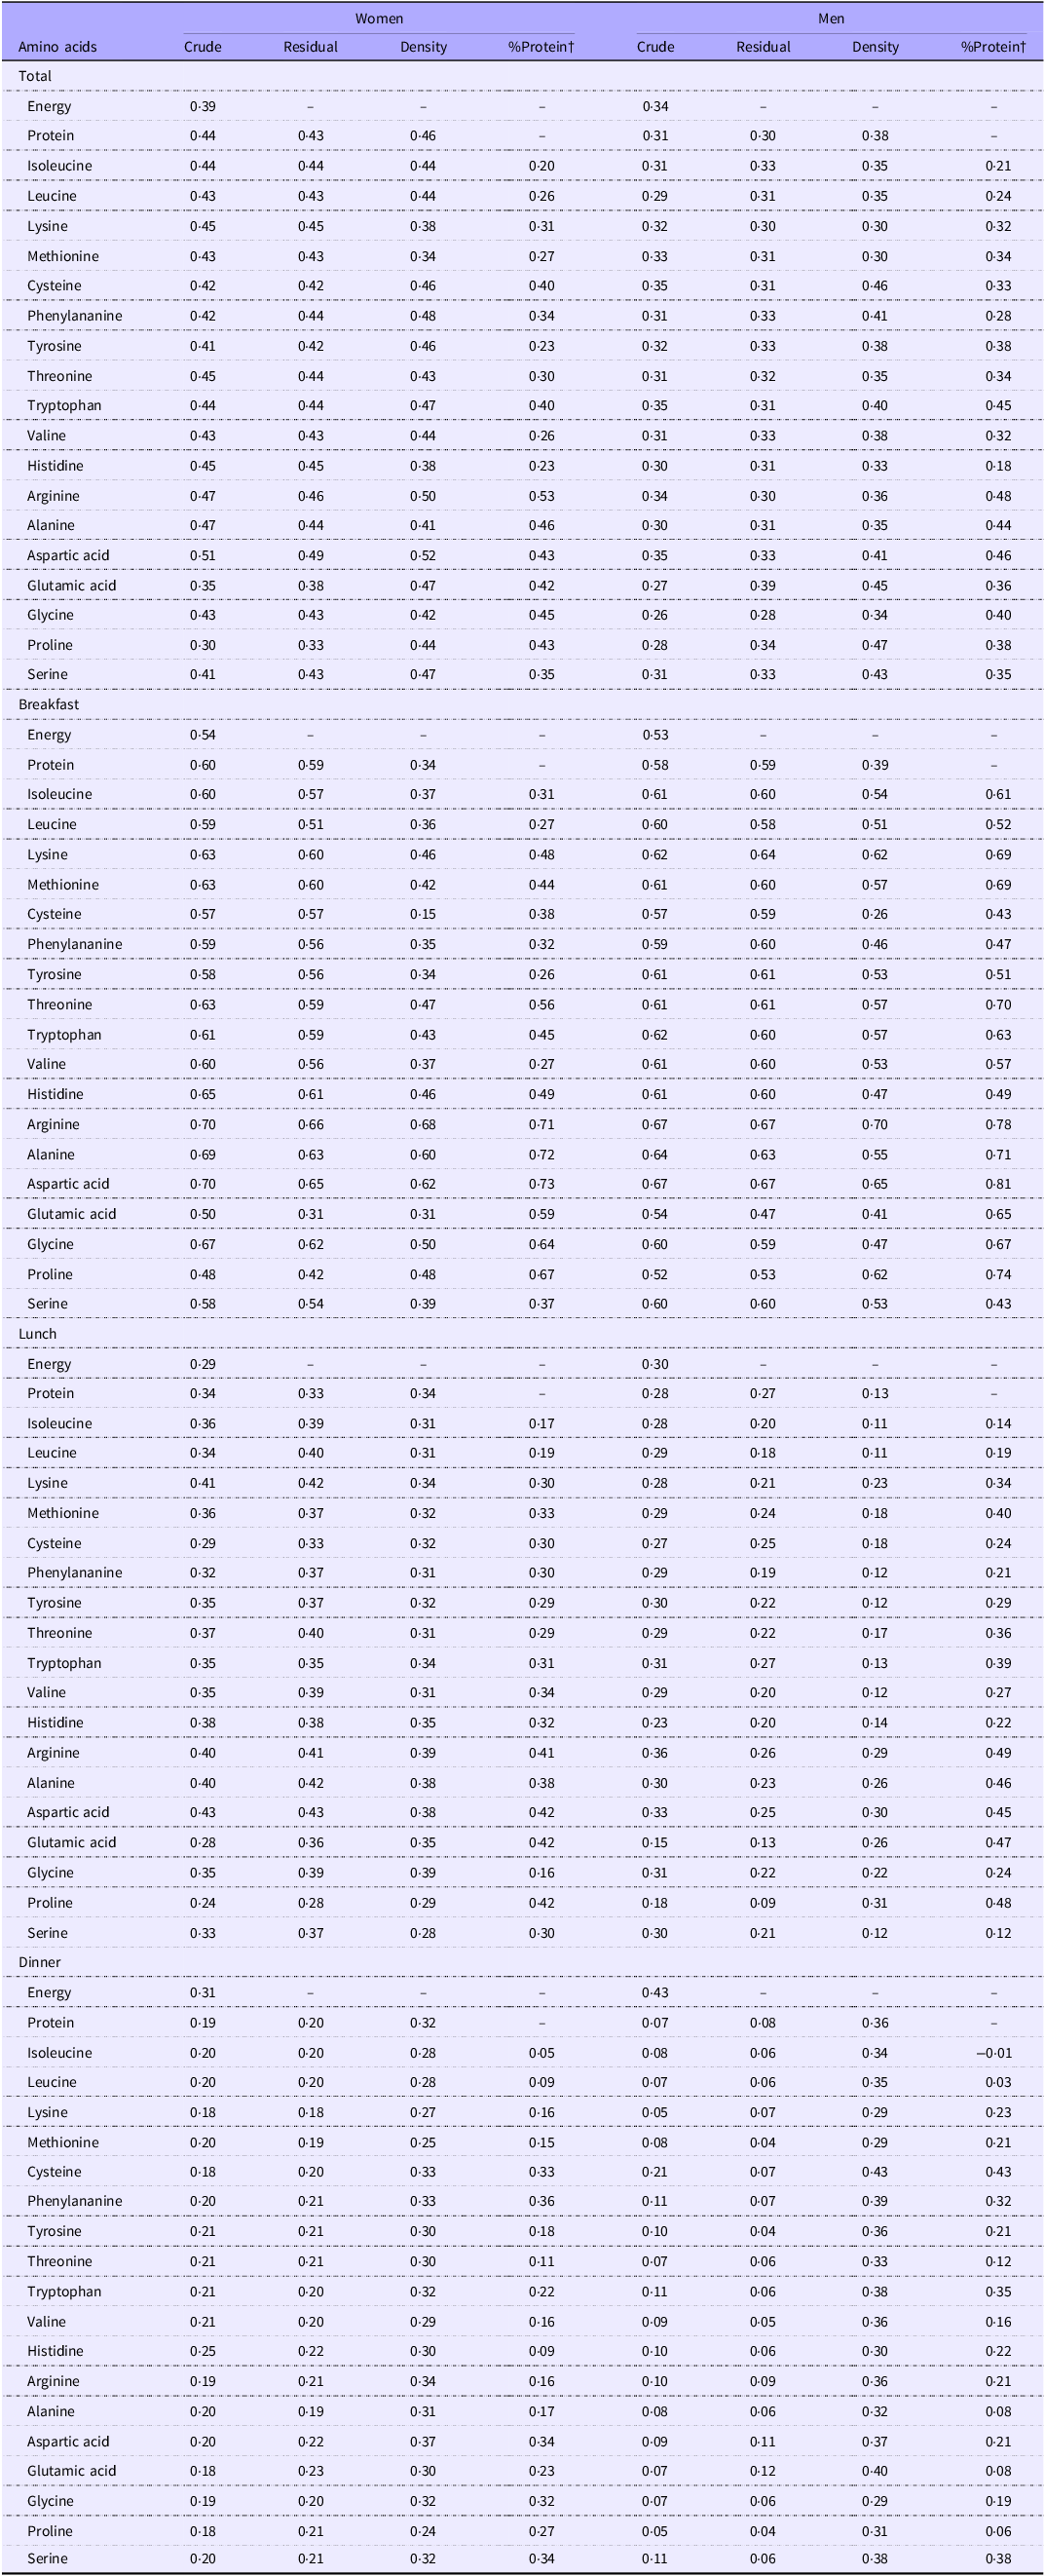
Table 3 shows the Spearman correlation coefficients for total and meal-specific amino acid intakes estimated by the DR and the online MDHQ. For total amino acid intake, the median coefficients among women were 0·43 (crude model), 0·44 (residual model), 0·44 (density model) and 0·35 (%protein model). The corresponding values among men were 0·31, 0·32, 0·37 and 0·35, respectively. For main meals (breakfast, lunch and dinner), the median correlations among women were 0·35 (crude), 0·44 (residual), 0·33 (density) and 0·35 (%protein), while the corresponding values among men were 0·29, 0·32, 0·34 and 0·35. For snack occasions, the median coefficients among women were 0·33 (crude), 0·33 (residual), 0·21 (density) and 0·13 (%protein), compared with 0·22, 0·22, 0·29 and 0·35, respectively, among men. Across all eating occasions, breakfast consistently showed the highest correlations in both women and men, with median values of 0·57 (range: 0·15–0·73) and 0·60 (range: 0·26–0·81), respectively. The highest individual correlation was observed for %protein-derived aspartic acid intake at breakfast in both sexes.
Spearman’s correlation coefficients of amino acid intakes derived from the 4-d weighed DR and the online MDHQ *

Table 3. Long description
The table presents Spearman correlation coefficients for amino acid intakes derived from a 4-day weighed dietary record (DR) and an online MDHQ. It includes data for total intake and specific meals (breakfast, lunch, dinner, and snacks) for both women and men. The table has 33 rows and 10 columns, with headers for amino acids, total intake, and meal-specific intakes. For total amino acid intake, the median coefficients among women are 0.43 (crude), 0.44 (residual), 0.44 (density), and 0.35 (percentage protein). For men, the corresponding values are 0.31, 0.32, 0.37, and 0.35. For main meals, the median correlations among women are 0.35 (crude), 0.44 (residual), 0.33 (density), and 0.35 (percentage protein), while for men, they are 0.29, 0.32, 0.34, and 0.35. For snack occasions, the median coefficients among women are 0.33 (crude), 0.33 (residual), 0.21 (density), and 0.13 (percentage protein), compared with 0.22, 0.22, 0.29, and 0.35 for men. Breakfast consistently shows the highest correlations, with median values of 0.57 for women and 0.60 for men. The highest individual correlation is observed for percentage protein-derived aspartic acid intake at breakfast in both sexes.
DR, dietary records; MDHQ, Meal-based Diet History Questionnaire.
* Values are expressed as Spearman’s correlation coefficients.
† Calculated as the percentage contribution of each amino acid to the total protein intake during each eating occasion.
Concordance correlation coefficients
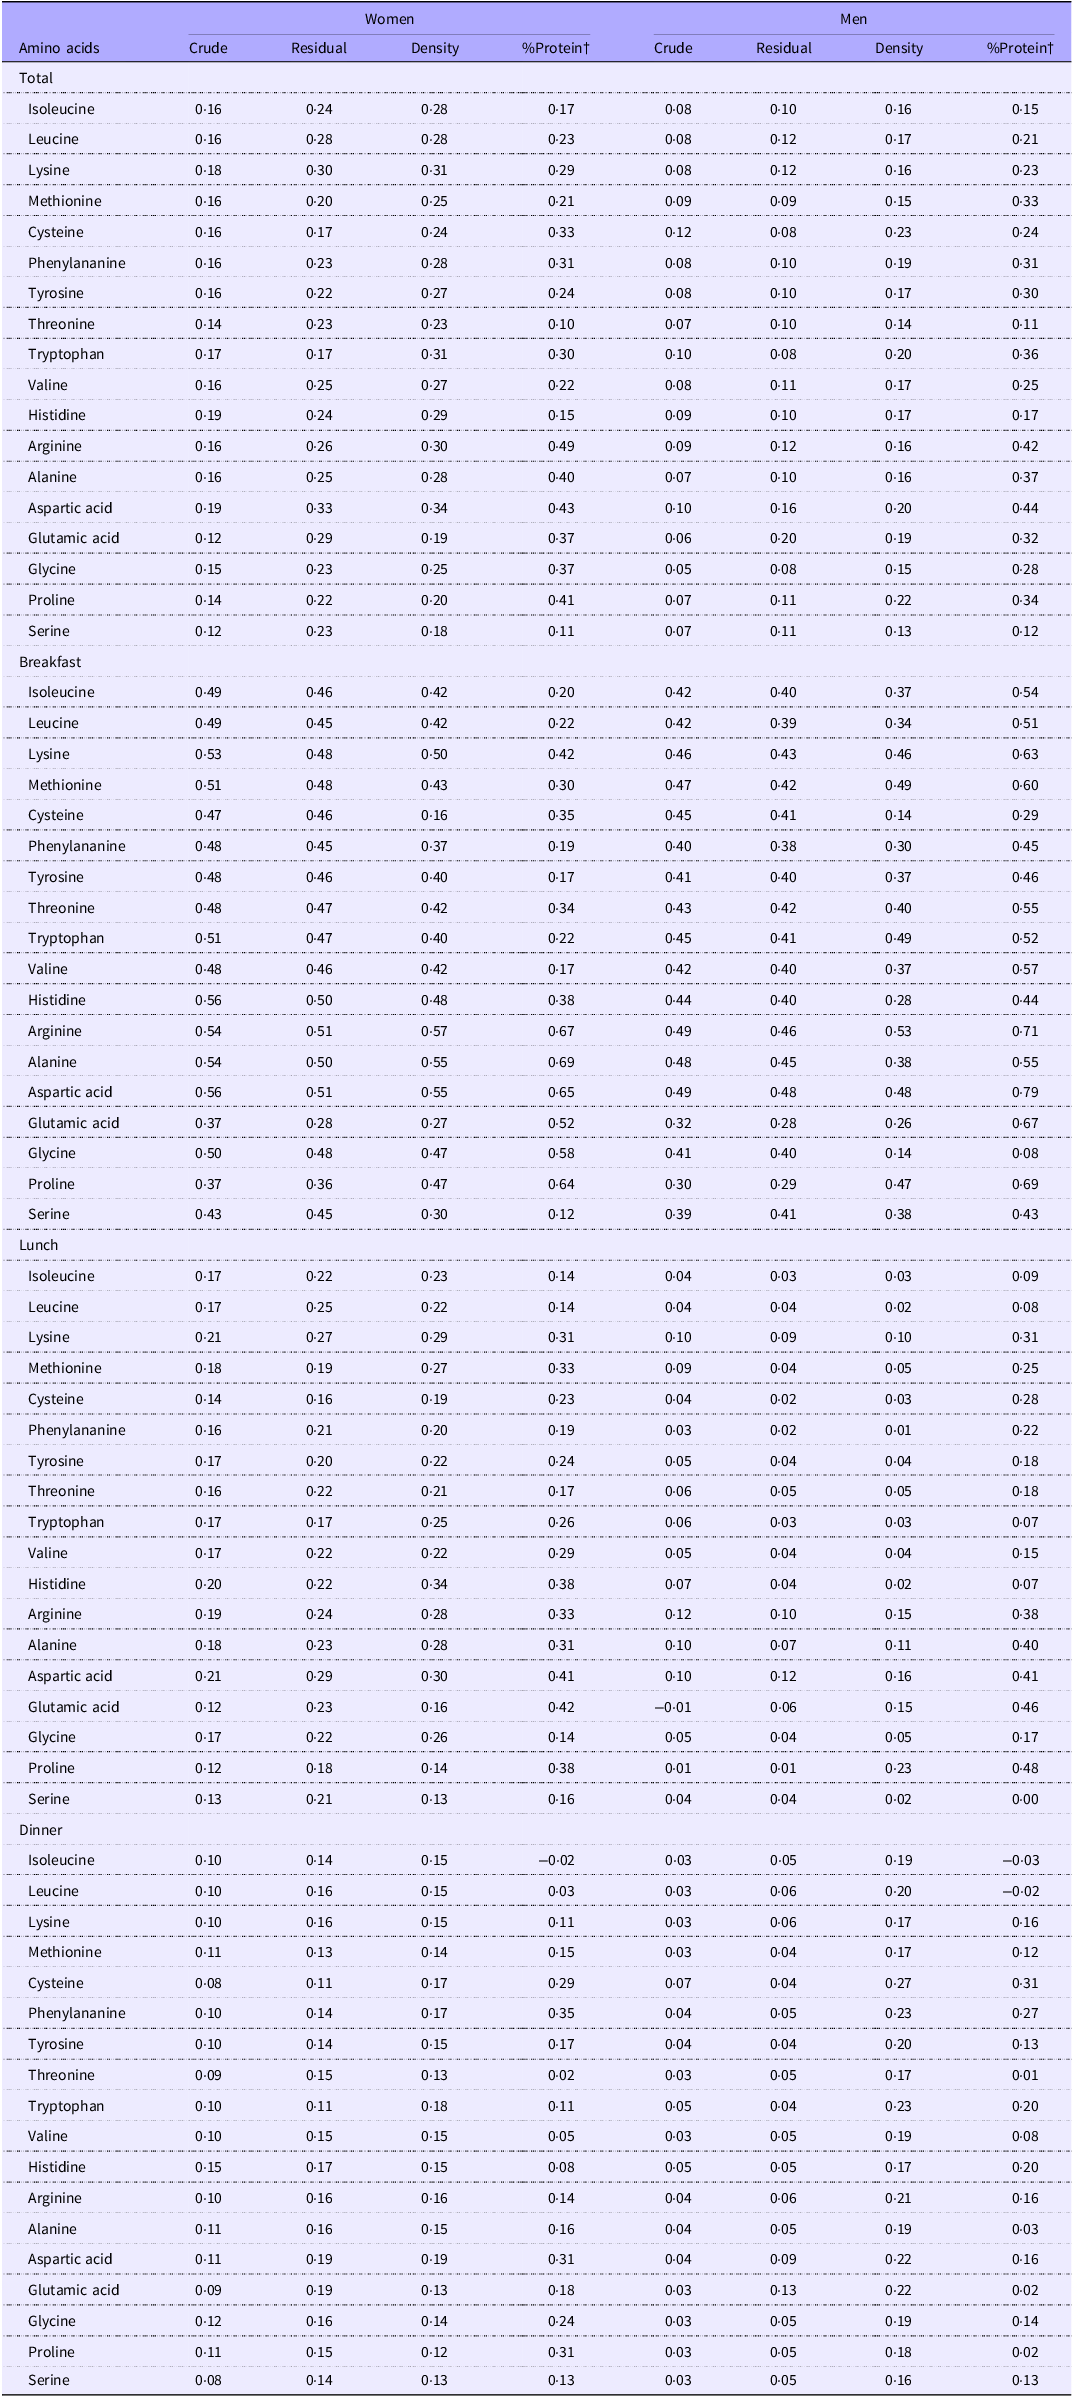
Table 4 shows the CCC for total and meal-specific amino acid intakes estimated by the DR and the online MDHQ. The CCC were consistently lower than the corresponding Spearman correlation coefficients. For total amino acid intake, the median CCC among women were 0·16 (crude model), 0·24 (residual model), 0·28 (density model) and 0·29 (%protein model). The corresponding values among men were 0·08, 0·10, 0·17 and 0·29, respectively. For main meals (breakfast, lunch and dinner), the median CCC among women were 0·17 (crude), 0·22 (residual), 0·22 (density) and 0·23 (%protein), whereas among men the corresponding values were 0·06, 0·06, 0·19 and 0·24. For snack occasions, the median CCC among women were 0·23 (crude), 0·23 (residual), 0·11 (density) and 0·10 (%protein), compared with 0·20, 0·17, 0·13 and 0·27, respectively, among men. Consistent with the Spearman correlation results, breakfast exhibited the highest CCC values in both women and men, with median values of 0·47 (range: 0·12–0·69) and 0·42 (range: 0·08–0·79), respectively.
Concordance correlation coefficients (CCCs) of amino acid intakes derived from weighed DR and the online MDHQ *

Table 4. Long description
The table presents concordance correlation coefficients (CCC) for total and meal-specific amino acid intakes estimated by dietary records (DR) and the online MDHQ. The table includes data for women and men across different models: crude, residual, density, and percentage protein. For total amino acid intake, the median CCC among women are 0.16 (crude), 0.24 (residual), 0.28 (density), and 0.29 (percentage protein). For men, the corresponding values are 0.08, 0.10, 0.17, and 0.29. For main meals (breakfast, lunch, and dinner), the median CCC among women are 0.17 (crude), 0.22 (residual), 0.22 (density), and 0.23 (percentage protein), while for men, the values are 0.06, 0.06, 0.19, and 0.24. For snack occasions, the median CCC among women are 0.23 (crude), 0.23 (residual), 0.11 (density), and 0.10 (percentage protein), compared with 0.20, 0.17, 0.13, and 0.27 for men. Breakfast exhibits the highest CCC values for both women and men, with median values of 0.47 and 0.42, respectively.
DR, dietary records; MDHQ, Meal-based Diet History Questionnaire.
* Values are expressed as CCCs.
† Calculated as the percentage contribution of each amino acid to the total protein intake during each eating occasion.
Bland–Altman analysis
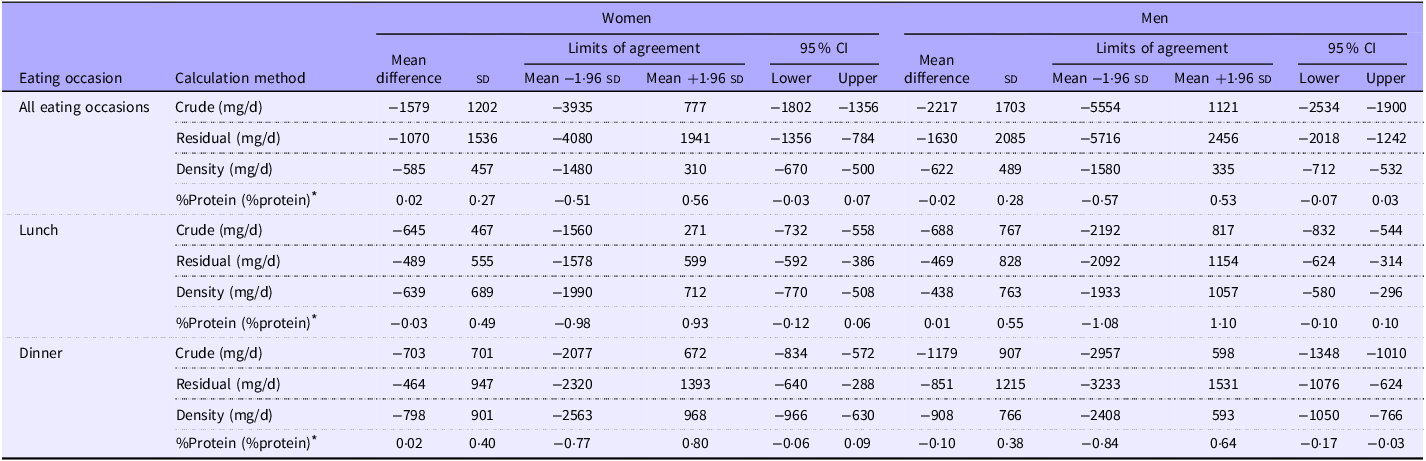
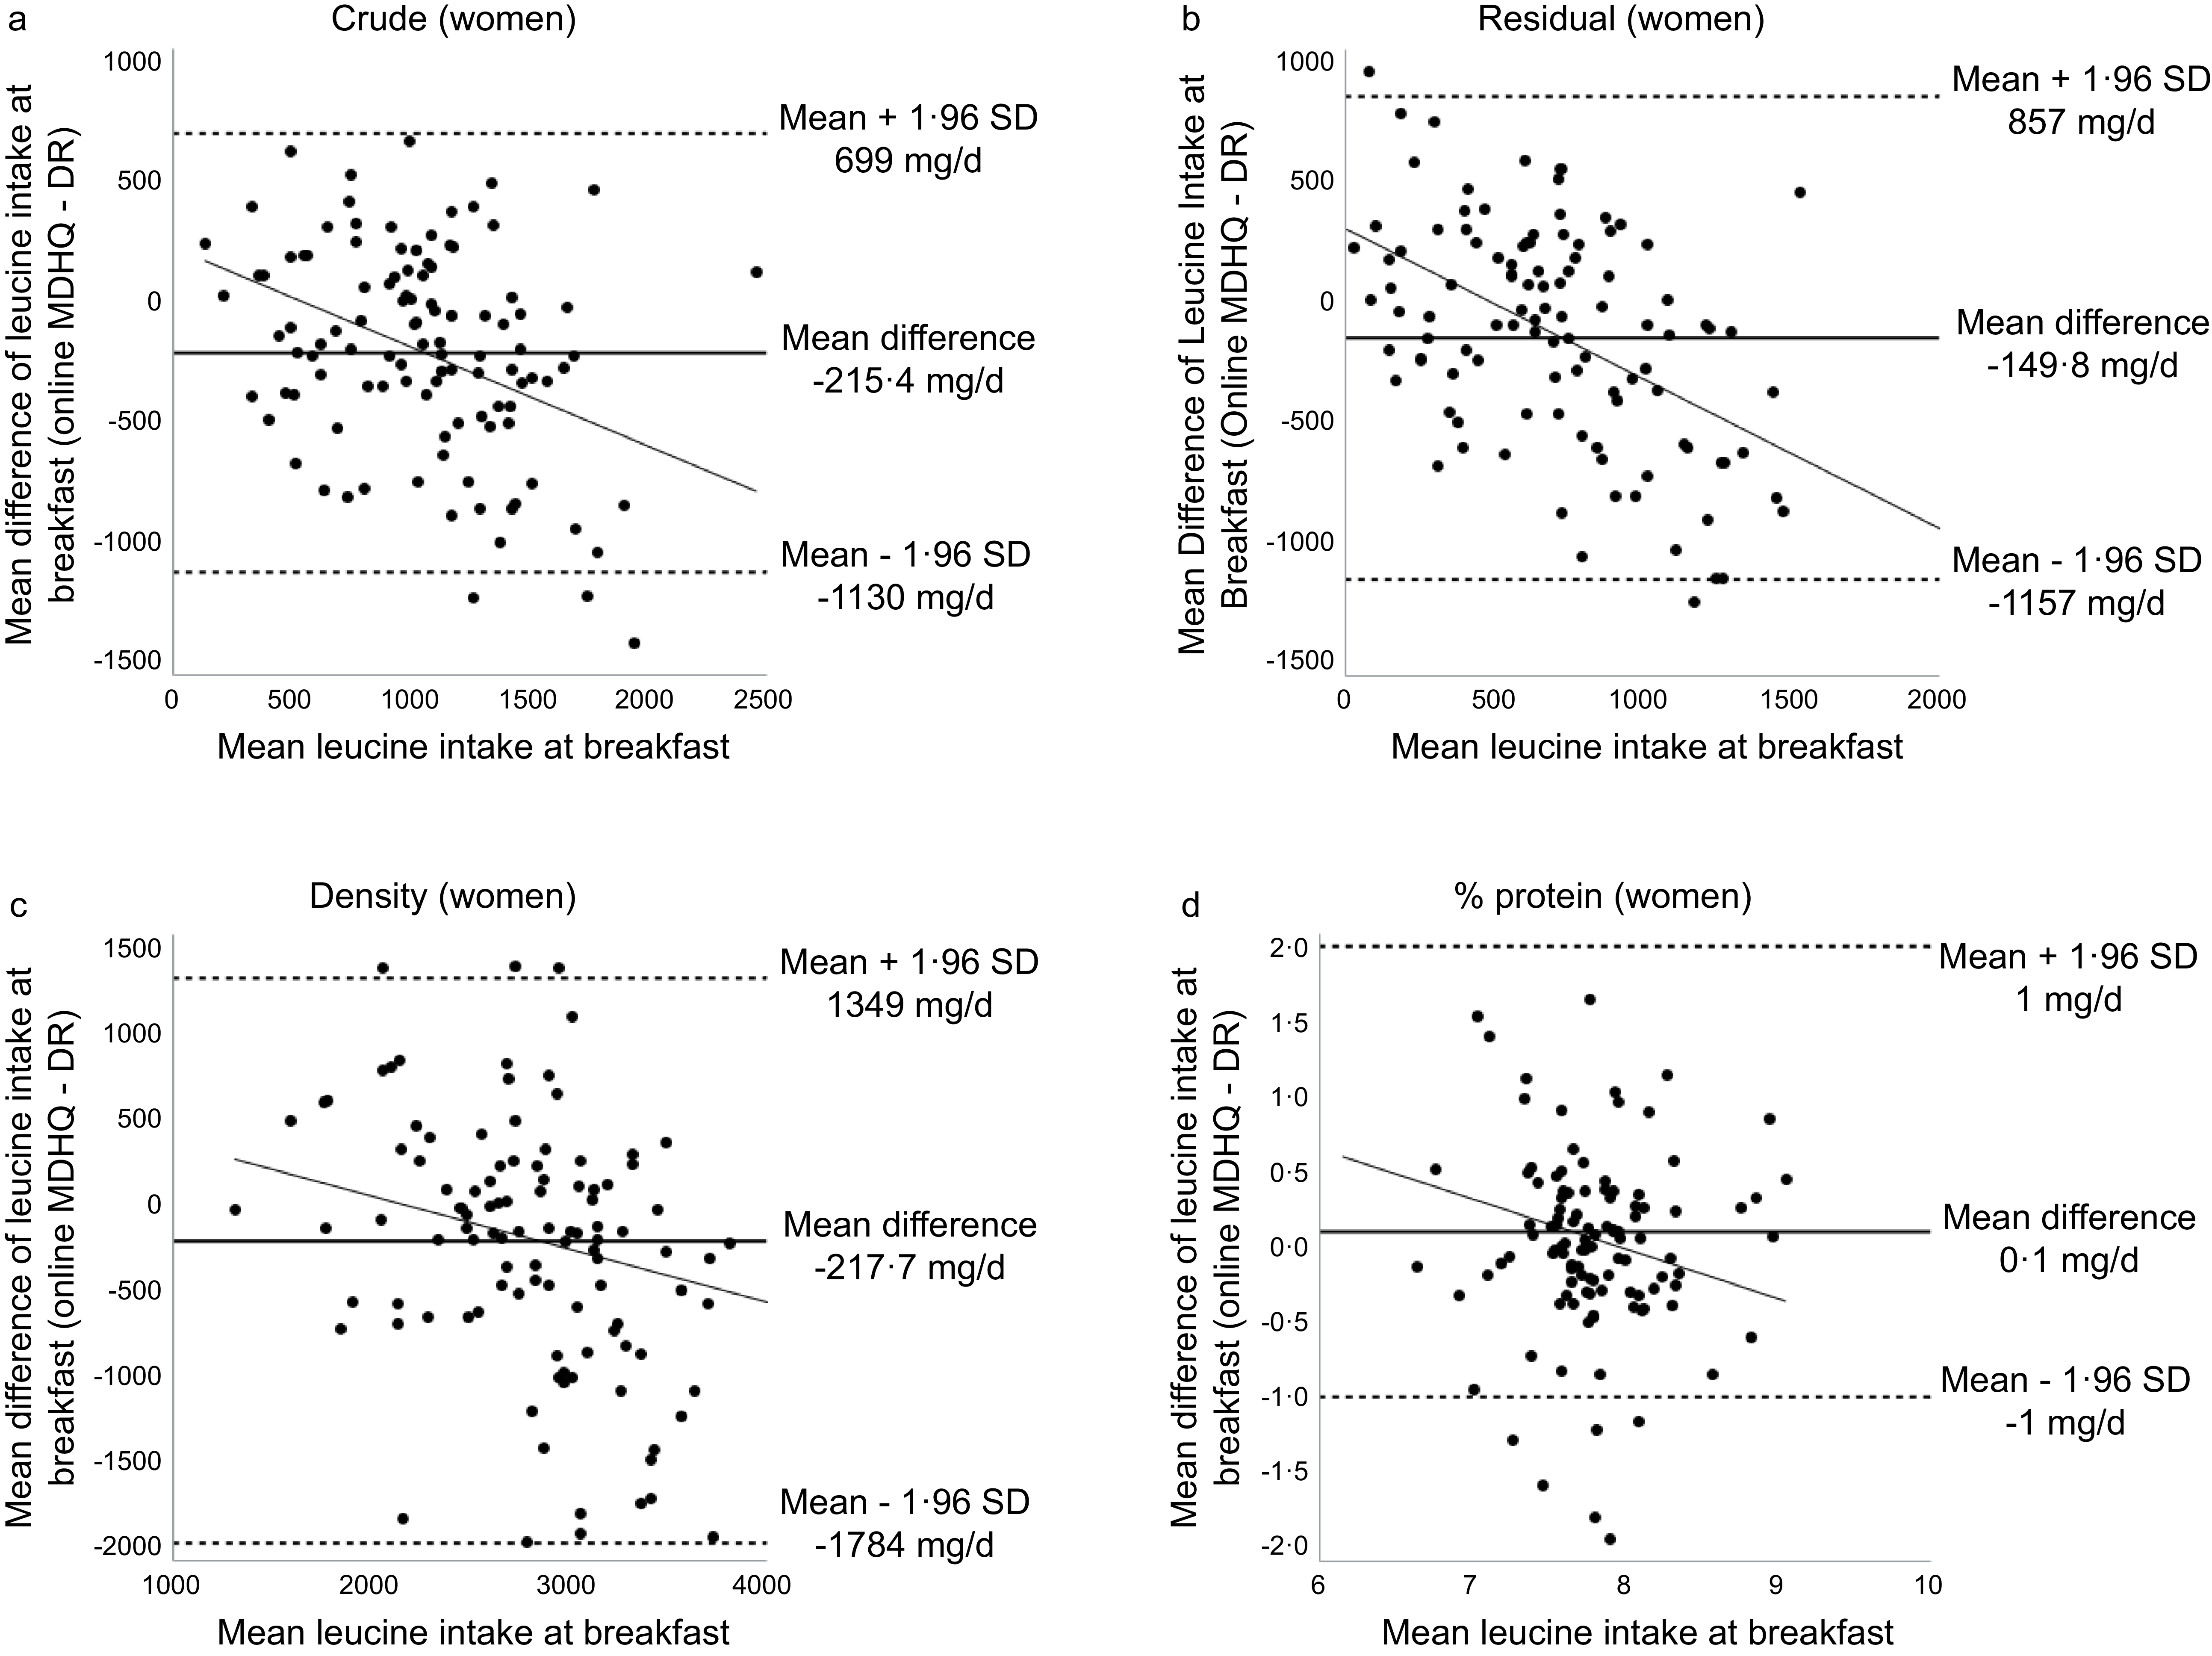
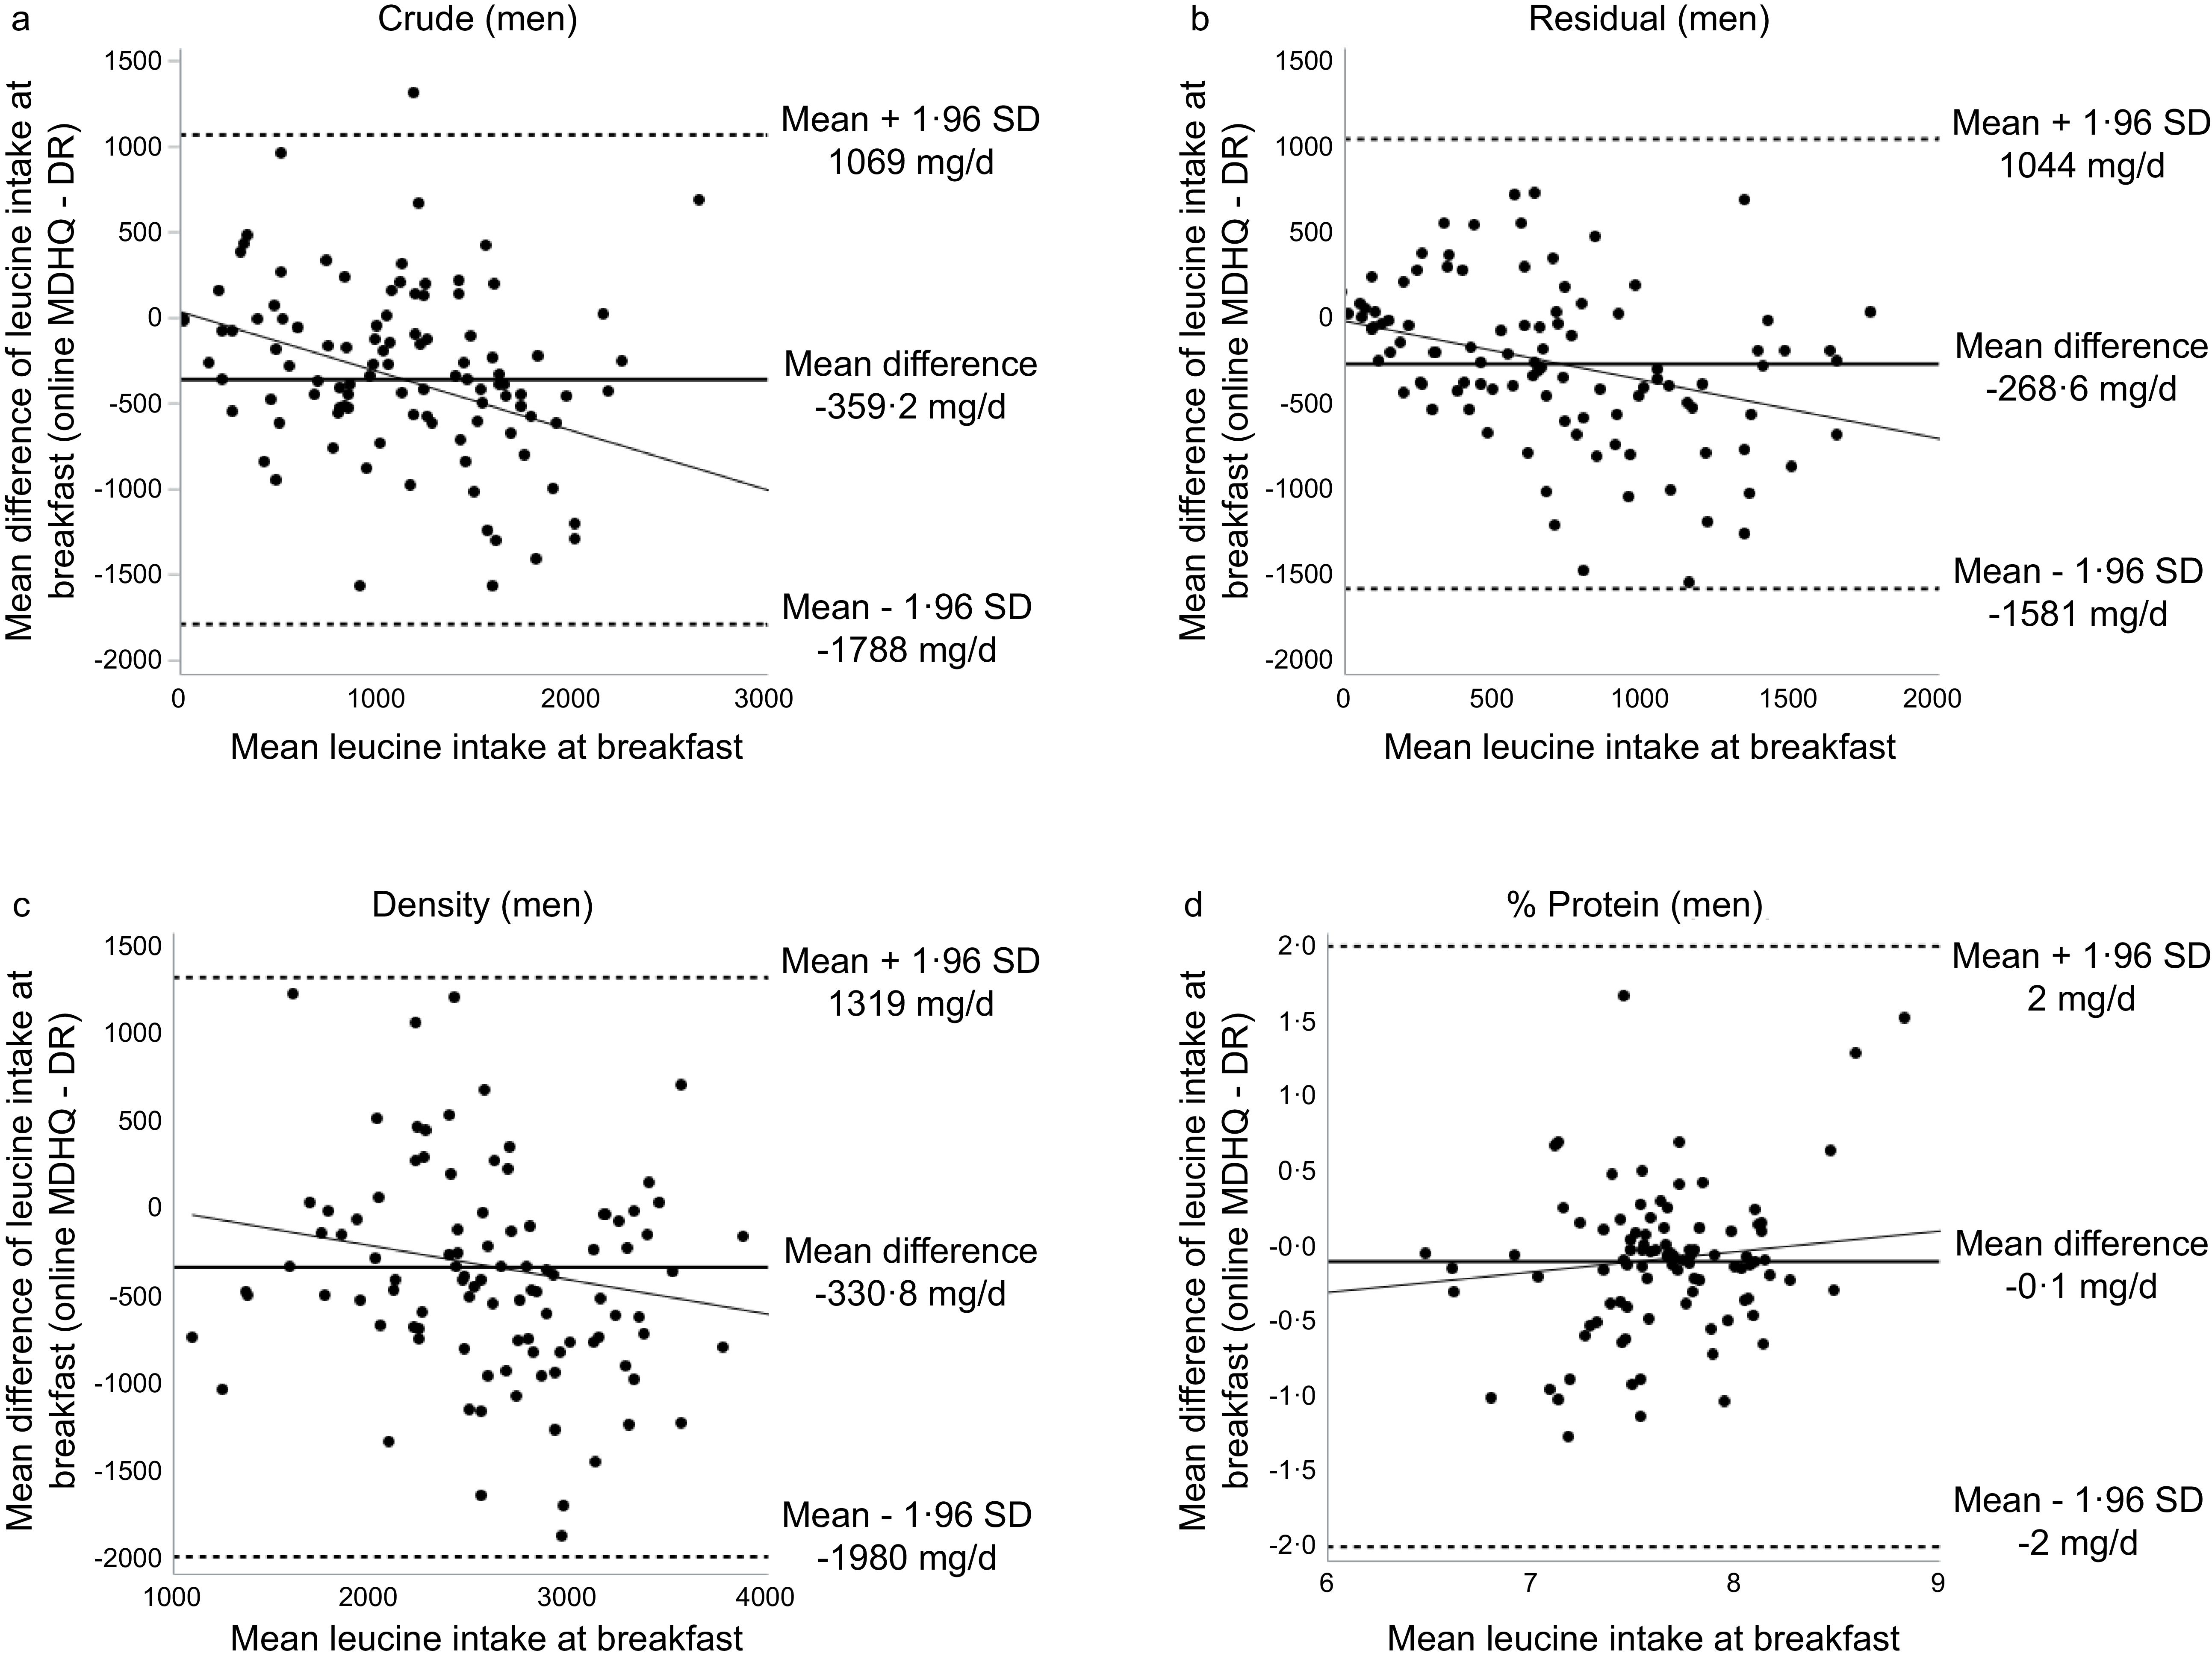
The Bland–Altman analysis of online MDHQ, summarised in Table 5, showed generally wide limits of agreement between the DR and the online MDHQ. Overall, the mean differences were larger in men than in women. Among the calculation models, the crude method yielded the largest mean differences, whereas the %protein method produced the smallest differences and the narrowest limits of agreement in both sexes. However, despite this relatively improved performance, the limits of agreement remained wide and proportional bias was observed, indicating that the %protein method still provides only a limited estimate of amino acid intake at the individual level. As an illustration, Bland–Altman plots of leucine intake at breakfast are presented in Figures 1 and 2 for women and men, respectively. Among women, significant relationships were observed across all calculation methods (crude: P < 0·001; residual: P < 0·001; density: P = 0·001; %protein: P = 0·029). Among men, significant relationships were found in the crude (P = 0·021) and residual (P = 0·045) methods. The significant regression slopes indicated proportional bias, with the online MDHQ tending to underestimate leucine intake at higher intake levels compared with the DR. This pattern was observed across all calculation methods in women and in the crude and residual models in men.
Bland–Altman limits of agreement and 95 % CI for the mean difference of leucine intake estimated by DR and online MDHQ in all eating occasion, lunch and dinner

Table 5. Long description
The table presents Bland-Altman limits of agreement and 95 percent confidence intervals for the mean difference of leucine intake estimated by dietary records and online MDHQ in all eating occasions, lunch, and dinner. It includes data for women and men across various calculation methods: crude, residual, density, and percentage protein. The table has 12 rows and 14 columns, with headers indicating the eating occasion, calculation method, and metrics for women and men. For women, the mean differences range from negative 1579 to 0.02 across methods, with limits of agreement spanning from negative 3935 to 777. For men, the mean differences range from negative 2217 to 0.02, with limits of agreement from negative 5554 to 1121. Notable trends include larger mean differences in men than in women and the crude method yielding the largest mean differences. The percentage protein method shows the smallest differences and narrowest limits of agreement but still indicates wide limits and proportional bias.
DR, dietary records; MDHQ, Meal-based Diet History Questionnaire; SD, Standard deviation; 95% CI, 95% Confidence Interval.
* Calculated as the percentage contribution of each amino acid to the total protein intake during each eating occasion.
Bland–Altman plots of leucine intake agreement at breakfast between the DR and web MDHQ among women calculated by (a) crude values, (b) residual model, (c) density model and (d) % protein values.

Figure 1. Long description
The image contains four Bland-Altman plots comparing the agreement of leucine intake at breakfast between dietary records (DR) and web-based MDHQ among women. Each plot represents a different model: (a) crude values, (b) residual model, (c) density model, and (d) percentage protein values. The x-axis of each plot shows the mean leucine intake at breakfast, while the y-axis shows the mean difference of leucine intake at breakfast. Each plot includes a line indicating the mean difference and dotted lines representing the mean plus and minus 1.96 standard deviations (SD). In plot (a), the mean difference is -215.4 milligrams per day with SD lines at 699 and -1130 milligrams per day. Plot (b) shows a mean difference of -149.8 milligrams per day with SD lines at 857 and -1157 milligrams per day. Plot (c) indicates a mean difference of -217.7 milligrams per day with SD lines at 1349 and -1784 milligrams per day. Plot (d) shows a mean difference of 0 milligrams per day with SD lines at 1 and -1 milligrams per day. The plots illustrate the variability and agreement of leucine intake measurements across different models.
Bland–Altman plots of leucine intake agreement at breakfast between the DR and web MDHQ among men calculated by (a) crude values, (b) residual model, (c) density model and (d) % protein values.

Figure 2. Long description
The image contains four Bland-Altman plots comparing the mean difference of leucine intake at breakfast between dietary records and web MDHQ among men. Each plot represents a different model: crude values, residual model, density model, and percentage protein values. The x-axis of each plot shows the mean leucine intake at breakfast, while the y-axis shows the mean difference of leucine intake. The plots include lines indicating the mean difference and the limits of agreement (mean plus and minus 1.96 standard deviations). The crude values plot shows a mean difference of -359.2 milligrams per day, the residual model plot shows a mean difference of -268.6 milligrams per day, the density model plot shows a mean difference of -330.8 milligrams per day, and the percentage protein values plot shows a mean difference of -0.1 milligrams per day. Each plot includes scattered data points representing individual comparisons.
Results from the paper version of the Meal-based Diet History Questionnaire
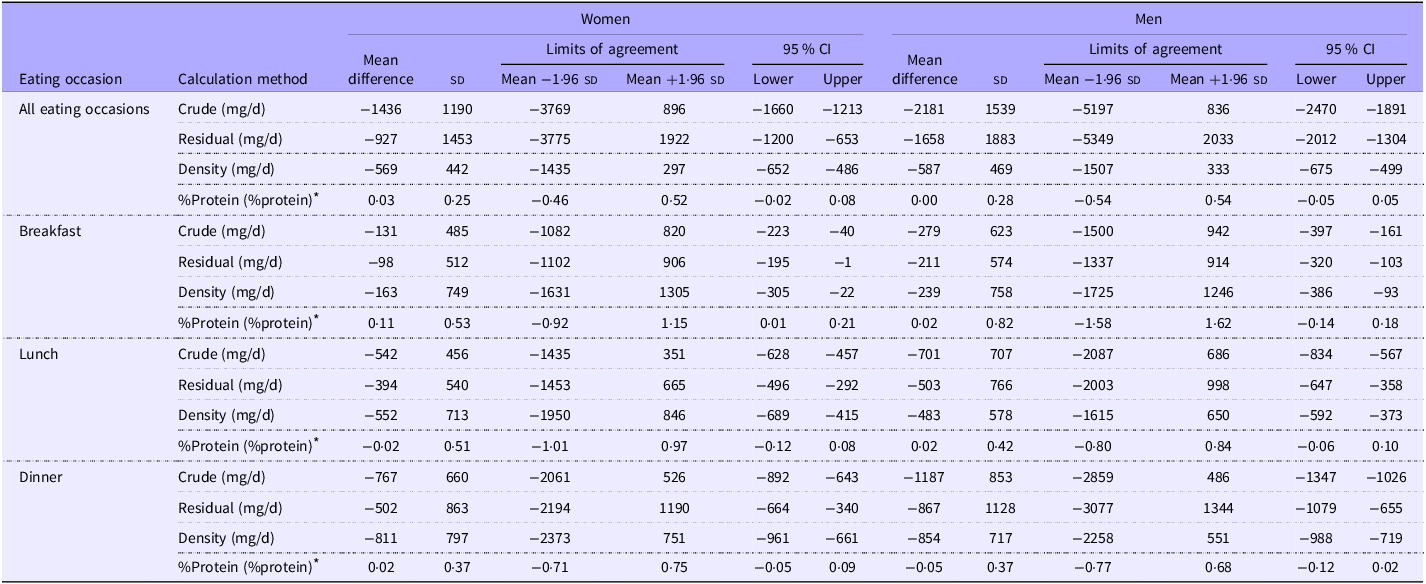
The Bland–Altman analysis of paper MDHQ is summarised in Table 6. Wide limits of agreement were also observed, with the magnitude of underestimation being slightly smaller than that observed for the online MDHQ. Median estimates of amino acid intakes derived from the paper MDHQ are presented in online Supplementary Table S3, while the Spearman correlation coefficients are presented in online Supplementary Table S4. The results for the paper MDHQ were largely consistent with those of the online version, although slightly higher Spearman’s correlation coefficients were observed for the paper MDHQ compared with the DR, except for the crude and residual models in women. Similar to the online MDHQ, breakfast yielded the highest correlation coefficients among all meal occasions for both women and men, with median values of 0·52 (range: 0·24–0·76) and 0·70 (range: 0·34–0·85), respectively. The strongest individual Spearman correlation in both sexes was also observed for aspartic acid intake at breakfast when calculated using the %protein method. Similar to the online MDHQ, breakfast yielded the highest correlation coefficients among all meal occasions for both women and men. For the CCC, the values were also consistently lower than the Spearman correlation coefficient with median CCC of 0·29 (range 0·12–0·49) in women and 0·18 (range 0·09–0·52) in men for all eating occasions (data not shown).
Bland–Altman limits of agreement and 95 % CI for the mean difference of leucine intake estimated by DR and paper MDHQ in all eating occasion, breakfast lunch and dinner

Table 6. Long description
The table presents BlandAltman limits of agreement and 95 percent confidence intervals for the mean difference of leucine intake estimated by dietary records and paper MDHQ in women and men across different eating occasions. The table has 12 rows and 14 columns. The columns are labeled as Eating occasion, Calculation method, Women Mean difference, Women Limits of agreement Mean, Women Limits of agreement 95 percent CI Lower, Women Limits of agreement 95 percent CI Upper, Men Mean difference, Men Limits of agreement Mean, Men Limits of agreement 95 percent CI Lower, and Men Limits of agreement 95 percent CI Upper. The rows are labeled as All eating occasions Crude milligrams per day, All eating occasions Residual milligrams per day, All eating occasions Density milligrams per day, All eating occasions percentage protein percentage protein, Breakfast Crude milligrams per day, Breakfast Residual milligrams per day, Breakfast Density milligrams per day, Breakfast percentage protein percentage protein, Lunch Crude milligrams per day, Lunch Residual milligrams per day, Lunch Density milligrams per day, Lunch percentage protein percentage protein, Dinner Crude milligrams per day, Dinner Residual milligrams per day, Dinner Density milligrams per day, and Dinner percentage protein percentage protein. The table shows the mean difference, limits of agreement mean, and 95 percent confidence intervals for leucine intake estimated by dietary records and paper MDHQ in women and men for all eating occasions, breakfast, lunch, and dinner. The data indicates the magnitude of underestimation and the wide limits of agreement observed.
DR, dietary records; MDHQ, Meal-based Diet History Questionnaire; SD, Standard deviation; 95% CI, 95% Confidence Interval.
* Calculated as the percentage contribution of each amino acid to the total protein intake during each eating occasion.
Discussion
Using the DR as the reference method, this study examined the relative validity of the online and paper MDHQ for assessing total and meal-specific amino acid intakes. Median intakes estimated by the MDHQ differed significantly from those obtained using the DR for most amino acids. The MDHQ demonstrated limited relative validity for ranking individuals according to their total and meal-specific (breakfast, lunch and dinner) amino acid intakes, with weaker performance observed for snacks. The CCC also indicated limited agreement between the MDHQ and DR. In addition, its ability to estimate absolute intakes at the individual level was limited, consistent with the observed differences in median intakes and the presence of proportional bias.
The observation that median amino acid intakes estimated by the MDHQ tended to be lower than those derived from weighed DR is consistent with findings from previous validation studies. For instance, a study evaluating the validity of the DHQ reported that mean intakes of almost all amino acids estimated by the DHQ were significantly lower than those obtained from the DR for energy-adjusted values in both sexes(Reference Suga, Asakura and Sasaki14). Similarly, research assessing the validity of FFQ in estimating amino acid intake found that amino acid intakes were slightly underestimated by the FFQ compared with weighed DR(Reference Ishihara, Todoriki and Inoue10,Reference Iwasaki, Ishihara and Takachi11) . Taken together, these findings indicate that the underestimation of amino acid intake is a common limitation of self-administered dietary questionnaires. The lower energy intake estimates observed for both the online and paper MDHQ compared with the 4-d weighed DR may reflect inherent differences between assessment methods. The MDHQ is a structured questionnaire that relies on predefined food items and standardised portion size assumptions, which may not fully capture all foods consumed or individual variations in portion sizes. In contrast, the weighed DR, conducted over multiple non-consecutive days, provides a more detailed and prospective assessment of actual intake and is less dependent on memory and fixed response options. Additionally, participants may have underreported certain foods or overlooked items when completing the MDHQ, contributing to the lower energy estimates.
In this study, the online MDHQ showed median correlation coefficients for total amino acid intake of 0·43 (crude), 0·44 (residual) and 0·35 (%protein) in women and 0·31 (crude), 0·32 (residual) and 0·35 (%protein) in men. In comparison, the DHQ reported values of 0·27 (crude), 0·42 (energy-adjusted) and 0·32 (%protein) in women and 0·33 (crude), 0·32 (energy-adjusted) and 0·43 (%protein) in men(Reference Suga, Asakura and Sasaki14). Another study among healthy Japanese adults with normal weight and no dietary restrictions reported median Spearman’s correlation coefficients of 0·35 (crude) and 0·38 (residual) in women and 0·28 (crude) and 0·37 (residual) in men when FFQ data were compared with 14-d DR(Reference Okada, Iso and Ishihara12). These comparisons indicate that the online MDHQ demonstrates a level of validity for ranking amino acid intake broadly comparable to that of both the DHQ and FFQ, while offering advantages such as fewer items, assessment by meal type and shorter completion time, with correlation coefficients falling within a similar range. Similar to the DHQ and FFQ, the online MDHQ also tended to show better performance in women than in men, suggesting that its relative validity is consistent with the patterns observed in other established dietary questionnaires(Reference Okada, Iso and Ishihara12,Reference Suga, Asakura and Sasaki14) .
To our knowledge, no previous studies have examined the validity of amino acid intake at the level of individual meal types. In the present analysis, the ability of the online MDHQ to rank individuals varied across meal types, showing the highest validity for breakfast, limited validity for lunch and poor validity for dinner and snack occasions. These findings suggest that the online MDHQ is more effective at ranking individuals based on breakfast intake than on other meal occasions. This may be attributed to the simpler and more consistent composition of breakfast meals, which are often easier to recall and report accurately due to their routine nature and shorter time interval between consumption and recording. Similar observations have been reported in previous studies, where nutrient intake at breakfast demonstrated higher validity than at lunch or dinner, likely due to lower variability and fewer complex mixed dishes(Reference Murakami, Shinozaki and Livingstone17,Reference Murakami, Shinozaki and Livingstone38) . In contrast, lower correlations at lunch and dinner, particularly among men, may reflect difficulties in capturing more diverse meal compositions, larger portion sizes and foods consumed outside the home(Reference Iwasaki, Ishihara and Takachi11,Reference Murakami, Livingstone and Shinozaki39,Reference Murakami, Livingstone and Sasaki40) .
Importantly, these findings have practical implications for the use of the MDHQ in research on meal-specific dietary patterns. While the MDHQ may provide some utility for ranking individuals based on breakfast intake, its limited validity for other meal occasions suggests that it may not be suitable for investigating the distribution of protein or amino acid intake across the entire day. Given the growing interest in the health effects of meal timing and protein distribution, caution is warranted when applying the MDHQ to such research questions. Overall, the tool appears more appropriate for exploratory or partial assessments of meal-specific intake rather than comprehensive evaluation across all eating occasions.
Bland–Altman analysis in the present study showed that the limits of agreement between the MDHQ and DR were generally wide, with larger mean differences observed in men than in women. Among the calculation models, the crude method yielded the largest mean differences, whereas the %protein method produced the smallest differences and the narrowest limits of agreement in both sexes. These findings indicate that the MDHQ has limited precision at the individual level but provides relatively better estimates when amino acid intake is expressed as a percentage of total protein. A comparable trend was reported for the DHQ, which also showed larger mean differences in men than in women, wide limits of agreement for crude and energy-adjusted values and smaller differences for %protein(Reference Suga, Asakura and Sasaki14). Both instruments exhibited proportional bias, particularly for crude values, with a tendency to underestimate intake at higher consumption levels. Taken together, these results suggest that the MDHQ demonstrates a similar level of individual-level validity to that of the DHQ, although both questionnaires remain limited in their ability to accurately capture absolute amino acid intake at the individual level.
In this study, the results for amino acid intake estimated by the online and paper MDHQ were generally comparable, although the Spearman correlation coefficients and CCC with the DR were higher for the paper MDHQ than for the online MDHQ. This difference is unsurprising, as the paper MDHQ was completed after the DR, whereas the online MDHQ was completed beforehand. Similar patterns have been observed in three previous validation studies of the MDHQ(Reference Murakami, Shinozaki and Kimoto16–Reference Murakami, Shinozaki and Kimoto18), all of which reported higher correlations for the paper version than for the online version. While the online questionnaires offer advantages in administration efficiency and cost-effectiveness, the paper formats remain useful in real-world contexts where some participants may be unwilling or unable to complete online surveys. A direct comparison of amino acid intake estimates between the two MDHQ formats would therefore be valuable for future research but was beyond the scope of the present study.
Several limitations of this study should be acknowledged. First, the participants may not represent the general Japanese population and may have included a higher proportion of health-conscious or higher socio-economic status individuals. However, several characteristics of the present participants were comparable to those observed in a nationally representative sample. For instance, the prevalence of current smokers and the mean values of height, weight and BMI were similar to national data(41). Therefore, although further research is needed in more diverse and representative populations, these similarities suggest that the impact of sample bias on the present findings was likely limited. Regarding health status, participants were limited to generally healthy individuals, and those with conditions requiring dietary modification or medical treatment were excluded. Therefore, the findings may not be directly applicable to populations with chronic diseases, such as type 2 diabetes or other conditions that may substantially influence dietary behaviour. Future studies including individuals with a broader range of health conditions would be valuable to assess the generalisability of these findings. Second, although the weighed DR was used as the reference method, it is not free from measurement error, particularly due to potential misreporting or behavioural changes during the recording period(Reference Cade, Thompson and Burley23). Nevertheless, weighed DR are widely regarded as the gold standard for validating dietary assessment questionnaires, as the errors associated with weighed DR are generally less correlated with those of questionnaire-based methods compared with memory-based dietary tools(Reference Cade, Thompson and Burley23,Reference Cui, Yang and Qijun42) . That said, we cannot entirely exclude the possibility that both the DR and the MDHQ shared some sources of bias, which could have influenced the observed outcomes, including correlation coefficients. Third, because the MDHQ is designed to assess dietary intake over the preceding month, it does not capture intra-individual variation that occurs throughout the year (e.g. seasonal or temporal changes in dietary habits). However, previous studies have shown that a single administration of month-based dietary questionnaires, such as the DHQ and Brief-type self-administered Diet History Questionnaire (BDHQ), may reasonably reflect habitual dietary intake over longer periods (e.g. 1 year)(Reference Kobayashi, Murakami and Sasaki29–Reference Murakami, Livingstone and Fujiwara31,Reference Murakami, Sasaki and Takahashi43) . These findings may therefore be applicable to the MDHQ. In addition, the assessment order (online MDHQ, followed by the 4-d weighed DR, and then the paper MDHQ) was designed to prioritise the examination of relative validity of online MDHQ, while completing the DR before the paper MDHQ may have increased participants’ awareness of their dietary intake and influenced responses to the subsequent paper MDHQ. This potential effect of increased awareness may have affected comparability between the online and paper MDHQ and should be considered a limitation for examining the relative validity of paper MDHQ. Fourth, although sex-stratified analyses were conducted to explore potential differences between men and women, the sample size within each sex was relatively limited given the large number of comparisons performed across multiple amino acids, meal occasions and adjustment models. This resulted in a substantial number of statistical tests, which may increase the likelihood of type I errors (false positives). Therefore, some of the observed should be interpreted with caution. Future studies with larger sample sizes and more focused analytical approaches are warranted to confirm these findings and to better evaluate potential sex-specific differences. Finally, a considerable number of food items with missing amino acid data in the STFCJ (2020)(19) required the use of alternative data sources or estimation methods. Although systematic approaches were applied to supplement these values – including the use of biologically similar foods, foreign food composition databases and ingredient-based calculations(Reference Suga, Murakami and Sasaki20) – these imputations may have introduced some degree of uncertainty into the amino acid intake estimates.
In conclusion, compared with the 4-d weighed DR, the online MDHQ showed limited relative validity for ranking individuals according to their total and meal-specific amino acid intakes, with weaker performance observed for snacks. Median intake estimates were generally lower than those derived from the DR, and the presence of proportional bias further indicates notable limitations in both ranking and absolute estimation. The CCC also indicated limited agreement between the MDHQ and DR. Although the performance of the MDHQ was broadly comparable to that of established dietary questionnaires such as the DHQ and FFQ, its precision in estimating absolute intakes at the individual level was limited, as reflected by the wide limits of agreement in the Bland–Altman analysis. Taken together, these findings suggest that the MDHQ may have limited utility for ranking individuals by amino acid intake across meals in epidemiological studies, and its results should be interpreted with caution. Nevertheless, as one of the first dietary questionnaires designed to assess meal-based consumption, the MDHQ provides a novel approach for examining meal-specific dietary patterns and may offer useful insights in epidemiological studies when its limitations are appropriately considered. Future research is warranted to evaluate the applicability of the MDHQ in larger and more diverse populations and to assess its usefulness in examining longitudinal dietary patterns, seasonal variations and associations with health outcomes.
Supplementary material
For supplementary material/s referred to in this article, please visit https://doi.org/10.1017/S0007114526107612
Acknowledgements
The authors would like to thank the research dietitians who conducted data collection:
Tamotsu Noshiro*, Fuki Kudo, Erika Iwasaki, Kazue Fukushi and Masako Shimooka (Hokkaido); Akiko Sato, Hiromi Kawaguchi, Yuka Takeda and Akiko Matsunaga (Yamagata); Yoko Isaka, Yuka Ota, Hanayo Kadoi, Akiko Seki, Yuko Takano, Toshie Nakayama, Ayami Murakami and Masako Yamaguchi (Ibaraki); Kaoru Goto, Yuka Inaba, Akiko Kato and Miki Hori (Saitama); Hitomi Okahashi, Shinobu Matsui and Yurina Arai (Tokyo); Suzuyo Takeda, Kumiko Ono, Yayoi Hayashi, Kazumi Takagi, Kaori Otomo and Mayuko Sakitsu (Kanagawa); Masako Koike, Reiko Kunimatsu, Keiko Kuribayashi, Keiko Hirayama and Eriko Kiryuu (Niigata); Kazumi Horiguchi, Kotomi Kishikawa, Yasuko Ishii and Miyuki Yokokoji (Yamanashi); Masako Tanaka, Hideko Uchibayashi, Tomoko Suzuki, Ryoko Mizuno and Emi Kajiura (Aichi); Yumiko Noutomi, Atsuko Toyokawa, Yasuka Tabuchi and Junko Ikukawa (Osaka); Sachiko Terao, Mari Matsuda, Mieko Imanaka and Noriyuki Kubota (Okayama); Yoko Fujii, Izumi Hase, Aki Funada and Tomomi Saya (Hiroshima); Kyoko Kaku, Kiyoko Katayama, Miki Hamachi, Yoshiko Yahagi and Chizuru Shibata (Fukuoka); Yuko Soga, Kayoko Iwamoto, Mika Moribe, Miki Hamada and Kaori Nakamura (Oita).
The authors also thank the research team staff at the survey centre (University of Tokyo): Akiko Hara, Keika Mine and Hiroko Onodera. * Deceased.
The authors are also grateful to Dr Hitomi Suga for providing the amino acid database.
This study was funded in part by the Institute for Food and Health Science, Yazuya Co. Ltd.
The Institute for Food and Health Science, Yazuya Co. Ltd, had no role in the design, analysis or writing of this manuscript.
K. M. contributed to the concept and design of the survey and data collection and management, formulated the research, analysed and interpreted the data, prepared the first draft of the manuscript and had primary responsibility for the final content; N. S. contributed to the concept and design of the survey and data collection and management and provided critical input into the final draft of the manuscript; W. L. analysed the data and prepared the manuscript; N. K. contributed to the design of the survey and data collection and management; and S. M. and S. S. contributed to the design of the survey and managed the study-field establishment, recruitment and fieldwork. All authors have read and agreed to the final version of the manuscript.
There are no conflicts of interest.


 Open access

