


Introduction
The rostra of living toothed whales (Odontoceti) vary in proportions from brevirostral species that have a short, broad rostrum (e.g., Kogia spp.) to longirostrine species that have an elongate, slender rostrum (e.g., Platanista). In particular, the paraphyletic extant “river dolphins,” including Platanista, Inia, Pontoporia, and Lipotes, have long been considered as exemplars of longirostrine morphology. The broad similarities of their longirostry with other aquatic tetrapods, such as gavialid crocodiles, likely reflects ecological convergence for feeding on certain prey or in similar ways within these coastal and riverine environments (Pilleri Reference Pilleri1980; Taylor Reference Taylor1987; Walmsley et al. Reference Walmsley, Smits, Quayle, McCurry, Richards, Oldfield, Wroe, Clausen and McHenry2013; McCurry et al. Reference McCurry, Evans, Fitzgerald, Adams, Clausen and McHenry2017a,Reference McCurry, Fitzgerald, Evans, Adams and McHenryb). Trade-offs between structural and hydrodynamic demands have been responsible for some of the variation seen in the snout shape of living crocodilians and toothed whales. Robust cranial morphologies (such as that of Orcinus) allow for stronger skulls, which are useful for catching and processing large or hard prey, but prevent the rostrum from being swept through the water with speed; at the other end of the continuum, elongate skulls (such as that of Inia) allow for speed in catching small agile prey but are not able to withstand the same forces (McHenry et al. Reference McHenry, Clausen, Daniel, Meers and Pendharkar2006; McHenry Reference McHenry2009; Walmsley et al. Reference Walmsley, Smits, Quayle, McCurry, Richards, Oldfield, Wroe, Clausen and McHenry2013; McCurry et al. Reference McCurry, Evans, Fitzgerald, Adams, Clausen and McHenry2017a,Reference McCurry, Fitzgerald, Evans, Adams and McHenryb). Longirostry has evolved multiple times within Odontoceti from mesorostral or brevirostral ancestors (Boessenecker et al. Reference Boessenecker, Fraser, Churchill and Geisler2017).
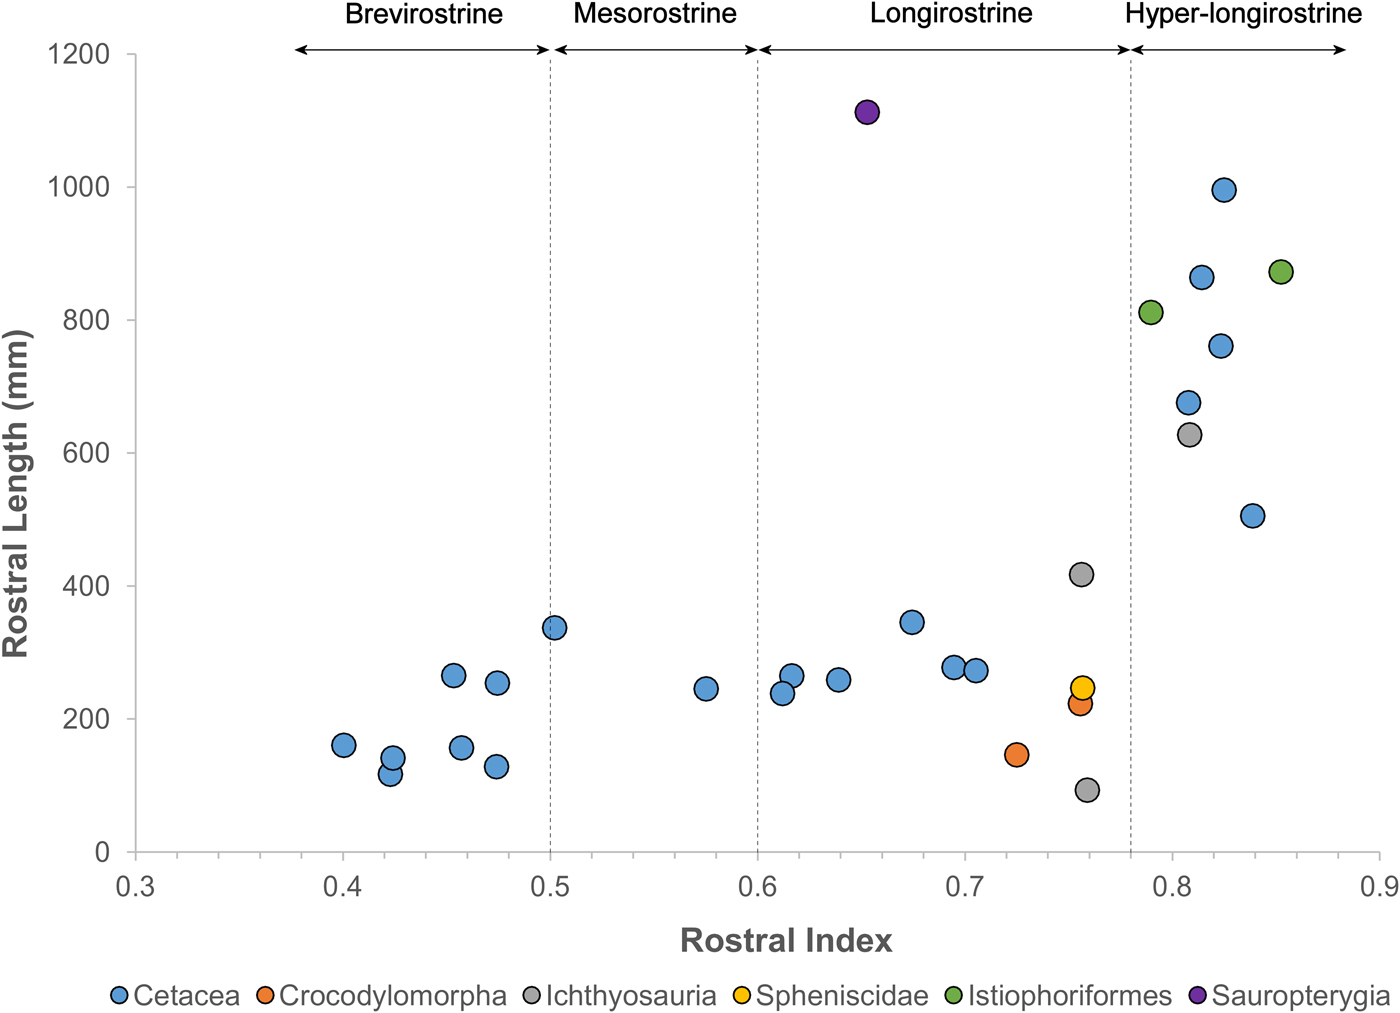
Remarkably, fossil odontocetes belonging to widely unrelated clades possess rostral dimensions that greatly exceed those of comparable extant taxa (Figs. 1 and 2, Table 1, Supplementary Table 1), with rostra >500% the length of the braincase, compared with 180% in the living Amazon river dolphin. These fossil taxa are primarily known from coastal marine deposits. This habitat signal for fossil longirostrine taxa differs strongly from extant longirostrine taxa, which are predominantly found in freshwater river systems. Longirostrine extinct species of platanistids, eurhinodelphinids, and allodelphinids all evolved this morphotype independently during the Miocene.
Lateral (left) and dorsal (right) views of extinct (A–E) and living (F) taxa used in this study, scaled to zygomatic breadth. A, Parapontoporia sternbergi, B, Xiphiacetus bossi, C, Zarhinocetus errabundus, D, Zarhachis flagellator, E, Pomatodelphis inaequalis, and F, Platanista gangetica. Scale bars, 150 mm.

Rostral proportions in odontocetes and other aquatic tetrapods.
Scans used in the study. NMV, Museums Victoria, Melbourne, Australia; USNM, National Museum of Natural History, Smithsonian Institution, Washington, D.C.

The repeated evolution of extremely long snouts in fossil odontocetes raises questions about the mechanics of their feeding and the prevalence of this morphotype in the past. Does the extreme longirostry seen in fossil odontocetes represent an extension of the functional and ecological continuum seen in living species or a previous expansion into a new feeding style? Furthermore, why did this extreme morphotype evolve multiple times in extinct odontocetes but not in living species? Changes in global climate and sea level have the potential to drive to evolution of certain feeding adaptions by altering prey abundances, opening up new areas of niche space, or altering the performance of certain feeding styles. With the rapid change in the current global climate, we need to better understand the effects of this change not just on the structure of ecosystems, but on the function of individual organisms within those ecosystems. If it can be identified that certain feeding morphologies will not be viable in certain abiotic conditions (e.g., reduced or altered performance), then we will better be able to identify at-risk species in a changing environment.
Second moment of area is a geometric property used in beam theory to estimate the load-bearing capabilities of beam-like structures in bending scenarios (Bauchau and Craig Reference Bauchau and Craig2009). Classic studies in functional morphology have applied beam theory to long bones (Brassey et al. Reference Brassey, Margetts, Kitchener, Withers, Manning and Sellers2013), and we argue here that beam theory is especially applicable to extremely longirostrine cetaceans with long neutral axes of the rostrum. This theoretical extension is supported by work on other longirostrine aquatic taxa such as crocodilians and billfish (Walmsley et al. Reference Walmsley, Smits, Quayle, McCurry, Richards, Oldfield, Wroe, Clausen and McHenry2013; Habegger et al. Reference Habegger, Dean, Dunlop, Mullins, Stokes, Huber, Winters and Motta2015). Moreover, ratio of second moment of area of rostral cross sections has been shown to be an important indicator of kinematic behavior in billfish; billfish species with a higher ratio exhibit preference in lateral sweeping, while species with a circular cross section feed by sweeping the rostrum through the water in a variety of directions (Habegger et al. Reference Habegger, Dean, Dunlop, Mullins, Stokes, Huber, Winters and Motta2015). While complex differences in morphology and material properties also influence the mechanical properties of the skull, the beam-like nature of these crania suggests that beam theory will accurately predict the resistance of the rostra to bending (Metzger et al. Reference Metzger, Daniel and Ross2005). Additionally, the ratio of second moment of area is also likely to relate to hydrodynamic performance, as specimens with a higher ratio will have less frontal area during lateral sweeping movements of the rostrum (Pöyhönen et al. Reference Pöyhönen, Keskinen, Hautala and Mälkiä2000).
While some hyper-longirostrine fossil odontocete groups have received systematic attention (Lambert Reference Lambert2005a,Reference Lambertb), the underlying functional morphology of their extreme longirostry has never been examined in detail. Here we examine the morphology and biomechanics of Mio-Pliocene fossil odontocetes using beam theory. We also integrate data on the degree of longirostry with abiotic environmental factors to examine the cause of the repeated evolution of this extreme morphology. In this study, we sought to (1) characterize the degree of longirostry in Mio-Pliocene longirostrine odontocetes relative to extant odontocetes and billfish; (2) calculate second moment of area from rostral cross sections to examine variation in feeding kinematics; and (3) compare the temporal evolution of this morphotype to changes in global temperature and sea level to elucidate possible causal factors driving the evolution of hyper-longirostry.
Materials and Methods
The crania of three species of fossil odontocetes (Pomatodelphis inaequalis, Xiphiacetus bossi, and Zarhachis flagellator) and casts of two other species of fossil odontocete (Parapontoporia sternbergi and Zarhinocetus errabundus) were computed tomography (CT) scanned at the Smithsonian Institution Bio-Imaging Research Center in the Department of Anthropology at the National Museum of Natural History in Washington, D.C. Additionally, we scanned two species of extant river dolphin (Platanista gangetica and Inia geoffrensis) and sourced CT data for two species of extant billfish (Makaira nigricans and Xiphias gladius) (Habegger et al. Reference Habegger, Dean, Dunlop, Mullins, Stokes, Huber, Winters and Motta2015) to provide benchmarks of morphology and feeding behavior. Platanista gangetica exhibits a dorsoventrally reinforced rostral cross section and shows preference for swimming sideways while catching fish using fast closure of the jaws (Herald et al. Reference Herald, Brownell, Frye, Morris, Evans and Scott1969; Pilleri Reference Pilleri1980). In contrast, X. gladius exhibits dorsoventral flattening in cross section and feeds using a lateral sweeping motion (Scott and Tibbo Reference Scott and Tibbo1968).
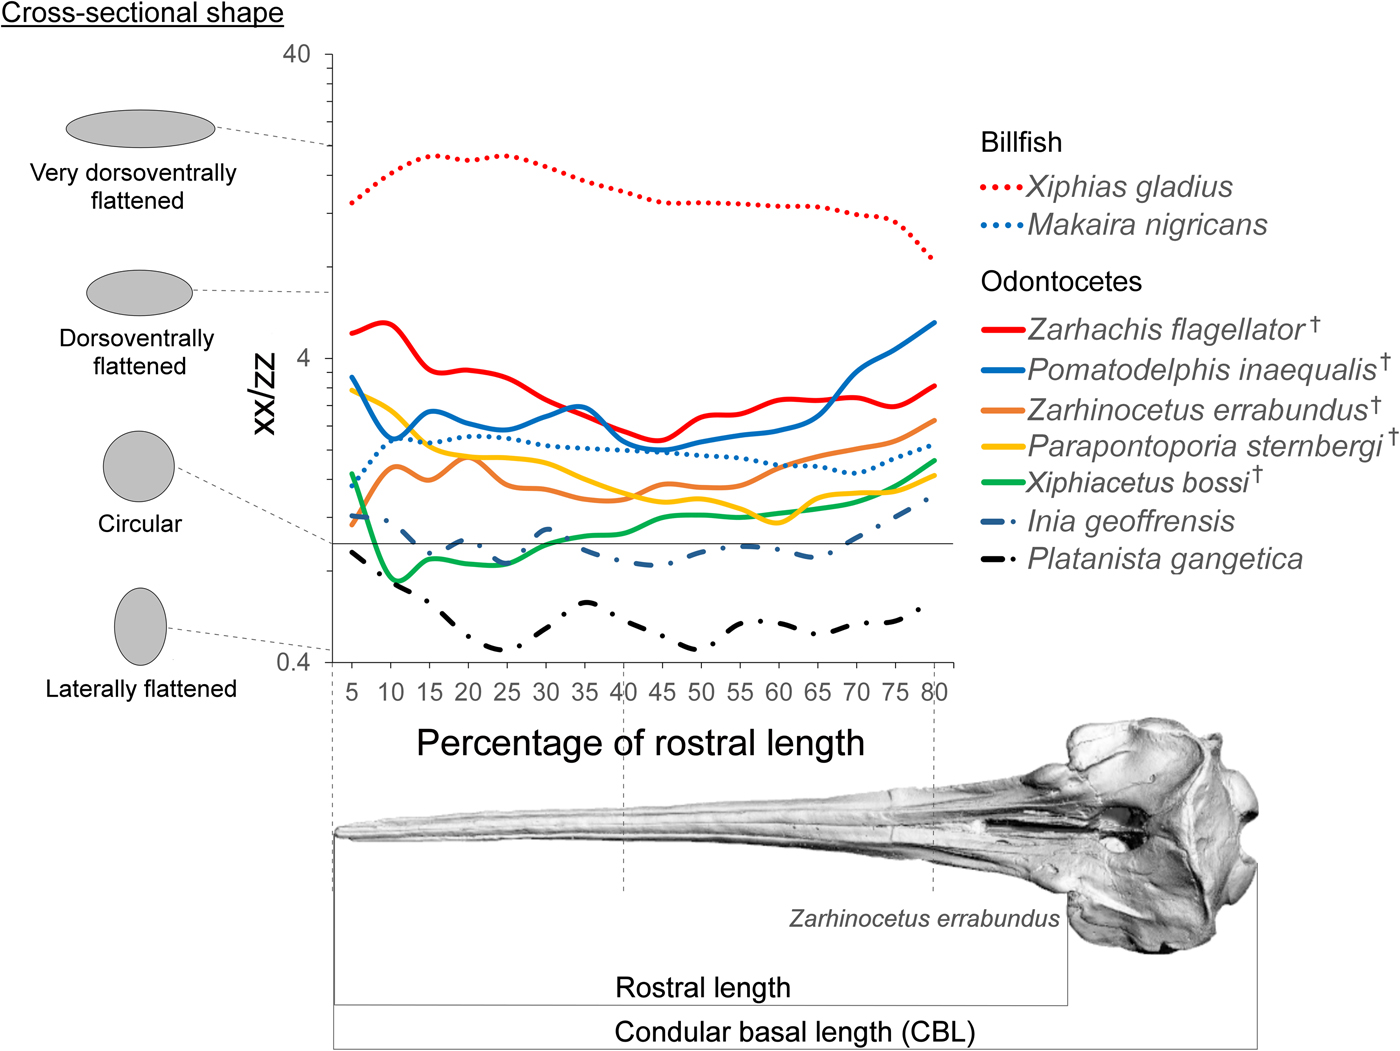
While we cannot completely rule out deformation of the fossils, they do not appear to exhibit serious signs of compaction or tectonic deformation and are morphologically consistent with other specimens of the same species. Surface models were created from CT data in Mimics v. 15. All internal morphological features were removed from the models, leaving only the external morphology to make them comparable to the casts. While this method ignores internal differences in morphology, these results (Supplementary Fig. 1 B) appear to be comparable to those incorporating internal structure (Supplementary Fig. 1 A). The surface models were sectioned in a plane perpendicular to the basal skull axis (x-axis of Fig. 3) every 5% between the anterior tip of the rostrum and 80% of the distance to the antorbital notch. Second moment area was taken in lateral (xx) and dorsal (zz) axes using the software package Rhino (v. 5; McNeel, Seattle, WA) with the area centroid of each cross section as the origin. We then calculated a ratio (xx/zz) that represents the degree of reinforcing in the mediolateral direction of each cross section of the rostrum. An average rostral index was calculated for each species by dividing condylobasal length by rostral length (antorbital notch to the end of the rostrum) and plotted onto a phylogeny of the group taken from Boersma and Pyenson (Reference Boersma and Pyenson2016). The measurements are depicted in Figure 5. A lower rostral index indicates that the skull has a longer rostrum compared with its total length. Rostral index was measured from Z. errabundus (N = 1), P. gangetica (N = 6), P. inaequalis (N = 1), Z. flagellator (N = 1), X. bossi (N = 1), P. sternbergi (N = 1), Lipotes vexillifer (N = 2), Pontoporia blainvillei (N = 20), and I. geoffrensis (N = 8).
Rostral shape. Ratio of second moment of area in the lateral axis (xx) to the dorsoventral axis (zz) at axial sections along the rostrum. Idealized cross-sectional shapes are shown along the spectrum of this axis. The x-axis defines the position of the cross section from 5% to 80% of total rostrum length. † = extinct taxon.
Results
Hyper-longirostry
The rostrum of the late Miocene–Pliocene P. inaequalis is more than five times the length of its braincase. These taxa exhibit rostral index values of in the same range as billfish, but far in excess of those of living odontocetes (Fig. 2). Here we define brevirostrine taxa as those with rostral index values bellow 0.5, mesorostrine taxa as those with rostral index values between 0.5 and 0.6, and longirostrine taxa as those with rostral index values between 0.6 and 0.78. Additionally, we draw a new category of hyper-longirostrine taxa with rostral index values above 0.78. These boundaries classify living odontocetes into three approximately equal-sized categories but then draw a new classification to only include billfish-like odontocetes and ichthyosaurs (Fig. 2). Hyper-longirostrine fossil odontocetes also exhibit polydonty, mostly in proportion to rostral elongation. For example, the mid-Miocene Z. flagellator has as many as 350 alveoli in the cranium and mandible combined. The mid-Miocene eurhinodelphinid X. bossi provides an exception to this otherwise prevalent pattern: its rostrum lacks alveoli and dentition in the anterior third of its length, which corresponds to the relative shortening of the mandible. This configuration, in which the rostrum is considerably longer than the mandible and alveoli are missing from the anterior section of the upper jaw, represents a remarkable convergence with extant billfish and some Mesozoic ichthyosaurs (e.g., Eurhinosaurus) (Fig. 2).
Cross-sectional Shape
The second of moment of area measures calculated here depict a spectrum of rostral morphology; some of the hyperelongate fossil taxa are more circular in cross section (e.g., X. bossi and Z. errabundus), while others are mediolaterally reinforced (Z. flagellator and P. inaequalis) (Fig. 3). Although Z. flagellator and P. inaequalis fossil taxa do not possess a rostrum that is as mediolaterally reinforced as swordfishes, they do exhibit a rostrum that is more mediolaterally reinforced than the round cross section of blue marlins and are certainly very morphologically different from extant odontocetes (Fig. 3). Despite not being as dorsoventrally–mediolaterally reinforced (a specialization for lateral sweeping) as swordfishes (X. gladius), taxa with mediolaterally reinforced rostra such as Z. flagellator and P. inaequalis likely fed using lateral sweeps of the jaws (Fig. 4).
Morphological and behavioral spectra organized along skull ecomorphology. Left, rostral cross-sectional shape. Center left, examples of odontocetes placed against cross-sectional shape. Center right, examples of billfish placed against cross-sectional shape. Right, spectrum of feeding behavior from dorsoventral sweeps or jaw opening to lateral sweeps when catching prey. † = extinct taxon.

Environmental Context of Hyper-longirostry Evolution
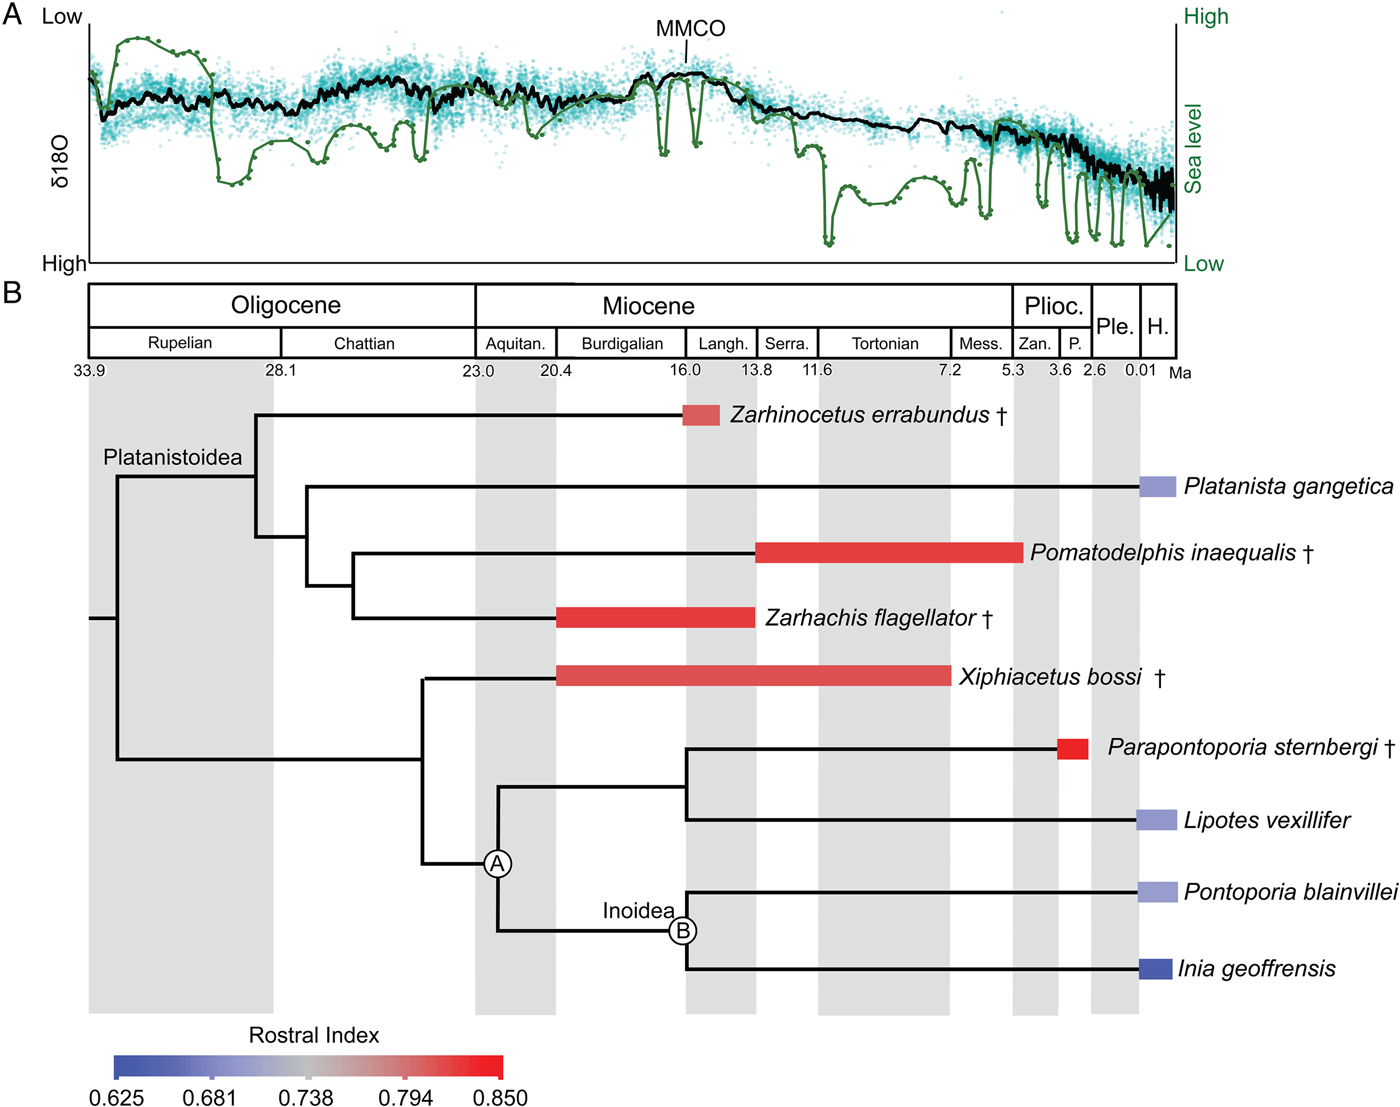
Inferred stratigraphic ranges of hyper-longirostrine odontocetes, compared against global sea-level and temperature changes, indicate that many of these taxa coexisted during the mid-Miocene climatic optimum. This time frame corresponds to the maximum richness in the history of cetaceans (Uhen and Pyenson Reference Uhen and Pyenson2007), although this high taxonomic richness must have been ecologically partitioned within a narrow range of body sizes, because the body-size maxima at the time were still much smaller than the largest taxa known today (Pyenson and Vermeij Reference Pyenson and Vermeij2016). Specifically, longirostrine fossil taxa in our study all show rostral indices above 0.78 (Fig. 5) and derive from separate lineages of odontocetes (e.g., Allodelphinidae, Platanistidae, Eurhinodelphinidae). The long-snouted lineages persisted from the early Miocene through the late Miocene until the end of the Pliocene, coincident with the onset of major glacial–interglacial episodes in the Northern Hemisphere (Zachos et al. Reference Zachos, Dickens and Zeebe2008).
Sea-level and climate (A) and odontocete rostral proportions (B) through time. In A, δ18O (black line) used as a proxy for global temperature (high δ18O reflects lower temperatures; Zachos et al. Reference Zachos, Dickens and Zeebe2008) and sea-level (green line) from Haq et al. (Reference Haq, Hardenbol and Vail1987). B, Mean rostral index for each taxon is averaged across the stratigraphic range. Time-calibrated phylogenetic tree based on consensus cladogram in Boersma and Pyenson (Reference Boersma and Pyenson2016). Stratigraphic-range data derive from published accounts for each taxon, including global ranges. Geologic timescale based on Cohen et al. (Reference Cohen, Finney, Gibbard and Fan2013). Calibration for delphinidan node depths follow mean divergence date estimates by McGowen et al. (Reference McGowen, Spaulding and Gatesy2009: Table 2: a, Inioidea + Lipotes [22.15 Ma]; b, Inioidea [16.68 Ma]). Species temporal ranges relate to oldest and youngest records for the species. All other node depths are graphical heuristics and not intended to reflect actual divergence dates. Abbreviations: Aquitan., Aquitanian; H., Holocene; Langh., Langhian; Mess., Messinian; P., Piacenzian; Ple., Pleistocene; Plioc., Pliocene; Serra., Serravallian; Zan., Zanclean. † = extinct taxon.
Discussion
Our analysis shows that several lineages of fossil odontocetes have departed from usual odontocete skull shape and are convergent with modern billfish in overall snout length. Some duck-billed crocodylomorphs exhibit rostral proportions of this magnitude, but differ substantially in the width of the rostrum (Busbey Reference Busbey1995). Other aquatic tetrapods groups such as sauropterygians and penguins also have longirostrine representatives, but these do not reach rostral index values over 0.78 (Fig. 2). From this finding we hypothesize that these hyper-longirostrine toothed whales fed using a feeding style similar to that of billfish, which use the rostrum to sweep through the water to hit and stun fish. The eurhinodelphinids also possess a mandible that is shorter than the rostrum, a trait that is also convergent with billfish. The shortened mandible has been hypothesized to benefit the action of stunning fish by either placing the entry to the oral cavity farther back, making it possible for stunned fish to be ingested while the predator is moving forward, or by decreasing inertia and drag, thus allowing the rostrum to be used with more speed as a singular structure (McGowan Reference McGowan1988). Some of the fossil odontocetes such as Z. flagellator and P. inaequalis possess a mandible that is as long as the rostrum; these taxa may have stunned fish as swordfish do, with the mouth closed, or they may have instead used the jaws as the gharial does, sweeping through the water to grasp the prey rather than stunning it first.
Cross-sectional shape is similar in range in both billfish and in fossil odontocetes. This difference in shape from mediolaterally reinforced to circular appears to be related to finer-scale difference in how the rostrum is used when grasping or hitting prey. Species with circular cross sections such as X. bossi and Z. errabundus likely approached prey using a combination of sweeps in various directions. In contrast, mediolaterally reinforced species such as Z. flagellator and P. inaequalis likely employed lateral sweeps. The anterior end of the rostrum of these taxa is even more compressed, possibly indicating higher selective pressures for hydrodynamics. The anterior rostrum is logically an important contributor to drag force during rotational feeding, because it is swept through the water at greater speed compared with the rest of the head.
The preponderance of longirostrine platanistoids from the early Miocene (e.g., Goedertius; Kimura and Barnes Reference Kimura and Barnes2016) suggest that the factors leading to longirostry are not singular or consistent over geological time. However, some of the most hyper-longirostrine odontocetes evolved in the Miocene, not the Oligocene, which lacked the congruence of higher sea levels and global temperatures. The repeated evolution of hyper-longirostry during the Neogene, and its comparative absence in today's odontocetes, suggests that strong selective factors underpinning this innovation were related to habitat preferences and are likely recorded in depositional environments (Gutstein et al. Reference Gutstein, Cozzuol and Pyenson2014).
There are a number of abiotic factors, such as temperature and sea-level change, that could influence the evolution and extinction of hyper-longirostrine morphologies within Odontoceti. First, with regard to temperature, aquatic taxa reduce body size in response to global warming (Daufresne et al. Reference Daufresne, Lengfellner and Sommer2009). Additionally, warmer environments could facilitate the evolution of faster maximum swimming speeds in prey by increasing the physiological activity of locomotor muscles and decreasing the viscosity of the fluid environment (Herbing Reference Herbing2002). These changes in prey speed could have initiated predator–prey escalation, thereby leading to selection for longer predator snouts, which are better adapted for this feeding niche (McCurry et al. Reference McCurry, Evans, Fitzgerald, Adams, Clausen and McHenry2017a). Second, sea-level highs of extended duration, both in the early and mid-Miocene, likely increased the amount of nearshore benthic habitats (Vermeij Reference Vermeij2011, Reference Vermeij2012). Such changes in available habitat may have also increased availability of certain resources enabling hyper-longirostrine odontocetes to co-inhabit areas with shorter-snouted odontocete morphotypes without outcompeting each other. This is supported by the occurrence of other fossil odontocetes with rostral morphologies that lack modern analogues (e.g., Odobenocetops, Semirostrum; De Muizon Reference De Muizon1993; Racicot et al. Reference Racicot, Deméré, Beatty and Boessenecker2014) that likely fed on shelf benthos through the Pliocene. The frequent fluctuation in the abundance of temperate benthic habitats after this time, with the onset of major glacial–interglacial cycles during the Pleistocene, seems to mark the end of rostral experimentation in Odontoceti (do Amaral et al. Reference do Amaral, Amaral, Fordyce and Moreno2016). The repeated evolution of hyper-longirostry during the Neogene, and its comparative absence in today's odontocetes, suggests that there are likely strong selective factors relating to habitat preferences (recorded in depositional environments; Gutstein et al. Reference Gutstein, Cozzuol and Pyenson2014) underpinning this innovation or prolonged morphological elaboration.
Here we show that fossil hyper-longirostrine odontocetes from the Mio-Pliocene exhibit cranial proportions that are more elongate than all extant odontocetes. Despite converging in rostral proportions, they exhibit considerable disparity in measures of cross-sectional shape that relate to differences in feeding kinematics (Habegger et al. Reference Habegger, Dean, Dunlop, Mullins, Stokes, Huber, Winters and Motta2015). These taxa likely fed on schooling fish using a variety of different kinematic feeding styles, including preference for lateral sweeping in some taxa and multidirectional sweeping in others. The evolution of the extremely elongate morphotype may have been supported by high global temperatures and sea levels. This study highlights the importance of global abiotic factors in driving the morphological evolution of aquatic predators (Pyenson et al. Reference Pyenson, Kelley and Parham2014). Comparative studies of the dentition, muscle-attachment sites on the skeleton, and sensory systems may also be beneficial in understanding these morphologically extreme taxa.
Author Contributions
M.R.M. and N.D.P. were responsible for the conceptualization, methodology, and funding acquisition for the study and for writing, reviewing, and editing the article. M.R.M. was responsible for the formal analysis and visualization of data. N.D.P. was responsible for supervising the work.
Acknowledgments
M.R.M. would like to acknowledge the financial support of a Peter Buck Predoctoral Fellowship from the Smithsonian Institution and a Monash/Museum Victoria collaborative research scholarship. N.D.P. is supported by the Smithsonian Institution, its Remington Kellogg Fund, and the Basis Foundation. E. Fitzgerald provided useful insight into these taxa that greatly benefited the study. We would like to thank N. Kelley and C. McHenry for useful discussion on these taxa and H. Little for her assistance in CT scanning of specimens. M. Laura Habegger kindly supplied CT scans of extant billfish for this study. A. Lau and N. Anning aided in proofreading the article. We would also like to thank the anonymous reviewers whose comments greatly helped to improve this manuscript.


