





The coronavirus disease (COVID-19), caused by severe acute respiratory syndrome coronavirus 2 (SARS-CoV-2), was first described in January 2020(Reference Atzrodt, Maknojia and McCarthy1,Reference Jin, Yang and Ji2) . In March 2020, the World Health Organization (WHO) declared the COVID-19 outbreak to be a pandemic(3). Recently, the WHO declared that COVID-19 no longer constitutes an international public health emergency; however, it will continue to be an established and persistent health problem. Therefore, research must continue to improve our understanding of and approach towards this disease and develop the necessary tools to face future pandemics(4).
The clinical spectrum of COVID-19 can range from asymptomatic infection to severe illness and even death(Reference Minnelli, Gibbs and Larrivee5,Reference Onder, Rezza and Brusaferro6) , of patients who develop symptoms; approximately 20 % require hospitalisation, 4·9 to 11·5 % require invasive mechanical ventilation(Reference Minnelli, Gibbs and Larrivee5), and the fatality rate ranges from 3·4 to 20 %, depending on the risk factors of the patients(Reference Onder, Rezza and Brusaferro6). Mortality associated with poor nutritional status has been reported in this pathology(Reference Gonzalez7), with a particularly high nutritional risk associated with multifactorial aetiology. Male sex, high blood pressure, diabetes mellitus, cardiovascular disorders, advanced age, D-dimer values > 1 μg/ml, and a high Sequential Organ Failure Assessment score have been associated with a high case fatality rate(Reference Zhou, Yu and Du8). Numerous studies have shown that malnutrition can influence patient clinical outcomes, including mortality. Patients with high nutritional risks showed a higher frequency of mortality than patients with low nutritional risk (50·8 % v. 40 %; P = 0·014). The probability of death almost doubled, regardless of the presence of other comorbidities (HR = 1·74; P < 0·001)(Reference Palermo dos Santos, Japur and Passos9).
Nutritional assessment, especially body composition, benefits from the use of bioelectrical impedance analysis (BIA), given its ease of use, safety, portability, and affordability compared to reference standards such as computed tomography (CT) scan and dual X-ray absorptiometry. It is based on impedance measurements and is composed of two elements, resistance (R) and reactance (Xc), using one or multiple electrical frequencies, showing correlation coefficients ranging from 0·74 to 0·98 when compared to the reference standards(Reference Lukaski, Kyle and Kondrup10,Reference Moonen and Van Zanten11) . These data provide additional information beyond whole-body measurements as they provide segmental data that can potentially help to assess subtle changes in specific tissue segments(Reference Tinsley, Harty and Moore12).
Phase angle (PhA) is a cell integrity indicator that is widely used as a prognostic predictor and is integral to the nutritional assessment of patients with multiple diseases, including hepatic, renal, and oncological diseases(Reference Moonen, van Zanten and Driessen13). PhA is calculated by taking the values of R and Xc with the following formula: PhA = arctan (Xc/R) × 180π(Reference Moonen and Van Zanten11). The results are obtained in degrees (°) and interpreted according to the reference values per population. In the last few years, the bioelectrical impedance vector analysis (BIVA), also called the graphical R/Xc (RXc) method, has been used mainly in healthy athlete populations but also in some clinical situations(Reference Nwosu, Mayland and Mason14–Reference Moroni, Vardè and Giustetto17). This method uses height to standardise R and Xc (R/height and Xc/height, respectively), which are components of the impedance vector on an RXc graph, to compare the individual’s measurement to that of a healthy population. In contrast to the commonly used body composition analysis where fat is the primary component identified, this method also includes hydration and muscle mass assessment, independent of the individual’s body weight(Reference Espinosa-cuevas, Rivas-Rodríguez and González-Medina18–Reference Catapano, Trinchese and Cimmino20). This study aimed to determine the PhA cut-off point associated with a higher risk of mortality in non-critically hospitalised patients with COVID-19 and to determine the changes in body composition within a week of hospitalisation. We hypothesised that a low PhA would be associated with increased mortality risk in non-critical hospitalised patients with COVID-19.
Methods
Study design and participants
This cohort study was conducted at a non-critical area of a tertiary care centre from January to December 2021. We included admitted patients of both sexes aged ≥ 18 years with a reverse transcription polymerase chain reaction (RT-PCR)-confirmed COVID-19 diagnosis. Pregnant or lactating women and those with pacemakers, metal plates, amputations, or extensive skin lesions in the electrode placement area were excluded. Patients who were sent to another hospital unit for management and could not complete the measurements were excluded from the study.
Data on all independent variables, including demographic, biochemical, and clinical information on pneumonia severity by CT(Reference Fu, Lou and Xi21), were obtained from the patients’ electronic clinical files; nutritional assessment variables were obtained directly from the patients and their families within 24 h of hospital admission. For recording the dependent variables, length of stay (LOS) and mortality, the enrolled patients were followed up daily until they were discharged or died. This study was conducted according to the guidelines laid down in the Declaration of Helsinki, and all procedures involving humans were approved by the Institutional Review Board (Comité de Investigación and Comité de Ética en Investigación from Instituto Nacional de Ciencias Médicas y Nutrición Salvador Zubirán); reference number 3333. Verbal informed consent was witnessed and formally recorded. No harm was caused to the patients, and participant data were anonymized and kept confidential.
Nutritional assessment
Weights were obtained by Lohman’s methodology(Reference Lohman, Roche and Martorell22) using the Seca® 954 scale. Dynamometry was performed using the Jamar® hydraulic hand dynamometer in the patient’s dominant hand, registering the higher of the three measurements. Mid-arm and calf circumferences were measured with the Lufkin® anthropometric tape (Executive Thinline) according to the technique described by ISAK(Reference Stewart, Marfell-Jones and Olds23).
We asked patients and their families about their current percentage of food intake compared to their usual diet (before they got sick) and registered this information as a clinical independent variable.
BIA measurements: raw data (R and Xc), total and segmental body composition data, including PhA, were obtained using the InBody® S10 body composition analyser (Inbody Co., Ltd., Seoul, Korea). All measurements were performed by trained staff according to the following standardised technique: the patient (fasting and with an empty bladder) was instructed to lie in a supine position; electrodes were placed on the patient’s cleaned hands and feet; the identifier number, age, height, and gender were recorded in the equipment; and, the measurements were obtained after a lapse of 3 min, in raw and printable form.
A second nutritional assessment was conducted in patients with ≥ 1 week of LOS. We performed a secondary analysis to compare the changes after 7 d of hospitalisation with data recorded at baseline. The hydration levels, extracellular water/total body water (ECW/TBW) ratio, and PhA at a frequency of 50 kHz were reported segmentally (right arm, left arm, trunk, right leg, and left leg). In this secondary analysis, the impedance vector was determined using the BIVA method.
Statistical analysis
Regarding the descriptive analysis of the variables, for quantitative variables, the Kolmogorov–Smirnov test was conducted to assess their normality. Variables with a normal distribution were reported as mean and standard deviation, while those with a non-normal distribution were presented as the median and interquartile range (IQR).
The qualitative variables are presented as frequencies and percentages. In the bivariate inferential analysis, quantitative variables with parametric distribution were analysed using Student’s t-test, whereas the quantitative variables with a non-normal distribution were analysed using the Mann–Whitney U test, and the qualitative variables were analysed using the Chi-square test or Fisher exact test.
To determine the cut-off point for PhA, a receiver operating characteristic (ROC) curve analysis was performed. Subsequently, an analysis was conducted to know the potential confounding variables, using the Mann–Whitney U test for quantitative variables and the Fisher exact test for qualitative variables. A survival analysis (considering the cut–off point obtained from the ROC curve) using the Kaplan–Meier estimator was made. Differences in the curves were analysed using the log-rank test. Finally, a Cox Regression was used to determine the hazard ratio (HR) to measure the association to report the risk; all these analyses were performed adjusting by cofounders. In patients with a LOS ≥ 1 week, a secondary analysis was carried out, and quantitative variables with a parametric distribution were analysed using the paired t-test. Quantitative variables with a non-normal distribution were analysed using the Wilcoxon signed-rank test. The impedance vector was determined by the BIVA method. Finally, we analysed the relationship between segmental changes (PhA and ECW/TBW) and prognosis using a Cox regression and random-effects parametric survival model.
Statistical significance was set at P < 0·05. Statistical analyses were performed using the STATA statistical software (StataCorp LLC Version 15.1), the GraphPad Prism software (GraphPad Software, Inc., version 8) was used for graphing, and BIVA software (2002 BIVA tolerance file; Antonio Piccoli) was used for the RXc graphic method.
The sample size was calculated before the participants were included in the survival study(Reference Díaz and Fernández24); considering a statistical power of 80 % (β = 0·842) and a level of confidence of 95 % (α = 1·96), referring to the values of relative risk (2·48) and the proportion of exposed patients (0·41) in the article published by Cornejo et al.(Reference Cornejo-Pareja, Vegas-Aguilar and García-Almeida25), and considering possible losses of 20 %, we obtained a sample size of 110.
Results
In total, 110 patients were included. Figure 1 shows the selection process flowchart; 54·5 % of the patients were men, the mean age of the patients was 50·5 ± 15·0 years, and the median BMI was 28·5 kg/m2 (IQR, 25·6–33·5). Table 1 displays the anthropometric and BIA differences found between men and women, as well as the baseline characteristics of the patients: 60 % had severe pneumonia, 35·5 % had moderate pneumonia, and 4·5 % had mild pneumonia. The weight loss rate from the onset of symptoms until hospital discharge was 3·4 % (IQR, 0·5–6·3). The median percentage of food intake compared with the usual diet was 70 %.
Patient selection flowchart.

Baseline characteristics

The data are presented as the mean ± standard deviation or median with interquartile range (25th–75th percentile) depending on the normalcy of the data distribution.
* The differences between the groups at baseline were evaluated using Student’s t test or the Mann–Whitney U test (*) for continuous variables, and proportions were compared using the Chi2 or Fisher test.
† PaO2/FiO2 score: partial pressure arterial oxygen/fraction of inspired oxygen score.
The mortality rate in the sample was 13·6 %, with no differences in sex (six women v. nine men; P = 0·783), pneumonia severity, and PaO2/FiO2 (partial pressure arterial oxygen/fraction of inspired oxygen). However, the age was lower in the group of patients who survived than in those who died (49·2 ± 14·7 v. 59·3 ± 14·5 years; P = 0·021).
The initial data show a higher proportion of death in patients who had a previous diagnosis of diabetes mellitus (26 (27·4 %) v. 9 (60 %); P = 0·012), hypertension (31 (32·6 %) v. 9 (60 %); P = 0·041)) and chronic kidney disease (7 (7·4 %) v. 4 (26·7 %); P = 0·042) upon admission, without showing differences in the proportions of patients with chronic obstructive pulmonary disease, cardiovascular disease, liver disease, immunosuppression, and cancer. However, after analysing the data according to the PhA cut-off point, there was no difference in the frequency of comorbidities in both groups, except for chronic kidney disease, which shows a higher proportion in the group of patients with a PhA < 4° (7·7 % v. 50 %; P = 0·013).
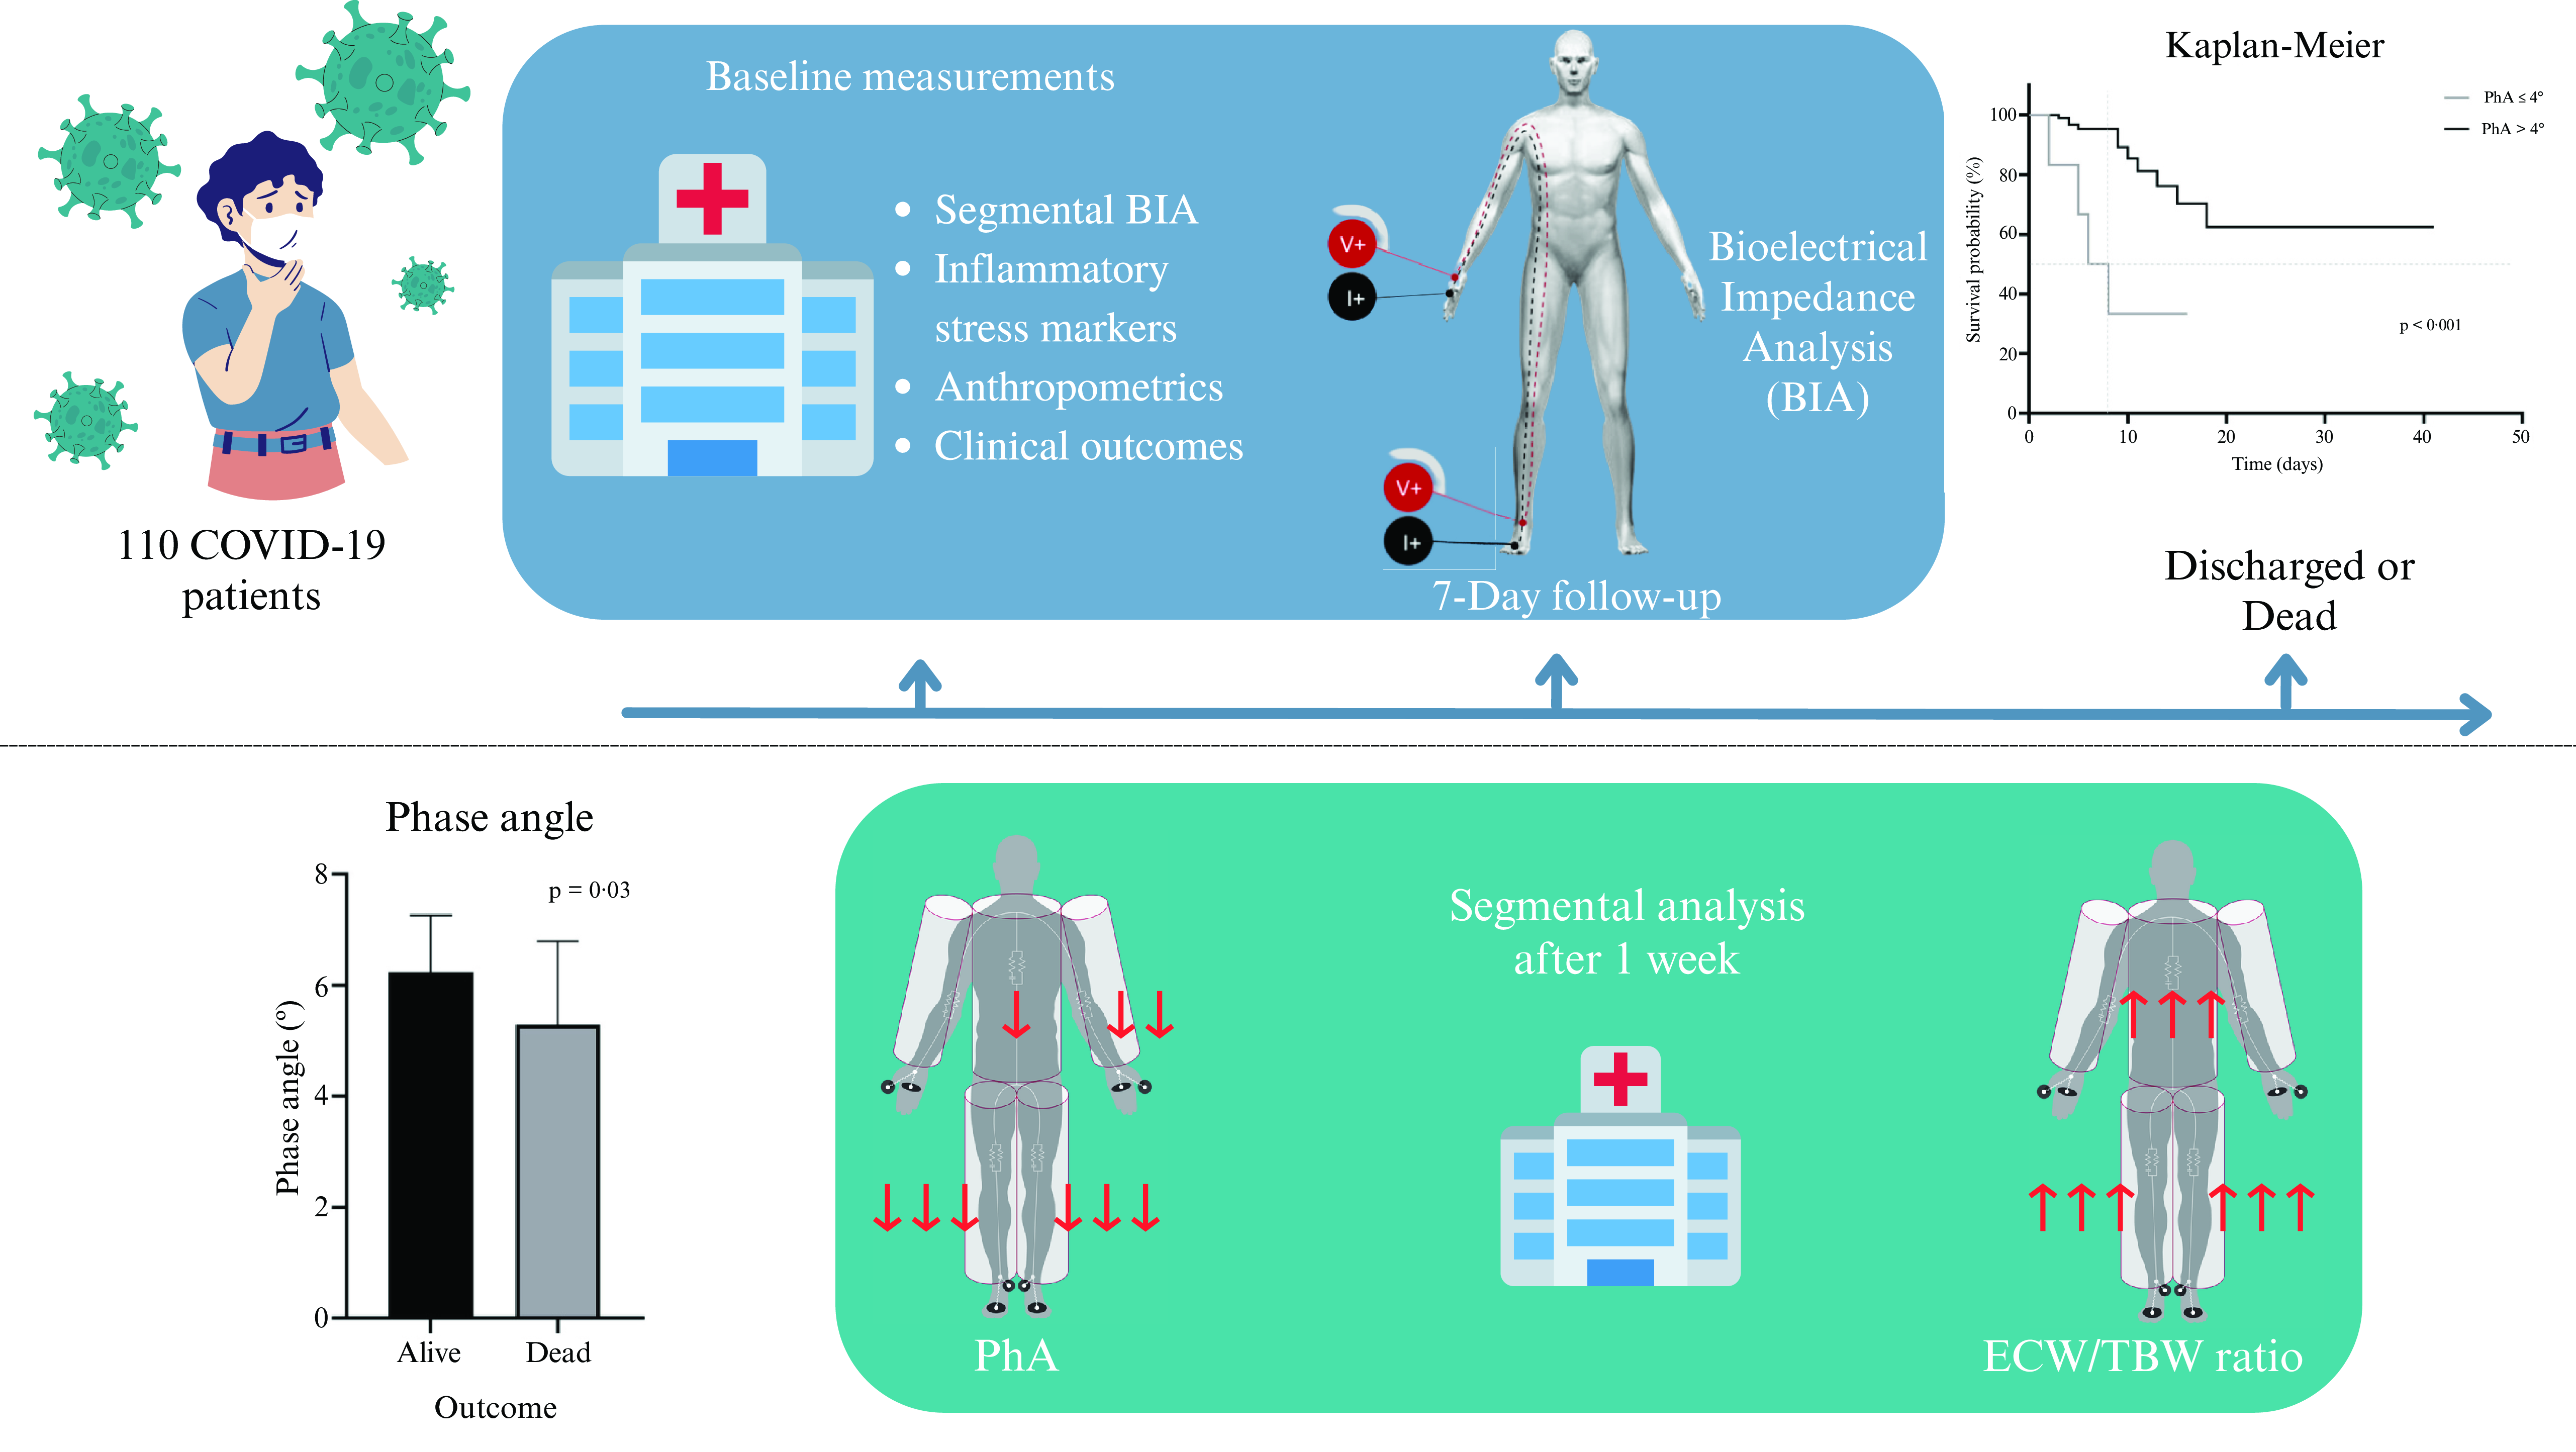
The handgrip strength was significantly lower (30·4 ± 12·1 v. 23·2 ± 10·9 kg; P = 0·029) in the patients who died. In the BIA, the PhA was significantly lower (6·2 ± 1·0 v. 5·3 ± 1·5 º; P = 0·032), and the ECW/TBW ratio was higher (0·377 ± 0·012 v. 0·389 ± 0·018; P = 0·032) in the group of patients who died; mortality was negatively correlated with albumin level (R2 = −0·504; P < 0·001), it being the only biochemical marker with lower levels in the patients who died.
The ROC curve analysis (Fig. 2(a)) showed that the PhA cut-off point of 4° had the highest area under the curve. When determining potential confounding variables, a statistically significant difference was found in diabetes mellitus (25 (26·9 %) v. 8 (72·7 %); P = 0·004), and in systemic arterial hypertension (30 (32·3 %) v. 7 (63·6 %); P = 0·05); all analyses were adjusted for both confounding variables. We found a significantly lower survival percentage in the patients with PhA ≤ 4° compared to those who presented PhA > 4° (Fig. 2(b); P < 0·001). PhA ≤ 4° was strongly associated with mortality (HR = 5·81, 95 % CI 1·80, 18·67; P = 0·003), adjusted for diabetes mellitus and systemic arterial hypertension.
(a) Phase angle (PhA) receiver operating characteristic (ROC) curve. The ROC curve analysis determined that the cut-off point of PhA of 4° presented an area under the curve of 0·688 (95 % CI 0·506, 0·739), with a sensitivity of 26·67 % and specificity of 97·89 % and an ability to classify 88·18 % of the patients correctly. (b) Kaplan–Meier survival plot by phase angle. Log-rank test of equality analysis was performed; a significantly lower survival rate was found in the group with a PhA ≤ 4° (P < 0·001) compared to those patients who presented a PhA > 4°.

The secondary analysis carried out in 34 patients allowed us to observe the changes within a week of hospitalisation, where decreases in weight (81·5 kg (IQR, 67·8–105·8) v. 77·9 kg (IQR, 64·8–103·3); P < 0·001), BMI (31·5 ± 8·1 v. 29·9 ± 7·8 kg/m2; P < 0·001), calf circumference (37·1 ± 4·4 v. 35·8 ± 4·4 cm; P < 0·001), mid-arm circumference (33·9 ± 5·9 v. 32·8 ± 6·2 cm; P < 0·001), handgrip strength (29 ± 11·0 v. 22·8 ± 11·3 kg; P < 0·001), PhA (5·96 ± 1·13 v. 5·34 ± 0·94°; P < 0·001), and albumin level (3·6 ± 0·4 v. 3·2 ± 0·4 g/dl; P < 0·001) were observed.
Conversely, the total levels in the ECW/TBW ratio (0·379 ± 0·013 v. 0·387 ± 0·011; P < 0·001) showed a significant increase after one week of hospitalisation. In Fig. 3, the segmental analysis of both the ECW/TBW ratio and PhA at 50 kHz shows the changes within a week of hospitalisation, with significant differences in the ECW/TBW ratio (Fig. 3(a)) in the trunk, right leg, and left leg and significant differences in the PhA (Fig. 3(b)) in the left arm, trunk, right leg, and left leg.
(a) Changes in extracellular water/total body water (ECW/TBW) ratio after one week of follow-up. (b) Changes in phase angle (PhA) after one week of follow-up. Analysis was performed using a paired t-test, where *P < 0·05, **P < 0·01 and *** P < 0·001.

Figure 4 shows the changes that occurred through the impedance vector with the BIVA method after seven days of hospitalisation, where an increase on the hydration axis can be observed, as well as a decrease in the body tissue axis with changes in R (532·1 ± 78·5 v. 559·6 ± 106·1; P = 0·02); Xc (55·2 ± 10·8 v. 51·9 ± 11·0; P = 0·04) and impedance (535·1 ± 78·5 v. 562·1 ± 106·3; P = 0·02).
(a) Impedance vector changes (graphical method (RXc)). The images show the changes in resistance (R) and reactance (Xc), standardised by height (H) measured in ohms/metre after one week of hospitalisation. (a) Changes in men, (b) Changes in women.

When analysing the relationship between BIA segmental changes (PhA and ECW/TBW) and prognosis, using a Cox regression and random-effects parametric survival model, we did not find any statistically significant differences.
Discussion
Nutritional assessments in patients with COVID-19 must be personalised and adapted to the needs and capacities of healthcare institutions(Reference Minnelli, Gibbs and Larrivee5). Weight loss in patients with COVID-19 may be associated with reduced food intake and hypercatabolism(Reference Whittle, Molinger and MacLeod26). The albumin levels were lower in the group of patients who died, with a negative correlation with the ECW/TBW ratio, as expected, as the decrease in the albumin level leads to a reduction in oncotic pressure. This can clinically manifest as oedema, which complicates nutritional assessment in hospitalised patients, as measurements such as weight and circumference lack precision due to fluid overload(Reference Osuna-Padilla, Rodríguez-Moguel and Rodríguez-Llamazares27).
The degree of malnutrition is strongly associated with the PhA, even in circumstances where most assessment tools fail because of the wrong impression that total body weight (including excess fluid retention) reflects the real amount of lean mass(Reference Player, Morris and Thomas28). Mortality did not significantly differ based on pneumonia severity by chest CT scan in the bivariate analysis. Although this imaging technique has been reported to help stratify the severity of lung lesions and predict the prognosis, in this cohort, other factors played more significant roles in the mortality of patients with COVID-19, regardless of the percentage of alveolar occupancy found in the CT scan. We also observed that age is a critical factor affecting mortality in patients with COVID-19, similar to what has been reported in the literature(Reference Onder, Rezza and Brusaferro6); however, higher mortality in men than in women(Reference Jin, Yang and Ji2) was not documented in this study, perhaps due to the sample size or area around the hospital in which the patients were recruited.
In contrast, the PhA showed differences with respect to mortality, as demonstrated earlier. Garlini et al. showed in a systematic review that the PhA could be a good prognostic marker of mortality in multiple pathologies such as cancer, heart failure, kidney disease, and human immunodeficiency virus infection(Reference Garlini, Alves and Ceretta29). Similarly, a recent systematic review showed that patients with COVID-19 with lower PhA values had deteriorating clinical conditions, demonstrating the potential of PhA as a predictor of unfavourable clinical outcomes(Reference Alves, Salazar and Silvino30).
Besides the PhA, dynamometry also showed significant differences when analysing mortality; this was expected, as dynamometry indicates the patient’s functionality and the quantity and quality of muscle mass(Reference Koo31). Therefore, it should be considered in the nutritional assessment as it provides clinically relevant information and is an inexpensive method. The PhA cut-off point obtained was 4°, with greater sensitivity and specificity.
This value is very similar to that found by Cornejo et al. in a Spanish cohort of patients with COVID-19; low PhA values (< 3·95°) indicated a very high risk of poor prognosis and mortality. They also mentioned that the PhA offers greater sensitivity as a predictive test for prognosis on admission compared to the established analytical parameters of poor prognosis (e.g. C-reactive protein, lymphocytes, and prealbumin)(Reference Cornejo-Pareja, Vegas-Aguilar and García-Almeida25). The survival analysis confirmed that the difference in mortality, according to the PhA cut-off point of 4°, adjusted by confounding variables, was statistically significant; such results have also been seen in populations with critical COVID-19, where a higher risk of dying was associated with decreased PhA values (with HR = 5·88, P = 0·02)(Reference Osuna-Padilla, Rodríguez-Moguel and Rodríguez-Llamazares32).
Because the PhA measurement is quick and easy to obtain, it can be a valuable clinical parameter to assess the risk of severe course of disease(Reference Moonen, Bos and Hermans33). At hospital discharge, there is a lower percentage of swallowing recovery in extubated patients who presented with a decreased PhA (< 4·8°)(Reference Reyes-Torres, Flores-López and Osuna-Padilla34). As PhA is an indicator obtained directly from BIA and is not subject to mathematical modelling, it is a crude measure with a good prognostic capacity; the greater the number of cell membranes the signal has to pass through, the greater the reactance, and therefore, the PhA. Thus, a large PhA is consistent with a large body cell mass(Reference Moonen and Van Zanten11). It can be considered useful for tracking individuals at nutritional risk. Furthermore, decreased PhA values and mortality showed strong associations(Reference Garlini, Alves and Ceretta29,Reference Osuna-Padilla, Rodríguez-Moguel and Rodríguez-Llamazares32) .
Changes in body composition observed in the secondary analysis in which the nutritional assessment was performed at baseline and after 7 d of hospitalisation allowed us to understand the particularly increased nutritional risk characteristics of patients with COVID-19(Reference Prompetchara, Ketloy and Palaga35). All measurements in these patients were negatively affected, both in anthropometric and biochemical variables and also in body composition. Besides being explained by persistent catabolism(Reference Bracco, Berger and Revelly36), these changes are related to symptoms that make oral feeding difficult for patients, particularly due to anorexia generated by systemic inflammation. We did not find any statistically significance difference when investigating the relationship between segmental changes of PhA and ECW/TBW with mortality. This can be easily explained since only 30 % of the sample were followed up, including those patients with a LOS ≥ 1 week.
The strength of this study is that there was little evidence of segmental changes in body composition. However, in previous studies, fluid accumulation in the trunk increased by 63 % during hospitalisation after abdominal surgery, whereas it increased by 8 % and 11 % in the arms and legs, respectively. Before thoracic surgery, fluid accumulation was 93 % in the trunk and approximately 2 % in the arms and legs(Reference Bracco, Berger and Revelly36). In patients with COVID-19, alterations in PhA and fluid retention in all body segments have also been observed when comparing patients with dysphagia with those without it after being extubated by COVID-19(Reference Reyes-Torres, Flores-López and Osuna-Padilla34). Although our patients did not undergo a state of stress due to surgery, COVID-19 generates significant systemic stress; therefore, the previously mentioned results were comparable with those of the present study, where, in the segmental analysis, we observed an increase in the ECW/TBW ratio in the trunk and lower body extremities, as well as a decrease in the PhA in the left arm, trunk, and lower body extremities, besides changes in their total values.
The BIVA method showed a shift in the position within a week of hospitalisation in both men and women. This can be interpreted as a decrease in body muscle mass and an increase in the patient’s fluid levels, which have been associated with functional deterioration and an increased risk of various clinical outcomes, including mortality, as Cornejo-Pareja et al., and Samoni et al. found. Cornejo-Pareja et al. showed that in patients with COVID-19, overhydration is related to mortality risk after ninety days(Reference Pareja, Vegas-Aguilar and Lukaski37) and Samoni et al. reported that in patients from the ICU, the changes in body fluids to overhydration after five days also lead to higher mortality risk(Reference Samoni, Vigo and Bonilla Reséndiz38). This can be explained because overhydration is the result of an imbalance where extracellular water is increased more than intracellular water; when this occurs, the balance of electrolytes, proteins, and other cellular compounds may be disrupted, leading to potential alterations in cell functions within the body; this is why several authors have linked this imbalance to a negative prognosis(Reference Roumelioti, Glew and Khitan39).
One of the limitations of this study was that the patients were only from non-critical areas. The study sample was medium-sized, implying that more scientific evidence is required. Moreover, the volume of data obtained was not sufficient to determine the PhA cut-off point according to sex since the total mortality frequency found in this population was 15 patients. Given such a low frequency, a statistically significant cut-off point could not be determined for each sex, even though it has already been established that PhA values tend to be higher in men. Another limitation was that at the beginning of the recruitment of the study participants, SARS-CoV-2 vaccines were not yet available; however, they began to be applied during the study, and this information was not recorded. Therefore, the analysis did not differentiate between those with or without the vaccine, type of vaccine administered, or time since the vaccine was administered, which may influence the interpretation of the observed results.
Conclusion
Regardless of the severity of COVID-19-acquired pneumonia, a low PhA (≤ 4°) was strongly associated with increased mortality in non-critical hospitalised patients. Therefore, adding this measurement as an integral part of the nutritional assessment and as a predictor of mortality in hospitalised patients with COVID-19 is recommended. Segmental analysis and the RXc graphical method can also be considered for these patients, particularly in those with fluid disorders. Nutritional assessment and reassessment of patients with COVID-19 should be performed constantly because of the alterations they present within a week of hospitalisation that represent the increasing risk of adverse clinical outcomes.
Supplementary material
For supplementary material/s referred to in this article, please visit https://doi.org/10.1017/S0007114523002994
Acknowledgements
We appreciate the support provided by MSc. José Roberto Peralta Rodríguez during the project and the patients who kindly agreed to participate in this project.
This research did not receive any funding or sponsorship.
A. E. S-Z. and F. E-M. contributed to the study's conception and design. F. E-M. and A. F-L. contributed to data acquisition. F. E-M. and A. G. G-G. analysed the data. F. E-M. recruited and followed up on all patients and wrote the main draft of the manuscript. All authors contributed to data interpretation, critically revised the manuscript, and added important intellectual content. All authors provided their final approval and agreed to be accountable for all aspects of the work, ensuring its integrity and accuracy.
The authors declare that there are no conflicts of interest.


 Open access

