

Lactic acid bacteria belong to a group of related micro-organisms that produce lactic acid as a result of carbohydrate catabolism. Some lactic acid bacteria strains are referred to as probiotics, defined as ‘live microorganisms which, when administered in adequate amounts, confer a health benefit on the host’( Reference Fuller 1 – Reference Roberfroid, Gibson and Hoyles 3 ). However, the term ‘probiotics’ is not defined in the EU regulation. All health claims except one regarding probiotics have been rejected by the European Food Safety Authority on the grounds that strains have either been insufficiently characterised or that cause-and-effect links have been poorly substantiated. Nevertheless, several studies have reported that probiotics are effective in reducing the incidence of cancer and infectious diseases, ameliorating inflammatory bowel diseases and preventing allergies via modulation of the immune system in human subjects as well as in experimental animal models( Reference Ishikawa, Akedo and Otani 4 – Reference Drago, Toscano and De Vecchi 7 ). However, to date, detailed mechanisms by which probiotics modulate the immune system have not been clarified yet.
Immune responses against microbes are elicited in a time-related manner. For example, infection of pathogenic bacteria induces a rapid increase of many innate immune cells shortly after infection( Reference Dalrymple, Lucian and Slattery 8 , Reference Pejcic-Karapetrovic, Gurnani and Russell 9 ), whereas pathogen-specific IgG levels are elevated several weeks after infection( Reference Gosling, Goodnow and Verma 10 ). Therefore, for a comprehensive understanding of how immune responses are modulated by oral uptake of probiotics, it is important to elucidate the changes in sequential immune responses. However, little is known about sequential gene expression for evaluating the effects of probiotics on immunity.
Lactobacillus brevis KB290 (KB290) was isolated from Suguki, a traditional Japanese pickle, and demonstrates some characteristics of probiotic strains( Reference Nobuta, Inoue and Suzuki 11 – Reference Yakabe, Takashima and Kuwagata 15 ). It was previously reported that KB290 enhances immunocompetence such as interferon-α-producing activity of peripheral blood mononuclear cells( Reference Kishi, Uno and Matsubara 16 ). We have previously shown that KB290 has immunomodulatory effects as confirmed by the following findings( Reference Fukui, Sasaki and Fuke 17 ): (1) administration of about 1010colony-forming units (CFU)/d of KB290 for 1 d enhanced the cell-mediated cytotoxic activity of mouse splenocytes; (2) DNA microarray analysis revealed that up-regulated genes were significantly enriched in Gene Ontology (GO) terms related to immunity by the administration of KB290; (3) enhanced cytotoxic activity could have been caused by the activation of both natural killer (NK) cells and CD8+ cytotoxic T cells stimulated via MHC class I presentation on day 1.
In the present study, we analysed sequential gene expression profiling associated with the enhancement of cell-mediated cytotoxic activity in the spleen of mice during the administration of KB290 for a 14 d period, not just 1 d, in order to understand the enhancement of immunocompetence by KB290. We demonstrated sequential expression profiling of the genes involved in NK cell and T cell activating signalling and antigen processing and presentation, which reflected cell-mediated cytotoxic activity in mice fed with KB290. This finding will facilitate our understanding of the mechanisms by which probiotics modulate several immune functions sequentially.
Materials and methods
Bacterial strain
KB290 was isolated from Japanese pickles, ‘Suguki’, deposited as strain JCM 17 312 and maintained at Research Institute, Kagome Company Limited. We previously reported that KB290 is safe( Reference Nobuta, Inoue and Suzuki 11 – Reference Yakabe, Takashima and Kuwagata 15 ) for human use and commercially available in the form of beverages and supplements. A commercial batch of lyophilised powder of KB290 including potato starch (San-ei Sucrochemical Company Limited) was used in the animal experiments. Each gram of KB290 contained 6 × 10¹⁰CFU.
Animal experiments
A total of forty-eight specific pathogen-free female BALB/c mice, aged 8 weeks, were purchased from Charles River Laboratories Japan, Inc. The animals were divided into two groups, control and KB290 (four cages per group), with equal mean body weights. They were housed, as reported previously( Reference Fukui, Sasaki and Fuke 17 ), and allowed free access to a commercial normal diet (CE-2; CLEA Japan, Inc.) and sterile water during an acclimatisation period of 1 week. Then, they received lyophilised KB290 as the treatment diet (3 × 10⁹CFU/g) or 5·8 % (w/w) potato starch (Nippon Starch Chemical) as the control diet for a period of 1, 4, 7 and 14 d. Daily intake of the KB290-containing diet per treated mouse was 3·99 g or about 1 × 10¹⁰CFU. On days 1, 4, 7 and 14, six mice in each group were euthanised and their spleens were sampled for cell-mediated cytotoxicity and DNA microarray assay.
The Animal Care and Use Committee of the Institute of Kagome Company Limited approved all the study protocols, which were in accordance with the guidelines established by the Japanese Society of Nutrition and Food Science (Law and Notification 6 of the Japanese government).
Cell-mediated cytotoxicity and DNA microarray assay
Spleens were sampled for cell-mediated cytotoxicity assay against YAC-1 target cells at an effector:target cell ratio of 20:1 and for the DNA microarray assay on days 1, 4, 7 and 14 after the commencement of KB290 feeding. In the present study, previous results of cell-mediated cytotoxicity and DNA microarray analysis on day 1( Reference Fukui, Sasaki and Fuke 17 ) were taken into consideration to examine immune response changes in a time-related manner. Briefly, total RNA was isolated from each spleen sample with TRIzol reagent (Invitrogen), and purified using the RNeasy Plus Mini Kit (Qiagen) according to the manufacturer's instructions. The isolated total RNA from individual samples was subjected to DNA microarray analysis. A portion (100 ng) of the purified total RNA was used to synthesise complementary DNA, and then biotinylated amplified RNA was transcribed with T7 RNA polymerase using the GeneChip 3' IVT Express Kit (Affymetrix). Amplified RNA was fragmented and then hybridised to an Affymetrix GeneChip mouse genome 430 2.0 array (Affymetrix), in accordance with the manufacturer's instructions. The array was hybridised at 45°C for 16 h, washed and stained with phycoerythrin. The resulting fluorescence signals were scanned with the Affymetrix GeneChip System, and Affymetrix GeneChip Command Console software was used to reduce the images to the intensity values for each probe (CEL files).
The gene expression data for day 1 are in the public domain (NCBI's Gene Expression Omnibus; http://www.ncbi.nlm.nih.gov/geo/; series accession no. GSE41127). All microarray data of the present study were submitted to the NCBI's Gene Expression Omnibus (added to GEO Series ID GSE41127).
Quantitative RT-PCR
Quantitative RT-PCR analysis was performed as reported previously( Reference Fukui, Sasaki and Fuke 17 ). Primer sequences were as follows: β-2 microglobulin (B2m) – forward 5′-TGCTACTCGGCGCTTCAGTC-3′ and reverse 5′-AGGCGGGTGGAACTGTGTTAC-3′; histocompatibility 2, D region locus 1 (H2-d1) – forward 5′-GCATTACAAGGCCTACCTGGA-3′ and reverse 5′-CAGCACCTCAGGGTGACTTC-3′; histocompatibility 2, K1, K region (H2-k1) – forward 5′-TGGCTCCGCAGATACCTGAA-3′ and reverse 5′-CCAGCACCTCAGGGTGACTTTA-3′; CD3 antigen, δ polypeptide (Cd3d) – forward 5′-TCTACTGCTTTGCAGGACATGAGAC-3′ and reverse 5′-CCGTTGCTATGGCACTTTGAGA-3′; lymphocyte-specific protein tyrosine kinase (Lck) – forward 5′-TGGGACCTTCACCATCAAGTCA-3′ and reverse 5′-GTCAGGTCTCACCATGCGGTAG-3′; phosphatidylinositol 3-kinase catalytic δ polypeptide (Pik3cd) – forward 5′-GTGTGGTCACGAATCAAGACGAA-3′ and reverse 5′-AGAGATCAGTCCTGTCCGTCCATAA-3′; glyceraldehyde-3-phosphate dehydrogenase (Gapdh) – forward 5′-AAATGGTGAAGGTCGGTGTG-3′ and reverse 5′-TGAAGGGGTCGTTGATGG-3′. Fold-induction values were calculated using the 2− ΔΔC t method, and target gene expression was normalised to Gapdh.
Data analysis
A one-way ANOVA was applied to compare cell-mediated cytotoxic activity and quantitative RT-PCR analysis of the treated v. control group in each period using SPSS 15.0 for Windows (SPSS Japan Inc.).
CEL files on all samples were normalised by using the Factor Analysis for Robust Microarray Summarization (FARMS) algorithm( Reference Hochreiter, Clevert and Obermayer 18 ), implemented in Bioconductor 2.7 in R (version 2.12.1)( Reference Gentleman, Carey and Bates 19 ). Results obtained by normalisation with a different dataset may not be comparable with those obtained by the FARMS algorithm. Hence, all arrays of four sampling points for 14 d, including day 1( Reference Fukui, Sasaki and Fuke 17 ), were normalised together to obtain expression measures. To detect differentially expressed genes (DEG) between the control and treated groups in each period, the rank products( Reference Breitling, Armengaud and Amtmann 20 ) method was used as a non-parametric statistic( Reference Kadota, Nakai and Shimizu 21 ). To identify functional classes of DEG according to the Biological Process in GO and the Kyoto Encyclopedia of Genes and Genomes (KEGG) PATHWAY database, enrichment analyses were performed using the EASE (Expression Analysis Systematic Explorer) score, the modified Fisher's exact test P value( Reference Hosack, Dennis and Sherman 22 ), and Benjamini and Hochberg's false discovery rate corrections( Reference Benjamini and Hochberg 23 ) using the database for Annotation, Visualization, and Integrated Discovery( Reference Huang da, Sherman and Lempicki 24 ), a Web-accessible program, in accordance with the manuals available at the web site (http://david.abcc.ncifcrf.gov/home.jsp).
Results
Cell-mediated cytotoxicity
The spleen from a mouse of the treated group on day 7 enlarged, and cytotoxicity values and gene expression markedly deviated from those of the other samples. Therefore, this mouse was excluded from the analysis.
Figure 1 shows the relative cell-mediated cytotoxic activity of splenocytes from mice fed the KB290 v. control diet on days 1, 4, 7 and 14. The activity was significantly higher in the treated group than in the control group on days 1 and 7. The highest activity appeared on day 4, but was not statistically significantly different. The ratio of the activity between the treated and control groups was about 120 % on days 1, 4 and 7 and further decreased to 107 % on day 14. KB290 feeding of mice enhanced cytotoxic activity from days 1 to 7 sequentially and the enhancing effects diminished on day 14.
Relative cell-mediated cytotoxic activity associated with Lactobacillus brevis KB290 feeding. Splenocytes were sampled on days 1, 4, 7 and 14 after the commencement of feeding and used as effector cells against YAC-1 target cells (1 × 10⁴cells/well). The effector:target cell ratio was 20:1. Values are percentages relative to the mean value from each control (○) group (n 6, except for the treated (●) group on day 7 (n 5)). * Mean value was significantly different from that of the control group on days 1 and 7 (P <0·05; one-way ANOVA).
Functional enrichment analysis of differentially expressed genes
Using DNA microarray, changes in splenic gene expression of mice fed the KB290 diet were monitored on days 1, 4, 7 and 14. The numbers of DEG were 458 up-regulated probe sets (400 genes) and 580 down-regulated probe sets (446 genes) on day 1, while 708 up-regulated probe sets (584 genes) and 1228 down-regulated probe sets (925 genes) on day 4, 524 up-regulated probe sets (454 genes) and 733 down-regulated probe sets (554genes) on day 7 and 225 up-regulated probe sets (187 genes) and 584 down-regulated probe sets (441 genes) on day 14. The numbers of DEG were increased for 4 d and then decreased thereafter.
GO analysis can provide a very broad overview of biological functions and processes that change under different experimental conditions. The significantly enriched GO terms among the up-regulated and down-regulated gene sets are summarised in Tables 1 and 2, respectively. GO terms related to immunity such as immune response and immune effector process were enriched in the up-regulated gene set over a period of 7 d. On the other hand, GO terms related to the cellular process such as cell cycle, cell division and organelle organisation were enriched in the down-regulated gene set throughout the experimental period. The biological process of mice was influenced by the time of KB290 feeding.
Significantly enriched Gene Ontology (GO) terms in the biological process (level 2) found in the up-regulated genes by Lactobacillus brevis KB290 feeding
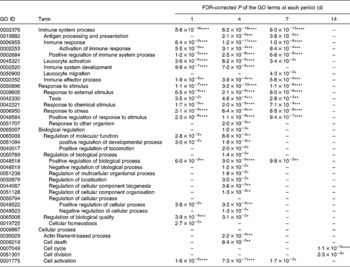
* P< 0·05, ** P< 0·01, *** P< 0·001, **** P< 0·0001.
–, P≥ 0·05.
Significantly enriched Gene Ontology (GO) terms in the biological process (level 2) found in the down-regulated genes by Lactobacillus brevis KB290 feeding
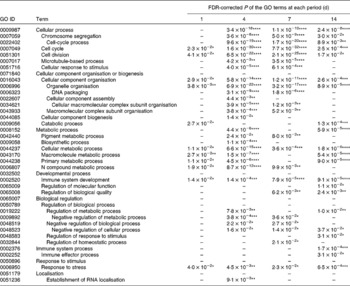
* P< 0·05, ** P< 0·01, *** P< 0·001, **** P< 0·0001.
–, P≥ 0·05.
The over-represented KEGG pathway among the up-regulated gene set was also involved in the pathway related to immunity, such as antigen processing and presentation and B-cell receptor signalling pathway. The down-regulated gene set was enriched in the KEGG pathway related to the cellular process such as cell cycle and DNA replication on days 4 and 7 (see online supplementary Table S1).
Differentially expressed genes associated with antigen processing and presentation, natural killer cells and T cells
NK cells act as cytotoxic effector cells capable of lysing infected and tumour cell targets. CD8+ cytotoxic T cells can also eradicate infected and tumour cells. Dendritic cells and macrophages elicit activation of NK cells by cytokines and activation of CD8+ cytotoxic T-cells by antigen processing and presentation via MHC class I. To elucidate the mechanisms by which KB290 enhances cell-mediated cytotoxic activity, we selected DEG associated with antigen processing and presentation, NK cells and T cells for further analysis.
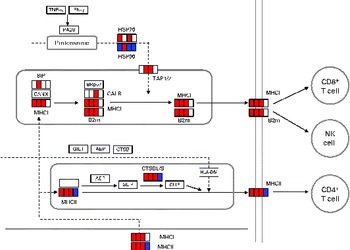
DEG associated with antigen processing and presentation are given in online supplementary Table S2. The mapping of DEG on the processing and presentation pathway is shown in Fig. 2. Some genes (B2m, H2-d1 and H2-1) among them were up-regulated from days 1 to 7. No up-regulated genes related to antigen processing and presentation both via MHC classes I and II were observed on day 14. To verify the changes in gene expression detected by the DNA microarray analysis, quantitative RT-PCR was applied to analyse the selected genes encoding the MHC class I protein complex (B2m, H2-d1 and H2-k1). B2m was up-regulated from days 1 to 4 and H2-d1 and H2-k1 were up-regulated from days 1 to 7. However, these genes were not up-regulated on day 14 as observed in the results obtained from the DNA microarray analysis (Table 3).
Differentially expressed genes (DEG) involved in antigen processing and presentation (Kyoto Encyclopedia of Genes and Genomes (KEGG) PATHWAY database). DEG were mapped to the KEGG antigen processing and presentation pathway. A small box within each gene represents each of the four sampling points, and the order is, from left to right, days 1, 4, 7 and 14. Significantly up-regulated and down-regulated genes during Lactobacillus brevis KB290 feeding detected by DNA microarray are given in red and blue, respectively. IFN, interferon; PA28, proteasome (prosome, macropain) 28; HSP, heat shock protein; TAP1/2, transporter 1/2, ATP-binding cassette, subfamily B (MDR/TAP); BiP, heat shock protein 5; BRp57, protein disulphide isomerase-associated 3; CANX, calnexin; CALR, calreticulin; B2m, β-2 microglobulin; NK, natural killer; GILT, interferon γ-inducible protein 30; AEP, legumain; CTSB, cathepsin B; II, SLIP and CLIP, CD74 antigen (invariant polypeptide of major histocompatibility complex, class II antigen-associated); CTSBL/S, cathepsin B; HLA-DM, histocompatibility 2, class II, locus DMa.
β-2 Microglobulin (B2m), histocompatibility 2, D region locus 1 (H2-d1), histocompatibility 2, K1, K region (H2-k1), CD3 antigen, δ polypeptide (Cd3d), lymphocyte-specific protein tyrosine kinase (Lck) and phosphatidylinositol 3-kinase catalytic δ polypeptide (Pik3cd) mRNA levels in the spleen of mice
NK, natural killer; ↑ , significant up-regulation; → , non-significant up-regulation.
The up-regulation of the genes in the treated group was significantly different from that in the control group (n 5–6): * P< 0·05, ** P< 0·01 (one-way ANOVA).
The up-regulation of the genes in the treated group was significantly different from that in the control group (n 5–6): † false discovery rate (FDR) < 0·05, †† FDR < 0·01 (rank products).
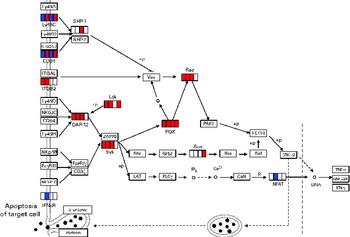
DEG involved in NK cell activation in each period are given in online supplementary Table S3. The mapping of DEG on the NK cell-mediated cytotoxicity pathway from the KEGG database is shown in Fig. 3. Pik3cd involved in the activation of signal transduction elements in NK cells was up-regulated until day 14. Lck was also up-regulated on days 1, 4 and 14, although there was no statistically significant difference (false discovery rate 0·056) on day 7.
Differentially expressed genes (DEG) involved in natural killer (NK) cell-mediated cytotoxicity (Kyoto Encyclopedia of Genes and Genomes (KEGG) PATHWAY database). DEG were mapped to the KEGG NK cell-mediated cytotoxicity pathway. A small box within each gene represents each of the four sampling points, and the order is, from left to right, days 1, 4, 7 and 14. Significantly up-regulated and down-regulated genes during Lactobacillus brevis KB290 feeding detected by DNA microarray are given in red and blue, respectively. Ly49A, killer cell lectin-like receptor, subfamily A, member 1; Ly49C, killer cell lectin-like receptor, subfamily A, member 3; SHP-1, Src homology region 2 domain-containing phosphatase 1; Ly49G2, killer cell lectin-like receptor, subfamily A, member 7; NKG2A/B, killer cell lectin-like receptor subfamily C, member 1; ITGAL, integrin α L; Vav, vav oncogene; Rac, ras-related Clck3 botulinum toxin substrate; ITGB2, integrin β-2; Ly49D, killer cell lectin-like receptor, subfamily A, member 4; Lck, lymphocyte-specific protein tyrosine kinase; NKG2C, killer cell lectin-like receptor subfamily C, member 2; DAP12, DNAX activation protein of 12 kDa; PI3K, phosphatidylinositol 3-kinase; PAK1, p21 protein (Cdc42/Rac)-activated kinase 1; MEK1/2, mitogen-activated protein kinase kinase 1/2; Ly49H, killer cell lectin-like receptor subfamily A, member 9; ZAP70, ζ-chain (TCR) associated protein kinase; NKp46, natural cytotoxicity triggering receptor 1; Syk, spleen tyrosine kinase; Shc, src homology 2 domain-containing transforming protein C1; Grb2, growth factor receptor-bound protein 2; Sos, son of sevenless homologue 1; Ras, rat sarcoma virus oncogene; Raf, v-raf-leukaemia viral oncogene 1; ERK1/2, mitogen-activated protein kinase 1/2; FcyRIII, Fc receptor, IgG, low affinity IV; FcɛRIγ, Fc receptor, IgE, high affinity I, γ polypeptide; CD3ζ, CD247 antigen; LAT, linker for activation of T cells; PLCγ, phospholipase C, γ; IP3, inositol trisphosphate; CaN, protein phosphatase 3; GM-CSF, granulocyte-macrophage colony-stimulating factor; NKR-P1C, killer cell lectin-like receptor subfamily B member 1C; IFNsR, interferon receptor; +p, phosphorylation; − p, dephosphorylation.
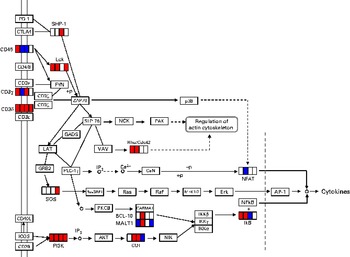
DEG involved in T-cell activation in each period is given in online supplementary Table S4. The mapping of these genes on the pathway is shown in Fig. 4. The up-regulated genes among them behaved in a similar manner as DEG associated with NK cells. Among these genes, two (Cd3d and Pik3cd) were up-regulated until day 14. To confirm the changes in gene expression detected by the DNA microarray analysis, quantitative RT-PCR was used to analyse the selected genes implicated in NK cell (Lck and Pik3cd) and T-cell (Cd3d, Lck and Pik3cd) activating signalling pathways (Table 3). Cd3d was significantly up-regulated on day 14, and Lck was significantly up-regulated on days 1 and 14. Although there were no statistically significant differences (P= 0·061 and 0·384 on days 4 and 7, respectively), the averages of Lck mRNA levels were higher in the treated group than in the control group throughout the time course. Pik3cd was also up-regulated on days 1, 7 and 14, although there was no significant difference (P= 0·168) on day 4.
Differentially expressed genes (DEG) involved in T-cell receptor signalling pathway (Kyoto Encyclopedia of Genes and Genomes (KEGG) PATHWAY database). DEG were mapped to the KEGG T-cell receptor signalling pathway. A small box within each gene represents each of the four sampling points, and the order is, from left to right, days 1, 4, 7 and 14. Significantly up-regulated and down-regulated genes during Lactobacillus brevis KB290 feeding detected by DNA microarray are given in red and blue, respectively. PD-1, programmed cell death 1; CTLA4, cytotoxic T-lymphocyte-associated protein 4; SHP-1, Src homology region 2 domain-containing phosphatase 1; CD45, protein tyrosine phosphatase, receptor type, C; CD4/8, CD4/8 antigen; Lck, lymphocyte-specific protein tyrosine kinase; CD3ɛ, CD3 antigen, epsilon polypeptide; FYN, Fyn proto-oncogene; CD3γ, CD3 antigen, γ polypeptide; CD3ζ, CD247 antigen; ZAP70, ζ-chain (TCR)-associated protein kinase; p38, mitogen-activated protein kinase; Cd3δ, CD3 antigen, δ polypeptide; SLP-76, lymphocyte cytosolic protein 2; NCK, non-catalytic region of tyrosine kinase adaptor protein; PAK, p21 protein (Cdc42/Rac)-activated kinase; GADS, GRB2-related adaptor protein 2; LAT, linker for activation of T cells; VAV, vav oncogene; Rho/Cdc42, ras homologue gene family, member A/cell division cycle 42; GRB2, growth factor receptor-bound protein 2; PLC-1γ, phospholipase C, γ-1; IP3, inositol trisphosphate; CaN, protein phosphatase 3; NFAT, nuclear factor of activated T cells; SOS, son of sevenless homologue 1; RasGRP1, RAS guanyl-releasing protein 1; Ras, rat sarcoma virus oncogene; Raf, v-raf-leukaemia viral oncogene 1; MEK1/2, mitogen-activated protein kinase kinase 1/2; Erk, mitogen-activated protein kinase; AP-1, activator protein-1; PKC8, protein kinase C, θ; CARMA1, caspase recruitment domain family, member 11; IKK, inhibitor of κB kinase; CD40L, CD40 ligand; BCL-10, B-cell leukaemia/lymphoma 10; IkB, nuclear factor of kappa light polypeptide gene enhancer in B cell inhibitor; MALT1, mucosa-associated lymphoid tissue lymphoma translocation gene 1; ICOS, inducible T-cell co-stimulator; CD28, CD28 antigen; PI3K, phosphatidylinositol 3 kinase; AKT, thymoma viral proto-oncogene; COT, mitogen-activated protein kinase kinase kinase 8; NIK, mitogen-activated protein kinase kinase kinase 14; +p, phosphorylation; − p, dephosphorylation.
Discussion
It has been shown that some probiotics are effective in the modulation of the immune system in experimental animal models and human subjects( Reference Ishikawa, Akedo and Otani 4 – Reference Drago, Toscano and De Vecchi 7 ).
Detailed mechanisms by which probiotics modulate immune functions are strongly required to be clarified. KB290 administered at a high concentration, 1 × 10¹⁰CFU/d, induces cell-mediated cytotoxic activity of mouse splenocytes against YAC-1 cells in 1 d as reported previously( Reference Fukui, Sasaki and Fuke 17 ). Both DNA microarray and quantitative RT-PCR analyses supported the immunological activity of KB290 in a short duration. It has been reported that immunological responses by probiotics vary depending on the amount, viability, growth phase and strain of the probiotic administered, and on the administration period( Reference Kirjavainen, ElNezami and Salminen 25 – Reference van Baarlen, Troost and van Hemert 27 ). These are the main parameters that influence the efficiency of probiotic activity in the immune system. Research conducted in the long term, not just 1 d, provides a new insight into the understanding of enhancement of immunological capacity exerted by probiotics. Therefore, in the present study, we analysed cell-mediated cytotoxic activity and sequential gene expression profiling associated with cytotoxic activity in the spleen of mice during KB290 feeding. KB290 enhanced cytotoxic activity from days 1 to 7, and the effect declined on day 14. The number of up-regulated genes associated with cell-mediated cytotoxic activity increased until day 7 and then reduced on day 14 along with a rate of increase in cell-mediated cytotoxic activity by KB290 feeding v. the control diet.
Cell-mediated cytotoxicity is a primary indicator of immune function for defence against intracellular pathogens and tumour cells( Reference Biron, Nguyen and Pien 28 – Reference Valiathan, Lewis and Melillo 30 ). Although chromium (51Cr)-release assay has been recognised as the ‘gold standard’ for cytotoxicity, it has several disadvantages, such as hazardous radioactivity, high cost and short half-life, not quantified at a single-cell level and difficulties in labelling target cells with 51Cr. Flow cytometric assay gave results comparable with those obtained by 51Cr-release assay( Reference Kane, Ashton and Schmitz 31 ). We demonstrated that KB290 enhanced the cell-mediated cytotoxic activity of mouse splenocytes from days 1 to 7 by flow cytometric assay.
On the one hand, GO terms related to immunity were enriched in the up-regulated gene set until day 7, whereas these GO terms became non-significant on day 14. On the other hand, GO terms related to the cellular process such as cell cycle, cell division and organelle organisation were enriched in the down-regulated gene set on day 14. Cell differentiation is closely related to cell-cycle exit( Reference Miller, Yeh and Vidal 32 ). Although further studies are required to understand why genes involved in the cell cycle were significantly down-regulated by KB290 feeding, immunological differentiations were negatively correlated with cell-cycle progression.
Continuous administration of antigens is known to induce immune tolerance in the host( Reference Borges, Rorato and Avraham 33 , Reference Li, Wang and Redmond 34 ). Intracellular antigens degraded by the proteasome are loaded onto MHC class I molecules and displayed on the cell surface. Recognition of antigenic peptides via MHC class I by CD8+ cytotoxic T cells leads to the killing of target cells, such as infected and tumour cells. Intracellular as well as extracellular antigens are presented to CD8+ cytotoxic T cells by antigen-presenting cells, known as cross-presentation( Reference Bevan 35 ). In the present study, both DNA microarray and quantitative RT-PCR analyses revealed that genes related to antigen processing and presentation such as B2m, H2-d1 and H2-k1 encoding the MHC class I protein complex were up-regulated until day 7 and then the up-regulation of these genes disappeared on day 14. These results suggested that the antigen-presenting activity was enhanced by KB290 feeding from day 1, but the activation returned to baseline on day 14.
Cd3d encodes the T-cell receptor complex protein involved in the activation of CD8+ cytotoxic T cells that act as cytolytic effector cells to kill cancer and infected cells. Cd3d remained up-regulated until day 14 as detected by DNA microarray, but only on day 14 as revealed by the quantitative RT-PCR analysis. Therefore, Cd3d was up-regulated on day 14 definitely.
The genes associated with NK cell-mediated cytotoxicity in the KEGG pathway was significantly enriched in the up-regulated gene set on day 1 as reported previously( Reference Fukui, Sasaki and Fuke 17 ). Hence, we investigated the time course of changes in the expression of genes involved in the pathway. The number of up-regulated genes associated with cell-mediated cytotoxicity was maintained until day 7 and then diminished on day 14 along with a rate of increase in cell-mediated cytotoxic activity by KB290 feeding v. the control diet. Even though the number of up-regulated genes decreased on day 14, the results obtained from the DNA microarray and quantitative RT-PCR analyses revealed that Lck and Pik3cd involved in both NK cell and T-cell cytotoxicity signalling pathways were up-regulated. Perforin, granzyme B and FasL, which are cytotoxic molecules, were not found to be up-regulated in the DNA microarray analysis. However, Wu et al. ( Reference Wu, Dwyer and Dyer 36 ) reported that up-regulation of components of the cell-mediated cytotoxicity pathway (Pik3) was possibly associated with effective cytotoxicity function. Therefore, we assume that Pik3 plays a crucial role in cell-mediated cytotoxic activity. Lck is an integral component of NK cell signalling and important for induction of cytotoxicity( Reference Fukui, Sasaki and Fuke 17 ). In addition, Vim encoding Vimentin, which is a direct ligand of NK cell-activating receptor (NKp46) and can induce the cytolytic activity of NK cells( Reference Garg, Barnes and Porgador 37 ), was found to be up-regulated throughout the time course. Exocytosis of granules containing apoptosis-inducing proteins is one mechanism by which cytotoxic T lymphocytes and NK cells kill target cells( Reference Russell and Ley 38 ). Although it is impossible to identify which cells are responsible for the enhancement of cell-mediated cytotoxic activity by KB290 feeding, the up-regulated genes Cd3d, Lck, Pik3cd and Vim could contribute to the maintenance of cell-mediated cytotoxic activity on day 14.
In the present study, we indicated that changes in the expression of genes related to NK cell and T-cell-activating signalling and antigen processing and presentation in a time-related manner can reflect changes in cytolytic activity depending on KB290 feeding. These results support the finding that KB290 is a probiotic that activates host immunity. These results could be used as a basis for understanding the mechanism of immune modulation exerted by ingesting probiotics. However, regulation of gene expression by probiotics remains largely unknown. Elucidation of the mechanism leads to a new understanding of health effects of probiotics. Moreover, for a better understanding of the mechanisms by which KB290 enhances host immune system and cytotoxic activity, further studies are required to investigate the interaction between the gut mucosal immune system and KB290. Further studies are also required to address more extensively the confirmation of physiological effects that could result from measured differential gene expression.
Supplementary material
To view supplementary material for this article, please visit http://dx.doi.org/10.1017/S0007114514000191
Acknowledgements
The authors thank Ms M. Fukuda (Kagome Company Limited) for technical assistance. The authors also thank Dr A. Kishi, Dr K. Akatani (Louis Pasteur Center for Medical Research) and Dr H. Kodama (Kagome Company Limited) for excellent advice.
The present study received no specific grant from any funding agency, commercial or not-for-profit sectors.
The authors' responsibilities are as follows: Y. F., Y. N., K. A. and N. Y. designed the study; Y. F., E. S. and N. F carried out the animal experiments; Y. F., E. S., T. I. and Y. N. carried out the molecular biology experiments and data analysis; Y. F. wrote the paper. All the authors approved the final manuscript.
The authors declare that there are no conflicts of interest.


