

Disclaimer: The views expressed in this publication are those of invited contributors and not necessarily those of the Institute and Faculty of Actuaries. The Institute and Faculty of Actuaries do not endorse any of the views stated, nor any claims or representations made in this publication and accept no responsibility or liability to any person for loss or damage suffered as a consequence of their placing reliance upon any view, claim or representation made in this publication. The information and expressions of opinion contained in this publication are not intended to be a comprehensive study, nor to provide actuarial advice or advice of any nature and should not be treated as a substitute for specific advice concerning individual situations. On no account may any part of this publication be reproduced without the written permission of the Institute and Faculty of Actuaries.
1. Introduction
The Net Zero and Implications for Investment Portfolios working party aims to help actuaries improve their understanding of what net zero means for an investment portfolio and key mechanisms to achieve this, as well as key challenges to date and the outlook for development. This paper follows on from the ideas introduced in Net Zero Investing - A Beginner’s Guide (Horwitz et al., Reference Horwitz2022), produced by the Net Zero Portfolio Alignment working party.
The goal of the Paris Agreement (United Nations Framework Convention on Climate Change, 2016) is to prevent global temperatures from rising by more than 2°C above pre-industrial levels and pursue efforts to limit it to 1.5°C above pre-industrial levels. This requires a significant reduction in global greenhouse gas emissions and achieving net-zero emissions by 2050.
Portfolio alignment metrics are forward-looking metrics that are intended to help investors understand whether their investment portfolios are on track to meet the goals of the Paris Agreement and to encourage capital flows towards activities needed for a net zero transition.
In 2020–2022 a number of metrics were put forward (Portfolio Alignment Team at the Task Force for Climate-Related Financial Disclosures, 2020, 2021; Glasgow Financial Alliance for Net Zero [GFANZ], 2022). Since then, companies and actuaries have been exploring the practicalities of these metrics and starting to incorporate them into investment reporting and design, but this has not been without key challenges.
This paper explores the following questions:
-
1. What types of portfolio alignment metrics are most commonly adopted and why?
-
2. How are portfolio alignment metrics being used?
-
3. To what extent are these metrics meeting their intended purpose of encouraging investment portfolios that enable the net zero transition?
2. Methodology
The working party carried out a literature review to inform the research group about types of portfolio alignment metrics and how they are being used. This entailed a detailed review of technical papers on the subject and a high-level review of publicly available reports to understand how companies and actuaries use portfolio alignment metrics in practice. Members of the working party were also able to draw upon their own experience and knowledge of regional usage and application of portfolio alignment metrics, as well as those of their colleagues, in contributing to this paper.
2.1. What are Portfolio Alignment Metrics?
Portfolio alignment metrics assess how well-aligned individual companies and investment portfolios are with the net zero goals of the Paris Agreement. They aim to help investors understand to what extent their investment portfolios are contributing towards the transition to net zero and to direct capital flows towards companies and activities that have a positive contribution towards achieving net zero.
Backward-looking metrics are the most well-known types of climate metrics. They provide a picture of where the portfolio stands today and are based on the total greenhouse gas emissions associated with the assets underlying the portfolio. Such metrics are simple to understand, easy to calculate and enable simple comparisons between investment portfolios. However, they are wholly reliant on historical data and so provide no information about what will happen to portfolio emissions in the future.
Portfolio alignment metrics are forward-looking metrics. These metrics aim to indicate the ‘future path’ of a portfolio, capturing whether individual companies within the investment portfolio are expected to align with net zero in the future. This depends on factors such as the level of decarbonisation commitments made by the underlying companies, or the sectors and geographies in which they lie. As they are looking into the future, forward-looking metrics tend to use more complex assumptions or calculations.
A company that scores well against a backwards-looking emissions metric may perform poorly against a forward-looking portfolio alignment metric. For example, the total emissions of a portfolio may at first sight appear low. However, the total emissions of that portfolio may quickly be overtaken in the race to net zero by another portfolio with higher total emissions today, but with underlying assets with more aggressive net zero transition plans.
There are several different types of portfolio alignment metrics, each of which has different advantages and disadvantages. Each is assessed at an individual company level and can then be aggregated across portfolios, though some lend themselves to aggregation more than others.
There are four broad types of portfolio alignment metrics: binary metrics, maturity scale alignment metrics, benchmark divergence metrics and implied temperature rise. No single portfolio alignment metric is perfect, so a combination of metrics can be used to complement one another. While each has different features, together these portfolio alignment metrics provide a more rounded picture of portfolio alignment than a single metric.
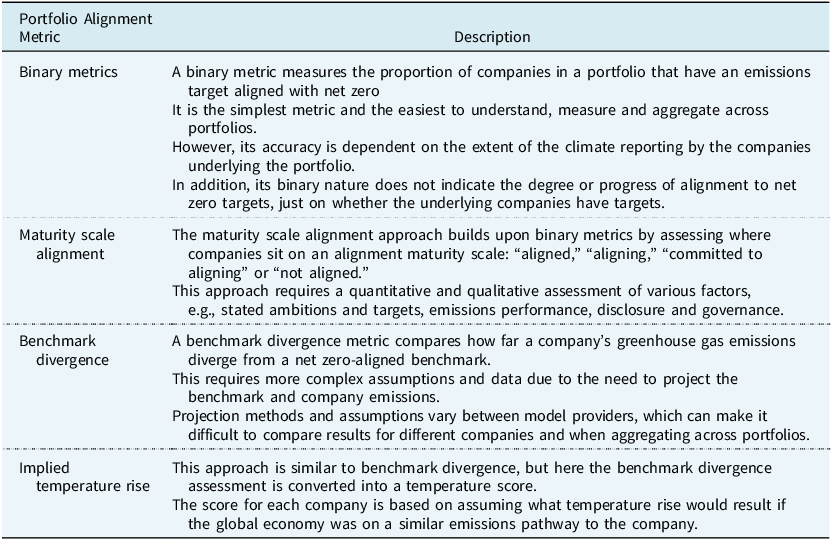
Table 1 sets out the four main portfolio alignment metrics, which are shown in increasing order of complexity. More details are set out in the Task Force on Climate-Related Financial Disclosures TCFD (2017) and GFANZ (2022) papers. Some types of portfolio alignment metric have been more widely used than others, which is explored in Section 2.
Description of the four main portfolio alignment metrics

As noted in Table 1, apart from binary metrics, these metrics generally require some level of quantitative assessment of decarbonisation pathways or the remaining carbon budget available before a certain level of temperature rise. There are considerable uncertainties involved in calculating carbon budgets and some uncertainty about whether pathways to limit temperature rises to 1.5°C above pre-industrial levels remain feasible. These are not covered in this paper, but are explored in more detail in the IFoA’s series of papers on Planetary Solvency (Trust et al., Reference Trust2024, Reference Trust2025).
2.2. Case Study
The following case study is adapted from a similar case study by LCP (2022). The purpose of this case study is to show how the metrics, when used in practice, can differentiate between two companies in the same industry.
Figure 1 shows the projected emissions intensity for two companies in the oil and gas sector, Company A and Company B, against the Transition Pathway Initiative’s three benchmark scenarios (Transition Pathway Initiative, 2024), shown by the blue shaded areas. The grey line represents Company A and the red line represents Company B. The solid lines represent reported emissions intensity to 2021 while the dotted lines represent projected emissions intensity from 2021 to 2050, assuming the companies achieve their emission reduction targets.
Comparing Company A and Company B’s projected emissions intensities against the Transition Pathway Initiative’s three benchmark scenarios.
Source: Transition Pathway Initiative.

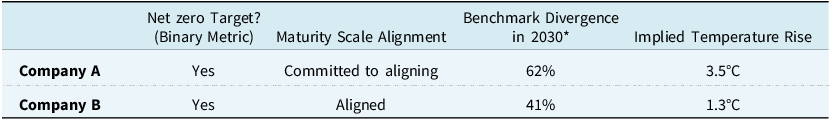
Table 2 shows the assessment of the two companies against the four portfolio alignment metrics. We can see that in this example both companies have set net zero emissions targets. Company A is assessed as “committed to aligning” because, although it has a net zero target, it has no plan for how it is going to implement it. Company B is assessed as “aligned” towards a net zero pathway because it is on track to achieve its plan for achieving its net zero target. Company A is on track for a temperature rise of 3.5°C and so is not aligned to a benchmark emissions pathway under the benchmark divergence metric (its projected emissions intensity is above the shaded blue area). On the other hand, Company B’s projected emissions are below the 1.5°C pathway in 2050, with an implied temperature rise of 1.3°C.
Assessing Company A and B against the four main types of portfolio alignment metrics. *where we are considering percentage difference in emissions intensity compared to that needed to limit temperature increases to 1.5°C below pre-industrial levels

2.3 How are Portfolio Alignment Metrics Being Used in Investing?
There are various ways that portfolio alignment metrics are used in investing. In this section, we consider how portfolio alignment metrics are used in:
-
The design of investment products
-
Institutional reporting on the climate impact of investments
-
Verifying if company targets are aligned to net zero
-
Different regions of the world
2.3.1. Incorporation into investment products
Responsible investing is an emerging area in many countries, with most jurisdictions this working party researched limited to using qualitative Environmental, Social and Governance themes to construct funds. However, in the UK and EU (and sometimes the US), where responsible investing is more widespread, portfolio alignment metrics are starting to be used in the design of investment products. Initially, this was mostly in equities, but now products exist across a range of asset classes.
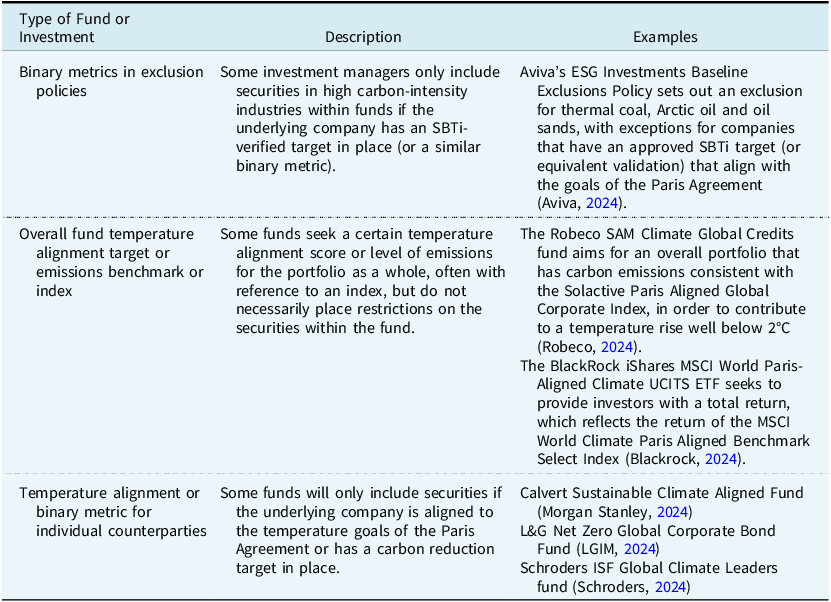
The working party found several ways in which funds and investments use portfolio alignment metrics, as set out in Table 3. Note that the examples are just a sample of funds on the market, not recommendations, and some of the examples may fall into more than one category.
Types of funds or investments using portfolio alignment metrics

These data-driven metrics and rules are straightforward to calculate for asset managers compared to more subjective active management and may be easier for investors to understand. However, these funds are reliant on the actions of the invested companies to meet their net-zero fund objectives and so may not impact the net zero transition without the asset manager also engaging with companies.
2.3.2. Metrics used in institutional reporting
One of the main uses of portfolio alignment metrics is to fulfil climate reporting requirements. Reporting standards generally build on TCFD recommendations (TCFD, 2017), but vary in the detail they require.
The International Sustainability Standards Board published two international sustainability standards in 2023 (IFRS S1: General Sustainability-related Disclosures and IFRS S2: Climate-related disclosures). These standards incorporate the TCFD recommendations. The IFRS S2 guidance for asset managers (IFRS, 2023) includes reporting the amount of assets under management, by asset class, that apply ESG considerations in investment decisions. IFRS S2 does not specify portfolio alignment metrics.
However, the UK is one major jurisdiction that has regulations that do specify portfolio alignment metrics.
One example is the UK Department for Work & Pensions (DWP) TCFD reporting requirements. The DWP requires large UK occupational pension schemes to disclose a portfolio alignment metric in their TCFD reports, with accompanying guidance listing recommended metrics (Department for Work & Pensions, 2022). Schemes are required to comply with the requirements “as far as they are able” and justify any assumptions or adjustments made due to gaps in data.
A second example is the Financial Conduct Authority (FCA) ESG sourcebook (Financial Conduct Authority, 2025). The sourcebook requires large financial services companies, including asset managers and insurers, regulated by the FCA to publish TCFD reports for the entity and its products. A TCFD product report, must, “as far as reasonably practicable” include “metrics that show the climate warming scenario with which a TCFD product is aligned, such as using an implied temperature rise metric.”
From a high-level review of publicly available reports for pension schemes by the Pensions Regulator (The Pensions Regulator, 2024), binary metrics are most popular, followed by implied temperature rise. Other types of portfolio alignment metrics were not used.
Although the IIGCC suggests that maturity scale alignment metrics are being increasingly used (Institutional Investors Group on Climate Change, 2024), and at least one manager has a public preference for them (Aberdeen Investments, 2023), we also did not find frequent use of maturity scale alignment metrics in regulatory reporting at the time of carrying out our research. This could be because they are being used internally by companies, but are not published in regulatory reports. Regulatory reviews of early examples of climate disclosures (The Pensions Regulator, 2023) suggest that there are still significant gaps in the metrics being reported and that they are often not being integrated in companies’ overall strategies and the investment decision-making process.
2.3.3 Verifying if company targets are aligned to net zero
It is becoming increasingly common for companies to seek independent approval of their targets to protect them from greenwashing risk and to improve their reputation with potential investors. Assessments of net zero targets using independent databases and bodies help investors understand whether the companies they are invested in have net zero targets, and whether the pace of change is aligned with net zero. This data can then feed into decisions on which companies they continue to invest with and into internal reporting and external disclosures.
However, there are some limitations. For example, some companies have decided not to submit their targets to independent bodies for assessment, either because they have not made sufficient progress or lack the data for the assessment.
2.3.4. Types of independent databases and bodies which assess net zero targets
Independent organisations such as Net Zero Tracker track which companies have set net zero (or other climate) targets, with Net Zero Tracker estimating that circa 58% of the largest 2000 companies globally have set a net zero target (Net Zero Tracker, 2024).
The Science Based Targets Initiative (SBTi) acts as an external verification body for net-zero targets. Companies submit their targets to SBTi for SBTi to assess whether the targets are sufficiently credible. That is, whether they are in line with the greenhouse gas emissions pathways needed to be aligned with the goals of the Paris Agreement, for that company’s geography and economic sector. If the target is sufficiently aligned, then SBTI will approve the targets. However, there has been some challenge from industry on the SBTi methodology. This includes the SBTi board’s announcement in April 2024 that it was considering accepting carbon offsets to mitigate some types of emissions (Net Zero Investor, 2024; Science Based Targets Initiative, 2024). Currently, 60% of companies in the SBTi dashboard have approved targets (Science Based Targets Initiative, 2024).
The IIGCC’s Net Zero Investment Framework 2.0 (Institutional Investors Group on Climate Change, 2024) adopts the maturity scale alignment approach in its guidance for net zero target setting and implementation.
Data providers such as MSCI and CDP maintain databases on the extent to which they believe company targets are aligned with the Paris Agreement, based on data from organisations including SBTi and their own in-house methodology. Indicators include binary metrics on whether the targets are SBTi-approved and the implied temperature rise for each company.
2.3.5. Limitations of databases and independent bodies used to assess net zero targets
Some companies have decided not to submit their targets to independent bodies for assessment, either because they have not made sufficient progress or lack the data for the assessment. This leads to gaps in available data, giving an incomplete view to investors.
There is also a lack of consensus on net zero scenarios, with different third parties choosing different pathways for assessing whether the targets are aligned with net zero. Therefore, a target assessed as net zero in one database may not be in another, making it difficult to compare datasets.
2.3.6. How do different regions embrace portfolio alignment metrics?
There is a split between different world regions in their use of portfolio alignment metrics.
In advanced economies, such as the UK and EU, portfolio alignment metrics are integrated into some regulatory frameworks such as TCFD. Portfolio alignment metrics are increasingly used by financial institutions to choose more sustainable investment strategies. An increasingly complex approach is also used, with detailed methodology intended to lead to transparency and standardisation (McKinsey & Company, 2021). However, this complexity can act as a barrier to understanding and effective implementation (Fulcrum, 2022). Data and model availability is steadily improving, although data is only available for some asset classes and geographical areas.
In developing economies, such as the Caribbean, the use of portfolio alignment metrics is less prevalent and sophisticated, with limited standardisation. There are multiple challenges in increasing adoption. There is often a short-term focus on economic growth and response to increasing frequency of physical climate risk events rather than on long-term climate strategies. There is less technical expertise, with a shortage of sustainable finance professionals, a lack of comprehensible and reliable data sources, and also less developed financial systems leading to a slower uptake of global trends and less promotion of the use of such metrics.
The disparity in adoption between developed and developing regions leads to a fragmented global approach to sustainable finance, which could potentially hinder global efforts to combat climate change effectively. Although global regulatory frameworks, such as the IFRS standards, have been developed, this is just a first step to addressing the issue and increasing the use of portfolio alignment metrics.
A more globally coordinated approach is still needed, which considers the unique challenges of different regions. This could include: international bodies and developed economies sharing expertise and providing training to build local expertise; considering financial incentives for adoption; implementing pilot projects or case studies in less developed regions to provide valuable insights and encourage broader adoption; and continuing to develop alternative metrics which require less complex methodology.
3. Conclusions
Overall, portfolio alignment metrics are being used to some extent to drive net-zero transition in investment portfolios, but in more limited cases than were originally envisioned. Use within disclosures is mixed. A small number of regulations, mostly in the UK, make it compulsory to include portfolio alignment metrics. However, where such metrics are optional, companies are often choosing not to use them because the complex assumptions and data requirements underlying the metrics make them difficult to calculate and understand. When portfolio alignment metrics are reported it is unclear that they are feeding into strategic investment decisions.
In the UK and EU, the metrics are being used by asset managers to drive portfolio construction decisions and to sell new climate transition funds. Some companies are also using them to verify whether their targets are Paris-aligned.
In other regions, there is lower use of portfolio alignment metrics. Without global usage, portfolio alignment metrics will not do enough to encourage investment portfolios that enable the net zero transition, other than at a regional level. They are more likely to become a technical tool for asset managers with only a limited impact on the transition.
If the investment industry believes portfolio alignment metrics should remain a key approach to facilitate the transition, more education and better data are needed to encourage take-up across the world, possibly backed with stronger regulatory requirements.
Acknowledgements
The authors would like to thank Craig Campbell for his continued support of the working party’s research.


 Open access