


Introduction
The Drake equation (Drake, Reference Drake1961, Reference Drake, Mamikunian and Briggs1965) offers a useful roadmap to lay out limiting factors to the frequency of observable extraterrestrial intelligences. In Drake's probabilistic argument, the number of technological civilizations detectable by radioastronomy (N) is a product of the following: the average rate of star formation in the galaxy (R*), the fraction of stars with a planetary system (f p), the average number of habitable planets per star (ne), the fraction of these on which life eventually arises (f l), the fraction of such biospheres in which intelligent lifeforms able to develop a technological civilization (henceforth ‘sophonts’, after Wright et al., Reference Wright, Sheikh, Almár, Denning, Dick and Tarter2018) will evolve (f i), the fraction of sophonts that develop to emit detectable forms of communication (f c) and the temporal duration (L) of such communications.
Each variable in Drake's equation can be decomposed virtually ad infinitum into a series of further terms. Factored into f I are the probabilities of classical ‘major evolutionary transitions’ (Szathmáry and Smith, Reference Szathmáry and Smith1995), including eukaryogenesis and complex multicellularity or exobiological analogues thereof (Levin et al., Reference Levin, Scott, Cooper and West2019). As shown by the millions of non-sophont multicellular eukaryotes on Earth (Mora et al., Reference Mora, Tittensor, Adl, Simpson and Worm2011; Larsen et al., Reference Larsen, Miller, Rhodes and Wiens2017), these major evolutionary steps are necessary but insufficient preconditions for technological civilization to arise (Levin et al., Reference Levin, Scott, Cooper and West2019). For Homo sapiens to evolve into a civilization-building species, additional ‘minor’ or proximate transitions were required. Among them was the transition from an animal-grade organization, combining complex multicellularity and heterotrophic habits (Butterfield, Reference Butterfield2011; Knoll, Reference Knoll2011; Cavalier-Smith, Reference Cavalier-Smith2017), to sophonce sensu Wright et al. (Reference Wright, Sheikh, Almár, Denning, Dick and Tarter2018). This proximate transition can be factored into Drake's equation as f s: the fraction of biospheres where animal-grade organisms give rise to N ≥ 1 sophont species. f s will be the focus of the present paper.
Whereas the astrophysical terms of Drake's equation (R*, f p and ne) have all been constrained observationally (Frank and Sullivan, Reference Frank and Sullivan2016), the history and properties of life on Earth provide the only available starting points to estimate the value of the ‘biotic’ terms, including f s. In this respect, a sample size of 1 biosphere is suboptimal, but far from uninformative (Simpson, Reference Simpson2015). The timing and frequency of abiogenesis, major evolutionary transitions and other evolutionary events in Earth's history have all been analysed to extrapolate their cosmic probabilities and identify rate-limiting ‘critical steps’ in extraterrestrial technological intelligence (ETI) evolution (Watson, Reference Watson2008; Spiegel and Turner, Reference Spiegel and Turner2012; Kipping, Reference Kipping2020; Snyder-Beattie et al., Reference Snyder-Beattie, Sandberg, Drexler and Bonsall2021).
Evolutionary analyses of intelligence's likelihood must inevitably factor in observer selection effects – the correlations between the observation of given properties and the existence of the observer in the first place (Bostrom, Reference Bostrom2013). Given selection effects, any observer assessing the frequency of intelligence in the universe must necessarily spawn from a biosphere where all preconditions to sophonce were met at least once – that is, in the observer's own lineage. However, for the observer to exist, these preconditions need not have been met multiple times independently, hampering the assessment of their likelihood. In this light, the study of evolutionary histories beyond the observer's own lineage (e.g. Conway Morris, Reference Conway Morris2003; Martinez, Reference Martinez2014; Roth, Reference Roth2015) offers a precious independent source of evidence to infer which preconditions to ETI are most and least likely to obtain (Powell, Reference Powell2020).
Human sophonce rests on the unique ‘ratchet’ of open-ended cumulative cultural evolution (CCE), by which stepwise improvements in cultural products are retained and elaborated upon across generations (Tennie et al., Reference Tennie, Call and Tomasello2009; Powell, Reference Powell2020). This trait distinguishes humans from other species known to produce socially transmitted technologies (Tennie et al., Reference Tennie, Call and Tomasello2009), none of which qualifies as sophont sensu Wright et al. (Reference Wright, Sheikh, Almár, Denning, Dick and Tarter2018). Its uniqueness is often taken to imply a conspiracy of evolutionary contingencies unlikely to be repeated in Earth's future or in extraterrestrial biospheres – ‘even those that evolve complex brains, sociality, and intelligence broadly conceived’ (Powell, Reference Powell2020). This scenario corresponds to extremely low values for f s and, all else being equal, N: to produce technological signatures observable over interstellar distances (e.g. Drake, Reference Drake1961, Reference Drake, Mamikunian and Briggs1965; Ćirković, Reference Ćirković2006; Bradbury et al., Reference Bradbury, Ćirković and Dvorsky2011; Beatty, Reference Beatty2022; Haqq-Misra et al., Reference Haqq-Misra, Fauchez, Schwieterman and Kopparapu2022a, Reference Haqq-Misra, Kopparapu, Fauchez, Frank, Wright and Lingam2022b) CCE stands out as a minimal prerequisite (Powell, Reference Powell2020).
Importantly, however, human CCE stands on a cumulated set of necessary evolutionary preconditions or ‘exaptations’ (Gould and Vrba, Reference Gould and Vrba1982). Minimally, these include high domain-general intelligence (Chiappe and MacDonald, Reference Chiappe and MacDonald2005), sociality (Ward and Webster, Reference Ward and Webster2016), tool use (Van Lawick-Goodall, Reference Van Lawick-Goodall, Lehrman, Hinde and Shaw1971) and culture, defined as socially transmitted group-level behaviour (Laland and Galef, Reference Laland and Galef2009), together with any putative cognitive or behavioural unicum of H. sapiens. While CCE itself has appeared only once on Earth, at least some of its enabling exaptations have evolved repeatedly, and often in combination, in different lineages (e.g. Ćirković, Reference Ćirković2018a).
Here, the likelihood of an extremely low f s value is assessed by considering not only the phylogenetic spread of CCE exaptations but also their timing of origin relative to the evolutionary events bracketing f s – the appearance of animal-grade organisms and that of human sophonce itself. First, palaeontological proxies and phylogenetic comparisons will be used to map the timing of the evolution of CCE preconditions in intelligent, social, tool-using animals, including primates, cetaceans, proboscideans, corvids, parrots and cephalopods. Next, the plausibility of the ‘Silurian hypothesis’ – the proposal that humans are not the first civilization-building species to evolve on Earth (Schmidt and Frank, Reference Schmidt and Frank2019) – will be assessed through the lens of the fossil record, strengthening the case for the geological recency of CCE preconditions. The merits of ‘long-fuse’ (Bogonovich, Reference Bogonovich2011) and step-based models of cognitive evolution will then be discussed in light of this phenomenon. Based on intelligence's timing and phylogenetic spread and the tempo of cognitive evolution in H. sapiens' own lineage, the following hypotheses will be laid out:
1. On Phanerozoic Earth, the first-order control on the evolution of intelligence has been the supply rate of evolutionary novelty and not the availability of permissive global geobiological conditions.
2. The transition from animal-grade multicellularity to sophonce is not a rate-limiting factor to N.
3. Contrary to the ‘Silurian hypothesis’ (Schmidt and Frank, Reference Schmidt and Frank2019), H. sapiens is most likely the first sophont to evolve on Earth.
4. All else being equal, in biospheres harbouring animal-grade multicellularity the temporal frequency and permanence of sophonce can be expected to increase nonlinearly as a function of time.
The evolutionary recency of CCE exaptations
CCE preconditions including flexible tool use (Boire et al., Reference Boire, Nicolakakis and Lefebvre2002; Overington et al., Reference Overington, Morand-Ferron, Boogert and Lefebvre2009; Shumaker et al., Reference Shumaker, Walkup and Beck2011; Heldstab et al., Reference Heldstab, Kosonen, Koski, Burkart, van Schaik and Isler2016), sociality (Dunbar, Reference Dunbar2009; Shultz, and Dunbar, Reference Shultz and Dunbar2010), innovativeness (Sol et al., Reference Sol, Olkowicz, Sayol, Kocourek, Zhang, Marhounová and Němec2022) and general problem-solving and learning abilities (Jerison, Reference Jerison1985; Reader and Laland, Reference Reader and Laland2002; Rushton, and Ankney, Reference Rushton and Ankney2009; Benson-Amram et al., Reference Benson-Amram, Dantzer, Stricker, Swanson and Holekamp2016) all positively correlate with measures of relative brain size across phylogenetically disparate taxa, suggesting that these indicators represent imperfect but informative proxies for ‘intelligence’ (Smaers et al., Reference Smaers, Rothman, Hudson, Balanoff, Beatty, Dechmann and Safi2021). In particular, the encephalization quotient (EQ), the ratio between observed and predicted brain mass for a given body size (Jerison, Reference Jerison1973), provides a useful comparative measure that is widely applicable across vertebrates. EQ can be defined mathematically as EQ = E a/E e, where E a is the actual brain mass for a given taxon and E e is its expected value based on nonlinear regression on brain mass scores across the taxonomic group of reference (e.g. mammals; Jerison, Reference Jerison1973). EQ can be adjusted to account for the effects of phylogenetic non-independence, yielding a ‘phylogenetic EQ’ score (PEQ; Ni et al., Reference Ni, Flynn, Wyss and Zhang2019).
By combining EQ proxies with complementary data from the neuroanatomy of living and fossil species (e.g. Knoll and Kawabe, Reference Knoll and Kawabe2020) and comparative cognition, the non-uniformity of animal intelligence through geological time has been established at multiple taxonomic scales. Long-term macroevolutionary increases in mean and maximum encephalization, neural complexity and the size of brain areas devoted to higher cognition have been convincingly documented in birds (e.g. Ksepka et al., Reference Ksepka, Balanoff, Smith, Bever, Bhullar, Bourdon and Smaers2020; Stacho et al., Reference Stacho, Herold, Rook, Wagner, Axer, Amunts and Güntürkün2020), mammals (e.g. Jerison, Reference Jerison1973, Reference Jerison and Zaidel1994; Smaers et al., Reference Smaers, Turner, Gómez-Robles and Sherwood2018, Reference Smaers, Rothman, Hudson, Balanoff, Beatty, Dechmann and Safi2021; Bertrand et al., Reference Bertrand, Shelley, Williamson, Wible, Chester, Flynn and Brusatte2022) and vertebrates as a whole (e.g. Russell, Reference Russell1983; Northcutt, Reference Northcutt2002; Rospars, Reference Rospars2010). Likewise, both phylogenetic bracketing and palaeontological proxies for cognitive abilities indicate that the appearance of CCE exaptations in vertebrates is a geologically recent phenomenon, largely postdating the Eocene epoch (56–33.9 million years ago – Mya). This pattern holds true for those lineages conventionally thought to comprise the most ‘intelligent’, socially complex and technologically capable nonhumans, including primates, cetaceans, proboscideans, corvids and parrots.
Primates
Endocasts of stem-group primates, which first appear in the fossil record in the Palaeocene (~66 Mya; Wilson Mantilla et al., Reference Wilson Mantilla, Chester, Clemens, Moore, Sprain, Hovatter and Renne2021), show limited neocortical development and relative brain sizes almost universally lower than those of any living prosimians (i.e. strepsirrhines and tarsiers), with some falling below the mammalian EQ average. Together, these proxies (Gingerich and Gunnell, Reference Gingerich and Gunnell2005; Silcox et al., Reference Silcox, Dalmyn and Bloch2009; Harrington et al., Reference Harrington, Silcox, Yapuncich, Boyer and Bloch2016) suggest a lack of complex sociality and high domain-general intelligence. Even among crown-group primates, the convergent evolution of CCE exaptations (e.g. Ottoni and Izar, Reference Ottoni and Izar2008) is circumscribed to anthropoids – the clade comprising platyrrhines (‘New World’ monkeys) and catarrhines (‘Old World’ monkeys, including humans).
Both Old and New World monkeys comprise multiple lineages of highly social, cognitively sophisticated tool users. A vast literature attests to the social intelligence (e.g. de Waal, Reference de Waal1982; Tomasello and Call, Reference Tomasello and Call1994; Tomasello, Reference Tomasello2022), flexible problem-solving (e.g. Emery and Clayton, Reference Emery and Clayton2004; Schmitt et al., Reference Schmitt, Pankau and Fischer2012), culture (e.g. Whiten et al., Reference Whiten, Goodall, McGrew, Nishida, Reynolds, Sugiyama and Boesch1999; Van Schaik et al., Reference Van Schaik, Ancrenaz, Borgen, Galdikas, Knott, Singleton and Merrill2003; Schofield et al., Reference Schofield, McGrew, Takahashi and Hirata2018) and technological capabilities (e.g. Boesch and Boesch, Reference Boesch and Boesch1990; Van Schaik et al., Reference Van Schaik, Fox and Sitompul1996; Malaivijitnond et al., Reference Malaivijitnond, Lekprayoon, Tandavanittj, Panha, Cheewatham and Hamada2007; Carvalho et al., Reference Carvalho, Biro, McGrew and Matsuzawa2009) of catarrhines, including apes. In recent decades, the same traits have increasingly been documented in platyrrhines, with particular attention devoted to the problem-solving skills (Fragaszy and Cummins-Sebree, Reference Fragaszy and Cummins-Sebree2005) and tool-use traditions of capuchin monkeys (Ottoni and Izar, Reference Ottoni and Izar2008).
Since their >36 million years (Myr) old Eocene split (Bond et al., Reference Bond, Tejedor, Campbell, Chornogubsky, Novo and Goin2015), platyrrhines and catarrhines attained high encephalization levels independently, as revealed by comparisons among living and fossil anthropoids. Ancestral states reconstructions based on fossil endocasts of stem-group platyrrhines and catarrhines suggest that a PEQ of about 1 – comparable to those of the non-tool-using, solitary prosimian tarsiers – represents the ancestral condition for both lineages (Ni et al., Reference Ni, Flynn, Wyss and Zhang2019); in contrast, PEQs > 3 occur in both living platyrrhines and catarrhines, with most apes falling in the 3–4 range (Ni et al., Reference Ni, Flynn, Wyss and Zhang2019).
Less emphasized in the astrobiological literature is the fact that encephalization and cerebral complexification are also recurring themes within both the catarrhine and platyrrhine clades (Reader et al., Reference Reader, Hager and Laland2011). Phylogenetically informed comparisons of fossil endocasts suggest that encephalization, an accompanying shrinkage of olfactory bulbs and the emergence of the convoluted neocortex associated with higher cognitive abilities such as tool use and sociality occurred independently in the two catarrhine subgroups – cercopithecoids and hominoids (Gonzales et al., Reference Gonzales, Benefit, McCrossin and Spoor2015) – within the last 17–18 Myr. Overall, the evidence from comparative cognition and neuroanatomy indicates that high general intelligence almost certainly evolved convergently at least three times in catarrhines from the Miocene onwards: in baboons, macaques and apes (Reader et al., Reference Reader, Hager and Laland2011). Likewise, PEQs in the 3–4 range evolved independently in the social, highly encephalized spider monkeys and tool-using capuchins (Wildman et al., Reference Wildman, Jameson, Opazo and Soojin2009; Ni et al., Reference Ni, Flynn, Wyss and Zhang2019) after the origins of the platyrrhine crown-group around 20.8–27.0 Mya (Beck et al., Reference Beck, de Vries, Janiak, Goodhead and Boubli2023). This strongly suggests that anthropoids combined high general intelligence, culturally transmitted technologies and complex sociality no earlier than the latest Oligocene.
Cetaceans
Cetaceans have been found to match or outperform anthropoids in mnemonical and metacognitive problem-solving and assemble some of the most complex societies of all nonhuman animals (Marino, Reference Marino and Kalof2017; Connor et al., Reference Connor, Krützen, Allen, Sherwin and King2022). Social learning in cetaceans has precipitated the emergence of cultures at multiple scales of social organization, with some centred on tool use (Noad et al., Reference Noad, Cato, Bryden, Jenner and Jenner2000; Rendell and Whitehead, Reference Rendell and Whitehead2003; Whitehead and Rendell, Reference Whitehead and Rendell2004; Helweg et al., Reference Helweg, Eriksen, Tougaard and Miller2005; Krützen et al., Reference Krützen, Mann, Heithaus, Connor, Bejder and Sherwin2005; Garland et al., Reference Garland, Goldizen, Rekdahl, Constantine, Garrigue, Hauser and Noad2011, Reference Garland, Garrigue and Noad2022; Allen et al., Reference Allen, Weinrich, Hoppitt and Rendell2013; Wild et al., Reference Wild, Hoppitt, Allen and Krützen2020; Ramos et al., Reference Ramos, Santoya, Verde, Walker, Castelblanco-Martínez, Kiszka and Rieucau2021). In some species, such as orcas (Orcinus orca), cultural niches may be sufficiently entrenched to drive the kind of gene-culture ‘coevolution’ traditionally seen as a hallmark of hominin history (Foote et al., Reference Foote, Vijay, Ávila-Arcos, Baird, Durban, Fumagalli and Wolf2016). However, beyond their basic eutherian groundplan the cytoarchitectures of cetacean and primate brains are fundamentally distinct, clearly reflecting a long Cenozoic history of independent evolution (Marino, Reference Marino2002, Reference Marino and Kalof2017).
The earliest cetaceans evolved from archaic ungulates akin to the Eocene (~48 Myr old) Indohyus. This animal had a plesiomorphic mammalian brain with a small and simply folded neocortex (Orliac and Thewiseen, Reference Orliac and Thewissen2021). Accordingly, the EQ of the LCA of cetaceans and their living sister-group – hippos – has been estimated at 0.465, well below the mammalian average (Montgomery et al., Reference Montgomery, Geisler, McGowen, Fox, Marino and Gatesy2013). Endocasts of the first fully aquatic cetaceans, the Palaeogene (~53 to ~30 Myr ago) Archaeoceti, show very limited change in EQ relative to this ancestral baseline (Montgomery et al., Reference Montgomery, Geisler, McGowen, Fox, Marino and Gatesy2013; Marx et al., Reference Marx, Lambert, Uhen, Marx, Lambert and Uhen2016; Marino, Reference Marino2022).
In contrast, the mid-late Cenozoic witnessed two major encephalization pulses in cetaceans, accompanied by significant cortical expansion and restructuring (Marino et al., Reference Marino, McShea and Uhen2004; Montgomery et al., Reference Montgomery, Geisler, McGowen, Fox, Marino and Gatesy2013; Marino, Reference Marino2022). The first occurred with the Oligocene (~35 Myr ago) emergence of the Neoceti, comprising present-day baleen (Mysticeti) and toothed whales (Odontoceti). The Oligocene saw a marked upward shift in encephalization relative to the archaeocete baseline: the estimated EQ of the neocete LCA (~1.383) is well within the modern toothed whale range (Montgomery et al., Reference Montgomery, Geisler, McGowen, Fox, Marino and Gatesy2013). Odontocetes experienced a further encephalization pulse at the base of the delphinoid clade, which originated around 15–20 Mya (Fig. 1). Delphinoids comprise the most cognitively sophisticated cetaceans, with neocortex folding and encephalization levels in dolphins (EQs ~4–5) surpassing those of all nonhuman primates (Marino et al., Reference Marino, McShea and Uhen2004; Montgomery et al., Reference Montgomery, Geisler, McGowen, Fox, Marino and Gatesy2013; Marino, Reference Marino and Kalof2017; Smaers et al., Reference Smaers, Rothman, Hudson, Balanoff, Beatty, Dechmann and Safi2021). In some delphinoid lineages, the pace of encephalization within the last 10 Myr outstripped that of hominins (Montgomery et al., Reference Montgomery, Geisler, McGowen, Fox, Marino and Gatesy2013), showing that human brain enlargement is not unique in its recent accelerando (Püschel et al., Reference Püschel, Bertrand, O'reilly, Bobe and Püschel2021).
The temporal and phylogenetic distribution of maximal EQ values and likely CCE exaptations in (from top to bottom) catarrhines, platyrrhines, cetaceans, proboscideans, psittaciforms, corvids, decapods and octopods. Tree bifurcations indicate approximate divergence dates between the lineages marked by icons on the right. Tieplots show the presence of exaptations to sophonce in their respective lineages; for each lineage, maximum EQ values (Jerison, Reference Jerison1973) are represented by shading (legend in the top-left corner). In non-vertebrates to which EQ measures are inapplicable, branches are marked by N/A. Data from Ni et al. (Reference Ni, Flynn, Wyss and Zhang2019); Montgomery et al. (Reference Montgomery, Geisler, McGowen, Fox, Marino and Gatesy2013); Benoit et al. (Reference Benoit, Legendre, Tabuce, Obada, Mararescul and Manger2019); Ksepka et al. (Reference Ksepka, Balanoff, Smith, Bever, Bhullar, Bourdon and Smaers2020); Prum et al. (Reference Prum, Berv, Dornburg, Field, Townsend, Lemmon and Lemmon2015); Whalen and Landman (Reference Whalen and Landman2022).

Proboscideans
Proboscideans offer further evidence for mammalian intelligence being phylogenetically disparate, ecologically unconstrained and geologically recent. While elephant toolmaking in the wild is restricted to ‘fly swats’ manufactured by breaking off branches (Hart et al., Reference Hart, Hart, McCoy and Sarath2001; Bates et al., Reference Bates, Poole and Byrne2008), captive elephants can exploit a range of unfamiliar tools using their remarkably versatile manipulatory trunk (Shoshani, Reference Shoshani1997) and possibly solve physical cognition tasks by insight (Foerder et al., Reference Foerder, Galloway, Barthel, Moore and Reiss2011). Further, elephants display exceptionally strong mnemonical (McComb et al., Reference McComb, Moss, Durant, Baker and Sayialel2001, Reference McComb, Shannon, Sayialel and Moss2014; Byrne et al., Reference Byrne, Bates and Moss2009) and numerical skills among nonhuman animals (Irie et al., Reference Irie, Hiraiwa-Hasegawa and Kutsukake2019) and manifest social learning within complex fission-fusion societies (Lee and Moss, Reference Lee, Moss, Box and Gibson1999; Byrne et al., Reference Byrne, Lee, Njiraini, Poole, Sayialel, Sayialel and Moss2008, Reference Byrne, Bates and Moss2009). These capacities rest on large brains with significant cytoarchitectural differences from those of primates or cetaceans, from which they split as far back as the late Cretaceous (Hart et al., Reference Hart, Hart and Pinter-Wollman2008) and that share with elephants the basic cellular architecture and macrostructure common to all placental mammals (Bertrand et al., Reference Bertrand, Shelley, Williamson, Wible, Chester, Flynn and Brusatte2022).
The earliest fossil proboscideans, exemplified by the Eocene (~35 Myr ago) Moeritherium, had an EQ of about 0.2 – a value approaching that of sirenians, the proboscidean sister-group (O'Shea and Reep, Reference O'Shea and Reep1990; Upham et al., Reference Upham, Esselstyn and Jetz2019). From this baseline well below the modern mammalian average, brain enlargement in proboscideans was matched by increases in body mass until the Oligocene, around 30 Myr, when sustained stepwise encephalization began (Benoit et al., Reference Benoit, Legendre, Tabuce, Obada, Mararescul and Manger2019). While relative brain sizes subsequently decreased in some extinct proboscidean clades, an EQ similar to that of living elephants (and an order of magnitude higher than that of Moeritherium) probably characterized their ~8 Myr LCA with mammoths (Benoit et al., Reference Benoit, Legendre, Tabuce, Obada, Mararescul and Manger2019). Large brains might also have evolved convergently during the Miocene in a basal lineage that split from elephants over 30 Myr ago, the Deinotheriidae; however, detailed endocasts for this group are lacking (Benoit et al., Reference Benoit, Legendre, Tabuce, Obada, Mararescul and Manger2019; Baleka et al., Reference Baleka, Varela, Tambusso, Paijmans, Mothé, Stafford and Hofreiter2022).
As in primates and cetaceans, proboscideans attained their maximum known encephalization values late in their history, in the Pleistocene (~0.5 Myr old) Sicilian dwarf elephant Palaeoloxodon falconeri. Its EQ of around 4 was anomalous for proboscideans and roughly on par with that of dolphins (Larramendi and Palombo, Reference Larramendi and Palombo2015; Lyras, Reference Lyras2018; Benoit et al., Reference Benoit, Legendre, Tabuce, Obada, Mararescul and Manger2019). The degree to which the oversized brain of P. falconeri was tied to a minimal size threshold for brain functioning (Palombo and Giovinazzo, Reference Palombo and Giovinazzo2005; Larramendi and Palombo, Reference Larramendi and Palombo2015) is unclear since encephalization is by no means a universal correlate of island dwarfism (Lyras, Reference Lyras2018). Tantalizingly, P. falconeri matched humans and surpassed other elephants in its longevity and delay of sexual maturity, accommodating a long growth phase (Köhler et al., Reference Köhler, Herridge, Nacarino-Meneses, Fortuny, Moncunill-Solé, Rosso and Moyà-Solà2021). As in humans (Gould, Reference Gould1985), this extended maturation phase was complemented by a paedomorphic adult morphology, with a globular and proportionally enlarged braincase (Larramendi and Palombo, Reference Larramendi and Palombo2015). Given its cerebral architecture, delayed maturation and the possibility of island settings being particularly conducive to tool use (Hansell and Ruxton, Reference Hansell and Ruxton2008; Haslam, Reference Haslam2013), the recently extinct P. falconeri might have possessed a range of CCE exaptations unmatched among proboscideans.
Avian intelligences
Like mammals (Bertrand et al., Reference Bertrand, Shelley, Williamson, Wible, Chester, Flynn and Brusatte2022), birds underwent rapid and convergent encephalization during the Cenozoic while greatly expanding their EQ range (Ksepka et al., Reference Ksepka, Balanoff, Smith, Bever, Bhullar, Bourdon and Smaers2020). The earliest Mesozoic birds, such as the 150 Myr old Archaeopteryx, overlapped with their non-avian theropod ancestors in relative brain size (Balanoff et al., Reference Balanoff, Bever, Rowe and Norell2013). The same holds true for members of the grade comprising ratites, fowl, grebes and pigeons – all of which diverged between the late-Cretaceous and the earliest Palaeogene around 66 Mya (Field et al., Reference Field, Benito, Chen, Jagt and Ksepka2020; Ksepka et al., Reference Ksepka, Balanoff, Smith, Bever, Bhullar, Bourdon and Smaers2020).
Soon after the Cretaceous-Palaeogene boundary (66 Mya), a significant shift towards larger brains and smaller bodies took place at the base of the vast evolutionary radiation spawning the rest of living birds, the Neoaves (Claramunt and Cracraft, Reference Claramunt and Cracraft2015; Ksepka et al., Reference Ksepka, Balanoff, Smith, Bever, Bhullar, Bourdon and Smaers2020). Against the neoavian baseline, high encephalization evolved multiple times independently during the Cenozoic (Ksepka et al., Reference Ksepka, Balanoff, Smith, Bever, Bhullar, Bourdon and Smaers2020). Paleoneurology and comparative neuroanatomy also suggest convergent Cenozoic increases in the size of the avian neocortex homologue known as wulst (Stacho et al., Reference Stacho, Herold, Rook, Wagner, Axer, Amunts and Güntürkün2020), which is involved in higher mental functions including tool use (Milner and Walsh, Reference Milner and Walsh2009; Tambussi et al., Reference Tambussi, Degrange and Ksepka2015; Walsh and Knoll, Reference Walsh and Knoll2018) but was likely absent in at least some Mesozoic stem-group birds (Beyrand et al., Reference Beyrand, Voeten, Bureš, Fernandez, Janáček, Jirák, Rauhut and Tafforeau2019). In particular, dramatic wulst enlargements occurred in the parrot (Psittaciformes) and corvid (Corvidae) lineages (Walsh and Knoll, Reference Walsh and Knoll2018), which also comprise the most encephalized of birds. Parrots and corvids reached EQs on par with those of apes (Emery and Clayton, Reference Emery and Clayton2004) convergently and by distinct routes: whereas parrots reduced their body sizes relative to the brain, corvid brain enlargement outpaced a parallel increase in body size, as in the case of hominin encephalization (Ksepka et al., Reference Ksepka, Balanoff, Smith, Bever, Bhullar, Bourdon and Smaers2020).
The fossil record of corvids is fragmentary, hampering the tracking of their brain evolution. Nonetheless, the inferred timing of corvid origins based on molecular data (Jønsson et al., Reference Jønsson, Fabre, Kennedy, Holt, Borregaard, Rahbek and Fjeldså2016) broadly matches the age of their earliest fossil remains. These are attributed to the middle Miocene (~15 Myr ago) corvids Miocorvus (Milne-Edwards, Reference Milne-Edwards1869; Gál and Kessler, Reference Gal, Kessler and Csiki2006) and Miocitta (Brodkorb, Reference Brodkorb1972), both known mainly from fragmentary limb bones. The fossils of later middle Miocene corvids, such as Miopica, are similarly scant (Курочкин and Соболев, Reference Курочкин and Соболев2004). However, all belong to small birds that may have been behaviourally, phenotypically and cognitively (Ksepka et al., Reference Ksepka, Balanoff, Smith, Bever, Bhullar, Bourdon and Smaers2020) closer to other living passerines than most extant corvids. Fossils from the Pliocene onwards belong instead to morphologically and possibly cognitively modern forms (e.g. Kessler, Reference Kessler2013; Pavia, Reference Pavia2020; Nunez-Lahuerta et al., Reference Nunez-Lahuerta, Galán, Cuenca-Bescos and Huguet2021).
Besides primates, corvids are arguably the most plausible living precursors to sophonce. These birds display high social intelligence (Clayton et al., Reference Clayton, Dally and Emery2007; Keefner, Reference Keefner2016), numerosity (Nieder, Reference Nieder2018), cooperative hunting and problem-solving (Seed et al., Reference Seed, Clayton and Emery2008; Yosef and Yosef, Reference Yosef and Yosef2010) and, tentatively, future-planning abilities (Raby et al., Reference Raby, Alexis, Dickinson and Clayton2007). Their physical and social cognition skills broadly match those of apes (e.g. Bird and Emery, Reference Bird and Emery2009; von Bayern et al., Reference von Bayern, Danel, Auersperg, Mioduszewska and Kacelnik2018; Pika et al., Reference Pika, Sima, Blum, Herrmann and Mundry2020), with tentative experimental support for causal reasoning and insight (Bird and Emery, Reference Bird and Emery2009; Taylor et al., Reference Taylor, Hunt, Medina and Gray2009, Reference Taylor, Miller and Gray2012).
A corvid, the New Caledonian crow (Corvus moneduloides), also possesses some of the most remarkable toolmaking traditions among animals (Hunt and Gray, Reference Hunt and Gray2007; Holzhaider et al., Reference Holzhaider, Hunt and Gray2010). In the wild, New Caledonian crows famously manufacture ‘fishing probes’ out of hooked twigs, fern branches, or Pandanus leaves to forage (Hunt, Reference Hunt1996; Hunt and Gray, Reference Hunt and Gray2004). New Caledonian crow toolmaking is selective (Chappell and Kacelnik, Reference Chappell and Kacelnik2002), flexible (Knaebe et al., Reference Knaebe, Taylor, Elliffe and Gray2017) and culturally transmitted (Holzhaider et al., Reference Holzhaider, Hunt and Gray2010). Uniquely among birds, its geographical variants hint at a degree of CCE, with stepwise modifications of an ancestral design that cannot be explained by ecological variability alone (Hunt and Gray, Reference Hunt and Gray2003) despite seemingly lacking the open-endedness of human CCE. This impressive toolmaking repertoire, the product of dexterous beaks that like hominin hands may have ‘coevolved’ with tools (Matsui et al., Reference Matsui, Hunt, Oberhofer, Ogihara, McGowan, Mithraratne and Izawa2016), shows that primate-like appendages are not a prerequisite for complex technology.
This hypothesis is corroborated by parrot tool use, which rivals that of corvids in complexity. Goffin's cockatoos (Cacatua goffiniana) manufacture wedge-like, piercing and extractive tools deployed sequentially as part of a functional set. This procedurally taxing form of tool use was previously thought to be restricted to primates (O'Hara et al., Reference O'Hara, Mioduszewska, Mundry, Haryoko, Rachmatika, Prawiradilaga and Auersperg2021). In another creative instance of tool use, the omnivorous Kea (Nestor notabilis) of New Zealand, which shows puzzle-solving skills at least on par with those of New Caledonian crows (Auersperg et al., Reference Auersperg, Von Bayern, Gajdon, Huber and Kacelnik2011), can use sticks to deactivate baited traps (Goodman et al., Reference Goodman, Hayward and Hunt2018). Complementary evidence for complex cognition in parrots comes from studies on numerosity, memory and categorization skills (Pepperberg, Reference Pepperberg2006), as well as cooperative problem-solving (Schwing et al., Reference Schwing, Jocteur, Wein, Noë and Massen2016) and possibly culture (Klump et al., Reference Klump, Martin, Wild, Hörsch, Major and Aplin2021).
Given the phylogenetic spread of CCE exaptations in parrots, their origins probably trace back to the 40–30 Myr old LCA of Keas and all other living parrots (Prum et al., Reference Prum, Berv, Dornburg, Field, Townsend, Lemmon and Lemmon2015; Provost et al., Reference Provost, Joseph and Smith2018; Selvatti et al., Reference Selvatti, Galvão, Mayr, Miyaki and Russo2022). Unfortunately, the avian fossil record is too sparse and fragmentary to track brain evolution in parrots from an Eocene passerine-like baseline (Mourer-Chauviré, Reference Mourer-Chauviré1992; Mayr and Göhlich, Reference Mayr and Göhlich2004; Worthy et al., Reference Worthy, Tennyson and Scofield2011; Mayr, Reference Mayr2015). Nonetheless, it corroborates an early-mid Cenozoic origin for their crown-group (Waterhouse, Reference Waterhouse2006).
Cephalopod intelligence: A temporal outlier?
The phylogenetic chasm separating cephalopod molluscs and vertebrates makes complex cognition in coleoids – the clade including octopods (octopi and their close relatives) and decapods (squids and cuttlefish) – a uniquely informative case study in convergent evolution (Moroz, Reference Moroz2009; Vitti, Reference Vitti2013; Roth, Reference Roth2015). The LCA of coleoids and vertebrates lacked the shared organizational features of the tripartite avian and mammalian brains (Vitti, Reference Vitti2013). In fact, it plausibly lacked a brain altogether (Hejnol and Martindale, Reference Hejnol and Martindale2008), considerably weakening the case for attributing the recurrent evolution of animal intelligence to shared neuroanatomical underpinnings (Lineweaver, Reference Lineweaver, Seckbach and Walsh2009).
Coleoids are widely considered the most intelligent living invertebrates (Moroz, Reference Moroz2009; Vitti, Reference Vitti2013; Roth, Reference Roth2015; Amodio et al., Reference Amodio, Boeckle, Schnell, Ostojic, Fiorito and Clayton2019, Reference Amodio, Shigeno and Ostojić2020). Cuttlefish possess a sense of numerosity (Yang and Chiao, Reference Yang and Chiao2016) and can delay gratification to reap higher-quality future rewards, a putative invertebrate unicum (Schnell et al., Reference Schnell, Boeckle, Rivera, Clayton and Hanlon2021). Octopi have been shown to solve puzzles by ‘insight’ (Richter et al., Reference Richter, Hochner and Kuba2016), possess strong memory-based navigation (Mather and O'Dor, Reference Mather and O'Dor1991) and physical intelligence (Fiorito et al., Reference Fiorito, von Planta and Scotto1990; Borrelli et al., Reference Borrelli, Chiandetti and Fiorito2020) and recognize both real and virtual objects (Kawashima et al., Reference Kawashima, Takei, Yoshikawa, Yasumuro and Ikeda2020). Some may engage in social learning (Amodio and Fiorito, Reference Amodio, Fiorito, Menzel and Benjamin2013). More broadly, sociality is widespread in coleoids. In decapods, it manifests along a continuum from lifelong gregariousness in squid to episodic shoaling in cuttlefish (Drerup and Cooke, Reference Drerup and Cooke2021). While octopi have instead often been portrayed as quintessentially solitary, this is not the case for all species. For instance, gloomy octopi (Octopus tetricus) tolerate high densities of sedentary conspecifics, with whom they engage in multi-faceted social interactions (Scheel et al., Reference Scheel, Chancellor, Hing, Lawrence, Linquist and Godfrey-Smith2017).
Coleoids also display multiple variants of tool use. Several species use jets from their siphon to repeal other animals or flush away objects (Mann and Patterson, Reference Mann and Patterson2013), including during play (Mather and Anderson, Reference Mather and Anderson1999). To this form of ‘liquid’ tool use, octopi add the selection and transport of objects to modify their dens (Mather, Reference Mather1994) and the launch of debris to fend off conspecifics (Godfrey-Smith et al., Reference Godfrey-Smith, Scheel, Chancellor, Linquist and Lawrence2021). Remarkably, at least one species (Amphioctopus marginatus) crafts composite tools in the form of portable shelters and shows possible anticipatory behaviours by transporting them for future deployment (Finn et al., Reference Finn, Tregenza and Norman2009).
In light of their Precambrian LCA with birds and mammals, the intelligence of cephalopods has been implied to be similarly ancient and taken as an argument for the improbability of sophonce arising even in lineages possessing multiple CCE preconditions over extended timespans (Lineweaver, Reference Lineweaver, Seckbach and Walsh2009, p. 10). If so, cephalopods would stand out as major outliers in an evolutionary landscape where intelligence is largely a Cenozoic phenomenon. However, palaeontology and comparative cognition do not support this notion.
The cerebral organization of ancestral Cambrian shelled cephalopods (Kröger et al., Reference Kröger, Vinther and Fuchs2011) is likely mirrored by that of Nautilus, as shown by outgroup comparisons (Sasaki et al., Reference Sasaki, Shigeno, Tanabe, Shigeta, Hirano, Tanabe, Shigeta, Sasaki and Hirano2010). The Nautilus brain consists of a circumesophageal ring with little internal differentiation (Shigeno et al., Reference Shigeno, Sasaki, Moritaki, Kasugai, Vecchione and Agata2008). In contrast, coleoids display the most complex nervous systems known in invertebrates (Darmaillacq et al., Reference Darmaillacq, Dickel and Mather2014): both decapods and octopods possess elaborate, multilobed brains, adding hierarchical organization and a profusion of interconnections to their molluscan groundplan (Grasso and Basil, Reference Grasso and Basil2009).
The roots of coleoid cerebral complexity probably lie in the loss of their ancestral molluscan shell, which may have fostered cognitive evolution by upping predatory pressure and facilitating the exploitation of challenging, variable benthic habitats (Amodio et al., Reference Amodio, Boeckle, Schnell, Ostojic, Fiorito and Clayton2019). In accord with this hypothesis, predatory pressure from fishes and other marine vertebrates has often been invoked as an ancient driver of coleoid cognitive evolution (Packard, Reference Packard1972). These ‘shell loss’ scenarios hint at more recent origins of coleoid intelligence than may otherwise be assumed. Shell reduction and loss is a recurring theme in the post-Devonian (<360 Ma; Whalen and Landman, Reference Whalen and Landman2022) history of coleoids: in accord with Packard's (Reference Packard1972) scenario, escalating taxonomic and ecological diversification in fishes – particularly during the mid-late Mesozoic – was accompanied by independent losses or shrinkages of mineralized skeletons in both vampyropods and decapods (Dera et al., Reference Dera, Toumoulin and De Baets2016; Whalen and Landman, Reference Whalen and Landman2022). For instance, squids probably internalized and reduced their skeletons in offshore, deepwater Mesozoic habitats; in all likelihood, their sophisticated physical intelligence and body patterning abilities evolved independently of those of other cephalopods amid a later Cenozoic re-invasion of shelf settings (Arkhipkin et al., Reference Arkhipkin, Bizikov and Fuchs2012; Amodio et al., Reference Amodio, Boeckle, Schnell, Ostojic, Fiorito and Clayton2019).
If the colonization of complex shallow-water and seafloor niches was an important driver of coleoid cognitive evolution (Amodio et al., Reference Amodio, Boeckle, Schnell, Ostojic, Fiorito and Clayton2019, Reference Amodio, Shigeno and Ostojić2020), this link may be most apparent in the camouflage skills and physical intelligence of the largely benthic incirrate octopi (e.g. Octopus; Amodio et al., Reference Amodio, Boeckle, Schnell, Ostojic, Fiorito and Clayton2019), which possess the most elaborate multilobed brains of all cephalopods (Grasso and Basil, Reference Grasso and Basil2009). Similarly, benthic habits probably fostered the evolution of the elaborate camouflage and signalling repertoire of cuttlefish (Josef and Shashar, Reference Josef, Shashar, Darmaillacq, Dickel and Mather2014). The shallow-water benthos was most likely colonized independently, and recently, by the ancestors of Octopus and Sepia: the bodyplans of early vampyropods (Fuchs et al., Reference Fuchs, Klinghammer and Keupp2007; Whalen and Landman, Reference Whalen and Landman2022) and stem-group decapods such as belemnites (Rowe et al., Reference Rowe, Kruta, Landman, Villier, Fernandez and Rouget2022; Whalen and Landman, Reference Whalen and Landman2022) suggest a nektopelagic habit in the coleoid LCA. Since the morphology and plausible lifestyle of the earliest known Mesozoic octopi were reminiscent of free-swimming cirrates (Fuchs and Schweigert, Reference Fuchs and Schweigert2018; Fuchs et al., Reference Fuchs, Iba, Heyng, Iijima, Klug, Larson and Schweigert2020) the late-Mesozoic (López-Córdova et al., Reference López-Córdova, Avaria-Llautureo, Ulloa, Braid, Revell, Fuchs and Ibáñez2022; Whalen and Landman, Reference Whalen and Landman2022) LCA of living Octopoda was probably not benthic, either (Amodio et al., Reference Amodio, Boeckle, Schnell, Ostojic, Fiorito and Clayton2019; Reference Amodio, Shigeno and Ostojić2020).
Independent evidence from neuroanatomy and comparative cognition also suggests that the intelligence of octopi and decapods arose partly by parallel elaborations of a simpler ancestral blueprint. MRI scans of the vampire squid Vampyroteuthis infernalis, the basalmost living member of the octopod lineage (Vampyropoda), have revealed a relatively small, smooth (lissencephalous) brain (Rowe et al., Reference Rowe, Kruta, Landman, Villier, Fernandez and Rouget2022). In contrast, several lineages of coastal, partly social octopi possess cerebral lobes with complex surface convolutions. This neuroanatomical condition (gyrencephaly) is also associated with sociality and behavioural complexity in vertebrates (Rowe et al., Reference Rowe, Kruta, Landman, Villier, Fernandez and Rouget2022).
Lissencephaly in vampire squids may hypothetically be a consequence of their derived bathypelagic lifestyle (Rowe et al., Reference Rowe, Kruta, Landman, Villier, Fernandez and Rouget2022). However, currently available evidence suggests that it is more likely to be an ancestral condition. Vampyroteuthis has a cerebrotype intermediate between decapods and octopods (Maddock and Young, Reference Maddock and Young1987) and is generally considered the most plesiomorphic extant vampyropod (Whalen and Landman, Reference Whalen and Landman2022). Accordingly, the lissencephaly of vampire squids is shared with decapods (Chung et al., Reference Chung, Kurniawan and Marshall2022). These observations suggest that the complex cerebral gyres and subdivided lobes of gyrencephalous octopi are not ancestral coleoid traits but rather relatively recent cognitive specializations that probably evolved multiple times independently within octopods themselves (Chung et al., Reference Chung, Kurniawan and Marshall2022).
Overall, palaeontology and comparative cognition paint a picture of the coleoid LCA as an animal with an intelligence well above the molluscan baseline, but falling short of the remarkable cognitive performances of modern octopi and cuttlefish. In all likelihood, these were partly a product of the escalatory ecological dynamics of Mesozoic oceans, one that in some lineages was later elaborated upon to negotiate shallow-water and benthic niches during the Cenozoic. Octopus-grade brains were almost certainly not a Precambrian invention: while octopi may have split from primates nearly 600 Mya (Lineweaver, Reference Lineweaver, Seckbach and Walsh2009), octopus intelligence – and octopi themselves – are late-Phanerozoic novelties. As such, they offer no argument for a stagnant cognitive landscape in which sophonce is a primate fluke. What cephalopods do offer is evidence that the evolutionary paths to complex cognition are manifold: of all factors traditionally proposed to drive the evolution of mammalian and avian intelligence, only one – variable, complex niches – is shared with coleoids (Vitti, Reference Vitti2013).
Bridging the gap: Does hominization supply a rate-limiting step to N?
Despite the phylogenetic spread of CCE exaptations, it may be proposed that it is the transition between a social, tool-using, cognitively sophisticated animal baseline and sophonce that supplies a rate-limiting step to N. This hypothesis is consistent with CCE being an evolutionary ‘singularity’ on present-day Earth. However, it arguably clashes with the tempo and mode of hominin cognitive evolution.
Hominins split from the chimpanzee lineage less than 10 Myr ago, in the late Miocene (Langergraber et al., Reference Langergraber, Prüfer, Rowney, Boesch, Crockford, Fawcett and Vigilant2012). Their subsequent history was tied to technology, cultural transmission and niche construction to a degree unmatched in other primates and indeed across animals (Sterelny, Reference Sterelny2007). The creation of this hominin ‘socio-cognitive niche’ or ‘hominization’ (Stopa, Reference Stopa1973; Whiten and Erdal, Reference Whiten and Erdal2012) was accompanied by unparalleled encephalization and cerebral reorganization relative to the great ape baseline (Falk, Reference Falk2012; Alatorre Warren et al., Reference Alatorre Warren, Ponce de León, Hopkins and Zollikofer2019; Ni et al., Reference Ni, Flynn, Wyss and Zhang2019; Melchionna et al., Reference Melchionna, Mondanaro, Serio, Castiglione, Di Febbraro, Rook and Raia2020).
Nonetheless, the proposed drivers of the hominin cognitive escalation, including group size and complexity, toolmaking, meat-eating, food processing and terrestriality find at least partial analogues in other primates (Wynn and McGrew, Reference Wynn and McGrew1989; Stanford, Reference Stanford1995, Reference Stanford2001; Dunbar, Reference Dunbar2003; Visalberghi et al., Reference Visalberghi, Fragaszy, Izar, Ottoni, Lee and Antonio2005; Ottoni and Izar, Reference Ottoni and Izar2008; McGrew et al., Reference McGrew, Falótico, Gumert, Ottoni, Overmann and Coolidge2019; Dunbar and Shultz, Reference Dunbar and Shultz2021) and non-primates (Connor, Reference Connor2007; Foote et al., Reference Foote, Vijay, Ávila-Arcos, Baird, Durban, Fumagalli and Wolf2016; Matsui et al., Reference Matsui, Hunt, Oberhofer, Ogihara, McGowan, Mithraratne and Izawa2016). New World monkeys offer a case in point. While probably less cognitively demanding than early Palaeolithic stone knapping (Lombard et al., Reference Lombard, Högberg and Haidle2019), lithic tool use by Cebus likewise entails terrestriality, extractive foraging, social learning and bipedal transport in savanna-like environments. In this respect, it echoes the earliest lithic industries of Pliocene Africa (Ottoni and Izar, Reference Ottoni and Izar2008), which might themselves have been the product of multiple ecologically distinct hominin lineages (Plummer et al., Reference Plummer, Oliver, Finestone, Ditchfield, Bishop, Blumenthal, Lemorini, Caricola, Bailey, Herries, Parkinson, Whitfield, Hertel, Kinyanjui, Vincent, Li, Louys, Frost, Braun, Reeves, Early, Onyango, Lamela-Lopez, Forrest, He, Lane, Frouin, Nomade, Wilson, Bartilol, Rotich and Potts2023). Moreover, putative Pliocene cutting tools have been found to be virtually indistinguishable from the byproducts of stone percussion by monkeys, suggesting that the lithic technologies of early Homo evolved by readily co-opting the products of a simple, phylogenetically widespread behaviour (Proffitt et al., Reference Proffitt, Reeves, Braun, Malaivijitnond and Luncz2023).
After the Pliocene, parallel increases in brain size trends emerged across archaic Homo populations on different continents, both intra- and interspecifically (Rightmire, Reference Rightmire2004; Shultz et al., Reference Shultz, Nelson and Dunbar2012). Pleistocene brain expansion culminated in the evolution of endocast volumes above 1400 cm3 in the two most encephalized species on Earth: modern humans (H. sapiens) and the extinct Neanderthals (H. neanderthalensis), which split from each other before 430 Ka (Arsuaga et al., Reference Arsuaga, Martínez, Arnold, Aranburu, Gracia-Téllez, Sharp and Carbonell2014). In accord with neuroanatomical findings, emerging archaeological data shows that Neanderthals shared a significant portion of the sapiens behavioural and techno-cultural repertoires. These hominins mastered multi-step composite manufacture (Sykes, Reference Sykes, Coward, Hosfield and Pope2015; Hardy et al., Reference Hardy, Moncel, Kerfant, Lebon, Bellot-Gurlet and Mélard2020), specialized bone processing (Soressi et al., Reference Soressi, McPherron, Lenoir, Dogandžić, Goldberg, Jacobs and Texier2013) and fire use (Allué et al., Reference Allué, Mallol, Aldeias, Burguet-Coca, Cabanes, Carrancho, Vaquero, Romagnoli, Rivals and Benazzi2022), with some evidence for cumulative culture (Langley et al., Reference Langley, Clarkson and Ulm2008). Like modern humans, Neanderthals also produced ornaments (Zilhão et al., Reference Zilhão, Angelucci, Badal-García, d'Errico, Daniel, Dayet and Zapata2010; Radovčić et al., Reference Radovčić, Sršen, Radovčić and Frayer2015) and possible decorative motifs (Leder et al., Reference Leder, Hermann, Hüls, Russo, Hoelzmann, Nielbock and Terberger2021).
Whether Neanderthals would have been capable of developing a technological civilization, and could thus be considered ‘sophont’ sensu Wright et al. (Reference Wright, Sheikh, Almár, Denning, Dick and Tarter2018), is unknown. What is increasingly apparent, though, is that their technical and cultural output was not fundamentally dissimilar to that of H. sapiens prior to its late-Pleistocene dispersal outside Africa. For instance, whereas simple nonfigurative symbols were probably produced by both Neanderthals and early African sapiens (Henshilwood et al., Reference Henshilwood, d'Errico, Van Niekerk, Dayet, Queffelec and Pollarolo2018; Leder et al., Reference Leder, Hermann, Hüls, Russo, Hoelzmann, Nielbock and Terberger2021), it was only around 40 000 years ago – after the ‘Out of Africa’ dispersal of our species – that representational art spread around the globe (Roebroeks and Soressi, Reference Roebroeks and Soressi2016; Aubert et al., Reference Aubert, Brumm and Huntley2018; Brumm et al., Reference Brumm, Oktaviana, Burhan, Hakim, Lebe, Zhao and Aubert2021).
Together with language (Berwick and Chomsky, Reference Berwick and Chomsky2016) and religious behaviour (Bloch, Reference Bloch2008), representational art is unknown outside of ‘behaviourally modern’ H. sapiens (Aubert et al., Reference Aubert, Brumm and Huntley2018; Botha, Reference Botha2020). Mastery of these domains certainly appears to be a human singularity. No matter how stark and consequential, though, the cognitive gulf between the Neanderthal-sapiens LCA and modern humans took vanishingly little time to bridge (104–105 years; e.g. Arsuaga et al., Reference Arsuaga, Martínez, Arnold, Aranburu, Gracia-Téllez, Sharp and Carbonell2014) on a geological timescale. In this respect, the transition to ‘behavioural modernity’ was not at all commensurate to major evolutionary transitions spaced hundreds of millions to billions (108–109) of years apart (Levin et al., Reference Levin, Scott, Cooper and West2019) and stands out as an unlikely candidate among possible rate-limiting steps to N. The same holds true if the timeframe is widened to the full 5–10 Myr-long transition between the earliest hominins, which most likely possessed a spectrum of CCE exaptations matched by modern primates (Whiten et al., Reference Whiten, Goodall, McGrew, Nishida, Reynolds, Sugiyama and Boesch1999; Visalberghi et al., Reference Visalberghi, Fragaszy, Izar, Ottoni, Lee and Antonio2005; Ottoni and Izar, Reference Ottoni and Izar2008) and H. sapiens (Langergraber et al., Reference Langergraber, Prüfer, Rowney, Boesch, Crockford, Fawcett and Vigilant2012).
The Silurian hypothesis: A palaeontological test
The proliferation of CCE exaptations within the last 102 Myr of Earth's history, and the early appearance of sophonce in their wake, raises the question of whether this time window is exceptionally favourable to the emergence of technological intelligence, or else finds analogues deeper in geological time. This question is directly relevant to the Silurian hypothesis – the notion that humans were not the first species on Earth to build a technological civilization (Schmidt and Frank, Reference Schmidt and Frank2019). As Schmidt and Frank (Reference Schmidt and Frank2019) note, the fossil record could provide evidence for or against the existence of ‘antecedents’ – species that may ‘lead downstream to the evolution of later civilization-building species’ within a given timeframe.
As highlighted by Frank (Reference Frank2018), the fossil record famously captures only a small percentage of all species that ever existed (Darwin, Reference Darwin1859). However, it is generally adequate for tracking diversification patterns and lineage histories at the family level or above (e.g. Benton, Reference Benton1995, Reference Benton2009; Benton and Simms, Reference Benton and Simms1995; Benton et al., Reference Benton, Wills and Hitchin2000; Tarver et al., Reference Tarver, Braddy and Benton2007; Kalmar and Currie, Reference Kalmar and Currie2010; Sahney and Benton, Reference Sahney and Benton2017). In fact, for many fossil groups taxonomic richness is already approaching an asymptote as sampling increases (Benton, Reference Benton2009). The quality of the fossil record at higher taxonomic levels is also not irreparably compromised as older strata are sampled, providing a surprisingly accurate window onto Phanerozoic evolution (Benton et al., Reference Benton, Wills and Hitchin2000; Sahney and Benton, Reference Sahney and Benton2017) and the means to test the Silurian hypothesis indirectly.
Hundreds of thousands of fossil species are known (Valentine, Reference Valentine1970; Alroy, Reference Alroy2002). Arguably, though, the number of plausible antecedents to sophonce outside the stem-groups of Cenozoic intelligences (e.g. fossil hominins or proboscideans) is virtually null. Unless the evidence for correlations between morphology and intelligence is rejected, this claim cannot be dismissed as a case of survivorship bias. In principle, it would have been possible for an indefinitely large number of extinct fossil lineages to act as starting points for evolutionary trajectories to sophonce. No proposed ‘antecedent’ (Schmidt and Frank, Reference Schmidt and Frank2019), however, shows a buildup of the necessary exaptations.
The prototypical speculative sophont spawned by a fossil lineage is Russell and Séguin's (Reference Russell and Séguin1982) ‘dinosauroid’. This creature was imagined as a future descendant of troodontids, a group of small birdlike theropods possessing the highest relative brain size among dinosaurs. Troodontid EQs were roughly on par with those of ostriches, cassowaries and chicken (Balanoff et al., Reference Balanoff, Bever, Rowe and Norell2013; Ksepka et al., Reference Ksepka, Balanoff, Smith, Bever, Bhullar, Bourdon and Smaers2020). If comparative cognition is any guide, this points to cognitive skills incompatible with civilization-building. None of this indicates that dinosaurian sophonce is impossible in principle. However, troodontid encephalization and cerebral complexity were on par with those of archaic Cretaceous birds and the attainment of corvid- or parrot-grade intelligence in the avian lineage took a further tens of millions of years (Balanoff et al., Reference Balanoff, Bever, Rowe and Norell2013; Ksepka et al., Reference Ksepka, Balanoff, Smith, Bever, Bhullar, Bourdon and Smaers2020). The same applies to dinosauroid sophonce in Russell and Séguin's (Reference Russell and Séguin1982) alternate timeline. While late-Cretaceous troodontids may have had grasping arms and large brains relative to the reptilian baseline (Varricchio et al., Reference Varricchio, Hogan and Freimuth2021), their short temporal range before the end-Mesozoic mass extinction and lack of any sustained encephalization or brain reorganization trends within this timeframe (Ksepka et al., Reference Ksepka, Balanoff, Smith, Bever, Bhullar, Bourdon and Smaers2020) suggest that no hidden transition to sophonce lurks in their fossil record. In this respect, troodontids are unremarkable compared to fossil ratites or fowl, which have never been proposed as plausible antecedents to sophonce.
The evolution of CCE preconditions in dinosaurs did eventually occur, but it was a Cenozoic phenomenon restricted to specific avian clades – far postdating the origins of birdlike dinosaurs. As such, it was decoupled from the evolution of flight (Balanoff et al., Reference Balanoff, Bever, Rowe and Norell2013, Reference Balanoff, Smaers and Turner2016), and by the same token there is no reason to suspect that extinct flying reptiles were singularly intelligent (Edinger, Reference Edinger1948). Accordingly, endocast data suggest that pterosaur EQs fell below those of all living birds, and their large brain size relative to the reptilian baseline is mostly accounted for by large optic and cerebellar lobes for sensorimotor control (Witmer et al., Reference Witmer, Chatterjee, Franzosa and Rowe2003).
Similarly, the timing of cetacean encephalization suggests that there is nothing cognitively special about secondarily aquatic vertebrates per se (Marino et al., Reference Marino, Connor, Fordyce, Herman, Hof, Lefebvre and Whitehead2007; Marino, Reference Marino2022). Extinct Mesozoic marine reptiles, such as the dolphin-like ichthyosaurs, are extremely unlikely candidates for dolphin-like intelligence (Edinger, Reference Edinger1948). Like those of pterosaurs, ichthyosaur brains had enlarged optic and cerebellar lobes for navigating their three-dimensional realm but were reptilian in size, structure and organization (Marek et al., Reference Marek, Moon, Williams and Benton2015). More improbable still is the notion that ichthyosaurs provided the raw materials rather than the brainpower, for manifestations of Mesozoic sophonce. Triassic ichthyosaur skeletons disassembled and turned to artwork by a sophont ‘Kraken’ (McMenamin, Reference McMenamin2012) would offer a ‘smoking gun’ for the Silurian hypothesis. However, this proposal at once ignores far more parsimonious alternatives (Hogler, Reference Hogler1992; Bottjer, Reference Bottjer, Bottjer, Etter, Hagadorn and Tang2002) and conflicts with the timing of coleoid origins and key adaptations as inferred from molecular phylogenetics and the fossil record (see ‘Cephalopods’).
Could proof of ‘Silurians’ lie with an extinct clade phylogenetically closer to humans? As a hypothetical example, Frank (Reference Frank2018) speculated that some early mammal species might have risen to civilization and remained undetected, during the Palaeocene. The mammalian fossil record suggests otherwise. All the available evidence indicates that encephalization and cerebral complexification in mammals followed and did not precede, their Cenozoic rise to ecological prominence. Mammalian lineages experienced rapid and widespread increases in body mass in the immediate aftermath of the end-Cretaceous mass extinction, in which their dinosaurian predators and competitors had been extirpated (Bertrand et al., Reference Bertrand, Shelley, Williamson, Wible, Chester, Flynn and Brusatte2022). Convergent trends towards neocortical expansion, the enlargement of cerebellar regions tied to higher cognition and encephalization (Smaers et al., Reference Smaers, Turner, Gómez-Robles and Sherwood2018, Reference Smaers, Rothman, Hudson, Balanoff, Beatty, Dechmann and Safi2021; Bertrand et al., Reference Bertrand, Shelley, Williamson, Wible, Chester, Flynn and Brusatte2022) only began gaining traction about 10 Myr later (Bertrand et al., Reference Bertrand, Shelley, Williamson, Wible, Chester, Flynn and Brusatte2022). Against this backdrop, any lineage of Palaeocene mammalian sophonts would stand out as an evolutionary fluke. None does. Mammals did spawn a sophont species, but this required tens of millions of years of cumulative cognitive evolution – not a sudden Palaeocene leap forward.
More broadly, cognitive complexification in synapsids, the group comprising mammals and their extinct relatives, is a late-Cenozoic phenomenon. On the grounds of both encephalization and brain structure, a case could be made for the late Permian (~255 Myr ago) Kawingasaurus being the most cognitively advanced non-mammalian synapsid. This small, fossorial creature evolved an analogue of the mammalian neocortex independently of mammal ancestors and had an EQ triple that of other non-mammalian synapsids (Laaß and Kaestner, Reference Laaß and Kaestner2017). However, Kawingasaurus was a cognitive exception in its time only. Its EQ of 0.52 would place it well below average among living mammals, and its neocortical analogue was incipient and primarily devoted to subterranean navigation (Laaß and Kaestner, Reference Laaß and Kaestner2017).
Other hypothetical foreshadows of sophonce in Permian synapsids are similarly unexceptional when set against crown-group mammals. For instance, remotely primate-like grasping appendages and arboreality manifest in the late Permian Suminia, an ‘anomodont’ relative of Kawingasaurus (Ivachnenko, Reference Ivachnenko1994; Fröbisch and Reisz, Reference Fröbisch and Reisz2009). However, the grasping appendages of Suminia were far more akin to the clinging feet of bats or birds than to dexterous primate hands (Fröbisch and Reisz, Reference Fröbisch and Reisz2009). The Suminia braincase also displays none of the cognitive specializations of Kawingasaurus (Rybczynski, Reference Rybczynski2000), let alone any evidence for primate-like intelligence. Although Permian synapsids show sparse harbingers of the exaptations that were to foster mammalian sophonce, by all measures technological civilization was far out of their cognitive reach.
Amid this plethora of unlikely antecedents, the fact still stands: the modern biosphere offers several lineages co-expressing multiple preconditions to sophonce, virtually all of which emerged during the Cenozoic. In stark contrast, the fossil record offers no convincing ‘antecedents’ beyond the stem-groups of those same lineages. The recent and convergent origins of intelligence and other CCE preconditions, the quick appearance of sophonce in their wake and the lack of plausible analogues deeper in geological time add up to a Cenozoic cognitive ‘explosion’ (CE; Fig. 1). As for other evolutionary episodes in the history of life, possible explanations may be sought in both extrinsic, contingent environmental triggers or long-term, cumulative macroevolutionary trends.
Explaining the Cenozoic cognitive ‘explosion’
‘Permissive environment’ explanations: Windows of opportunity as a limiting factor
The onset of permissive physical conditions offers intuitively appealing explanations for key geobiological episodes. The Cambrian Explosion of animal disparity and biodiversity is often explained in terms of ocean oxygenation or other geochemical triggers (Zhang et al., Reference Zhang, Shu, Han, Zhang, Liu and Fu2014). The rise of Carboniferous giant arthropods (Harrison et al., Reference Harrison, Kaiser and VandenBrooks2010) and vertebrate flight (Dudley, Reference Dudley1998) has similarly been attributed to a jump in atmospheric O2 and that of Cretaceous angiosperms to global warming or aridity (Zhang et al., Reference Zhang, Dai, Du, Ji and Hu2018). By the same token, mid-Cenozoic global cooling has been proposed as a trigger for mammalian and avian encephalization. Under this scenario, lower temperatures enhanced thermoregulation of larger, more energy-expensive brains in ‘warm-blooded’ vertebrates (Schwartzman and Middendorf, Reference Schwartzman and Middendorf2000).
However, the evidence for global temperatures imparting first-order control on cognitive evolution is weak at best. The evolution of intelligence and tool-use predispositions in crown-group parrots almost certainly preceded the end-Oligocene global cooling (Prum et al., Reference Prum, Berv, Dornburg, Field, Townsend, Lemmon and Lemmon2015; Ksepka et al., Reference Ksepka, Balanoff, Smith, Bever, Bhullar, Bourdon and Smaers2020; Selvatti et al., Reference Selvatti, Galvão, Mayr, Miyaki and Russo2022) and occurred in tropical climates (Selvatti et al., Reference Selvatti, Galvão, Mayr, Miyaki and Russo2022). Primate and proboscidean encephalization similarly took place in subtropical to equatorial settings, suggesting that thermodynamic constraints did not play a significant limiting role in the process (Benoit et al., Reference Benoit, Legendre, Tabuce, Obada, Mararescul and Manger2019; Ni et al., Reference Ni, Flynn, Wyss and Zhang2019). Accordingly, highly encephalized species are more common in warm climates (Russell and Billingham, Reference Russell, Billingham and Billingham1981). Contra Schwartzman and Middendorf (Reference Schwartzman and Middendorf2000), intelligence is also not restricted to endothermic, homeothermic vertebrates and its origins in coleoids may well predate terminal Oligocene cooling (López-Córdova et al., Reference López-Córdova, Avaria-Llautureo, Ulloa, Braid, Revell, Fuchs and Ibáñez2022; Whalen and Landman, Reference Whalen and Landman2022). Other contingent effects of the Palaeogene-Neogene transition, such as aridification, faunal change or increased habitat variability (Benoit et al., Reference Benoit, Legendre, Tabuce, Obada, Mararescul and Manger2019; Smaers et al., Reference Smaers, Rothman, Hudson, Balanoff, Beatty, Dechmann and Safi2021), may figure among the drivers of encephalization in particular lineages, including primates and proboscideans. However, these environmental factors are neither geologically unprecedented nor universally pertinent across ecological and phylogenetic divides and as such they can only offer proximate, clade-specific explanations.
Alternative ‘abiotic’ explanations for Cenozoic cognitive evolution push back the rise of permissive factors to the ~66 Myr old end-Cretaceous mass extinction. Milner and Walsh (Reference Milner and Walsh2009) proposed that the greater brain size and complexity of crown-group birds gave them an edge over their Mesozoic relatives in the aftermath of global ecological collapse at the Cretaceous-Palaeogene boundary. However, sustained increases in both avian and mammalian cerebral complexity and the origins of modern encephalization levels postdate the end-Cretaceous mass extinction by tens of millions of years (Ksepka et al., Reference Ksepka, Balanoff, Smith, Bever, Bhullar, Bourdon and Smaers2020; Bertrand et al., Reference Bertrand, Shelley, Williamson, Wible, Chester, Flynn and Brusatte2022).
More broadly, it is increasingly apparent that the drivers of intelligence in primates, cetaceans, elephants and birds, not to mention cephalopods, are as disparate as their bodyplans and lifestyles (e.g. Seed et al., Reference Seed, Clayton and Emery2008; Sayol et al., Reference Sayol, Maspons, Lapiedra, Iwaniuk, Székely and Sol2016; Benoit et al., Reference Benoit, Legendre, Tabuce, Obada, Mararescul and Manger2019; Amodio et al., Reference Amodio, Shigeno and Ostojić2020). As such, they cannot be readily subsumed under a single, external causal trigger. The only common denominator may be a complex social or physical environment (Amodio et al., Reference Amodio, Shigeno and Ostojić2020) – a backdrop at once singularly vague and at least as old as the Phanerozoic itself (Plotnick et al., Reference Plotnick, Dornbos and Chen2010; Darroch et al., Reference Darroch, Laflamme and Wagner2018; Hsieh et al., Reference Hsieh, Plotnick and Bush2022).
The ‘open world’ explanation: Time as a limiting factor
Amid a lack of convincing, all-encompassing environmental ‘triggers’ for the CE, a simpler explanation may be offered by null hypotheses of evolutionary dynamics. The default option is that of a ‘random walk’ or ‘diffusion’ model (McShea, Reference McShea1994; Marcot and McShea, Reference Marcot and McShea2007; Bogonovich, Reference Bogonovich2011; Rospars, Reference Rospars2013), in which evolving lineages explore a spectrum of values stochastically over time. In this framework, the selective pressures acting on cognitive evolution can be treated as a black box: that is, increases and decreases in intelligence can be framed as equally probable for any given lineage at any given time. Given a bounded lower limit for intelligence or a proxy of choice (e.g. EQ = 0 in the case of encephalization) and an unbounded upper limit, both mean and range (and hence maximal values) will tend to increase over time (Bogonovich, Reference Bogonovich2011). If a minimal intelligence baseline (or a minimum set of cumulated CCE exaptations) are required for sophonce to evolve, the number of lineages overshooting this requisite threshold will positively correlate with the time elapsed since the start of the ‘walk’. The more lineages participate in the random walk, the more statistically robust this emerging trend will be.
In principle, diffusion may provide the most elegant and parsimonious explanation for the Phanerozoic increase in the number of intelligent lineages: no selective pressures or other extrinsic causal drivers are required. High intelligence simply becomes increasingly common as cognitive and behavioural possibilities are passively ‘invaded’ over time and – for any given rate of change – time is the only limiting factor to the ‘filling up’ of evolutionary possibilities. The widening ranges and accompanying increases in maximal values observed for the EQs of well-studied vertebrates, including primates, cetaceans and birds, qualitatively match the predictions of the diffusion hypothesis. However, the Phanerozoic increases in maximum encephalization and behavioural complexity across Metazoa are best described by exponential functions, deviating from diffusion-based predictions (Meyer, Reference Meyer1954; Russell, Reference Russell1983; Rospars, Reference Rospars2010). Accordingly, quantitative models suggest that diffusion may be insufficient to account for the exponential rise of Phanerozoic intelligence (Bogonovich, Reference Bogonovich2011) as described by Russell (Reference Russell1983): a ‘steepening’ or compounding factor may be required.
A largely overlooked but closer correspondence with the Phanerozoic increase in maximal intelligence may be found in global species richness curves (Fig. 2). The increase in global biodiversity over the last 540 Myr has been proposed to conform to logistic (Sepkoski, Reference Sepkoski1984) rather than exponential (Benton, Reference Benton1995) functions. Accordingly, the exponential biodiversification patterns emerging from fossil tabulations (Benton, Reference Benton1995) have been interpreted as artefacts of palaeogeographical sampling biases (e.g. Close et al., Reference Close, Benson, Alroy, Carrano, Cleary, Dunne and Butler2020a, Reference Close, Benson, Saupe, Clapham and Butler2020b). However, recent spatially explicit simulations suggest otherwise. Against the expectations of logistic models, regional diversity appears mostly governed by an exponential growth regime throughout the Phanerozoic (Cermeño et al., Reference Cermeño, García-Comas, Pohl, Williams, Benton, Chaudhary and Vallina2022). Global deviations from exponential biodiversification may be largely due to episodic perturbations such as mass extinctions and the obliteration of biodiversity hotspots by plate tectonics rather than ecological saturation capping species numbers (Cermeño et al., Reference Cermeño, García-Comas, Pohl, Williams, Benton, Chaudhary and Vallina2022). If a carrying capacity to Earth's species richness exists, it may be so high as to have had virtually no effect on global diversification rates since the origins of complex multicellularity. This open-endedness is reflected at finer spatial and temporal scales by the results of recent biological invasions and ecological experiments (Harmon and Harrison, Reference Harmon and Harrison2015).
Classic plots of biodiversity and encephalization values through geological time. (a) The diversification of complex life through the Phanerozoic, plotted as logarithm of family-level richness for all organisms, terrestrial and marine (maximum curve). Redrawn from Benton (Reference Benton1995). (b) The nonlinear increase in maximum encephalization quotient (EQ) levels during the Phanerozoic. The ‘living fossils’ Branchiostoma, Petromyzon and Latimeria serve as proxies for the maximum level of encephalization at various intervals of the Palaeozoic, based on phylogenetic bracketing and resemblance to extinct taxa. Cenozoic data points (taxon names not shown) include Plesiadapis, Tetonius, Heptodon, Homacodon, Necrolemur, Leontinia, Argyrocetus, Homo abilis, H. erectus and H. sapiens. The regression line (dashed) follows the equation ln EQ = 0.0135 × (531 − t)−6.23. Redrawn from Russell (Reference Russell1983). In both diagrams, the vertical dashed line marks the beginning of a sharp Cenozoic uptick in both diversity and maximum encephalization levels. Legend: C, Cambrian; O, Ordovician; S, Silurian; Crb, Carboniferous; P, Permian; Tr, Triassic; Jur, Jurassic; Cret, Cretaceous; Pg, Palaeogene; Ne, Neogene.
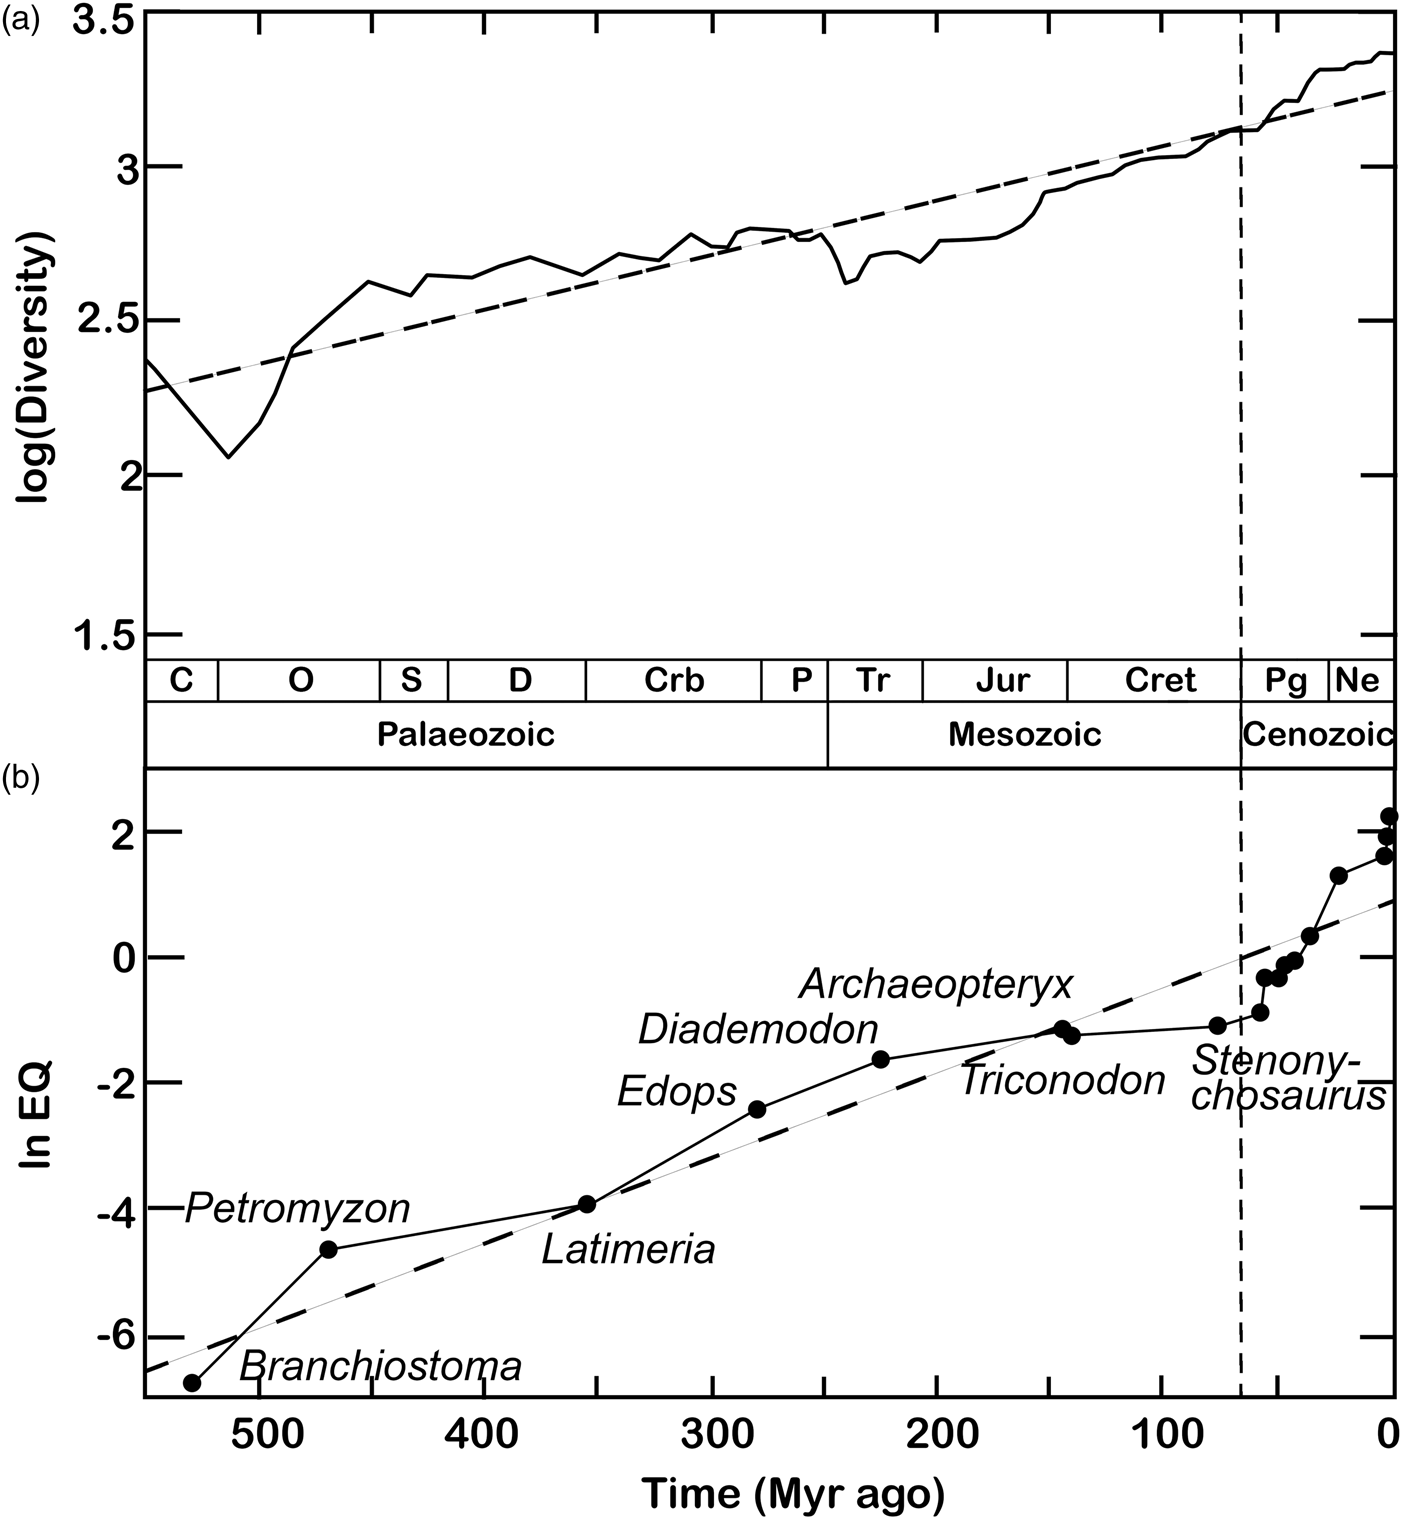
If exponential biodiversification is factored into a ‘random walk’ model, the number of participating lineages deviates from constancy. Instead, it increases nonlinearly over time – mirroring and potentially underlying, the escalation of Phanerozoic intelligence (Fig. 2). If so, the Cenozoic CE may need no special explanation. Instead, it may simply have emerged through cognitive ‘diffusion’ compounded by an exponential increase in the overall number of lineages alive at any given time – and, as a consequence, of the number of ‘trials’ available for diffusion to tap into intelligence at any given time. Given an exponentially diversifying biosphere, the frequency of cognitive or behavioural ‘extremes’ past a given threshold of interest will likewise increase nonlinearly. Under this model, higher biodiversity simply begets a wider envelope of biological outcomes and preconditions to sophonce are no exceptions. Vice versa, a special explanation for the CE would be required under a logistic biodiversification paradigm. Given null conditions of time invariance in the mean and distribution of intelligence and constant global species richness, the sampling biases imposed by a winnowed fossil record deeper in time (e.g. Close et al., Reference Close, Benson, Alroy, Carrano, Cleary, Dunne and Butler2020a, Reference Close, Benson, Saupe, Clapham and Butler2020b) stand out as insufficient to explain the consistent clustering of intelligence proxies towards the lower extremes of their present-day distributions (Jerison, Reference Jerison1973, Reference Jerison and Zaidel1994; Russell, Reference Russell1983; Rospars, Reference Rospars2010; Bogonovich, Reference Bogonovich2011; Smaers et al., Reference Smaers, Turner, Gómez-Robles and Sherwood2018, Reference Smaers, Rothman, Hudson, Balanoff, Beatty, Dechmann and Safi2021; Ksepka et al., Reference Ksepka, Balanoff, Smith, Bever, Bhullar, Bourdon and Smaers2020; Stacho et al., Reference Stacho, Herold, Rook, Wagner, Axer, Amunts and Güntürkün2020; Bertrand et al., Reference Bertrand, Shelley, Williamson, Wible, Chester, Flynn and Brusatte2022).
Furthermore, against the predictions of logistic models, exponential biodiversification may be ecologically self-reinforcing. Adaptive radiations not only tend to show little evidence of slowdowns over time (Benton and Emerson, Reference Benton and Emerson2007; Harmon and Harrison, Reference Harmon and Harrison2015) but may compound speciation rates themselves by precipitating finer ecological partitioning (Emerson and Kolm, Reference Emerson and Kolm2005). More species create more variegated selective pressures to face and expand the range of opportunities for other taxa to ‘diversify into’ (Benton and Emerson, Reference Benton and Emerson2007). The rise of flowering plants – angiosperms – during the late Mesozoic and early Cenozoic is a case in point (Benton et al., Reference Benton, Wilf and Sauquet2022). The hypothesis that the boost in terrestrial primary productivity precipitated by the angiosperm radiation fostered the evolution of energetically expensive large brains, facilitating the evolution of complex cognition (Bogonovich, Reference Bogonovich2011), may be especially pertinent to land-dwelling mammals and birds. If so, angiosperms provide a prime example of how Phanerozoic biodiversification prepared the ground for its own further exploration of biological (and cognitive) possibilities. Like other manifestations of biological complexity (e.g. Cailleux, Reference Cailleux1976; Ball, Reference Ball and Papagiannis1985), intelligence appears to have escalated by hitchhiking on such compounded diversification, in an ‘open world’ where no upper ceiling to its frequency or overall abundance exists. No causal driver unique to the CE may be required to explain this occurrence, which appears to be a robust emergent feature of Phanerozoic macroevolution.
A shared feature of economic, technological and cultural innovation as well as biology, the open-ended exploration and simultaneous creation of adjacent possibilities stands out as a universal hallmark of evolving systems (Kauffman, Reference Kauffman2019). The self-sustaining and amplifying evolutionary dynamics emerging as a result are most likely not a fluke of Earthly biology (Cortês et al., Reference Cortês, Kauffman, Liddle and Smolin2022). Crucially, though, Phanerozoic-style biospheres harbouring complex, animal-grade multicellularity will be bound to the open-ended creation of evolutionary and ecological novelty to a degree unmatched in purely microbial biospheres, as attested by the fossil record (Butterfield, Reference Butterfield2007, Reference Butterfield2011). The reasons for this are grounded in the physics of scale and motion.
The size and motility of animals enable them to mechanically engineer their environments, disrupting isotropy in time and space through bioturbation, fluid advection and selective resource harvesting (Butterfield, Reference Butterfield2011, Reference Butterfield2018; Budd and Jensen, Reference Budd and Jensen2017). Moreover, the macroscopic size of animals imposes a degree of biogeographical provinciality unsustainable in microbes, where chances for allopatric speciation are greatly diminished by long-range dispersal and astronomical population sizes (Norris, Reference Norris2000; Butterfield, Reference Butterfield2007). Pervasive ecosystem engineering and predation by animals further boost biotic heterogeneity by extending ‘arms races’ and other coevolutionary dynamics to macroscopic life and by structuring complex multi-tiered food webs (Butterfield, Reference Butterfield, Zhuravlev and Riding2000, Reference Butterfield2007, Reference Butterfield2011). At the same time, the combinatorial ontogenetic potential of their differentiated cell and tissue types (Marshall, Reference Marshall2006; Butterfield, Reference Butterfield2007) translates into a virtually open-ended range of behaviour and morphologies. Above all, animals are key arbiters of global biomass supplies and their partitioning. Since longevity and size tend to positively covary across organisms, an animal-dominated biosphere is one where standing biomass stocks are multiplied relative to a microbial world, with no extra primary productivity needed (Butterfield, Reference Butterfield2007); and in both biological and nonbiological evolving systems, when supply rates of raw materials and energy are boosted opportunities for innovation and diversification increase (Vermeij, Reference Vermeij1995).
Although their precise course will be modulated by contingencies, the histories of extraterrestrial biospheres harbouring animal-grade multicellularity can thus be expected to unfold along similar lines to Phanerozoic Earth (Butterfield, Reference Butterfield2007) on account of first-principles physics and basic evolutionary rules. Arguments for contingency (Gould, Reference Gould1990) fail to account for the consistent rebound of Phanerozoic exponential diversification in the face of unpredictable mass extinction events (Cermeño et al., Reference Cermeño, García-Comas, Pohl, Williams, Benton, Chaudhary and Vallina2022): far from underpinning the rise of sophonce, such improbable geological contingencies temporarily perturbed an exploratory process bound to tap into it.
CE drivers and model choice
An ‘open world’ scenario of cognitive evolution in Phanerozoic-style biospheres has repercussions on the choice of models used to estimate ETI abundance. Evolutionary scenarios centred on geobiological contingencies, such as the chance onset of key innovations or permissive conditions, are most amenable to ‘step modelling’. Under this framework the path to sophonce passes through a series of unlikely events, their probabilities kept low and constant over time (Bogonovich, Reference Bogonovich2011). That is, step-based models assume that once a step has taken place the next occurs at a constant average rate (e.g. Snyder-Beattie et al., Reference Snyder-Beattie, Sandberg, Drexler and Bonsall2021). A CE grounded in exponential evolution undermines this assumption. It points to the probability of sophonce emerging being highly nonuniform across the Phanerozoic, with a strong positive skew towards the present. Accordingly, the marked temporal clustering of animal intelligences and CCE preconditions contrasts with the dispersed timing of major evolutionary transitions, the traditional targets of step models (Hanson, Reference Hanson1998; Watson, Reference Watson2008; Snyder-Beattie et al., Reference Snyder-Beattie, Sandberg, Drexler and Bonsall2021). Regardless of the applicability of step-based frameworks to major evolutionary transitions (e.g. Snyder-Beattie et al., Reference Snyder-Beattie, Sandberg, Drexler and Bonsall2021), this strongly suggests that ‘long-fuse’ alternatives based on continuous, incremental evolutionary models (Bogonovich, Reference Bogonovich2011) and entailing a gradual increase in the probability of sophonce arising may best describe the protracted, cumulative ‘minor transition’ from animal-grade multicellularity to sophonce. Sophonce may require a long time to evolve not because it depends on an astronomically unlikely roll of dice, but because its evolution is limited by the supply rate of evolutionary novelty and rests upon an incremental increase – an evolutionary ‘buildup’ – in probability.
A long fuse model may nonetheless be approximated by a step-based alternative in which the origins of CCE exaptations represent discrete ‘minor steps’ distinct from the origin of sophonce. In this framework where sophonce is ‘deconstructed’ into its enabling steps, the multiple origins of intelligence and other CCE preconditions from a tissue-grade metazoan baseline could be factored in, rather than lost in the black box of the singular origin of sophonce. Instead of being treated as a singular improbable step, the transition from complex multicellularity to sophonce could thus be decomposed into a sequence of cumulative (and arguably far less improbable) enabling events. This approach could help refine likelihood estimates for the evolution of ETI, potentially leading to an upward revision of N compared to recent works (e.g. Snyder-Beattie et al., Reference Snyder-Beattie, Sandberg, Drexler and Bonsall2021). Such a revision would take into account that the appearance of social, cognitively sophisticated, tool-using lineages among animals required over 500 Myr (Dunn et al., Reference Dunn, Liu and Donoghue2018, Reference Dunn, Liu, Grazhdankin, Vixseboxse, Flannery-Sutherland, Green and Donoghue2021) but occurred minimally 8 times within the last 102 – in coleoids, parrots, corvids, proboscideans, cetaceans, hominoids, cercopithecoids and New World monkeys. The final substep in the evolution of sophonce on Earth – the eventual appearance of CCE itself among these lineages – occurred only once (in hominoids), but required an order of magnitude less time (Langergraber et al., Reference Langergraber, Prüfer, Rowney, Boesch, Crockford, Fawcett and Vigilant2012).
From a frequentist standpoint, the repeated origins of tool-using social intelligences suggest that their evolution among metazoans is not exceedingly unlikely in the Phanerozoic biosphere. The long timescale required for their emergence does not invalidate this argument: instead, it underscores the cumulative nature of cognitive evolution in the Phanerozoic world, in which time and the supply of evolutionary novelties – and not the onset of permissive geobiological conditions – are the key limiting factors. The transition from social, tool-using intelligence to sophonce was instead a ‘singularity’, but one that occurred extremely rapidly on a geological timescale and well in advance of complex life's ultimate demise (Cavosie et al., Reference Cavosie, Valley and Wilde2005; Franck et al., Reference Franck, Bounama and Von Bloh2006). While anthropic self-selection bias and the low probabilities of major evolutionary transitions (Snyder-Beattie et al., Reference Snyder-Beattie, Sandberg, Drexler and Bonsall2021) may explain why sophonce appeared late in Earth's habitable timeline (at ~4300 out of ~6000 Myr; Cavosie et al., Reference Cavosie, Valley and Wilde2005; Franck et al., Reference Franck, Bounama and Von Bloh2006), they may not account as readily for its much earlier origin relative to the estimated total lifespans of animal-grade multicellularity (after ~580 out of ~1780 Myr; Franck et al., Reference Franck, Bounama and Von Bloh2006; Pu et al., Reference Pu, Bowring, Ramezani, Myrow, Raub, Landing and Macdonald2016) or social, tool-using animal intelligences (after ~100 Myr or less out of a potential ~1300; Franck et al., Reference Franck, Bounama and Von Bloh2006). Whether animal intelligence and human sophonce differ in ‘degree’ (Darwin, Reference Darwin1871) or ‘kind’ (Wallace, Reference Wallace1869), this suggests that the crossing of the ‘behaviourally modern’ (Sterelny, Reference Sterelny2011) human Rubicon was almost certainly not commensurate to eukaryogenesis, the evolution of complex multicellularity, or even abiogenesis (Snyder-Beattie et al., Reference Snyder-Beattie, Sandberg, Drexler and Bonsall2021) in its improbability.
SETI and the future of terrestrial intelligence
Taken together, the recurrent evolution of animal intelligences and the early apparition of sophonce in its wake suggest that f s is likely not a significant limiting factor to the number of detectable ETIs. This opens the door to a universe in which biospheres shaped by animal-grade organisms will likely spawn sophonce on a timescale commensurate with the duration of the Phanerozoic.
All else being equal, under an ‘open world’ scenario an f s value approaching 1 also implies that the temporal density or ‘permanence’ of sophonce should rise nonlinearly as biospheres age. Barring a major reversal of Phanerozoic biodiversification dynamics or strong negative (e.g. competitive) feedbacks, on macroevolutionary grounds the average number of antecedents to sophonce (Frank, Reference Frank2018) available at any given time is set to increase in a similarly exponential fashion. Therefore, the likelihood of sophonce emerging in any given interval will also tend to escalate over time. Given a constant average lifetime for each sophont species, it follows that the ‘interregna’ between one and the next will tend to become shorter and sparser as a function of biosphere age. In contrast, instances of temporal overlap will tend to increase in frequency. The same general tendency towards a higher temporal permanence of sophonce would emerge naturally even in a simple (i.e. non-compounded) diffusion-based scenario (e.g. Bogonovich, Reference Bogonovich2011, fig. 2): in an exponentially diversifying biosphere it is merely accelerated.
In both simple and compounded diffusion scenarios, the unlikelihood of ‘Silurians’ is thus mirrored by a nonlinearly increasing probability of sophonts in the planet's deep future. Against this backdrop, on purely macroevolutionary grounds humans are unlikely to be the last sophonts to arise on Earth. EQs on par or above those of the earliest hominins, and a comparable range of CCE preconditions, occur in living cetaceans (Marino, Reference Marino and Kalof2017), corvids and parrots (Emery and Clayton, Reference Emery and Clayton2004; Ksepka et al., Reference Ksepka, Balanoff, Smith, Bever, Bhullar, Bourdon and Smaers2020), apes and monkeys (e.g. Ni et al., Reference Ni, Flynn, Wyss and Zhang2019). If the history of the human lineage is any guide, in principle all could attain sophonce within the next 101 Myr. If the timeframe is expanded by an order of magnitude to 102 Myr, the potential ancestors of sophont species multiply dramatically: complex brains and EQs well above those of any known 102 Myr old vertebrate are widespread in dozens of extant lineages (e.g. Ksepka et al., Reference Ksepka, Balanoff, Smith, Bever, Bhullar, Bourdon and Smaers2020; Bertrand et al., Reference Bertrand, Shelley, Williamson, Wible, Chester, Flynn and Brusatte2022). This 102 Myr window would still be shorter than the estimated remaining lifespan of complex multicellularity by one order of magnitude (Franck et al., Reference Franck, Bounama and Von Bloh2006). Against arguments for contingency (Gould, Reference Gould1990; see Ćirković, Reference Ćirković2007), H. sapiens may hypothetically sit at the cusp of a new phase in Earth history, in which sophonce becomes a frequent and recurrent feature of the biosphere.
Under such a scenario where f s ≈ 1, it is the evolutionary transitions upstream of the origins of animal-grade multicellularity that would impose the strictest limits on ETI frequency. Eukaryogenesis, abiogenesis and sexual reproduction are all plausible bottlenecks or ‘hard steps’ (Levin et al., Reference Levin, Scott, Cooper and West2019; Snyder-Beattie et al., Reference Snyder-Beattie, Sandberg, Drexler and Bonsall2021). Nonetheless, Bayesian estimates of ETI's likelihood based on step models (Snyder-Beattie et al., Reference Snyder-Beattie, Sandberg, Drexler and Bonsall2021) indicate that increasing biosphere lifetimes to match those offered by long-lived red dwarf systems yields high probabilities of achieving these major evolutionary transitions. If f s ≈ 1 and the stellar environments of red dwarfs are not inherently hostile to complex life (Gale and Wandel, Reference Gale and Wandel2017), the ubiquity of sophonts may thus be virtually guaranteed. If they are not (e.g. Barnes et al., Reference Barnes, Mullins, Goldblatt, Meadows, Kasting and Heller2013), even under f s ≈ 1 we may indeed, to a first approximation, be alone. Under both scenarios, focusing search for extraterrestrial intelligence (SETI) efforts on ancient red dwarf systems may offer one of the most useful tests of ETI's likelihood. If habitable planets several times older than Earth are devoid of ETIs, sophonce could indeed be an evolutionary fluke. If they are not, a solution to the Fermi paradox (Ćirković, Reference Ćirković2018b) would be at hand. In either case, the information payoff could arguably be greater than for any other stellar environment.
An ‘open world’ scenario of cognitive evolution is also pertinent to more exploratory research programmes in the SETI. If f s ≈ 1, the discovery of any animal-grade organism outside Earth would imply that sophonce should be widespread in the galaxy. ‘Martian trilobites’ (Conway Morris, Reference Conway Morris2018) or Europan macrofauna (Chyba and Phillips, Reference Chyba and Phillips2001) would dramatically raise the success chances of high-impact, high-risk efforts including space archaeology in the solar system (Villarroel et al., Reference Villarroel, Mattsson, Guergouri, Solano, Geier, Dom and Ward2022) or the search for non-terrestrial artefacts within Earth's atmosphere (Siraj et al., Reference Siraj, Loeb and Gallaudet2022). Should these fail, a stronger focus on possible roadblocks to ETI detection after the origination of sophonce would be justified. If sophonce is readily evolvable, but nowhere to be seen, the Fermi Paradox stands out as all the more puzzling (Conway Morris, Reference Conway Morris2011, Reference Conway Morris2018).
Conclusion
When questioned about the existence of ETI, Drake (Reference Drake2006) expressed an optimistic take based on Earth's fossil record, portraying the evolution of humanlike minds as a virtually inevitable outcome of natural selection. The history of intelligence on Earth suggests that Drake was right, but for the wrong reasons. The cognitive preconditions to sophonce may be far from universally adaptive, and yet they arose frequently and foreseeably as the exponential diversification of Phanerozoic life expanded the gamut of possibilities. Treating the transition from animal-grade multicellularity to sophonce as a discrete ‘singularity’ overlooks its incremental nature and the fact that most of its unlikely substeps have indeed aligned on the same evolutionary lineage multiple times. The origins of complex brains, sociality, culture and technology are all among them. If sophonce is exceptionally difficult to evolve from a metazoan-grade baseline, it is the origin of any putative human unicum that must supply the rate-limiting factor to its frequency. In the context of a sample size of 1, this possibility should not be dismissed altogether. However, the pace and timing of human evolution against the backdrop of the multiple origins of animal intelligence suggests that it is an unlikely one. Earth's history suggests instead that the transition between animal-grade multicellularity and sophonce is not a rate-limiting step in the emergence of technological civilization and that the frequency of sophonce may be constrained primarily by earlier evolutionary ‘bottlenecks’. If biospheres exist around long-lived red dwarf stars, where sufficient time is available for these bottlenecks to be overcome, sophonce may be virtually ubiquitous. Whether this is the case or not, the lifespan of Earth's carbon cycle still allows for no less than 800 and up to 1200 Myr of complex multicellularity. Our own sophont lineage arose from a widespread cognitive and behavioural baseline in less than 10. If intelligence is a ‘child of time’ (Tchaikovsky, Reference Tchaikovsky2018), plenty is left for surprises.
Acknowledgements
I thank William Bezodis, Nick J. Butterfield, Simon Conway Morris and Althea Sovani for the discussions that stimulated this work and acknowledge support from a NERC C-CLEAR DTP studentship [RG96579].
Competing interests
None.


 Open access