

Iodine deficiency may be a detrimental condition and iodine supplementation programmes are commonly implemented on a regional or national basis(1). Excessive iodine intake may also have a negative effect(Reference Laurberg, Bulow Pedersen, Knudsen, Ovesen and Andersen2, Reference Teng, Shan and Teng3), and there is a need to describe population iodine intake more precisely.
The iodine intake of a population is commonly assessed by measuring iodine in urine in cross-sectional studies of selected cohorts(Reference Teng, Shan and Teng3–Reference Andersen, Hvingel, Kleinschmidt, Jørgensen and Laurberg8). This provides information on the average iodine excretion and on the frequency of low iodine excretion values. However, urinary iodine excretion to a considerable extent reflects iodine intake over a short period of time prior to collection(Reference Als, Helbling, Peter, Haldimann, Zimmerli and Gerber9–Reference Rasmussen, Ovesen, Bulow, Jorgensen, Knudsen, Laurberg and Pertild11), and the variation is huge(Reference Als, Helbling, Peter, Haldimann, Zimmerli and Gerber9–Reference Andersen, Pedersen, Pedersen and Laurberg13). This affects the reliability of estimates of population iodine intake level, and random variation may lead to low sample results in iodine replete individuals(Reference Andersen, Pedersen, Pedersen and Laurberg13). Thus, data are needed to determine the reliability of surveys with a certain number of urine samples and the number of samples needed to estimate the iodine excretion level. Also, data are needed to assess the reliability of subgroup analysis and the feasibility of using results of single values in individuals. The latter has been advocated(Reference Busnardo, Nacamulli, Zambonin, Mian, Piccolo and Girelli12) as iodine may vary less in individuals than in populations. However, data to support this, i.e. calculation of the number of urine samples necessary to estimate the individual iodine excretion, are lacking.
We aimed to estimate the number of urine samples needed to describe population and individual iodine excretion level, to describe the reliability of estimates of urinary iodine excretion in groups and in individuals, and to assess the precision of results of subgroup analysis.
Subjects and methods
Sixteen healthy Caucasian men, age 24–52 years (median age 38 years) participated.
None took regular medication or iodine-containing vitamin or mineral preparations. None had undergone examinations with contrast media within 6 months prior to or during the study. The characteristics of the individual participants has been described previously(Reference Andersen, Pedersen, Pedersen and Laurberg13).
They lived in Jutland, Denmark, where the iodine intake is moderately low(Reference Laurberg, Pedersen, Vestergaard and Sigurdsson14). We made no restrictions to their daily or yearly routines and sampling procedures were designed to picture the procedures used in cross-sectional studies of urinary iodine excretion to describe the dispersion included in such studies. The study period of 1 year was chosen to include also seasonal differences in the estimate of variation(Reference Andersen, Pedersen, Pedersen and Laurberg13). Approval by the regional Ethics Committee was obtained prior to the commencement of the study.
Spot urine samples were collected monthly for 13 months. A morning (09.00–12.00 hours) spot urine sample was collected from each participant. All samples from a subject were analysed in random order in the same run.
Assays
Urinary creatinine was measured by a kinetic Jaffé method(Reference Bartels, Bohmer and Heierli15). Iodine was determined by the ceri/arsen method after alkaline ashing(Reference Wilson and van Zyl16) as described previously(Reference Andersen, Hvingel, Kleinschmidt, Jørgensen and Laurberg8, Reference Andersen, Pedersen, Pedersen and Laurberg13, Reference Laurberg17). Urinary iodine excretion was expressed in μg/l and as an estimated 24 h urinary iodine excretion. This estimate was calculated as an age- and gender-corrected iodine:creatinine excretion ratio from creatinine excretions in age- and gender-matched group of Caucasians(Reference Kampmann, Siersbæk-Nielsen, Kristensen and Mølholm Hansen18, Reference Kesteloot and Joossens19) as suggested previously(Reference Andersen, Pedersen, Pedersen and Laurberg13, Reference Jolin and Escobar del Rey20, Reference Knudsen, Christiansen, Brandt-Christensen, Nygaard and Perrild21).
Statistics and calculations
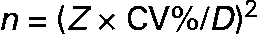
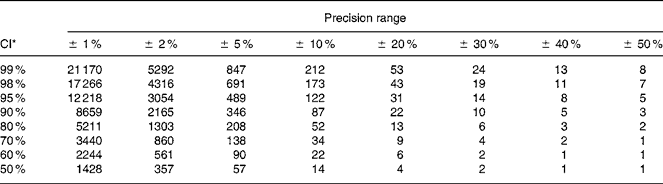
The number of urine samples needed to assess the iodine excretion was calculated from the equation given in Fig. 1. This was developed to estimate the precision of a set-point, D, in biochemical variables(Reference Fraser and Harris22) and recommended for use when estimating the number of specimens required in biochemical measures(Reference Fraser and Harris22). The CI used (Z) were 2·58 for 99 %, 2·33 for 98 %, 1·96 for 95 %, 1·64 for 90 %, 1·28 for 80 %, 1·04 for 70 %, 0·84 for 60 %, 0·67 for 50 %. The precision range (D) used in the calculations varied from ± 50 to ± 99 %, and this was the range within which the iodine excretion lies with the CI indicated by the Z value chosen, as described in detail by Fraser & Harris(Reference Fraser and Harris22). Using these Z-statistics may underestimate the sample size for small n by up to 30 % compared to using t-statistics but was chosen in order to comply with recommendations(Reference Fraser and Harris22). Mean within-individual variance was similar whether assessed as the mean variance among individuals or using ANOVA techniques. Within-subject CV was used for calculation of number of urine samples from an individual needed to assess the iodine excretion in an individual. The CV% was the variance square root divided by the mean, as a percentage. Variances were compared by Bartlett's test for homogeneity of variances after ln-transformation that caused data to follow the normal distribution.
The components included in the calculation of the number of samples needed to be collected in order to describe a range for the iodine intake in a populationReference Fraser and Harris22. The number of urine samples needed to assess the iodine excretion (n) was calculated by using the equation as recommended for use when estimating number of specimens required in biochemical measuresReference Fraser and Harris22. The CI used (Z) were 2·58 for 99 %, 2·33 for 98 %, 1·96 for 95 %, 1·64 for 90 %, 1·28 for 80 %, 1·04 for 70 %, 0·84 for 60 %, 0·67 for 50 %. The precision range (D) used in calculations varied from ± 50 to ± 99 %, and this was the range within which the iodine excretion lies with the CI indicated by the Z value chosen, as described in detail by Fraser & HarrisReference Fraser and Harris22.
All data were processed and analysed using the Statistical Package for the Social Sciences version 10.0 (SPSS Inc.), Corel Quattro Pro X3 and a Texas Instruments TI-30X IIS calculator.
Results
Both urinary iodine concentrations and estimated 24 h iodine excretions are reported (Tables 1–3) because some population studies include only crude iodine excretion while variation is lower when urinary iodine is corrected for dilution(Reference Andersen, Pedersen, Pedersen and Laurberg13).
Descriptives and mean urinary iodine excretion and variation in the individual participants and in the group
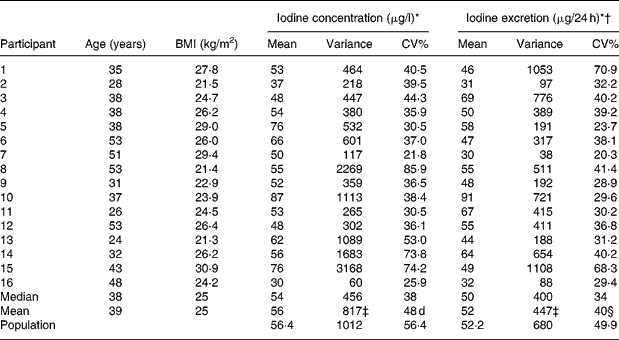
* Based on thirteen samples in individual participants and on 208 samples in the population.
† Corrected for gender- and age-specific creatinine excretionsReference Kampmann, Siersbæk-Nielsen, Kristensen and Mølholm Hansen18, Reference Kesteloot and Joossens19 as recommendedReference Andersen, Hvingel, Kleinschmidt, Jørgensen and Laurberg8, Reference Andersen, Pedersen, Pedersen and Laurberg13, Reference Jolin and Escobar del Rey20, Reference Knudsen, Christiansen, Brandt-Christensen, Nygaard and Perrild21.
‡ Calculated using ANOVA techniques gave similar results.
§ Calculated as (ΣCV%21–16)1/2.
Number of spot urine samples needed to be 95 % confident of being within a specified range for crude urinary iodine concentration and for estimated 24 h urinary iodine excretion calculated from the variation in iodine excretion among healthy men undertaking daily lives
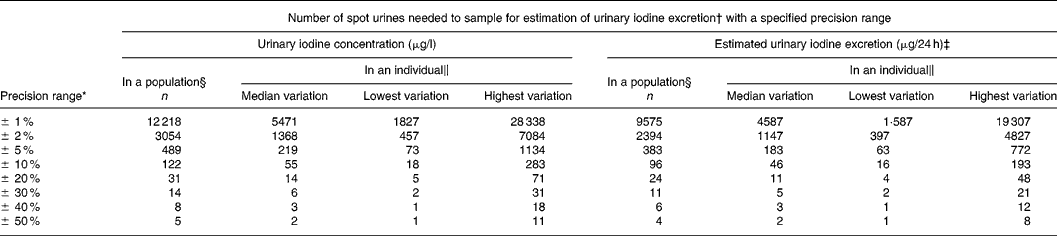
* Calculated with a CI of 95 % (Z = 1·96).
† Calculated from n = (Z × CV/D)2, where Z = 1·96 for 95 % CI and D is the precision range.
‡ Corrected for gender- and age-specific creatinine excretionsReference Kampmann, Siersbæk-Nielsen, Kristensen and Mølholm Hansen18, Reference Kesteloot and Joossens19 as recommendedReference Andersen, Hvingel, Kleinschmidt, Jørgensen and Laurberg8, Reference Andersen, Pedersen, Pedersen and Laurberg13, Reference Jolin and Escobar del Rey20, Reference Knudsen, Christiansen, Brandt-Christensen, Nygaard and Perrild21.
§ Number of individuals needed to produce one urine sample was calculated based on the variation in the population.
‖ Variation differs between individuals. Number of samples needed to sample in an individual are given for individuals with median, lowest and highest variation.
Number of spot urine samples necessary to determine the iodine excretion level with a defined precision range and with parallel CI for crude urinary iodine concentration and for estimated 24 h urinary iodine excretion calculated from the variation in iodine excretion among healthy men undertaking their daily lives
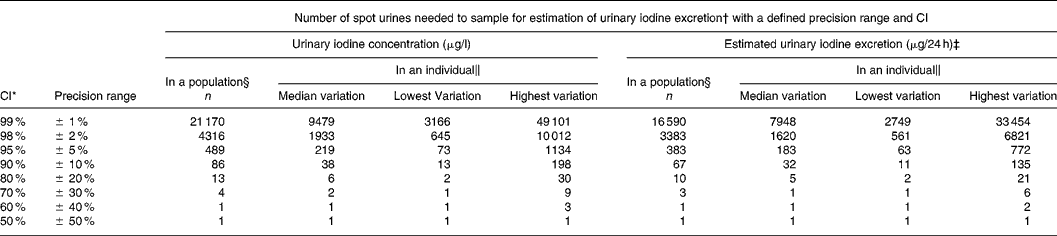
* CI set to vary in parallel with the precision range.
† Calculated from n = (Z × CV/D)2, where Z = CI (Z = 2·58 for 99 %, 2·33 for 98 %, 1·96 for 95 %, 1·64 for 90 %, 1·28 for 80 %, 1·04 for 70 %, 0·84 for 60 %, 0·67 for 50 %) and D is the precision range.
‡ Corrected for gender- and age-specific creatinine excretionsReference Kampmann, Siersbæk-Nielsen, Kristensen and Mølholm Hansen18, Reference Kesteloot and Joossens19 as recommendedReference Andersen, Hvingel, Kleinschmidt, Jørgensen and Laurberg8, Reference Andersen, Pedersen, Pedersen and Laurberg13, Reference Jolin and Escobar del Rey20, Reference Knudsen, Christiansen, Brandt-Christensen, Nygaard and Perrild21.
§ Number of individuals needed to produce one urine sample was calculated based on the variation in the population.
‖ Variation differs between individuals. Number of samples needed to sample in an individual are given for individuals with median, lowest and highest variation.
Population mean urinary iodine excretion was 56·4 μg/l (52·2 μg/24 h). Sample urinary iodine (n 208) varied between 10 and 260 μg/l (20 and 161 μg/24 h), while individual mean urinary iodine excretion (n 16) varied from 30 to 87 μg/l (31 to 91 μg/24 h) (Table 1).
Population standard deviation and average individual standard deviation were larger for crude urinary iodine than for estimated 24 h iodine excretion (32 v. 26 and 29 v. 21) (Bartlett's test, P < 0·01), as was CV% (56 v. 50 % and 48 v. 40 %) (Table 1).
Table 2 lists the number of urine samples necessary to be within a defined range of the actual iodine excretion level in a population with 95 % confidence. Conversely, given a number of samples, the precision range for that survey can be read from Table 2. Thus, in a study of 500 participants producing one spot urine sample each the precision range will be about ± 5 %. Hence, if the mean iodine excretion in a survey was 150 μg/l, the population iodine excretion would be between 142 and 157 μg/l.
Table 2 also illustrates the number of spot urine samples needed in an individual. Thus, ten spot urine samples from an individual gives the iodine excretion by approximately ± 25 %. Hence, if the mean iodine excretion of ten samples from an individual was 150 μg/l, the true iodine excretion in that individual would be between 112 and 187 μg/l with 95 % confidence. Collecting fifty samples in an individual narrows this down to around ± 10 %, i.e. 135–165 μg/l (Table 2).
Estimating 24 h urinary iodine excretion reduced population variance by 32·8 %, average individual variance by 45·3 % and median individual variance by 12·2 % compared to crude urinary iodine. Consequently, the number of urine samples needed to describe population iodine excretion was reduced by 22 %, and the number of urine samples needed in an individual was reduced by 16 % (Table 2).
Table 3 illustrates how simultaneous changes in CI and precision range affects the number of samples needed. In the example, we chose to let CI and precision range vary in parallel. The number of urine samples needed to estimate the iodine intake level in a population with a confidence and precision of 98, 95 and 90 % was 4316, 489 and 86. This was reduced to 3383, 383 and 67 when using estimated 24 h iodine excretions. Similar estimates in an individual with median variance required 1933, 219 and 38 samples, and 1620, 183 and 32 samples, respectively (Table 3).
Table 4 illustrates the effect of independent changes in CI and precision range. The number of urine samples needed in a population is dramatically more influenced by the precision range than by the CI.
Number of participants producing one spot urine sample necessary to determine population iodine excretion level depending on precision range and CI for urinary iodine excretion calculated from variation in crude urinary iodine concentration among healthy men undertaking their daily lives
* Calculated from n = (Z × CV/D)2, where Z = CI (Z = 2·58 for 99 %, 2·33 for 98 %, 1·96 for 95 %, 1·64 for 90 %, 1·28 for 80 %, 1·04 for 70 %, 0·84 for 60 %, 0·67 for 50 %) and D is the precision range.
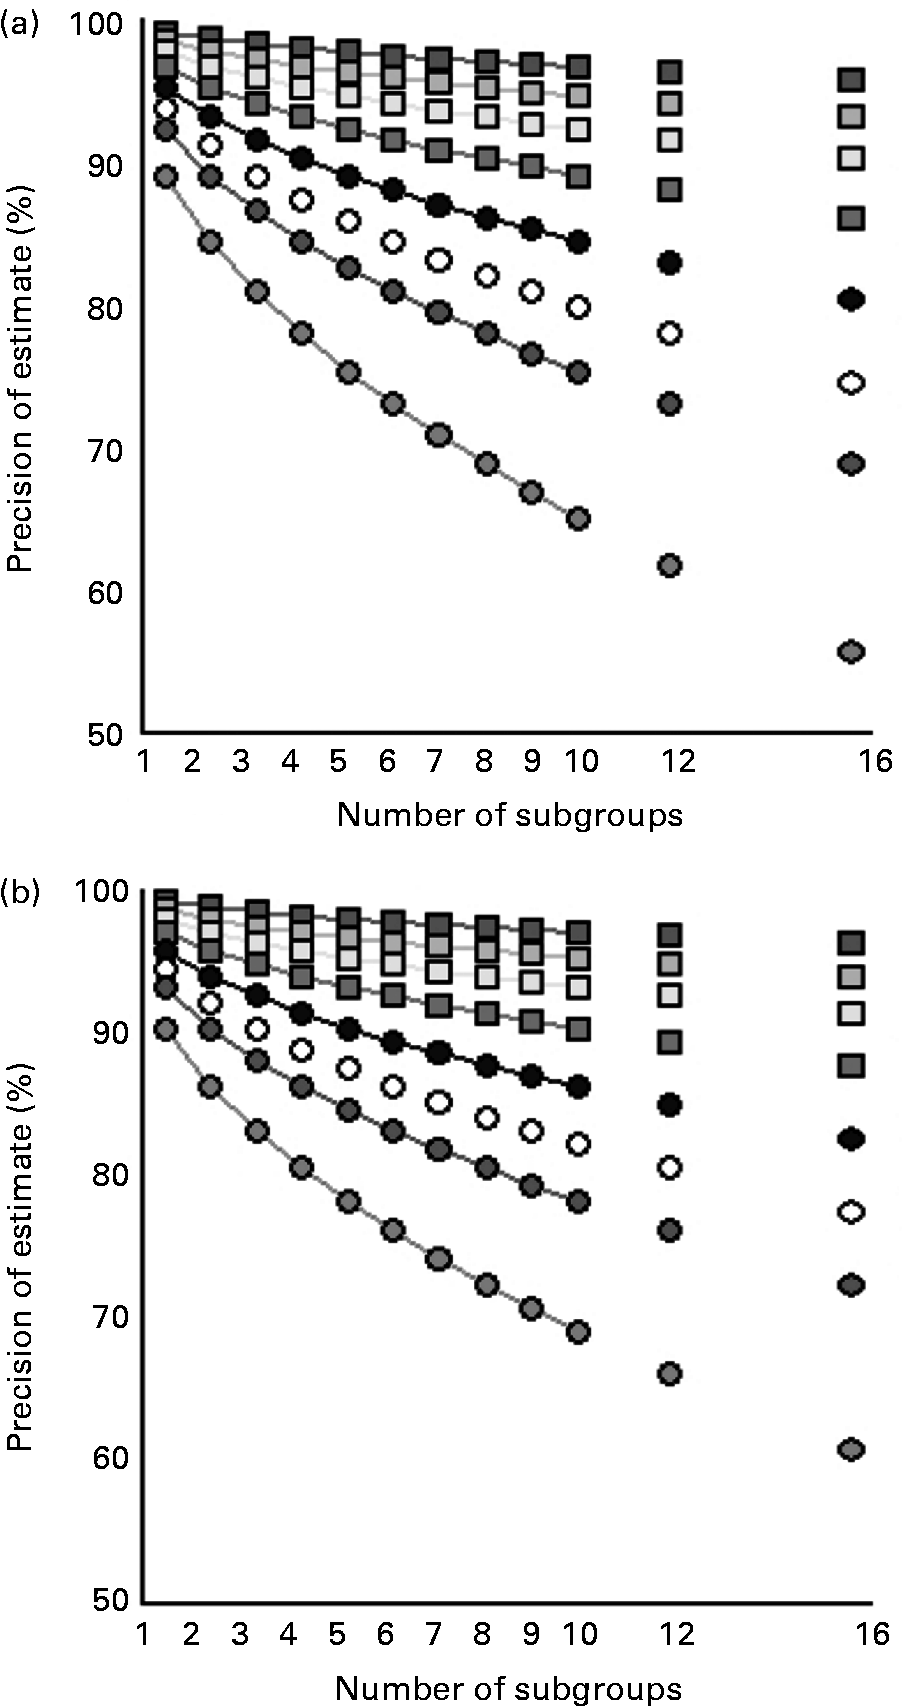
Fig. 2 shows how splitting up in subgroup analyses affects the precision of estimates of population iodine excretion. This is shown for different study population sizes and for both crude urinary iodine content (Fig. 2 (a)) and for estimated 24 h urinary iodine excretion (Fig. 2 (b)). Subgroup analysis influences mainly the precision of small studies.
Precision of estimates of population iodine excretion with increasing number of subgroups for different population sizes for crude urinary iodine (a; μg/l) and for estimated 24 h iodine excretion (b; μg/24 h). The equation in Fig. 1 was used, including the overall CV% for the population (Table 1), with Z = 1·96, i.e. 95 % confidence of the precision range D specified on the y-axis. n = ![]() , 10 000;
, 10 000; ![]() , 4000;
, 4000; ![]() , 2000;
, 2000; ![]() , 1000; ●, 500; ○, 300;
, 1000; ●, 500; ○, 300; ![]() , 200;
, 200; ![]() , 100.
, 100.
Discussion
The number of participants in surveys of population iodine intake varies(Reference Teng, Shan and Teng3–Reference Andersen, Hvingel, Kleinschmidt, Jørgensen and Laurberg8). Consideration of the number of samples needed or the precision of the estimates of iodine excretion in such studies is hampered by the lack of data to support this. Thus, we evaluated the precision of estimates of iodine excretion with different survey population sizes using data previously collected and analysed(Reference Andersen, Pedersen, Pedersen and Laurberg13).
The number of urine samples needed to describe the iodine excretion was calculated from the equation used to describe the standard error of the mean(Reference Fraser and Harris22). The formula is quite straightforward after rearrangement to depict n (Fig. 1)(Reference Fraser and Harris22). Two parameters need to be decided upon: the precision range and the CI. The precision range is interesting because it describes the range in which the true iodine excretion is likely to lie. As illustrated here, the precision range has a major impact on the number of urine samples needed. Narrowing this range down requires a steep increase in the number of urine samples. Adjusting the CI of the limits of the precision range has a smaller impact on n. Hence, while increasing the CI from 95 to 98 % requires 41 % more samples, narrowing the precision range similarly, i.e. from 5 to 2 %, causes a need for 525 % more samples.
Increasing the number of urine samples from 100 to 1000 narrows the precision range from 11 to 3·5 %, while increasing from 1000 to 10 000 narrows the precision range from 3·5 to 1·1 %, with 95 % CI for all precision ranges. Thus, the first 900 samples reduces the precision range by 7·5 % while an additional 9000 samples reduces this by only 2·4 %. Hence, if 10 000 samples are feasible, a better use of resources may be to investigate a number of smaller groups representing different subgroups of the population rather than one large cohort. Whether such smaller groups should be separated in time, geography or social characteristics may depend on local factors. Yet, such design considerations likely allow for identification of population subgroups with insufficient or excessive iodine intake, and hence overall results more representative of the general population.
The optimal group size could be determined by 95 % confidence, i.e. the combination of 95 % CI and a precision range of ± 5 %. As a rule of thumb, this requires spot urine samples from about 500 participants. Hence, if the average iodine excretion is 100 μg in 500 samples from a population, then the true iodine excretion of that population will be between 95 and 105 μg with 95 % confidence. Given 100 spot urine samples, this will be between 90 and 110 μg, equal to widening the precision range to ± 10 %. This is parallel to the validity of subgroup analysis.
Dividing a survey population of 500 into two subgroups reduces the precision range of the estimate of iodine excretion level from ± 5 to ± 7 %, i.e. widening the range of iodine excretion from 95–105 to 93–107 μg/l with 95 % confidence. A further subdivision into two groups reduces the precision range to around ± 10 %, 90–110 μg/l, and repeated subdivision reduces the precision range to ± 15 %, i.e. 85–115 μg/l in the example. This loss of precision can be compensated for by increasing the overall population size, to i.e. 5000, which narrows the overall precision range to below ± 2 %, i.e. 98–102 μg/l in the example, and ± 5 % (95–105 μg/l) in each of ten subgroups.
The basic information needed to do these calculations is knowledge of the variation in iodine excretion in the population. Urinary iodine varies markedly with both short-term variations(Reference Als, Helbling, Peter, Haldimann, Zimmerli and Gerber9, Reference Rasmussen, Ovesen and Christiansen10) and long-term variations(Reference Rasmussen, Ovesen, Bulow, Jorgensen, Knudsen, Laurberg and Pertild11, Reference Andersen, Pedersen, Pedersen and Laurberg13) due to dietary factors and dilution in addition to random variation(Reference Andersen, Pedersen, Pedersen and Laurberg13).
Diet is a major determinant of iodine excretion, including both constant factors such as tap water(Reference Andersen, Petersen and Laurberg23), and more variable elements such as solid foods(Reference Andersen, Hvingel, Kleinschmidt, Jørgensen and Laurberg8, Reference Pearce, Pino, He, Bazrafshan, Lee and Braverman24). Thus, not only median iodine intake but also its variation increases in populations living on diets with variable use of iodine-containing chemicals in food(Reference Pearce, Pino, He, Bazrafshan, Lee and Braverman24), and, thus the number of samples needed may be higher in such populations.
Variable fluid intake causes variation in urine volume, and thereby in the dilution of the urinary excretion of iodine from solid foods. This variation in urinary iodine content may be corrected for by using a ratio of sample iodine to creatinine. The use of age- and gender-matched 24 h urinary creatinine values from the same or a similar population seems the more appropriate(Reference Jolin and Escobar del Rey20, Reference Knudsen, Christiansen, Brandt-Christensen, Nygaard and Perrild21). This reduces variation in iodine excretion by one-third compared to crude urinary iodine, and reduced the number of samples needed to describe population iodine excretion by about one-fifth.
The group included was relatively homogeneous. A gender difference in iodine excretion may add to the variation(Reference Andersen, Pedersen, Iversen, Terpling, Gustenhoff, Petersen and Laurberg25), while old age may reduce this for dietary reasons. Thus, variation may be higher in the general population, and the present estimates should be considered as minimum requirements.
Data were collected prior to the initiation of the Danish iodine fortification programme(Reference Laurberg, Jørgensen, Perrild, Ovesen, Knudsen, Pedersen, Rasmussen, Carlé and Vejbjerg7). Iodine fortification increased the average iodine intake(Reference Vejbjerg, Knudsen, Perrild, Carle, Laurberg, Pedersen, Rasmussen, Ovesen and Jorgensen26). This may increase variation also, depending on distribution and use of salt in the population. If so, the number of samples needed to monitor iodine fortification programmes will be higher than the present estimates, and data should be provided to clarify this.
The relevance of determining individual iodine excretion is debated. The thyroid gland has the capacity to store large amounts of iodine, unaffected by short-term low iodine intake. In addition, iodine excretion in the individual reflects the iodine intake over a short period of time prior to collection(Reference Als, Helbling, Peter, Haldimann, Zimmerli and Gerber9, Reference Rasmussen, Ovesen and Christiansen10), and urinary iodine excretion varies considerably(Reference Andersen, Pedersen, Pedersen and Laurberg13). Thus, short-term estimation of individual iodine intake may likely be inaccurate(Reference Haddow, McClain, Palomaki, Hollowell and Hollowell27).
We used the z-statistics as recommended(Reference Fraser and Harris22). This, however, may underestimate sample size for small numbers of samples compared to t-statistics. Comparison of the two methods for estimating number of urine samples needed in the individual showed an underestimation up to 30 %. Hence, a precision range of ± 10 % with 95 % confidence required forty-six samples using z-statistics, while fifty-eight samples were needed when using t-statistics. Similarly, settling with ± 20 % precision range required eleven samples with z-statistics compared to sixteen samples with t-statistics. This underestimation adds to the uncertainty related to estimating urinary iodine excretion in individuals.
In conclusion, the number of urine samples needed and the precision of estimates of iodine excretion with different survey population sizes in studies of iodine intake is now available. Five hundred spot urine samples describes population iodine excretion with about ± 5 % precision. In an individual, more than ten urine samples are needed to avoid misleading evaluations.


