





Food systems contribute to approximately one-third of global greenhouse gas emissions(Reference Guillaumie, Boiral and Baghdadli1). The environmental impacts of food include energy use, greenhouse gas emissions and waste generation during stages such as production, processing, transportation and consumption(Reference Lang and Barling2). These effects lead to consequences such as the depletion of natural resources and biodiversity, environmental pollution and climate change, thus highlighting the need to address nutrition from a sustainability perspective(Reference Bastian, Buro and Palmer-Keenan3). The concept of sustainable nutrition was first referred to in the early 1980s(Reference Gussow and Clancy4,Reference Gussow5) . The FAO defines sustainable diets as ‘diets that contribute to food and nutrition security for present and future generations, have low environmental impacts, are nutritionally adequate, healthy, and respectful of ecosystems’(Reference Burlingame and Dernini6). It is stated that adopting sustainable nutrition models is associated with a reduction in the risk of chronic diseases and can positively affect public health on a global scale(Reference Agostoni, Boccia and Banni7,Reference Santos8) .
Awareness of individuals in supporting healthy life and understanding environmental impacts has required them to have the capacity to perceive food systems; as a result, the concept of food literacy has emerged(Reference Park, Park and Park9,Reference Lee, Kim and Jung10) . Vidgen and Gallegos(Reference Vidgen and Gallegos11) define food literacy as the totality of interrelated knowledge, skills and behaviours related to food selection, planning, management, preparation and consumption to determine an individual’s food intake. Food literacy involves healthy food choices. It also involves understanding the relationship between food, health and the environment and developing knowledge and attitudes about the environmental impacts of food(Reference Perry, Thomas and Samra12–Reference Teng and Chih14). Furthermore, there is a relationship between food literacy components and factors determining diet quality. Studies have reported that an increase in food literacy levels, along with healthy food selection skills, improves diet quality(Reference Murakami, Shinozaki and Livingstone15). Diet quality is generally assessed in terms of the variety of healthy food choices within food groups in the diet. Diet quality is examined in terms of adequacy, variety and moderation and is evaluated using various indices(Reference Reguant-Closa, Pedolin and Herrmann16). Food literacy, when evaluated comprehensively, includes information regarding the impact of food on personal health and well-being, as well as an understanding of the entire food system, from production to waste management. From this perspective, food literacy contributes to the advancement of sustainable food systems(Reference Cullen, Hatch and Martin17). Sustainable food literacy refers to individuals’ capacity to understand the environmental, health and social impacts of their food choices and consumption behaviours and to act accordingly. This concept encompasses the dimensions of knowledge about the ecological effects of food, skills that reduce food waste and support health, a positive attitude towards sustainable nutrition, the intention to practise these behaviours and action strategies that implement sustainable nutrition behaviours. In this respect, sustainable food literacy stands out as a key determinant in individuals developing sustainable eating behaviours(Reference Teng and Chih14). In this context, sustainable nutrition and food systems are one of the fundamental dimensions of food literacy. Food literacy is important for adopting sustainable and healthy eating behaviours(Reference Park, Park and Park9,Reference Perry, Thomas and Samra12) .
As more people use institutional food services systems, they have an effect on the environment along the whole food supply chain, from production to distribution to preparation to service to waste management(Reference Speck, Wagner and Buchborn18). Institutional food services make a lot of meals and have a lot of different parts, so policies based on sustainability in this area could help with global problems like climate change and loss of biodiversity. So, they are important for protecting the environment(Reference Speck, Wagner and Buchborn18,Reference Neto, Boyano and Espinosa19) .
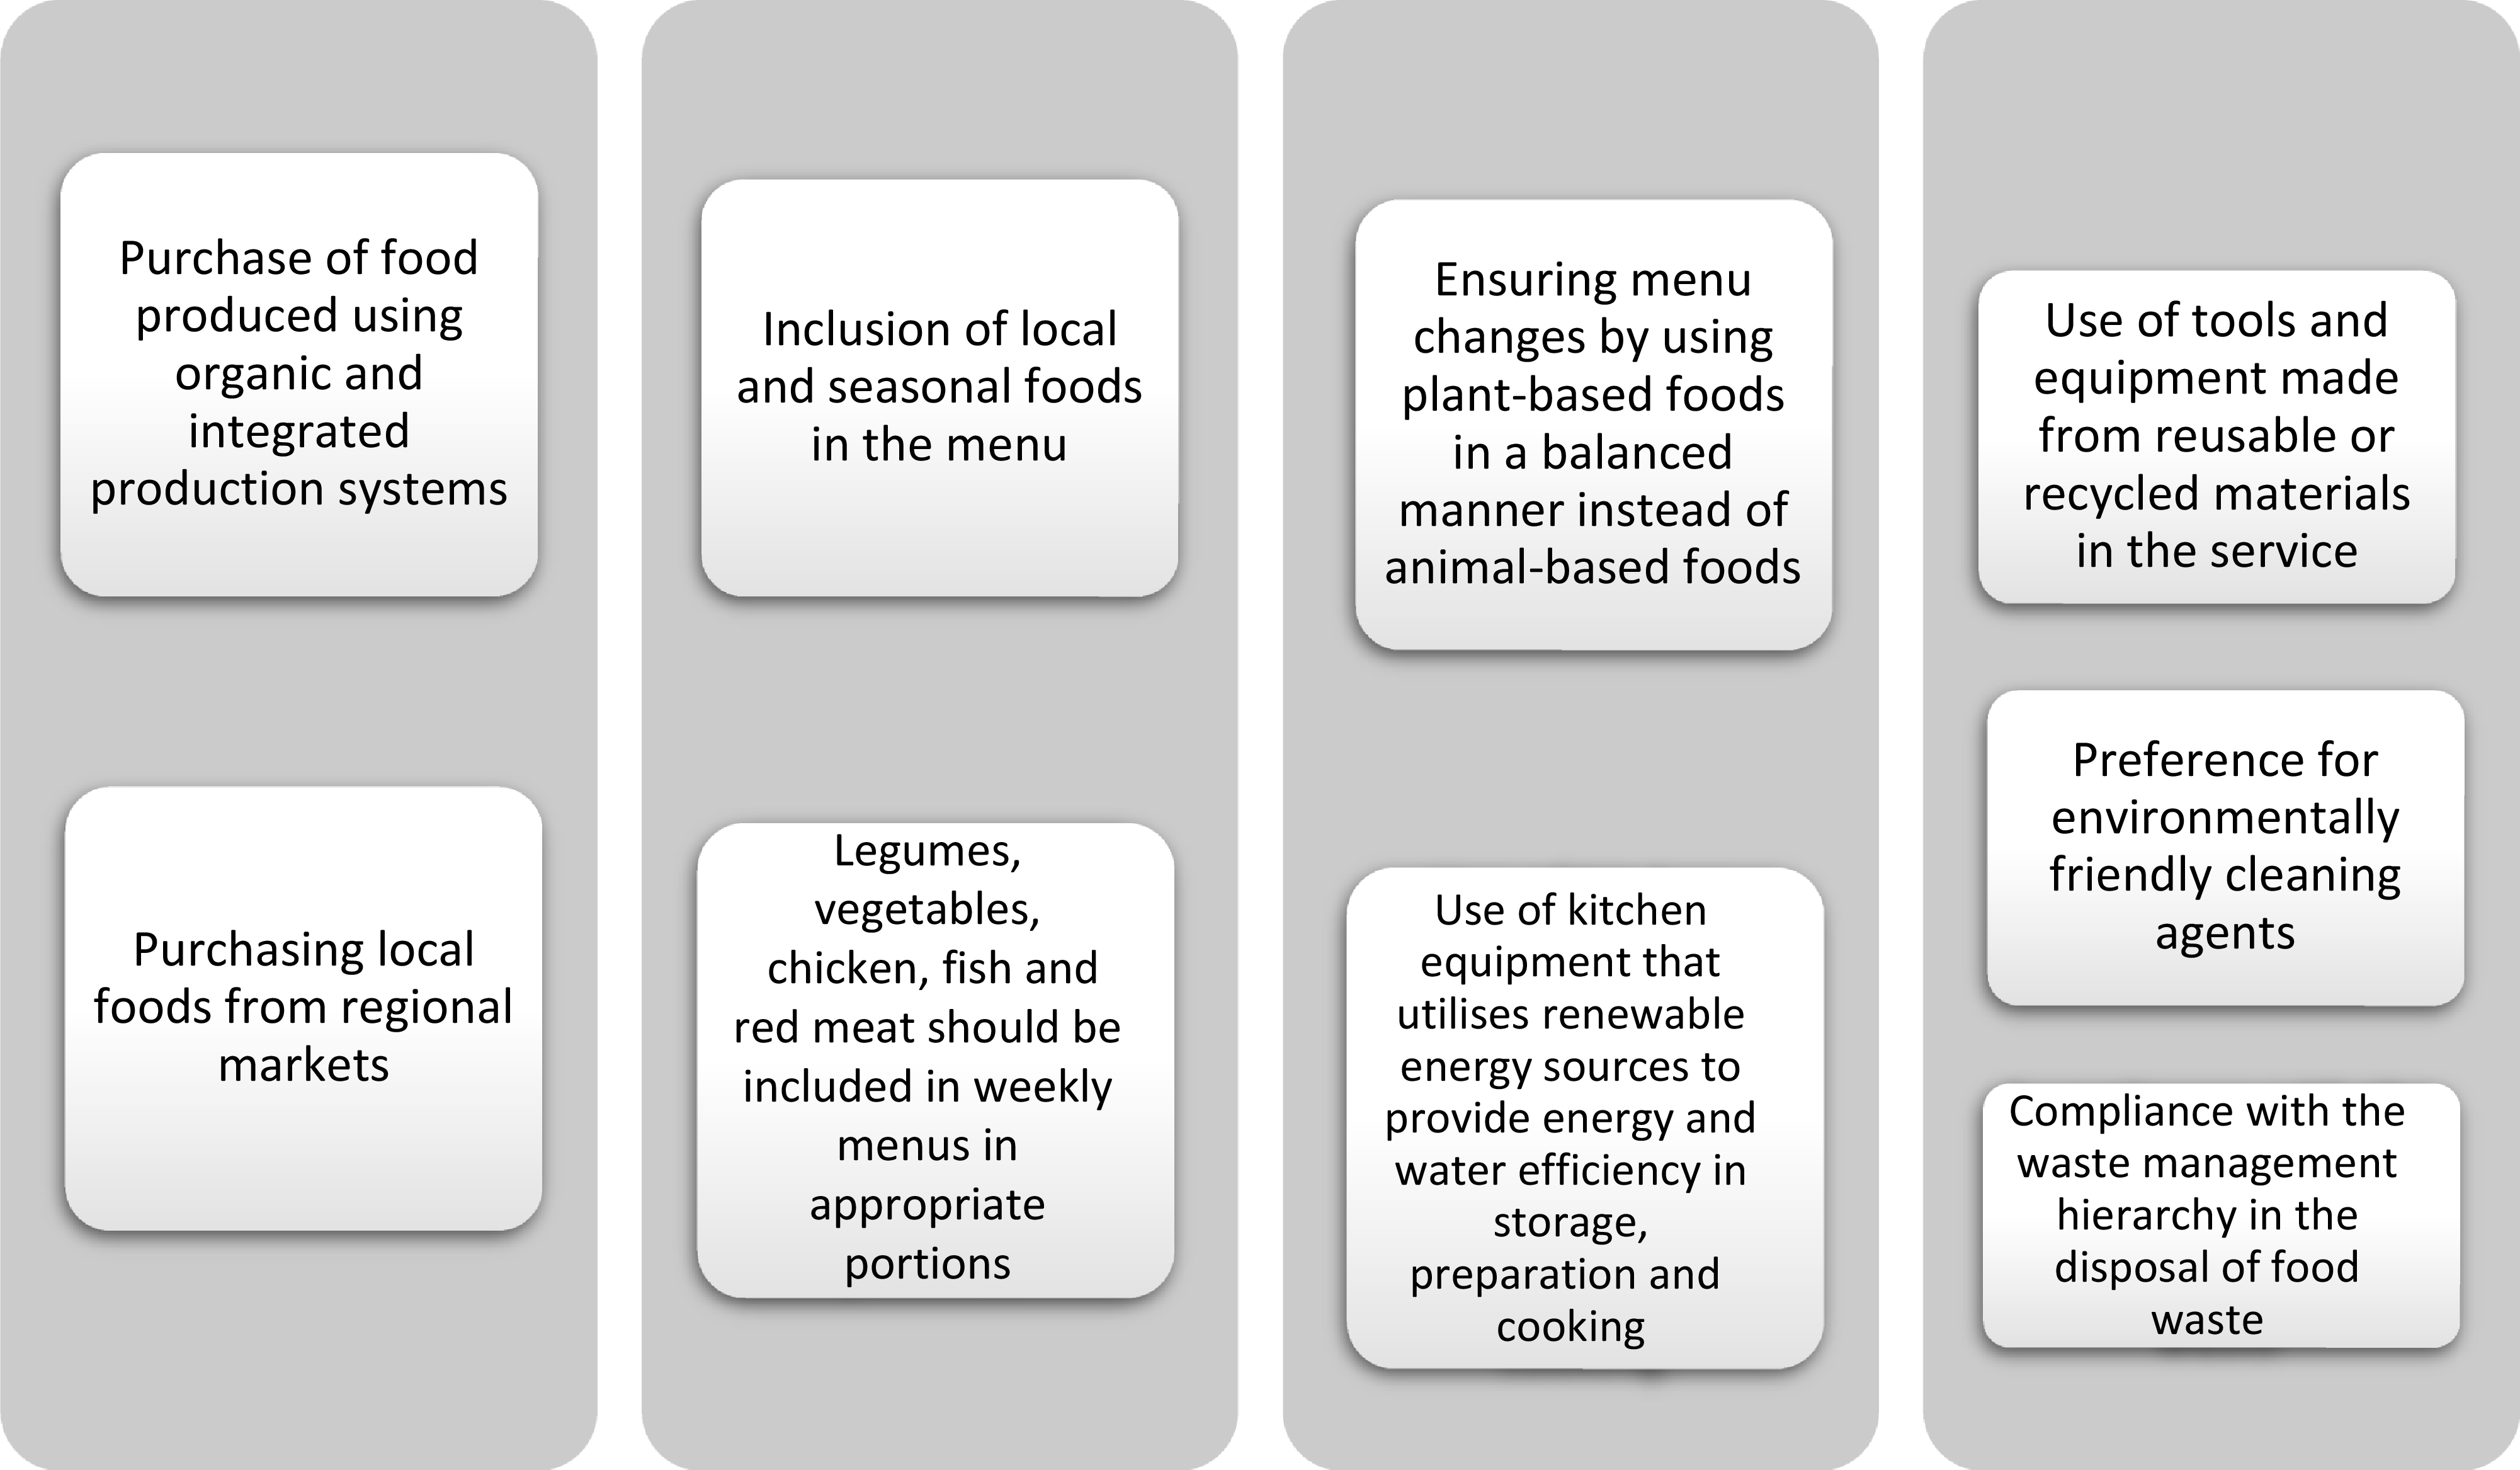
Figure 1 presents sustainability practices related to institutional food services(Reference Ju and Chang20–Reference Coskun, Genç and Coskun26).
Sustainability-related practices in institutional food services.

Institutional food services improve public health by providing safe food and balanced nutrition. They also play an important role in ensuring economic, environmental and social sustainability(Reference Marcotrigiano, Stingi and Nugnes27). Implementing sustainable and healthy nutrition practices in institutions offering these services can effectively improve individuals’ nutrition quality(Reference Lorenz and Langen28). In this process, the level of knowledge and attitude of the personnel involved in service delivery, particularly on the issues of sustainability and healthy nutrition, becomes important(Reference Reinders, Battjes-Fries and Bouwman29). The awareness of dietitians and other staff involved in stages such as menu planning and the food supply chain directly affects the adoption of sustainable practices(Reference Guillaumie, Boiral and Baghdadli1). The literature evaluating food literacy and sustainable and healthy eating behaviours among institutional food service staff is relatively limited(Reference Martin, Pujos and Magrini30,Reference Güner, Söylemez and Aydın31) . This study aims to evaluate the relationship between food literacy, sustainable and healthy eating behaviours and diet quality among institutional food service staff.
Material and methods
Study design and participants
This cross-sectional study was performed from March 2024 to July 2024, involving 173 volunteer individuals (cooks, assistant cooks, waiters, dishwashers and cleaners) employed in the kitchens and dining halls associated with Gazi University in Ankara, Türkiye. Individuals who fulfilled the application criteria (education, experience and professional credentials) specified in the university’s official personnel announcements were employed as institutional food service staff, either permanently or on a contractual basis. The study population consisted of 300 institutional food service staff, and since there was no similar study, the sample size was calculated according to the population. In order to determine the sample size, the analysis was performed by taking the α = 0·05 and power (1 − β) = 0·90 via the G*Power software program. The sample size was determined based on the study’s primary outcome variable, which was sustainable and healthy eating behaviours. Because there was no comparable study including food service staff, the impact size was classified as a medium effect using Cohen’s d = 0·5(Reference Cohen32). The sample size was calculated using the independent-samples t test, which compared two independent groups (production and support staff). The number of samples determined as a result of the analysis was 172. Individuals under the age of 18 years, those who are illiterate, those who do not volunteer to participate in the study, those who are not actively employed within institutional food services and individuals who receive education or training related to food literacy or sustainable nutrition constitute the exclusion criteria for the study. Inclusion criteria for the study were being between 18 and 65 years of age, being actively employed within institutional food services and volunteering to participate. Two groups have been identified: the production staff group, which includes cooks and assistant cooks; and the support staff group, which includes waiters, cleaners and dishwashers. After obtaining all the data, a post hoc power analysis was subsequently conducted using the G*Power software, taking into account the size of the groups. This took into account how big the groups we saw were. The study reached a power of 0·85 at a significance level of 0·05, which shows that the sample size was big enough to find differences between production and support staff. The balance between the number of production and support staff within the institution has been taken into consideration.
The study was conducted in accordance with the Standardised Criteria for Observational Studies in Epidemiology (SCOPE) and SCOPE-Nut guidelines. Data acquisition involved face-to-face interviews, which were administered by the corresponding author, a dietitian and research assistant, utilising a standardised questionnaire within a quiet area set aside as the kitchen staff’s break room. The Helsinki Declaration asked individuals to sign an Informed Consent Form. The questionnaire consists of sociodemographic information sections (age, sex, educational status, occupation indicating whether they are production or support staff and occupational experience), the Sustainable and Healthy Eating (SHE) Behaviors Scale, the Self-Perceived Food Literacy (SPFL) Scale and a 24-h dietary recall. The Healthy Eating Index-2020 (HEI-2020) score was calculated for each individual using the 24-h retrospective dietary intake record. The study protocol was approved by the Ethics Committee of Ankara Gazi University (13 February 2024, research code no: 2024-238).
24-h dietary recall
A 24-h dietary recall was conducted to evaluate the nutritional status of the study’s participants. The consumption of all food and beverages by individuals during a single day was scrutinised. The portion sizes and food quantities were determined using the measurements from the Food and Nutrition Photo Catalog(Reference Rakıcıoğlu, Tek and Ayaz33).The nutritional quantities in the ingested foods were determined using the portion sizes listed in the Standard Food Recipes book(Reference Merdol34). The daily energy and nutrient quantities derived from the ingested foods were computed utilising the Nutrition Information Systems 8.2 (BeBiS 8.2) software. The consumption of nutrient groups was computed utilising the BeBİS 8.2 application.
Sustainable and Healthy Eating Behaviors Scale
Individuals’ sustainable and healthy eating behaviours were assessed using the SHE Behavior Scale. The SHE Behavior Scale was developed by Żakowska-Biemans et al. (Reference Żakowska-Biemans, Pieniak and Kostyra35) (Cronbach’s α = 0·911), and its validity and reliability in Turkish were established by Köksal et al. (Reference Köksal, Bilici and Dazıroğlu36) (Cronbach’s α = 0·912). In this study, Cronbach’s α was 0·910. This scale consists of seven factors and thirty-two items in total. The seven factors are quality indicators (local and organic), seasonal foods and avoiding food waste, healthy and balanced nutrition, local food, meat reduction, animal welfare and low-fat. The thirty-two items are scored on a seven-point Likert-type scale. The items on the scale were scored as follows: 1 = Never, 2 = Very rarely, 3 = Rarely, 4 = Sometimes, 5 = Often, 6 = Very often and 7 = Always(Reference Köksal, Bilici and Dazıroğlu36). Factor scores are calculated by taking the average of the scores given to the questions in the factors, and the total scale score is calculated by taking the average of the scores given to all factors. Although the scale does not have a cut-off point, high scores indicate a high level of sustainable and healthy eating behaviour(Reference Köksal, Bilici and Dazıroğlu36).
Self-Perceived Food Literacy Scale
Individuals’ food literacy was assessed using the SPFL Scale. The SPFL Scale was developed by Poelman et al. (Reference Poelman, Dijkstra and Sponselee37) (Cronbach’s α = 0·83). The validity and reliability of the scale in Turkish were established by Selçuk et al. (Reference Selçuk, Çevik and Baydur38) (Cronbach’s α = 0·83). The Turkish-validated version of the SPFL Scale was used in this study. In this study, Cronbach’s α was 0·82. Scoring was conducted in accordance with the original SPFL scoring protocol, as the Turkish validation study does not provide detailed item-level scoring procedures, including reverse-scored items. The SPFL Scale consists of twenty-nine items in the following eight factors: food preparation skills, resilience and resistance, healthy snack styles, social and conscious eating, examining food labels, daily food planning, healthy budgeting and healthy food stockpiling. The items are scored on a five-point Likert-type scale(Reference Selçuk, Çevik and Baydur38). The items on the scale were scored as follows: 1 = Never/, 2 = Rarely, 3 = Sometimes, 4 = Yes, usually 5 = Yes, Always. According to Poelman et al., items 2, 10, 12, 19, 26, 27, 28 and 29 which include negative assertions regarding food literacy were reverse-scored. The total score obtained from the scale ranges from 29 to 145, with a high total score indicating a high level of food literacy(Reference Selçuk, Çevik and Baydur38).
Healthy Eating Index-2020
The HEI-2020 score was calculated using a 24-h dietary recall to assess the quality of individuals’ diets(Reference Shams-White, Pannucci and Lerman39). HEI-2020 consists of thirteen components, including adequacy and moderation components. The adequacy components include total fruit (5 points), whole fruit (5 points), total vegetables (5 points), greens and beans (5 points), whole grains (10 points), dairy and dairy products (10 points), total protein sources (5 points), seafood and plant-based proteins (5 points) and fatty acids (10 points). In comparison, the moderation components include Na (10 points), refined grains (10 points), saturated fat (10 points) and added sugar (10 points)(Reference Shams-White, Pannucci and Lerman39,Reference Krebs-Smith, Pannucci and Subar40) . According to the HEI standards, the maximum points for adequacy components are obtained when these components are consumed. In contrast, the maximum points for moderation components are obtained when the consumption of these components is low. A total score of < 51 indicates poor diet quality, 51–80 indicates needs improvement and > 80 indicates good diet quality(Reference Basiotis, Carlson and Gerrior41).
Statistical analysis
The data obtained from the study were analysed using IBM SPSS Statistics 26.0 software. The Kolmogorov–Smirnov test was used to determine normal distribution. Item scores from the scale are given as mean ( $\overline {{\rm{X\;}})}$
, standard deviation (sd), median, minimum and maximum values. The independent-samples t test was applied for data showing normal distribution, while the Mann–Whitney U test was used for data not showing normal distribution. The χ
2 test examined the relationship between categorical and dependent variables. In correlation analysis, the Pearson correlation test was used for data showing a normal distribution, and the Spearman correlation test was used for data not showing a normal distribution. The correlation coefficient (r) is defined as weak for 0·05–0·40, moderate for 0·40–0·60 and strong for 0·60–0·70(Reference Murat Hayran42). Multivariate linear regression analysis was applied to variables with significant correlations. Correlation analysis does not show the direction of a relationship; the expected direction between the variables was determined using the existing theory. In this study, food literacy was seen as a more basic factor. It included people’s understanding of food choices, their ability to read food labels and their knowledge of healthy eating. Therefore, food literacy was included in regression model 1 as the predictor (independent variable), and sustainable and healthy eating behaviours were the dependent variable. In regression model 2, the HEI total score and occupational experience were considered important theoretical factors that could influence food literacy. These factors were included in the model as predictors. The regression models were adjusted for age and education level. To control for potential confounding effects of age and education level, these variables were included as confounders in the regression model. The significance level was accepted as P < 0·05 in all statistical analyses used in the study.
$\overline {{\rm{X\;}})}$
, standard deviation (sd), median, minimum and maximum values. The independent-samples t test was applied for data showing normal distribution, while the Mann–Whitney U test was used for data not showing normal distribution. The χ
2 test examined the relationship between categorical and dependent variables. In correlation analysis, the Pearson correlation test was used for data showing a normal distribution, and the Spearman correlation test was used for data not showing a normal distribution. The correlation coefficient (r) is defined as weak for 0·05–0·40, moderate for 0·40–0·60 and strong for 0·60–0·70(Reference Murat Hayran42). Multivariate linear regression analysis was applied to variables with significant correlations. Correlation analysis does not show the direction of a relationship; the expected direction between the variables was determined using the existing theory. In this study, food literacy was seen as a more basic factor. It included people’s understanding of food choices, their ability to read food labels and their knowledge of healthy eating. Therefore, food literacy was included in regression model 1 as the predictor (independent variable), and sustainable and healthy eating behaviours were the dependent variable. In regression model 2, the HEI total score and occupational experience were considered important theoretical factors that could influence food literacy. These factors were included in the model as predictors. The regression models were adjusted for age and education level. To control for potential confounding effects of age and education level, these variables were included as confounders in the regression model. The significance level was accepted as P < 0·05 in all statistical analyses used in the study.
Results
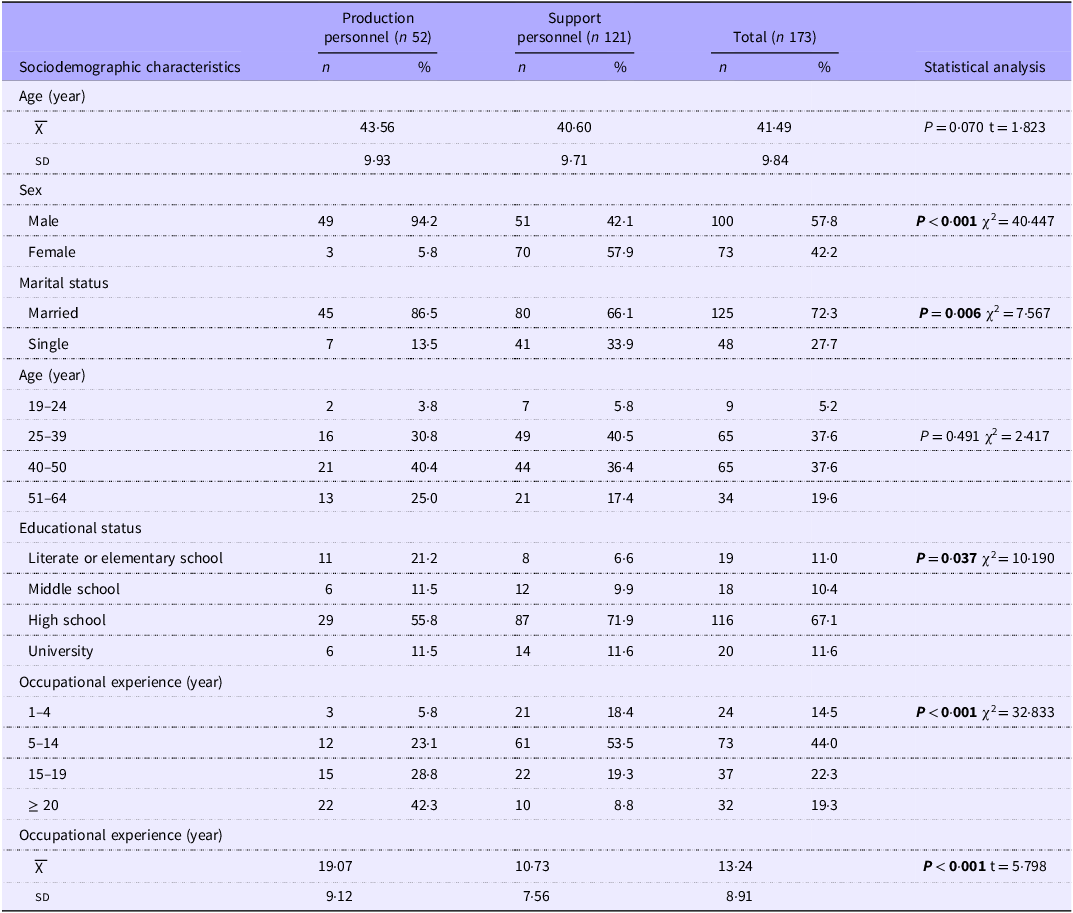
Table 1 shows the distribution of sociodemographic characteristics of participants. Of the institutional food service staff included in the study, 30·1 % were production personnel and 69·9 % were support personnel. The mean age of production staff was 43·56 (sd 9·93), and the mean age of support staff was 40·60 (sd 9·71) (P = 0·070). High school graduates have the highest rate in both occupational groups. The highest rate (44 %) for occupation experience is 5–14 years. The percentage of production staff with 20 years or more of experience in the occupation (42·3 %) was found to be significantly higher than the percentage of support staff with 20 years or more of experience (8·8 %) (P < 0·001). The mean occupational experience of the production staff was 19·07 (sd 9·12), and the mean occupational experience of support staff was 10·73 (sd 7·56) (P < 0·001) (Table 1).
The distribution of sociodemographic characteristics of participants (%)
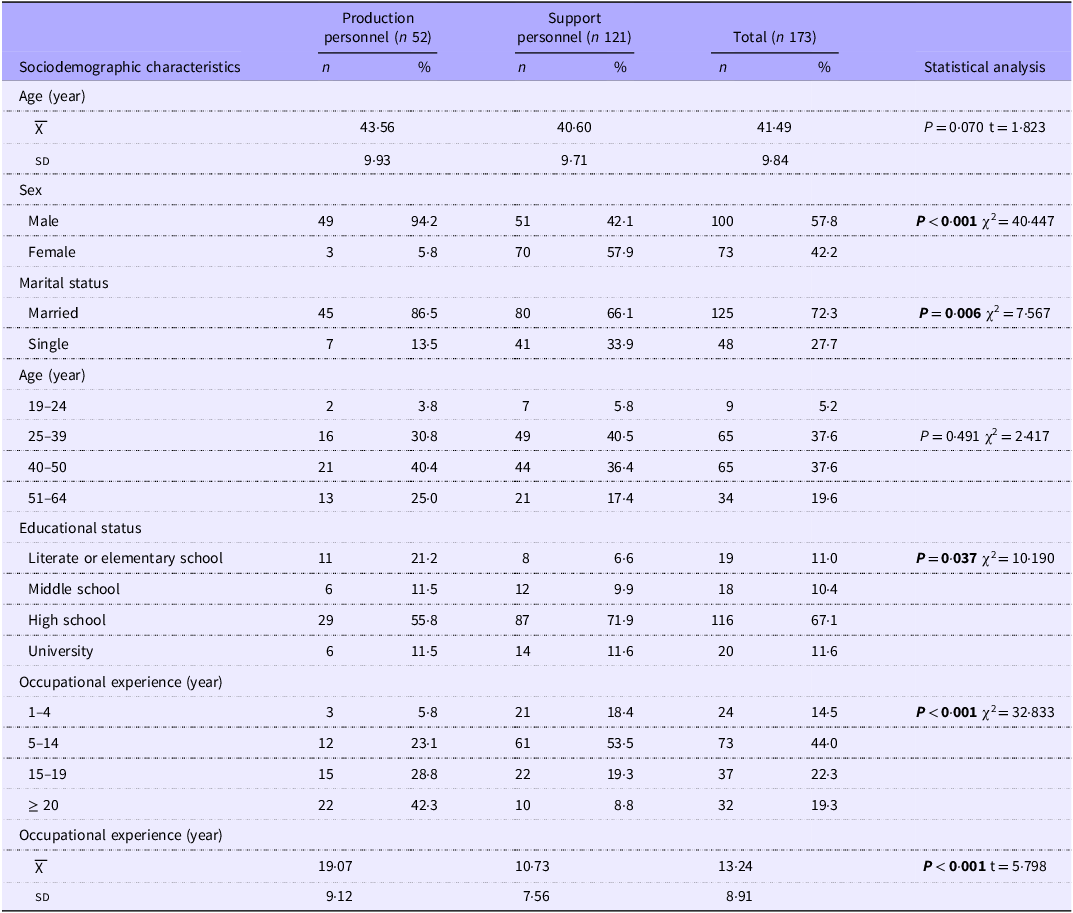
Table 1. Long description
The table presents sociodemographic characteristics of participants, divided into production personnel and support personnel. It has 12 rows and 8 columns. The columns are labeled as Sociodemographic characteristics, Production personnel (n 52), n, %, Support personnel (n 121), n, %, Total (n 173), n, %, and Statistical analysis. The rows are labeled as Age (year), Sex, Marital status, Age (year), Educational status, Occupational experience (year), and Occupational experience (year). Each row provides data for production personnel, support personnel, and total participants, along with statistical analysis. Notable trends include a higher percentage of males in production personnel (94.2%) compared to support personnel (42.1%), and a higher percentage of married individuals in production personnel (86.5%) compared to support personnel (66.1%). High school graduates have the highest rate in both occupational groups. The highest rate (44%) for occupational experience is 5-14 years. The percentage of production staff with 20 years or more of experience in the occupation (42.3%) was found to be significantly higher than the percentage of support staff with 20 years or more of experience (8.8%). The mean occupational experience of the production staff was 19.07 (sd 9.12), and the mean occupational experience of support staff was 10.73 (sd 7.56). ${\rm{\bar X}}$
, mean.
${\rm{\bar X}}$
, mean.
The χ 2 test was used for categorical data, and the t test was used for continuous data (age and occupational experience) expressed as mean and standard deviation.
Statistically significant P values are shown in bold.
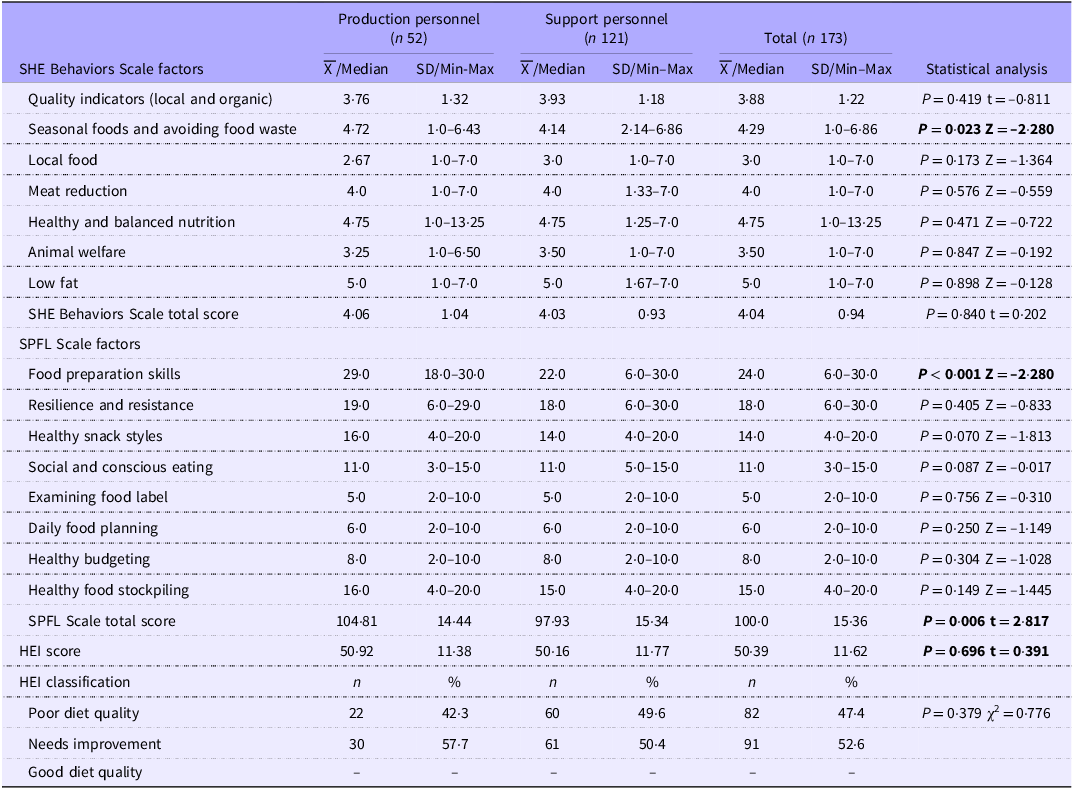
Table 2 shows the mean, standard deviation, median, minimum and maximum values of the SHE Behavior Scale and SPFL Scale scores according to staff type. The mean total score on the SHE Behavior Scale was 4·04 (sd 0·96) for all participants, 4·06 (sd 1·04) for production personnel and 4·03 (sd 0·93) for support personnel. The factor score related to seasonal foods and avoiding waste was 4·72 (1·0–6·43) for production personnel and 4·14 (2·14–6·86) for support personnel, indicating a significantly higher score among production personnel (P = 0·023). The mean total SPFL score was 100·00 (sd 15·36) for all participants. The mean total SPFL score for production personnel (104·81 (sd 14·44)) was significantly higher than that of support personnel (97·93 (sd 15·34)) (P = 0·006). The median food preparation skill factor score was 29·00 (18·0–30·0) for production personnel and 22·00 (6·0–30·0) for support personnel, with the score for production personnel being significantly higher than that for support personnel (P < 0·001) (Table 2).
Mean, standard deviation, median, minimum and maximum values of the SHE Behavior Scale, SPFL Scale and HEI scores in production and support personnel
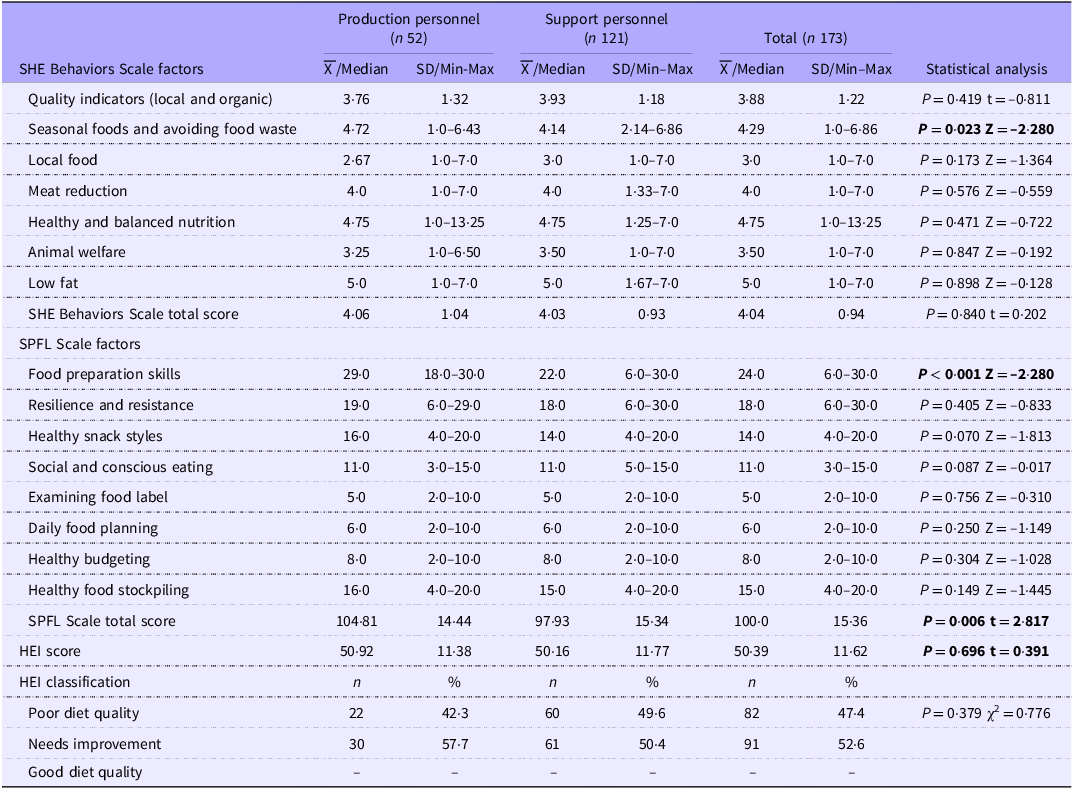
Table 2. Long description
The table presents data on the mean, standard deviation, median, minimum, and maximum values of the SHE Behavior Scale and SPFL Scale scores for production personnel and support personnel. It includes statistical analysis results. The table has 23 rows and 10 columns. Column headers are Production personnel (n 52), Support personnel (n 121), Total (n 173), and Statistical analysis. Row labels include SHE Behaviors Scale factors and SPFL Scale factors. Row 1: Quality indicators (local and organic), Production personnel: 3-76, 1-32; Support personnel: 3-93, 1-18; Total: 3-88, 1-22; Statistical analysis: P = 0.419 t = -0.811. Row 2: Seasonal foods and avoiding food waste, Production personnel: 4-72, 1-0-6-43; Support personnel: 4-14, 2-14-6-86; Total: 4-29, 1-0-6-86; Statistical analysis: P = 0.023 Z = -2.280. Row 3: Local food, Production personnel: 2-67, 1-0-7-0; Support personnel: 3-0, 1-0-7-0; Total: 3-0, 1-0-7-0; Statistical analysis: P = 0.173 Z = -1.364. Row 4: Meat reduction, Production personnel: 4-0, 1-0-7-0; Support personnel: 4-0, 1-33-7-0; Total: 4-0, 1-0-7-0; Statistical analysis: P = 0.576 Z = -0.559. Row 5: Healthy and balanced nutrition, Production personnel: 4-75, 1-0-13-25; Support personnel: 4-75, 1-25-7-0; Total: 4-75, 1-0-13-25; Statistical analysis: P = 0.471 Z = -0.722. Row 6: Animal welfare, Production personnel: 3-25, 1-0-6-50; Support personnel: 3-50, 1-0-7-0; Total: 3-50, 1-0-7-0; Statistical analysis: P = 0.847 Z = -0.192. Row 7: Low fat, Production personnel: 5-0, 1-0-7-0; Support personnel: 5-0, 1-67-7-0; Total: 5-0, 1-0-7-0; Statistical analysis: P = 0.898 Z = -0.128. Row 8: SHE Behaviors Scale total score, Production personnel: 4-06, 1-04; Support personnel: 4-03, 0-93; Total: 4-04, 0-94; Statistical analysis: P = 0.840 t = 0.202. Row 9: Food preparation skills, Production personnel: 29-0, 18-0-30-0; Support personnel: 22-0, 6-0-30-0; Total: 24-0, 6-0-30-0; Statistical analysis: P < 0.001 Z = -2.280. Row 10: Resilience and resistance, Production personnel: 19-0, 6-0-29-0; Support personnel: 18-0, 6-0-30-0; Total: 18-0, 6-0-30-0; Statistical analysis: P = 0.405 Z = -0.833. Row 11: Healthy snack styles, Production personnel: 16-0, 4-0-20-0; Support personnel: 14-0, 4-0-20-0; Total: 14-0, 4-0-20-0; Statistical analysis: P = 0.070 Z = -1.813. Row 12: Social and conscious eating, Production personnel: 11-0, 3-0-15-0; Support personnel: 11-0, 5-0-15-0; Total: 11-0, 3-0-15-0; Statistical analysis: P = 0.087 Z = -0-017. Row 13: Examining food label, Production personnel: 5-0, 2-0-10-0; Support personnel: 5-0, 2-0-10-0; Total: 5-0, 2-0-10-0; Statistical analysis: P = 0.756 Z = -0.310. Row 14: Daily food planning, Production personnel: 6-0, 2-0-10-0; Support personnel: 6-0, 2-0-10-0; Total: 6-0, 2-0-10-0; Statistical analysis: P = 0.250 Z = -1.149. Row 15: Healthy budgeting, Production personnel: 8-0, 2-0-10-0; Support personnel: 8-0, 2-0-10-0; Total: 8-0, 2-0-10-0; Statistical analysis: P = 0.304 Z = -1.028. Row 16: Healthy food stockpiling, Production personnel: 16-0, 4-0-20-0; Support personnel: 15-0, 4-0-20-0; Total: 15-0, 4-0-20-0; Statistical analysis: P = 0.149 Z = -1.445. Row 17: SPFL Scale total score, Production personnel: 104-81, 14-44; Support personnel: 97-93, 15-34; Total: 100-0, 15-36; Statistical analysis: P = 0.006 t = 2.817. Row 18: HEI score, Production personnel: 50-92, 11-38; Support personnel: 50-16, 11-77; Total: 50-39, 11-62; Statistical analysis: P = 0.696 t = 0.391. Row 19: HEI classification, Production personnel: Poor diet quality, 22, 42-3 percent; Needs improvement, 30, 57-7 percent; Good diet quality, 0, 0 percent; Support personnel: Poor diet quality, 60, 49-6 percent; Needs improvement, 61, 50-4 percent; Good diet quality, 0, 0 percent; Statistical analysis: Poor diet quality, P = 0.379 χ2 = 0.776.
SHE, Sustainable and Healthy Eating; SPFL, Self-Perceived Food Literacy; ${\rm{\bar X}}$
, mean; t, t statistic from t test; Z, standardised test statistic from the Mann–Whitney U test; HEI, Healthy Eating Index.
${\rm{\bar X}}$
, mean; t, t statistic from t test; Z, standardised test statistic from the Mann–Whitney U test; HEI, Healthy Eating Index.
The t test was applied to normally distributed parameters (quality indicators (local and organic), SHE Behaviors Scale total score, SPFL Scale total score and HEI score), whereas the Mann–Whitney U test was applied to the remaining variables.
Normally distributed variables were expressed as mean and standard deviation, and non-normally distributed variables were expressed as median and minimum–maximum.
Statistically significant P values are shown in bold.
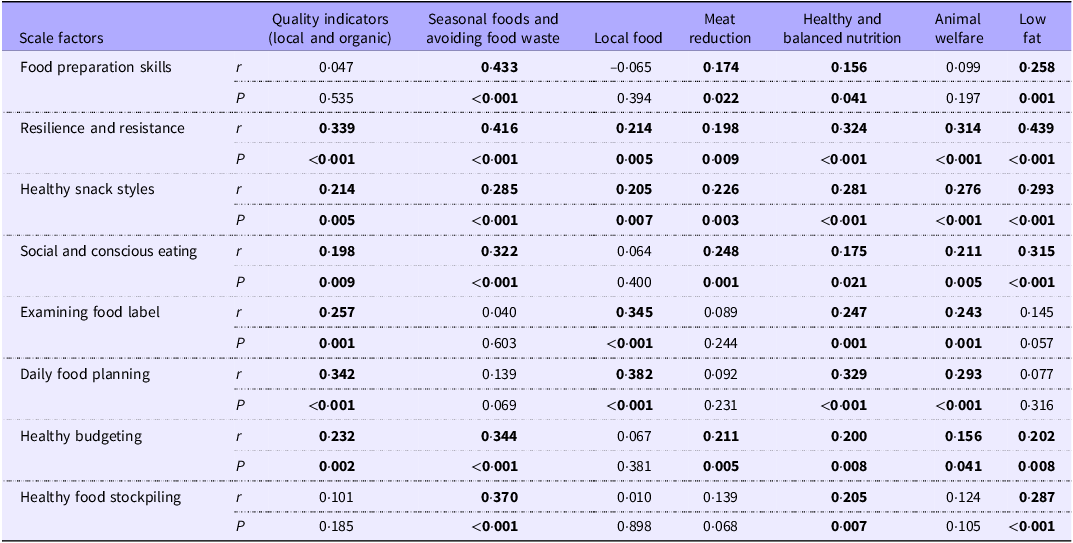
Table 3 presents the correlation between the factor scores of the SPFL Scale and SHE Behavior Scale. A low positive correlation was found between healthy snack types and resistance and resilience factors and all factors of the SHE Behavior Scale, with all correlations being statistically significant (P < 0·05). Food preparation skills revealed significant positive correlations with seasonal foods and avoiding waste (r: 0·433, P < 0·001), meat reduction (r: 0·174, P = 0·022), healthy and balanced nutrition (r: 0·156, P = 0·041) and low-fat (r: 0·258, P = 0·001) factors. A significant positive correlation was found between examining food labels and the following factors: quality indicators (r: 0·257, P = 0·001), local food (r: 0·345, P < 0·001), healthy and balanced nutrition (r: 0·247, P = 0·001) and animal health (r: 0·243, P = 0·001). Daily food planning revealed weak positive correlations with quality indicators (r: 0·342, P < 0·001), local food (r: 0·382, P < 0·001), animal health (r: 0·293, P < 0·001) and healthy and balanced nutrition (r: 0·329, P < 0·001) factors. Healthy budgeting showed weak positive correlation with quality indicators (r: 0·232, P = 0·002), seasonal foods and avoiding waste (r: 0·344, P < 0·001), meat reduction (r: 0·211, P = 0·005), healthy and balanced nutrition (r: 0·200, P = 0·008), animal welfare (r: 0·156, P = 0·041) and low-fat (r: 0·202, P = 0·008) factors. Healthy food stockpiling revealed weak positive correlations with seasonal foods and avoiding waste (r: 0·370, P < 0·001), healthy and balanced nutrition (r: 0·205, P = 0·007) and low-fat (r: 0·287, P < 0·001) factors (Table 3).
The correlation between the factor scores of the SPFL Scale and SHE Behavior Scale
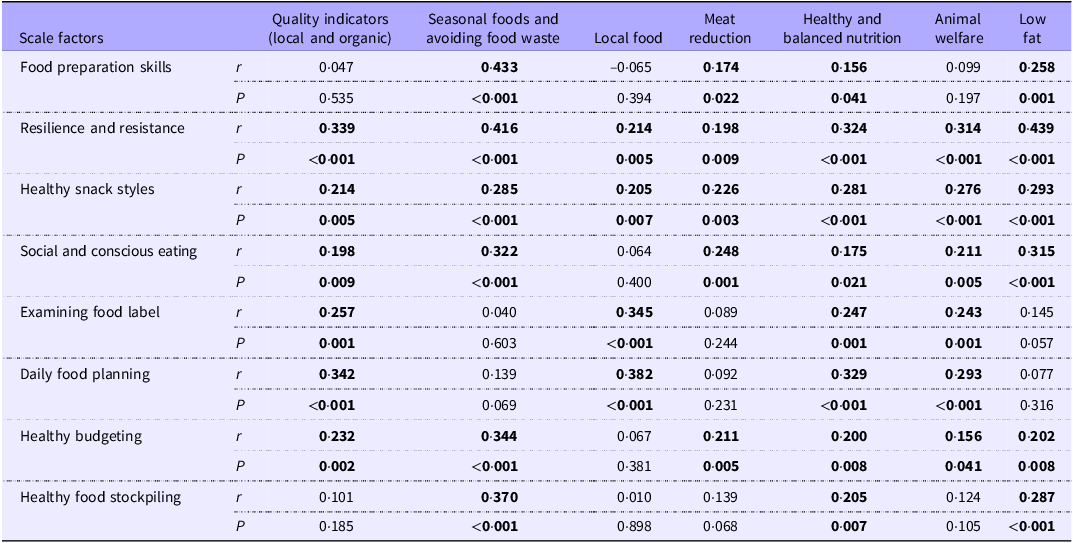
Table 3. Long description
The table presents correlations between factor scores of the SPFL Scale and SHE Behavior Scale. It has 8 rows and 8 columns. The columns are labeled as Scale factors, Quality indicators (local and organic), Seasonal foods and avoiding food waste, Local food, Meat reduction, Healthy and balanced nutrition, Animal welfare, and Low fat. The rows are labeled as Food preparation skills, Resilience and resistance, Healthy snack styles, Social and conscious eating, Examining food label, Daily food planning, Healthy budgeting, and Healthy food stockpiling. Each cell contains correlation values (r) and P-values (P). Notable trends include significant positive correlations between food preparation skills and various factors such as seasonal foods and avoiding waste, meat reduction, healthy and balanced nutrition, and low fat. Examining food labels also shows significant positive correlations with quality indicators, local food, healthy and balanced nutrition, and animal health. Daily food planning, healthy budgeting, and healthy food stockpiling reveal weak positive correlations with multiple factors.
SPFL, Self-Perceived Food Literacy; SHE, Sustainable and Healthy Eating.
The Spearman’s test has been applied for all variables.
Statistically significant P values are shown in bold.
The mean HEI-2020 score for production personnel was determined to be 50·92 (sd 11·38), and for support personnel, 50·16 (sd 11·77). It was determined that 52·6 % of all participants needed to improve their diet quality, and 47·4 % had poor diet quality. According to the HEI score classification, 73·2 % of participants with poor diet quality and 67·0 % of those who needed to improve their diet quality were support staff. No significant differences were found between occupational groups regarding HEI-2020 classification (P = 0·379) (Table 2).
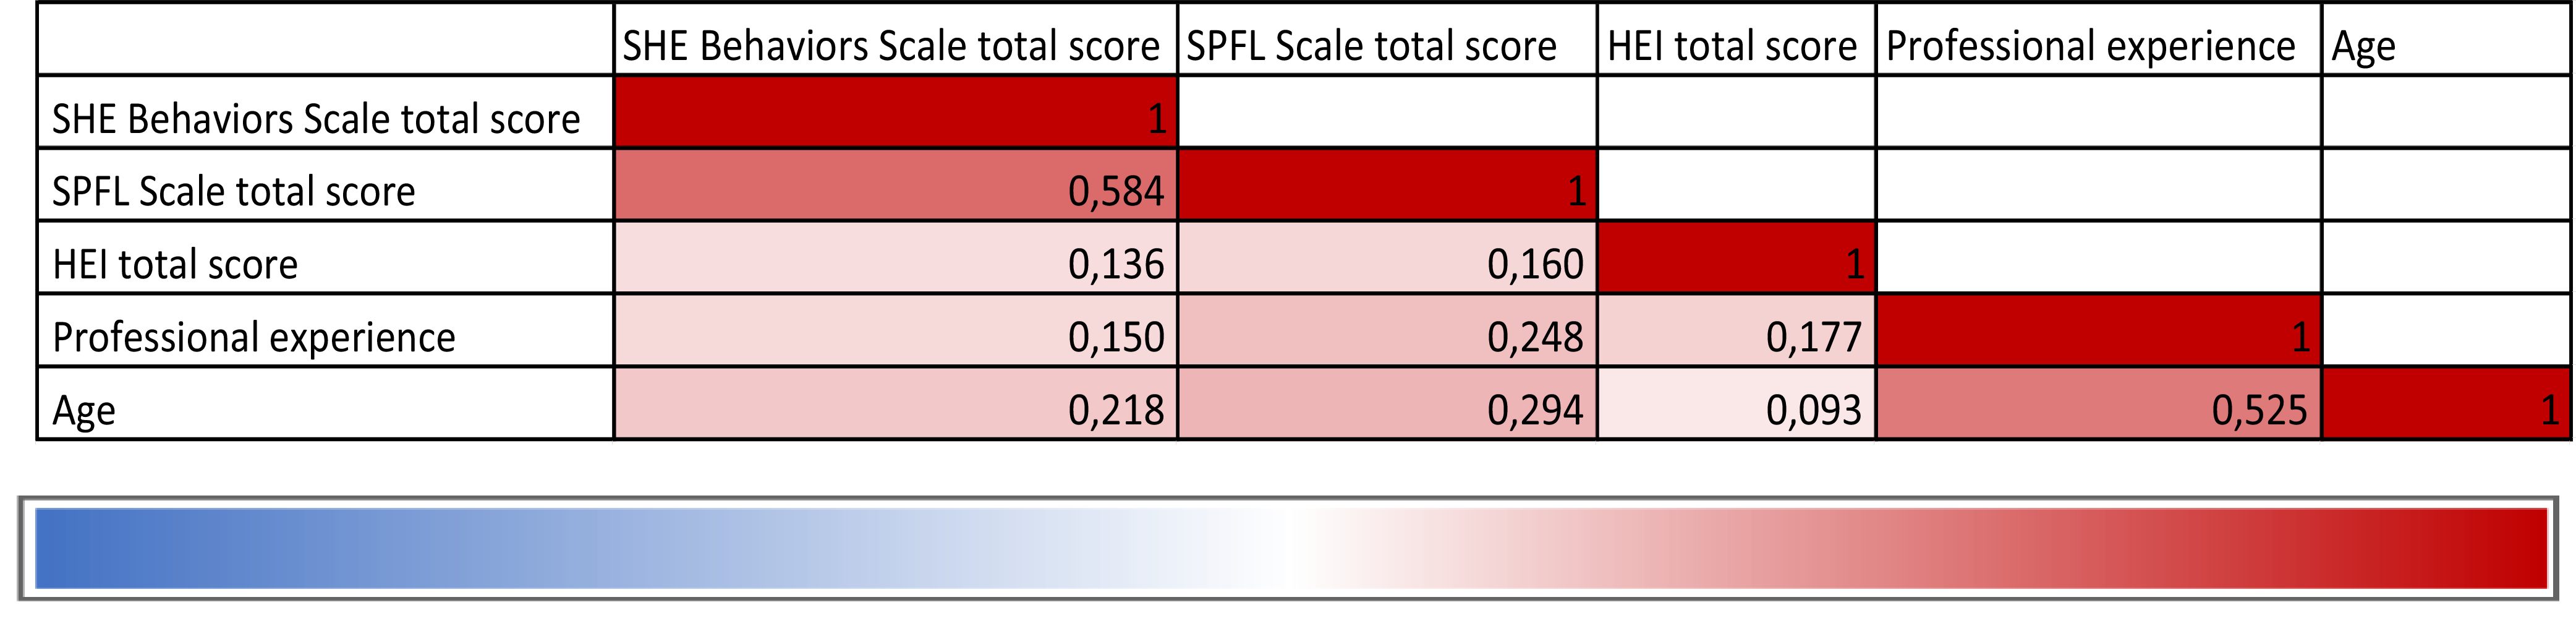
Figure 2 shows the heat map of the correlation between individuals’ SHE Behavior Scale scores, SPFL Scale scores, HEI-2020 scores, occupational experience and age. A statistically significant moderate positive correlation was found between the total score on the SHE Behavior Scale and the total score on the SPFL Scale (r: 0·584, P < 0·001). A statistically significant low positive correlation was found between the total SPFL Scale score and the total HEI-2020 score (r: 0·160, P = 0·036). Occupational experience revealed weak positive correlations with the total SPFL score (r: 0·248, P = 0·001) and the total HEI-2020 score (r: 0·177, P = 0·020). It was determined that age, sustainable and healthy eating behaviours and food literacy were significantly positively correlated (P < 0·05) (Figure 2).
The heat map of the correlation between individuals’ SHE Behavior Scale scores, SPFL Scale scores, HEI-2020 scores, occupational experience and age. The values in Figure 2 represent the correlation coefficients (r). SHE, Sustainable and Healthy Eating; SPFL, Self-Perceived Food Literacy; HEI, Healthy Eating Index.
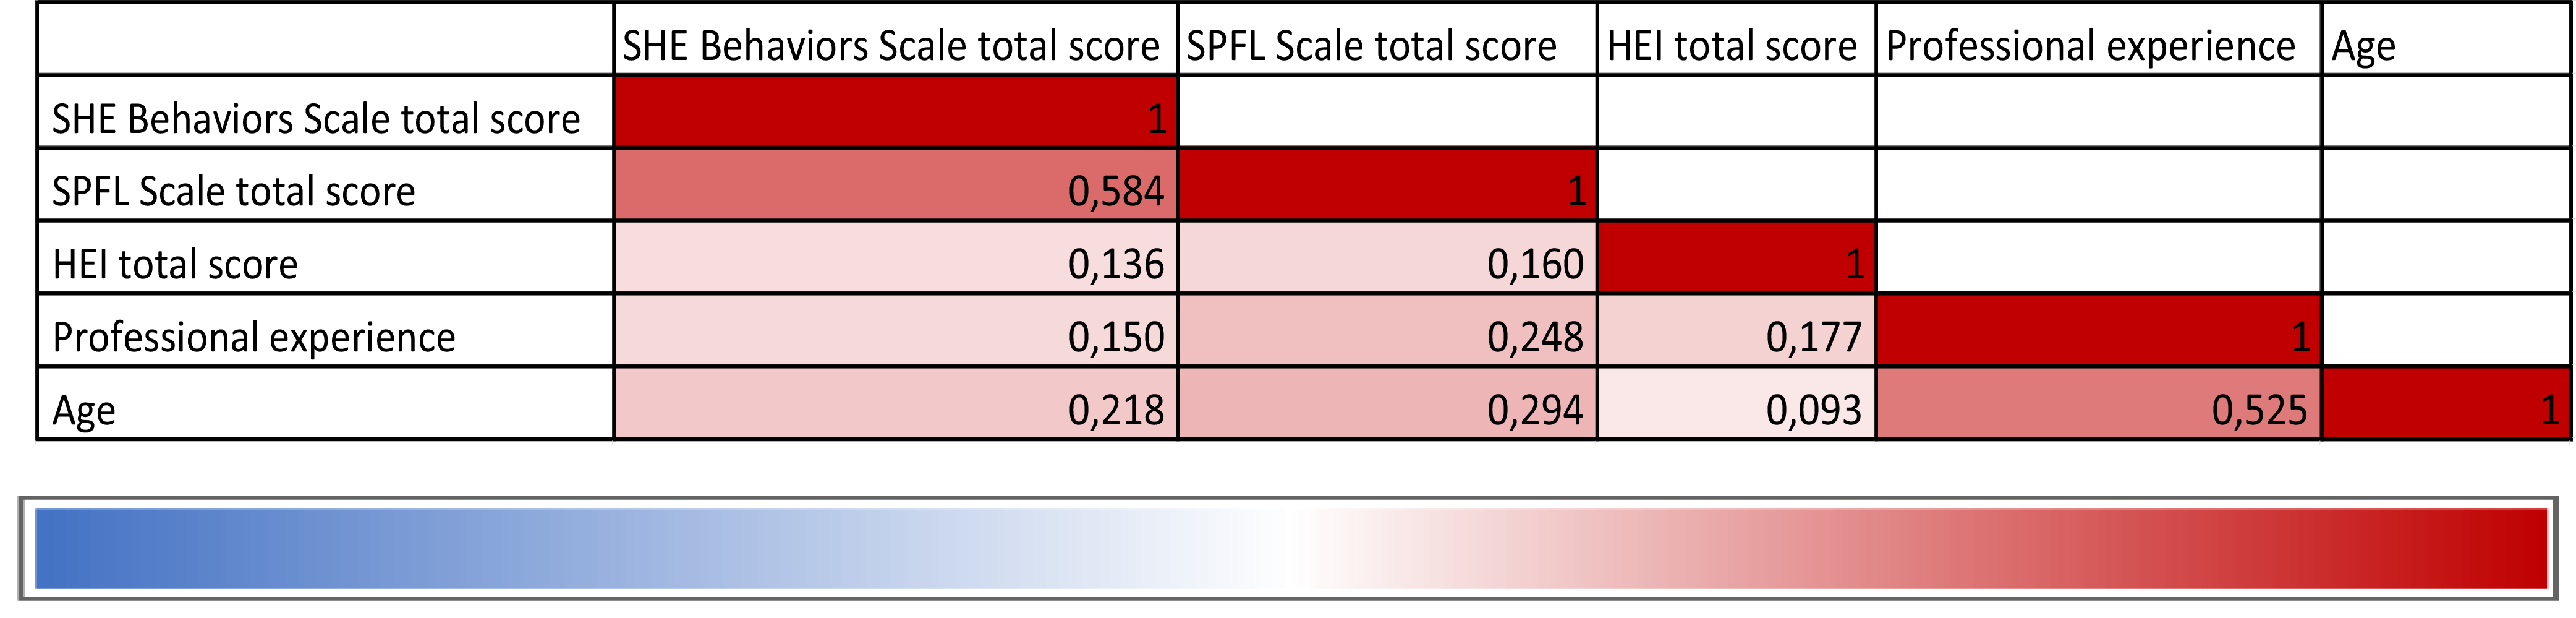
Table 4 shows the multiple regression analysis predicting the SHE Behaviors Scale and SPFL Scale scores. In model 1, a one-unit increase in SPFL score was associated with a 0·037 unit increase in SHE Behavior total score (P < 0·001). In model 2, no significant relationship was found between diet quality and food literacy. Furthermore, professional experience was not identified as a significant predictor of SFPL Scale score. These findings suggest that the impact of professional experience and diet quality on food literacy is not substantial once demographic factors are accounted for (Table 4).
Multiple regression analysis predicting the SHE Behaviors Scale and SPFL Scale scores

Table 4. Long description
A table with multiple regression analysis results predicting the SHE Behaviors Scale and SPFL Scale scores. The table has four rows and five columns. The columns are labeled as Variables, Adjusted B, t, P, and 95 percent CI. The rows are labeled as Model 1 SPFL Scale total score, Model 2 HEI total score, and Occupational experience (year). The values in the table are as follows: Row 1: Model 1 SPFL Scale total score, Adjusted B 0.037, t 9.108, P less than 0.001, 95 percent CI Lower bound 0.029, Upper bound 0.045. Row 2: Model 2 HEI total score, Adjusted B 0.169, t 1.724, P 0.087, 95 percent CI Lower bound -0.025, Upper bound 0.363. Row 3: Occupational experience (year), Adjusted B 0.125, t 0.800, P 0.425, 95 percent CI Lower bound -0.184, Upper bound 0.435.
SHE, Sustainable and Healthy Eating; SPFL, Self-Perceived Food Literacy; B, unstandardised regression coefficient; HEI, Healthy Eating Index.
Model 1: Dependent variable: SHE Behaviors Scale Total Score. R2 = 0·354 (adjusted B represents regression coefficients adjusted for age and education level).
Model 2: Dependent variable: SPFL Scale Total Score. R2 = 0·124 (adjusted B represents regression coefficients adjusted for age and education level).
Statistically significant P values are shown in bold.
Discussion
There are limited studies in the literature that evaluate sustainable and healthy nutrition and food literacy among personnel working in food service systems. Evaluating the attitudes and behaviours of institutional food service staff personnel is related to sustainability practices and public health(Reference Reinders, Battjes-Fries and Bouwman29). This study evaluates the food literacy, sustainable and healthy eating behaviours and dietary quality of institutional food service personnel to fill this gap in the literature. The key findings of the study indicate that higher levels of food literacy correlate with improved scores in sustainable and healthy eating behaviours. Additionally, a positive association exists between diet quality scores and levels of food literacy.
It is stated that food literacy must be ensured at a sufficient level for individuals to engage in healthy eating(Reference Krause, Sommerhalder and Beer-Borst43). Food literacy is important in transforming food systems towards healthy and sustainable nutrition(Reference Ares, De Rosso and Mueller44). One of the important findings of this study is that there is a statistically significant moderate positive correlation between the SHE Behavior Scale score and the SPFL Scale score among institutional food service staff (r: 0·584, P < 0·001). This result shows that higher levels of food literacy are related to more sustainability-based behaviours. Supporting the results of the current study, a study conducted by Mortaş et al. (Reference Mortaş, Navruz-Varlı and Çıtar-Dazıroğlu45) with young adults showed a significant relationship between the total score on the Food and Nutrition Literacy Scale (FNLI) and the score on the SHE Behavior Scale (r: 0·507, P < 0·001). A different study conducted on adults found a significant positive correlation between individuals’ total e-Healthy Nutrition Literacy scores and their SHE Behavior Scale factors scores(Reference Yeşildemir46). In a different study involving 395 university students, it was found that SPFL factors such as examining label, healthy snack types, healthy food availability and resistance positively influenced ecological eating behaviour(Reference Lee, Kim and Jung47). In light of these findings, increasing food literacy levels can be considered a fundamental strategy for promoting sustainable and healthy eating behaviours. It can be said that, to raise awareness among institutional food service staff about sustainable and healthy eating habits, it is first necessary to assess their level of food literacy.
In addition, high levels of food literacy are associated with high-diet quality. There are a limited number of studies evaluating the relationship between food literacy levels and healthy eating behaviours among institutional food service staff(Reference Murakami, Shinozaki and Livingstone48). The study found a statistically significant but weak positive association between food literacy and diet quality (r: 0·160, P < 0·05) which suggests that this has limited practical benefit. This suggests that the association is statistically detectable, but the effect size is small and should be interpreted with caution in practical significance. Similarly, a study conducted with the participation of kitchen staff working in restaurants found that an increase in the nutritional literacy levels of employees significantly increased their confidence in making healthy eating decisions by four times (OR = 4·148, P < 0·001)(Reference Addison-Akotoye, Adongo and Amenumey49). In a different study conducted with adults, a significant positive correlation was reported between the food literacy questionnaire score, which was created through a literature review, and the Diet Quality Index score, which assesses diet quality (P < 0·001)(Reference Park, Park and Park9). However, these studies differed from the present study in terms of study populations, measurement tools and outcome variables; therefore, direct comparisons should be interpreted cautiously. Nevertheless, higher levels of food literacy may still contribute to healthier dietary behaviours and better diet quality among institutional food service workers.
In the current study, no individuals were found to have good diet quality when their diet quality was assessed. Of those with poor diet quality, 73·2 % were support staff. The fact that the food literacy scores of support staff were significantly lower than those of production staff and that there was a positive relationship between food literacy and diet quality confirms this finding. In this study, the mean HEI score for production personnel was 50·92 (sd 11·38) and 50·16 (sd 11·77) for support staff. The mean HEI scores of food service staff were found to be lower than those in previous studies, where the majority of participants were university graduates(Reference Adjoian, Firestone and Eisenhower50,Reference Kaya51) . The educational level of the staff in this study is low compared with studies where educational levels were compared, with 67·1 % having a high school education and 11·6 % having a university degree(Reference Fideles, Akutsu and Costa52). In this context, it can be said that educational level may affect diet quality. It is thought that a high educational level may play a role in individuals making more conscious choices regarding healthy eating behaviours.
This study found that food literacy levels increased significantly with increasing occupational experience (r: 0·248, P < 0·001). Although a significant correlation was observed between professional experience and nutrition literacy, this effect disappeared after age and education were taken into account in the regression models. This situation suggests that the apparent bivariate relationship may reflect underlying demographic factors rather than a direct effect of professional experience. Also, the total SPFL score of production personnel was significantly higher than that of support personnel (P < 0·05). The percentage of production personnel with more than 20 years of experience in the occupation is higher than that of support personnel. Similarly, in a study involving school cafeteria staff, those with more than 10 years of experience had significantly higher nutrition knowledge scores than those with less than 10 years of experience(Reference Lee and Ryu53). A study conducted with staff participation at a childcare centre indicated that the staff’s food literacy levels were moderate to high and that courses on food preparation skills could effectively improve the staff’s food literacy levels(Reference Morseth, Henjum and Terragni54). These findings may indicate that working in food services for many years and being involved in the food supply and production process is associated with an increase in the level of food literacy.
In institutional food service systems, production personnel have the potential to influence consumers’ food preferences and play a significant role in the adoption of sustainable eating behaviours. Cooks play a key role in food procurement, preparation and cooking processes. The decisions and practices they adopt in line with sustainability in these processes can change the environmental impact of food(Reference Rideout55). This study found that the seasonal foods and avoiding food waste scores were significantly higher among production personnel than among support personnel (P < 0·05). No significant differences were found between the two groups for the other scale factors and total scores. Different studies evaluating cooks’ sustainability preferences in the kitchen found that taste, cost and convenience were prioritised over sustainability activities among cooks(Reference Curtis and Cowee56,Reference Inwood, Sharp and Moore57) . It is stated that the professional competence of kitchen staff is significant in implementing sustainability practices(Reference Lu and Ko58). In this study, the preference for seasonal foods directly related to the purchasing, preparation and waste management processes and the high tendency to avoid food waste among production personnel may be due to their leading role in kitchen processes. In this sense, the awareness of support staff in this area should also be increased. It is reported that raising the environmental awareness of staff in food services through education will be beneficial in terms of preventing food waste and implementing sustainability practices in the meal preparation process(Reference Lu and Ko58).
At the same time, in this study, the total SPFL Scale score of production personnel was significantly higher than that of support personnel (P < 0·05). Different studies have found that cooks have a positive attitude towards choosing foods that promote healthy eating. However, this attitude is not reflected in their healthy eating knowledge scores or in preparing healthy foods(Reference Friesen, Altman and Kain59,Reference Lessa, Cortes and Frigola60) . Unlike previous research, this study found that cooks’ views towards healthy eating are reflected in their food literacy scores.
In the study, the median score for the production personnel’s food preparation skills factor was significantly higher than that of support staff (P < 0·001). This finding is expected since production personnel are responsible for the food preparation.
In light of all these findings, it is believed that providing training to food service staff on food literacy and sustainable nutrition is important for improving health in our country and in developing countries.
Strengths
This study is particularly valuable because it examines food literacy, sustainable and healthy eating, diet quality and body composition in institutional food service staff at institutions and then analyses how these factors relate to each other. This approach is a key strength of the research, especially since similar studies are rare. The incorporation of food service staff from the kitchens and dining halls, which cater to both hospital and university staff and students, is essential for assessing food service staff across various services within the sample. The comprehensive evaluation of individuals across several roles (cook, assistant cook, waiter, dishwasher and cleaner) about their sustainable and healthy eating practices, food literacy, dietary quality and body composition is a significant strength of the study. We deem this work essential as a preliminary example for future study.
Limitations
This study has several limitations. First, due to the cross-sectional design, causal relationships cannot be established. Second, the data were based on self-reports. In addition, the possibility of selection bias should be considered, as not all institutional food service staff could be included due to their working schedules. In addition, the study was carried out in a single location and included only institutional food service professionals working in the kitchens and dining halls related to Gazi University, which may restrict the generalisability of the findings to different demographics and food service contexts. Future studies including larger sample sizes from multiple centres are needed to strengthen the evidence in this field.
Conclusion
As a result, this study found a moderate significant positive correlation between the SHE Behavior Scale score and the SPFL Scale score among institutional food service staff and a weak significant positive relationships between the HEI score and the SPFL score. There are no participants with good diet quality among food service staff. In this context, it would be beneficial to increase the food literacy levels of food service staff in order to adopt behaviours related to sustainable and healthy nutrition and improve diet quality. In-service training programmes for both production staff and support staff working in institutions and organisations providing food service staff should include topics such as food literacy and sustainable and healthy nutrition, and these trainings should be conducted at regular intervals.
The government and relevant organisations should develop programmes, policies and strategies to raise awareness about sustainable and healthy nutrition and improve public health. There are insufficient studies in the literature evaluating sustainable nutrition, food literacy and diet quality among food service staff, and more research should be conducted in this area.
Acknowledgements
The authors do not wish to acknowledge anyone in particular for this work.
This research received no specific grant from any funding agency, commercial or not-for-profit sectors.
N. T.: Conceptualisation-Equal, Data curation-Equal, Formal analysis-Equal, Investigation-Equal, Methodology-Equal and Writing – original draft-Equal; F. A.: Methodology-Equal, Supervision-Equal, Validation-Equal and Writing – review and editing-Equal.
The authors declare no conflicts of interest.
The study protocol was approved by the Ethics Committee of Ankara Gazi University (13 February 2024, Research code no: 2024-238).
The authors confirm that the data will be made available on reasonable request.


 Open access

