



Introduction
Microwave resonant sensors constitute a research topic that has experienced significant growth in recent years. In particular, many efforts have been (and are being) dedicated to the development of planar resonant sensors. The main reason is the low profile and low cost of such sensors, including the possibility to implement flexible or conformal devices, of interest in many sensing applications. Moreover, electrically small planar resonators are, in general, very sensitive to the properties of their surrounding medium; consequently, planar sensors based on electrically small resonators are key candidates for the measurement of variables requiring high sensitivity. Typical electrically small resonators of interest for highly sensitive measurements include the split ring resonator (SRR) [Reference Pendry, Holden, Robbins and Stewart1], the complementary split ring resonator (CSRR) [Reference Falcone, Lopetegi, Laso, Baena, Bonache, Marqués, Martín and Sorolla2, Reference Falcone, Lopetegi, Baena, Marqués, Martín and Sorolla3], the open split ring resonator (OSRR) [Reference Martel, Marqués, Falcone, Baena, Medina, Martín and Sorolla4], the open complementary split ring resonator (OCSRR) [Reference Velez, Aznar, Bonache, Velázquez-Ahumada, Martel and Martín5], the electric LC resonator (ELC) [Reference Schurig, Mock and Smith6], the S-shaped split ring resonator (S-SRR) [Reference Chen, Ran, Huang-Fu, Zhang, Cheng, Grzegorczyk and Kong7], the step impedance shunt stub [Reference Naqui, Durán-Sindreu, Bonache and Martín8], etc.
Frequency variation is the most common sensing mechanism in resonant sensors [Reference Mandel, Kubina, Schüßler and Jakoby9–Reference Jha, Delmonte, Lamecki, Mrozowski and Bozzi18]. The output variable in such sensors is the resonance frequency (and eventually the peak, or notch, magnitude), determined by the properties of the surrounding medium. Frequency variation sensors have been applied to the measurement of displacements and velocities [Reference Mandel, Kubina, Schüßler and Jakoby9, Reference Jha, Delmonte, Lamecki, Mrozowski and Bozzi18], but this type of sensors is of special interest for the dielectric characterization of solids and liquids [Reference Puentes, Weiß, Schüßler and Jakoby10–Reference Su, Mata-Contreras, Vélez, Fernández-Prieto and Marntín17]. Typically, these sensors require calibration and are subjected to cross sensitivities, caused, e.g., by changing environmental factors, such as temperature or humidity. To alleviate this limitation, sensors based on symmetry properties have been proposed [Reference Naqui, Durán-Sindreu and Martín19–Reference Naqui21], as far as symmetry is invariant under variations in ambient conditions, at least at the scale of the sensing resonant elements. Among the sensors based on symmetry properties, we can distinguish between coupling modulation sensors [Reference Naqui, Durán-Sindreu and Martín19, Reference Naqui, Durán-Sindreu and Martín22–Reference Naqui, Coromina, Karami-Horestani, Fumeaux and Martín29], frequency splitting sensors [Reference Horestani, Naqui, Shaterian, Abbott, Fumeaux and Martín30–Reference Vélez, Su, Grenier, Mata-Contreras, Dubuc and Martín36], and differential-mode sensors [Reference Damm, Schussler, Puentes, Maune, Maasch and Jakoby37–Reference Muñoz-Enano, Vélez, Mata-Contreras, Gil, Dubuc, Grenier and Martín48].
Coupling modulation sensors consist of a transmission line loaded with a symmetric resonator, symmetrically loading the line. The combination of line and resonant element should not be arbitrary. Namely, these elements must exhibit symmetry planes of different electromagnetic nature, i.e., one a magnetic wall and the other one an electric wall [Reference Martín20, Reference Naqui21]. For instance, a microstrip line loaded with a SRR working at the first resonance frequency satisfies the previous requirement, as far as the symmetry plane of the line is a magnetic wall, whereas the symmetry plane of the SRR (at the fundamental resonance) is an electric wall. Under these conditions, line-to-resonator coupling is prevented, and the structure is transparent to signal propagation. However, if symmetry is disrupted, e.g., by means of a lateral displacement or rotation, or by means of an asymmetric dielectric loading, line-to-resonator coupling arises, and a notch in the transmission coefficient, useful for sensing purposes, appears. Most of these sensors have been applied to measure linear and angular displacements and velocities [Reference Naqui, Durán-Sindreu and Martín19, Reference Naqui, Durán-Sindreu and Martín22–Reference Naqui, Coromina, Karami-Horestani, Fumeaux and Martín29].
In frequency splitting sensors, a pair of resonant elements (not necessarily symmetric) are used. The sensors are implemented by means of a transmission line symmetrically loaded with the pair of resonators, coupled (or connected) to the line. Under these circumstances, a single notch in the transmission coefficient (at the fundamental resonance frequency) arises. However, by truncating symmetry, two notches appear, and the frequency difference between them is related to the level of asymmetry. Therefore, these structures are also useful for sensing, and they have been mainly applied to dielectric characterization [Reference Su, Mata-Contreras, Naqui and Martín34–Reference Vélez, Su, Grenier, Mata-Contreras, Dubuc and Martín36].
Although the previous frequency splitting sensors use two resonators for sensing, they cannot be considered true differential sensors. In differential-mode sensors, two independent sensing structures are used, one for the reference (REF) measurand, or REF sample, or REF material, and the other one for the measurand (material or sample) under test (MUT). There are many examples of differential sensors, and most of them are applied to dielectric characterization [Reference Damm, Schussler, Puentes, Maune, Maasch and Jakoby37–Reference Muñoz-Enano, Vélez, Mata-Contreras, Gil, Dubuc, Grenier and Martín48]. The differential dielectric constant, i.e., the difference in the dielectric constant between the REF and MUT samples can be inferred from the phase difference of a pair of meandered lines, related to the difference in their respective phase velocities caused by dielectric loading [Reference Ferrández-Pastor, García-Chamizo and Nieto-Hidalgo39, Reference Muñoz-Enano, Vélez, Gil and Martín44]. Alternatively, differential permittivity sensors based on a pair of lines loaded with resonant elements have been considered [Reference Vélez, Grenier, Mata-Contreras, Dubuc and Martín40–Reference Vélez, Muñoz-Enano, Grenier, Mata-Contreras, Dubuc and Martín42, Reference Muñoz-Enano, Vélez, Gil and Martín44, Reference Vélez, Muñoz-Enano and Martín45]. The difference in the transmission coefficient of both lines (the output variable) can be inferred from the cross-mode transmission coefficient (provided the two lines are uncoupled) [Reference Vélez, Grenier, Mata-Contreras, Dubuc and Martín40, Reference Vélez, Muñoz-Enano, Grenier, Mata-Contreras, Dubuc and Martín42]. In a recent paper [Reference Muñoz-Enano, Vélez, Gil, Mata-Contreras and Martín47], it was demonstrated that such cross-mode transmission coefficient can be inferred from a two-port structure consisting of a pair of rat-race hybrid couplers conveniently connected to the differential sensor. Moreover, it was demonstrated in that paper that by conveniently loading the isolated ports of the rat-race coupler, the sensitivity can be enhanced.
In [Reference Damm, Schussler, Puentes, Maune, Maasch and Jakoby37–Reference Muñoz-Enano, Vélez, Gil, Mata-Contreras and Martín47], differential sensing is based on measuring the transmission coefficient of both sensing elements, either through a 4-port measurement focused on obtaining the cross-mode transmission coefficient, or by means of the abovementioned two-port circuit, with the four-port differential sensor sandwiched between the pair of rat-race couplers. In this paper, we consider another approach, based on measuring the reflection coefficients of a pair of sensing elements. Such sensing elements are OSRRs (used in [Reference Muñoz-Enano, Vélez, Mata-Contreras, Gil, Dubuc, Grenier and Martín48] for differential-mode transmission-based sensors). Other reflective-mode sensors have been reported in the literature [Reference Ebrahimi, Scott and Ghorbani41]. However, in this paper, the output variable (i.e., the differential reflection coefficient between the sensing loads) is inferred by connecting the pair of sensing loads to the coupled ports of a rat-race coupler. The transmission coefficient of the resulting two-port structure is proportional to the differential reflection coefficient, as it will be shown, thereby providing a simple way of obtaining the output variable. As compared to the work [Reference Muñoz-Enano, Vélez, Gil, Mata-Contreras and Martín47], the complete circuit is very simple since a single rat-race coupler is used in the sensor presented in this work.
The proposed sensor, working principle, and modeling
Figure 1 depicts the topology of the proposed sensor. The sensing elements are two identical (OSRRs grounded by one of their extremes, and connected to the isolated ports of a rat-race hybrid coupler by the other termination. The resulting structure is a two-port device, where the input signal is injected to the Δ-port of the coupler and the output signal is collected at the isolated port (Σ-port). In practice, in order to avoid interfering the functionality of the rat-race coupler, the sensing regions on top of the OSRRs must be separated from the isolated ports of the rat-race. Consequently, transmission line sections between the sensing elements (OSRRs) and the isolated ports of the coupler are needed, as depicted in Fig. 1. If the sensor is devoted to the differential measurement of liquids properties, then fluidic channels, not included in Fig. 1, should be added on top of the OSRR sensitive regions.
Topology of the proposed reflective-mode differential sensor.
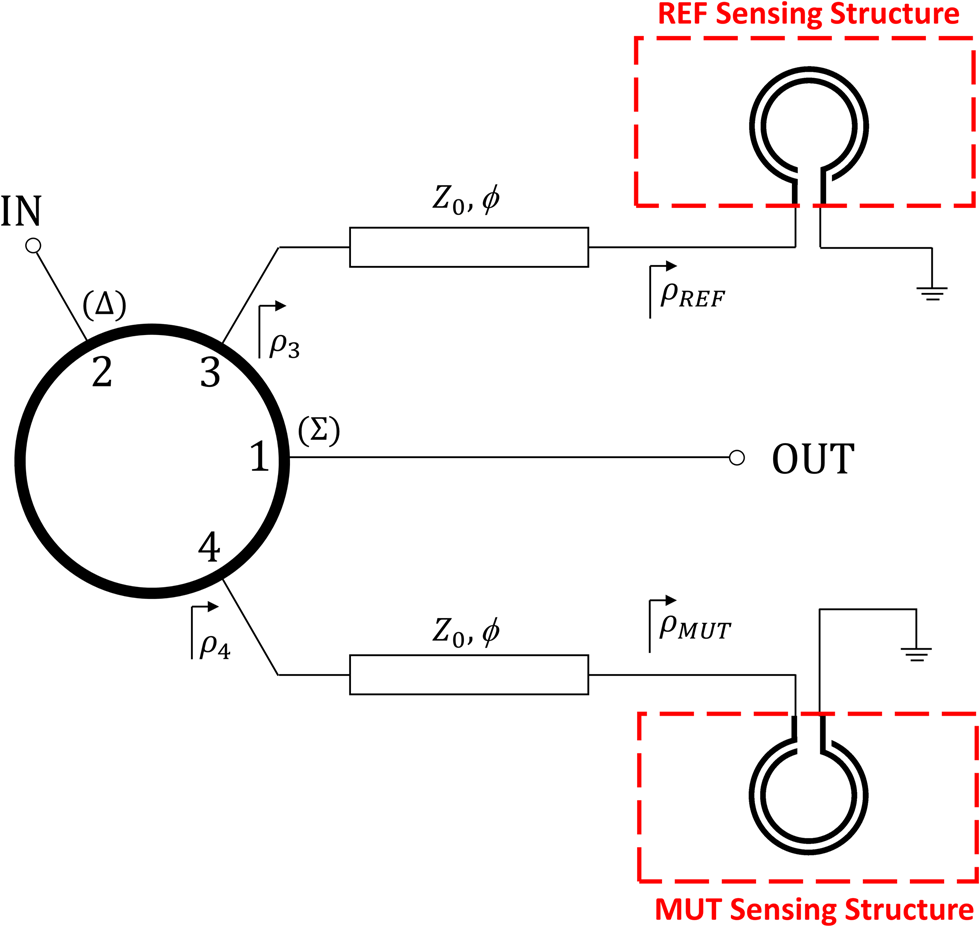
Let us call ρ3 and ρ4 to the reflection coefficients seen from ports 3 and 4 of the coupler (isolated ports), see Fig. 1. The transmission coefficient between the input and the output port of the structure, at the operating frequency, f 0, of the coupler, is given by

i.e., it is proportional to the differential reflection coefficient between both sensing loads. If we consider that the characteristic impedance of the transmission line sections between the OSRRs and the isolated ports of the coupler is identical to the reference impedance of the ports (i.e., Z 0 = 50 Ω), such lines do not modify the magnitude of the reflection coefficients ρREF and ρMUT. The presence of such identical lines merely introduces a phase factor in the reflection coefficients given by 2ϕ, where ϕ is the electrical length of the line sections at f 0. Thus, the transmission coefficient (1) can be expressed as

where ρREF and ρMUT is the reflection coefficient seen from the input termination of the OSRR corresponding to the REF and MUT samples, respectively.
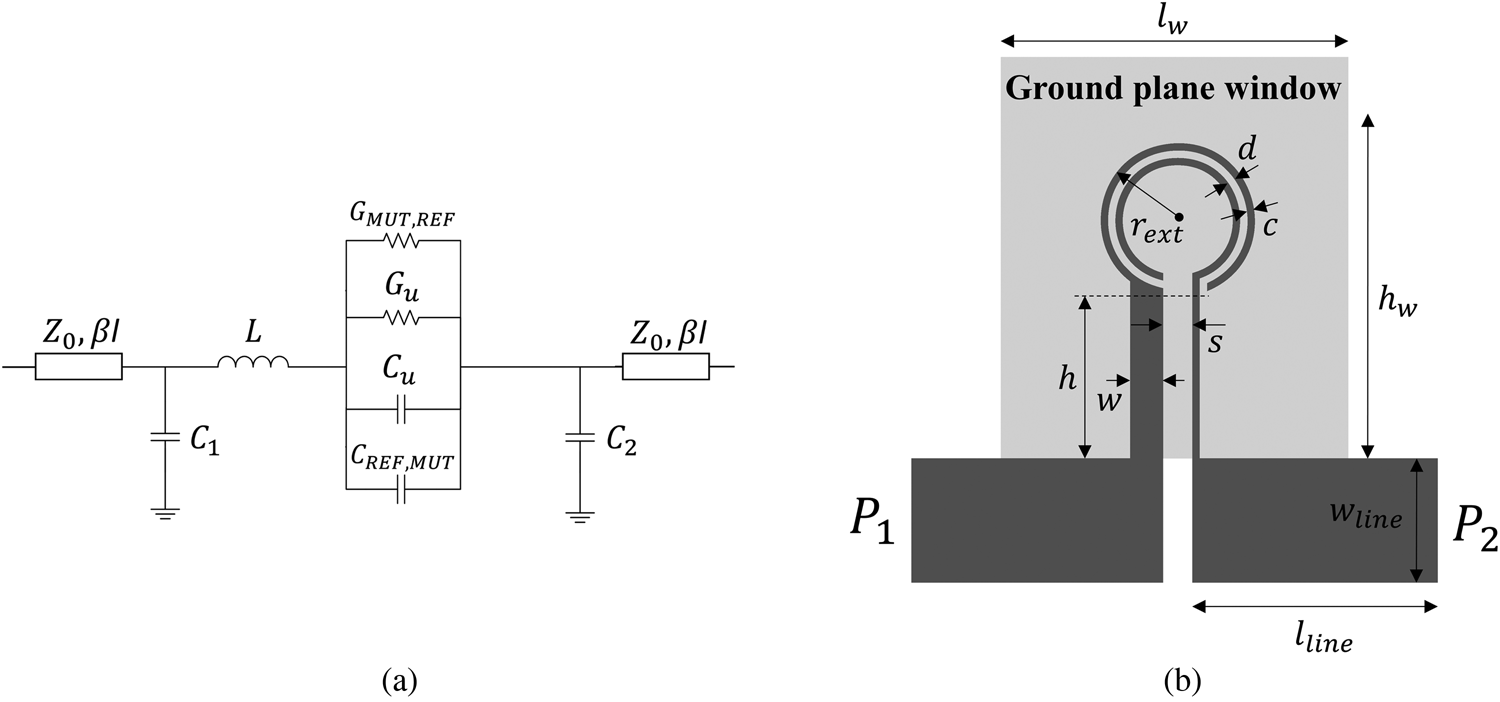
An accurate circuit model of the OSRRs is depicted in Fig. 2(a). In such model, L, Cu, and Gu account for the inductance, capacitance, and conductance, respectively, of the bare (i.e., unloaded) resonator. The presence of the REF and MUT samples on top of their respective OSRRs is taken into account by means of the capacitances CREF and CMUT, and by means of the conductances GREF and GMUT. In [Reference Muñoz-Enano, Vélez, Mata-Contreras, Gil, Dubuc, Grenier and Martín48], the capacitors C 1 and C 2 were not considered. These capacitances have a small effect on the transmission coefficient, as it was demonstrated in [Reference Muñoz-Enano, Vélez, Mata-Contreras, Gil, Dubuc, Grenier and Martín48]. However, for an accurate prediction of the reflection coefficient, these capacitors should be included, as reported in [Reference Durán-Sindreu, Vélez, Aznar, Sisó, Bonache and Martín49]. To validate the model, we have considered an unloaded OSRR with the topology and substrate parameters indicated in Fig. 2. The frequency response (transmission and reflection coefficients), inferred by electromagnetic simulation using Keysight Momentum, is depicted in Fig. 3. Using this response, we have extracted the parameters of the circuit model according to the method indicated in [Reference Martín20] (see the values in the caption of Fig. 3). The response inferred from circuit simulation, using the schematic simulator of the Keysight ADS software package, is also depicted in Fig. 2, where it can be appreciated the good agreement with the electromagnetic simulation up to frequencies beyond the OSRR resonance.
Circuit model of the pair of sensing loads (loaded OSRRs) (a) and specific topology used to validate the circuit model (b). Dimensions are (in mm): rext = 2.1, d = c = 0.2, s = 0.8, w = 0.9, h = 4.4, lline = 30 and wline = 3.4. Dimensions of the ground plane window are (in mm) lw = 8.2 and hw = 10.8. The considered substrate is the Rogers RO4003C with thickness h = 1.524 mm, dielectric constant ɛr = 3.55 and loss tangent tanδ = 0.0022.
Response of the OSRR of Fig. 2. (a) Reflection coefficient; (b) transmission coefficient. The extracted parameters of the bare OSRR are Cu = 0.424 pF, L = 9.228 nH, Gu = 0.124 mS, C 1 = 0.429 pF, C 2 = 0.625 pF, Z 0 = 50 Ω and ßl = 118.7°.
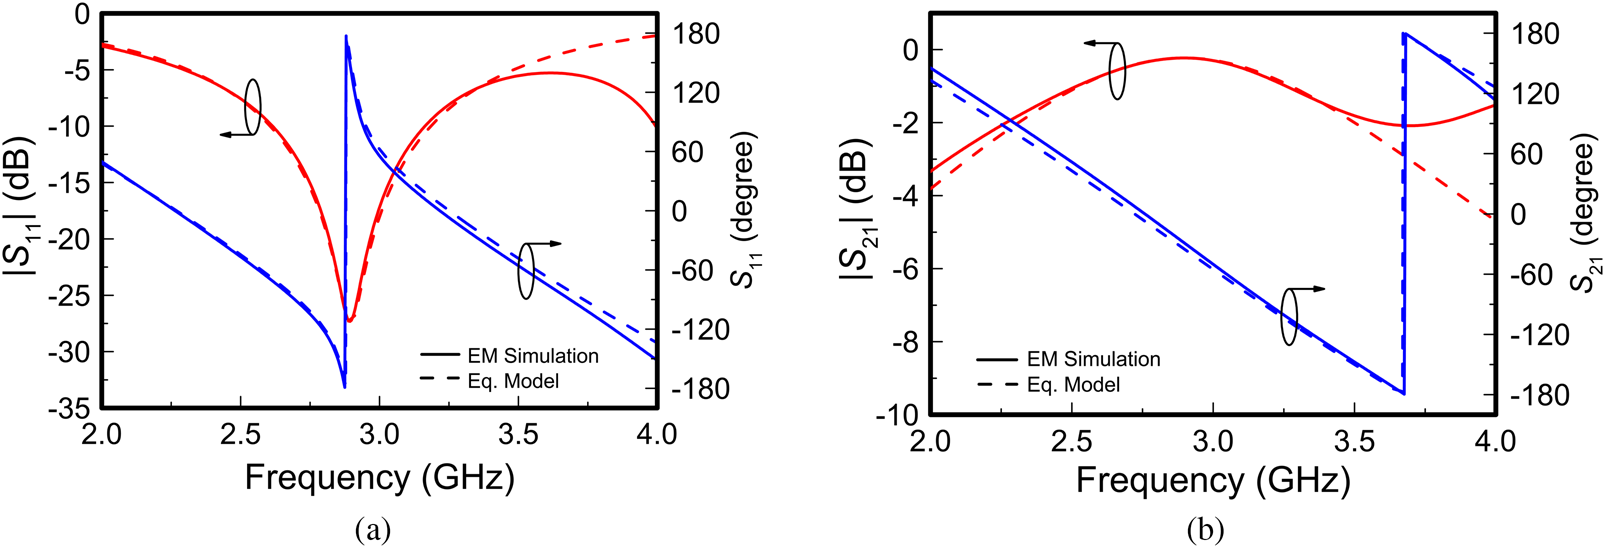
The results of Fig. 2 validate the proposed model. However, such a model is complex for analysis purposes. The interest is to carry out an analysis useful to determine the effects of the OSRR circuit parameters (mainly L and Cu) on device sensitivity, the fundamental performance parameter of any sensor. For this main reason, we will neglect the capacitances C 1 and C 2 in the following analysis.
Analysis
The subject of the analysis is thus the grounded OSRR (Fig. 1). Note that by grounding the OSRR, the effect of C 2 is indeed eradicated. As for C 1, though this capacitance is necessary to accurately predicting the behavior of the OSRR, we will neglect it in order to ease the analysis, as mentioned in the preceding paragraph; however, the main conclusions inferred from the analysis will be verified by numerical calculation and simulation of the full circuit model.
We would like to mention that the analytical calculation of ρREF and ρMUT (and hence S 12, the output variable) from the circuit model of the OSRRs by excluding C 1 (or even by including it) is feasible. However, in order to conclude what is the convenient strategy for sensitivity optimization, the resulting expressions are cumbersome. Thus, we have opted to proceed following a different approach. Such approach consists of calculating the real and the imaginary parts of the input impedance of the OSRR at the operating frequency, and then separately consider the effects of varying the OSRR conductance, G = Gu + GREF, maintaining the value of the capacitance C = Cu + CREF, and vice versa. It should be clarified at this point that by variation in either G or C we actually refer to the difference in the conductance or capacitance between the REF and SUT samples, i.e., ΔG = GREF − GMUT and ΔC = CREF − CMUT. The first case obeys, e.g., to a variation of electrolyte content (solute) in a liquid such as DI water (solvent and REF sample), where the main effect is the modification of the conductivity of the solution (MUT) and hence the conductance. At small electrolyte concentrations, the dielectric constant of the solution does not experience significant variations by varying the solute content (this justifies the invariability of C in this case). The second case (variation in C maintaining G unaltered) is more difficult to identify with a real scenario, despite the fact that in many cases low-loss samples are considered, where the conductance G can be neglected. Certainly, in most studies of differential sensing of material properties or composition, both the dielectric constant and the loss factor of the MUT, as compared to the REF sample, simultaneously vary, and, consequently, C and G do too. However, if the strategy for sensitivity optimization coincides for the two considered cases, we can extrapolate it for the general case of varying C and G.
Let us consider that the output variable is the modulus of the transmission coefficient, proportional to |ρ REF − ρMUT|. The sensitivity with ΔG or ΔC is defined as


and to enhance the sensitivity, it is necessary to achieve the maxim possible variation in the reflection coefficients between the REF and MUT samples, for a given value of the differential conductance ΔG or capacitance ΔC. This is equivalent to maximize the variation in both the real and the imaginary parts of the impedance. Let us then consider both cited cases separately.
Variation in G, constant C
Let us first consider that the capacitance associated with the REF and MUT samples is identical and that the operating (angular) frequency is ω 0 = ωREF = (LC)−1/2. The impedance of the OSRR is

At ω = ω 0, the impedance can be expressed (separating the real and imaginary parts) as

Let us now analyze the effects of varying G on the real and the imaginary parts of the above impedance. For that purpose, the derivative with respect to G is obtained, i.e.,


Inspection of 6(a) reveals that the real part of the impedance exhibits a maximum for G = (C/L)1/2, where the value of the real part of the impedance at the operating frequency is ½[(L/C)1/2]. For small values of G as compared to (C/L)1/2, the usual situation is moderate and low-loss materials (the case of interest in this paper), the derivative increases with L/C. This means that increasing the ratio L/C (the product is fixed by the value of ω 0) has the effect of enhancing the variation of the real part of the impedance of the OSRR when G varies, and this favors sensitivity. Concerning the imaginary part (6b), it is a monotonically increasing function with G, with${\rm \;Im}\lcub Z_{\omega_0 }\rcub = 0$ for G = 0, and ${\rm \;Im}\lcub Z_{\omega_0 }\rcub = L\omega_0$
 for G → ∞. Nevertheless, the range of G of interest is G << (C/L)1/2, where the derivative increases with the ratio L/C. Therefore, from this simple analysis, it is clear that in order to enhance the sensitivity of the output variable with G (considering C constant), it is necessary to increase the ratio L/C as much as possible.
Variation in C, constant G
In this case, the impedance of the OSRR at ω = ω 0 is

Note that, in (7), C is the variable, and only for C = Cu + CREF ≡ C 0, the term LCω 02 = 1. Also, note that if ω 0 is set to a certain value, the real part of the impedance does not depend on the ratio L/C 0. Such a real part is a monotonically decreasing function with C, where ${\rm \;Re}\lcub Z_{\omega_0 }\rcub = 1/G$ for C = 0, ${\rm \;Re}\lcub Z_{\omega_0 }\rcub = 0$
 for C → ∞, and ${\rm \;Re}\lcub Z_{\omega_0 }\rcub = G/\lpar {G^2 + \lpar C_0/L\rpar } \rpar \;$
 for C = C 0. Let us now analyze the effects of varying C in the vicinity of C 0 on the imaginary part of the impedance. The derivative with C is

and the value at C = C 0, the point of interest, is found to be

For G << (C/L)1/2, the derivative is positive and it increases with the ratio L/C 0. Thus, we obtain the same conclusion as in case A. Increasing the ratio L/C 0 produces a larger variation of the imaginary part of the impedance by varying C, larger variation in the reflection coefficient, and, therefore, in the sensitivity.
It is interesting to note that if G ≠ 0, the capacitance that nulls the imaginary part of the impedance at ω 0 is no longer C 0, but

as it is inferred by forcing the numerator of the imaginary part of (7) to be zero. Indeed, there are two solutions for the capacitance, one of them very close to C = C 0 (provided G is very small), and the other one very close to C = 0. It is also interesting to comment that for the ideal situation of G → 0 (lossless case), it is very simple to justify that the sensitivity increases with the ratio L/C 0. The reason is as follows: at ω 0, the impedance seen from the input port of the OSRR is a short-circuit; consequently, the reflection coefficient is (ideally) −1. Since the modulus of the reflection coefficient is always 1 (due to the lack of losses), enhancing the sensitivity requires that the OSRR reactance at ω 0 changes as much as possible by varying C. For that purpose, a peaked (i.e., narrow) reactance in the vicinity of ω 0 is needed, and this is achieved if L/C 0 is large.
Validation
According to the previous analysis, it can be concluded that the OSRR must be chosen with the largest possible ratio between its inductance and its capacitance (although geometrical constraints limit, in practice, such ratio). Nevertheless, the analysis has been carried out by simplifying the circuit model of the OSRR, i.e., by neglecting C 1 (the effects of C 2 are null since this capacitance is short-circuited to the ground). Therefore, validation by considering the complete circuit model is necessary. For that purpose, we have considered the circuit parameters of the OSRR topology of Fig. 2, extracted from the electromagnetic simulation of the frequency response, and indicated in the caption of Fig. 3. We have considered two different scenarios. In one case, we have modified the conductance of the MUT OSRR, leaving unaltered the one of the REF OSRR. In the other case, the variation corresponds to the capacitance. The idea in both cases has been to obtain the output variable of the sensor, |S 12|, by considering the ratio L/C 0 as a parameter. The specific procedure has been the numerical calculation of expression (2) using MATLAB. The considered phase, at f 0, of the pair of connecting lines is ϕ = 118.7°. The reflection coefficients seen from the input ports of the OSRRs are given by the well-known expressions

where the impedance of the REF OSRRs, including C 1, is

with G = Gu + GREF and C = Cu + CREF. An identical expression for the impedance of the MUT OSRR is obtained (a simple replacement of the sub-indexes REF with MUT is needed).
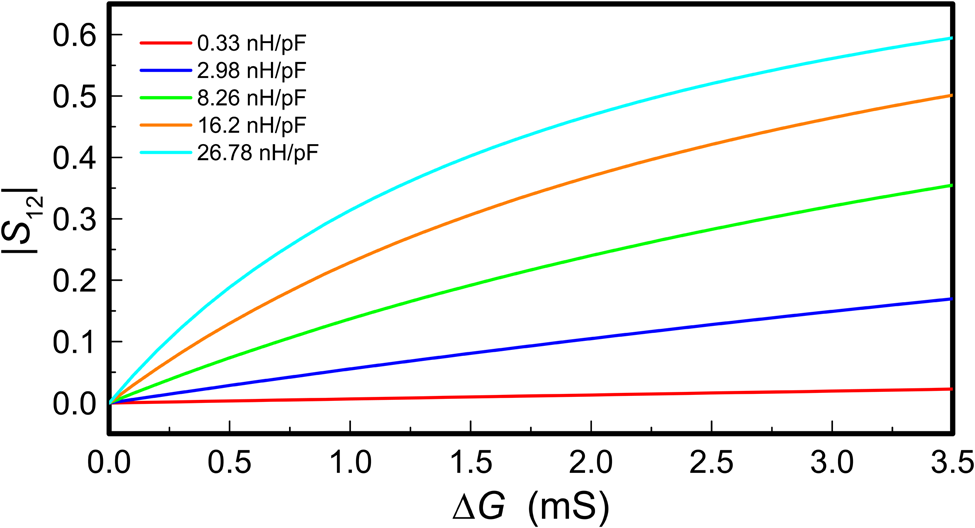
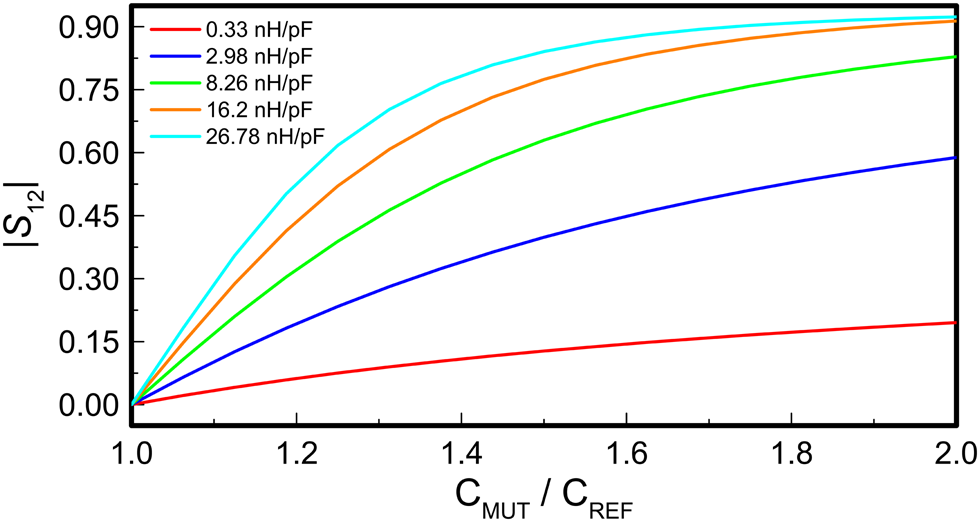
Figure 4 depicts the variation of |S 12| as a function ΔG, parametrized by L/C (where L and C must satisfy LC = ω 0−2). It is appreciated from the figure that the variation of the output variable is stronger as L/C increases, as predicted in the previous analysis based on the simplified circuit model. By considering the variation in the capacitance of the MUT sample as compared to the one of the REF sample, the effect of the ratio L/C is exactly the same (Fig. 5). Therefore, these numerical results depicted in Figs 4 and 5 confirm the previous analysis based on an approximate model of the OSRR: increasing the ratio L/C has the effect of optimizing the sensitivity of the sensor. With this concluding remark in mind, we have designed the sensing OSRRs of the reported sensing structure, to be discussed in the next section.
Variation of |S 12| with ΔG at f0 = 2.894 GHz for different values of L/C.
Variation of |S 12| at f0 = 2.894 GHz with the capacitance of the MUT as compared to the REF capacitance. REF and MUT conductance are identical and equal to 0.122 mS. Note that when CREF and CMUT are equal, the modulus of the cross-mode transmission coefficient is zero (perfect symmetry case).
Sensor design and fabrication
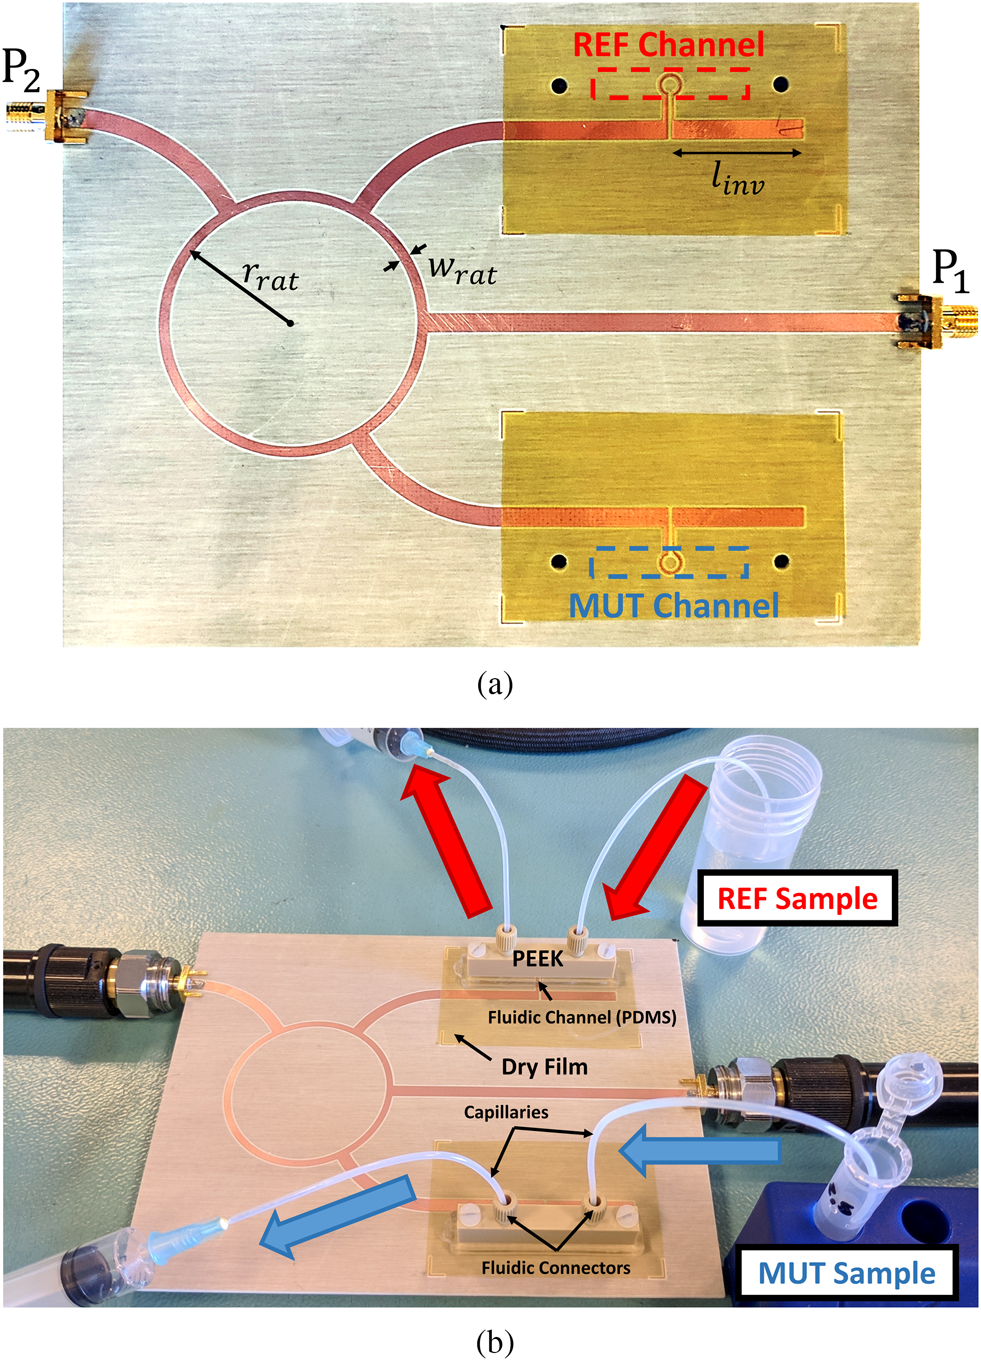
The reflective-mode differential sensor will be applied to the measurement of solute concentrations in solutions of DI water. For this reason, fluidic channels must be added on top of the OSRRs, the sensitive regions. The topology of the sensing OSRRs is indeed the one depicted in Fig. 2(b), where it can be appreciated that the arms of the OSRRs are narrow and substantially separated in order to achieve a small capacitance and a large inductance (the requirement to obtain good sensitivity). However, we have replaced the short-circuits to the ground of the OSRRs with quarter-wavelength open-ended lines (with length linv), thereby avoiding the use of vias. The photograph (top view) of the sensor by excluding the fluidic channels and mechanical accessories is depicted in Fig. 6(a), whereas Fig. 6(b) shows a perspective view of the complete differential sensor. The sensor structure, including the rat-race coupler, connecting lines, open-ended lines and access lines, have been fabricated by means of a drilling machine (LPKF-H100 model), and the considered substrate is the one indicated in the caption of Fig. 2. The fluidic channels and the necessary mechanical accessories are identical to those reported in [Reference Muñoz-Enano, Vélez, Mata-Contreras, Gil, Dubuc, Grenier and Martín48], and therefore the details are not given in the present paper, with the exception of channel dimensions, indicated in the caption of Fig. 6 for completeness. We would like to emphasize that, similar to [Reference Muñoz-Enano, Vélez, Mata-Contreras, Gil, Dubuc, Grenier and Martín48], the sensor has been protected by means of a dry film, in order to avoid liquid absorption by the substrate.
Top view of the sensor topology (a) and perspective view of the whole fabricated sensor (b). OSRR dimensions and substrate parameters are those indicated in the caption of Fig. 2. The other sensor dimensions (in mm) are linv = 23.473, wrat = 1.8474 and rrat = 23.3. Channel dimensions (in mm) are hch = 1.5 mm (height), lch = 26 mm (length), and wch = 4.6 mm (width).
The resonance frequency of the bare OSRRs is f 0 = 2.894 GHz. However, by loading the designed OSRRs with DI water, the frequency is reduced to f 0 = 1.8 GHz (nominal value inferred from electromagnetic simulation). In this study, the REF sample is DI water, and, consequently, the operating frequency of the sensor is 1.8 GHz. This frequency determines the dimensions of the rat-race coupler, as well as the dimensions of the pair of connecting lines and quarter-wavelength open-ended lines (indicated in the caption of Fig. 6).
Experimental results and comparison to other sensors
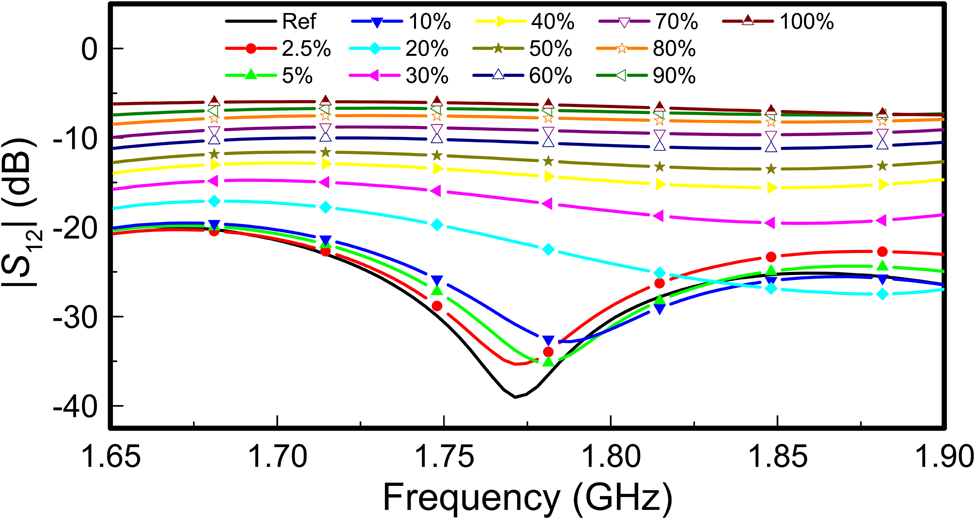
The functionality of the designed and fabricated sensor has been validated by considering solutions of isopropanol in DI water (DI water is the REF material, as indicated above). Thus, we have injected DI water in the REF channel, whereas in the MUT channel we have subsequently injected solutions of isopropanol in DI water of different concentrations, varying between 0 and 100% (pure isopropanol). The responses of the sensor for the different concentrations are depicted in Fig. 7, where the response corresponding to pure DI water in the MUT channel (indicated as REF) is also included. The measurements have been carried out by means of the Agilent N5221A PNA vector network analyzer. It can be appreciated in the figure that the minimum of |S 12| for the Ref case does not exactly coincide with the nominal resonance frequency of the OSRR (1.8 GHz). This slight variation is due to tolerances in the substrate parameters and geometrical variables. Therefore, we have considered as output variable |S 12| at the frequency of the minimum for the symmetric loading (i.e., DI water in both channels). Such frequency has been found to be 1.77 GHz. The results are depicted in Fig. 8. From these data, we have obtained the calibration curve, also depicted in the figure. Such a curve, with a correlation coefficient of R 2 = 0.9987, is

Frequency response of the sensing structure for different concentrations of isopropanol in DI water injected in the MUT channel, and pure DI water injected in the REF channel.
Variation of the transmission coefficient measured at 1.77 GHz with the isopropanol content, and calibration curve.
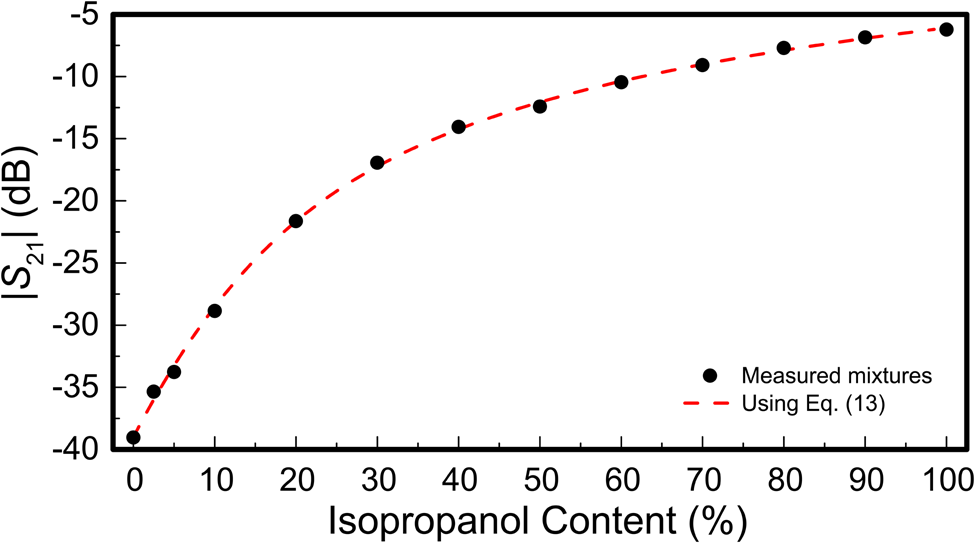
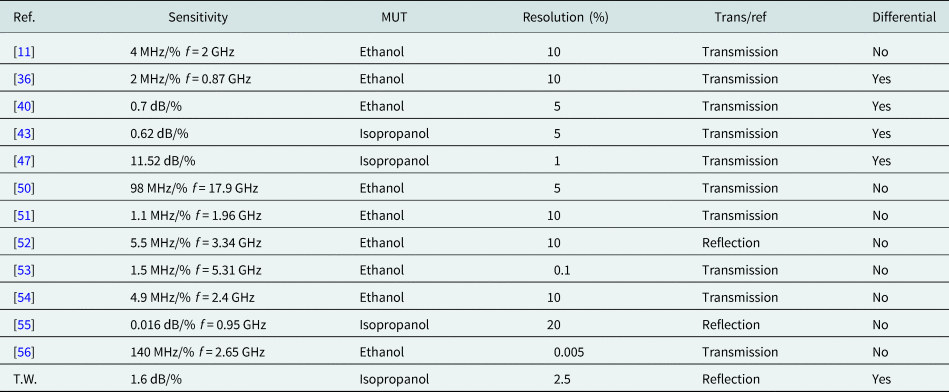
It is worth mentioning that the sensor is able to resolve isopropanol concentrations as small as 2.5%. Such volume fraction resolution is better than the one reported in most works where similar sensors were presented [Reference Ebrahimi, Withayachumnankul, Al-Sarawi and Abbott11, Reference Vélez, Su, Grenier, Mata-Contreras, Dubuc and Martín36, Reference Vélez, Grenier, Mata-Contreras, Dubuc and Martín40, Reference Vélez, Muñoz-Enano, Gil, Mata-Contreras and Martín43, Reference Chretiennot, Dubuc and Grenier50–Reference Kilpijärvi, Halonen, Juuti and Hannu55]. Exceptions are the sensors reported in [Reference Abdolrazzaghi, Daneshmand and Iyer56, Reference Muñoz-Enano, Vélez, Gil, Mata-Contreras and Martín47], with resolutions as small as 0.005 and 1%, respectively. Nevertheless, it should be mentioned that in [Reference Abdolrazzaghi, Daneshmand and Iyer56], the reported resolution corresponds to a frequency variation smaller than 1 MHz (centered around 1.83 GHz), which seems to be difficult to discriminate in practice. The maximum sensor sensitivity, defined as the derivative of |S 12| at 1.77 GHz with respect to the isopropanol concentration, is found to be 1.6 dB/%. Note that such maximum sensitivity (maximum derivative) occurs when the isopropanol content tends to zero, and then it progressively decreases. This maximum sensitivity is better than the one reported in [Reference Vélez, Grenier, Mata-Contreras, Dubuc and Martín40] (0.7 dB/%) and [Reference Vélez, Muñoz-Enano, Gil, Mata-Contreras and Martín43] (0.62 dB/%), but it is worse than the one reported in [Reference Muñoz-Enano, Vélez, Gil, Mata-Contreras and Martín47] (11.52 dB/%). Thus, according to these data, the sensor reported in [Reference Muñoz-Enano, Vélez, Gil, Mata-Contreras and Martín47] is somehow superior in terms of sensitivity and resolution, as compared to the sensor of Fig. 6. In both cases, rat-race couplers are used in order to implement two-port differential sensors operating at a single frequency. In [Reference Muñoz-Enano, Vélez, Gil, Mata-Contreras and Martín47], the sensor operates in transmission, whereas in this work we have reported a reflective-mode sensor. This is the main advantage of this sensor, as compared to the one reported in [Reference Muñoz-Enano, Vélez, Gil, Mata-Contreras and Martín47]. Namely, by operating in reflection mode, the sensing structure of this paper uses only one rat-race hybrid coupler, whereas in the transmission-mode differential sensor of [Reference Muñoz-Enano, Vélez, Gil, Mata-Contreras and Martín47], two couplers are needed in order to obtain the differential transmission coefficient (the output variable) with a simple two-port measurement. Thus, by using a single coupler, the benefits of the proposed approach in terms of size are apparent. Thus, the proposed sensor combines good performance, relatively small electrical size, differential-mode operation (using OSRR sensing loads in reflection), and it is based on simple two-port measurements at a single frequency for sensing purposes. Table 1 summarizes the comparison of the sensor proposed in this work with other sensors devoted to the characterization of ethanol or isopropanol content in aqueous solutions. Concerning the sensitivity, note that it is given in dB/% units in those sensors based on amplitude variation (operating at a single frequency), and in MHz/% for the sensors based on frequency variation (in these sensors the operation frequency is also given).
Comparison of various sensors devoted to the determination of alcohol content in aqueous solutions
Conclusion
In conclusion, a reflective-mode differential sensor, useful for the characterization of liquid solutions, has been reported. The sensing loads are grounded OSRRs equipped with fluidic channels, where the reference (REF) liquid and the liquid under test (MUT) are injected. The working principle of the sensor is based on the difference between the reflection coefficients of both loads, generated when they are loaded with different samples (i.e., the REF and MUT liquids in the present study). For the first time, such difference is inferred by connecting the sensing loads to the coupled ports of a rat-race hybrid coupler and measuring the transmission coefficient between the Δ–port and the Σ-port. The resulting reflective-mode differential sensor is thus a two-port structure, and sensing requires only a two-port measurement at a single (operating) frequency. This frequency is dictated by the rat-race coupler and by the OSRR (loaded with the REF sample), which must be tuned to the same frequency. Based on a simplified circuit model of the OSRRs, we have made a sensitivity analysis, from which we have concluded that sensitivity optimization requires OSRRs with large inductance and small capacitance values. Then, this result of the analysis has been corroborated from numerical calculations using the complete circuit model of the sensing resonators. Finally, a sensor has been designed, fabricated, and experimentally validated. Specifically, it has been applied to the characterization of solutions of isopropanol in DI water, the REF liquid. The results show that the proposed sensor exhibits good resolution (2.5% volume fraction) and sensitivity (with a maximum value of 1.6 dB/%). Moreover, the device uses a single hybrid coupler in order to obtain the differential reflection coefficient of the sensing loads (the output variable) from a simple two-port measurement. This is an important aspect with potential impact on sensor size, at least as compared to other differential sensor implementations based on transmission-mode two-port measurements, which require a pair of couplers.
Supplementary material
The supplementary material for this article can be found at https://doi.org/10.1017/S1759078720000501.
Acknowledgement
This work was supported by MINECO-Spain (project TEC2016-75650-R), by Generalitat de Catalunya (project 2017SGR-1159), by Institució Catalana de Recerca i Estudis Avançats (who awarded Ferran Martín), and by FEDER funds. J. Muñoz-Enano acknowledges Secreteraria d'Universitats i Recerca (Gen. Cat.) and European Social Fund for the FI grant. Paris Vélez acknowledges the Juan de la Cierva Program for supporting him through Project IJCI-2017-31339. M. Gil acknowledges the Universidad Politécnica de Madrid Young Researchers Support Program (VJIDOCUPM18MGB) for its support.
 Jonathan Muñoz-Enano was born in Mollet del Vallès (Barcelona), Spain, in 1994. He received the Bachelor's Degree in Electronic Telecommunications Engineering in 2016 and the Master's Degree in Telecommunications Engineering in 2018, both at the Autonomous University of Barcelona (UAB). Actually, he is working in the same university in the elaboration of his Ph.D., which is focused on the development of microwave sensors based on metamaterials concepts for the dielectric characterization of materials and biosensors.
 Paris Vélez (S’10–M’14) was born in Barcelona, Spain, in 1982. He received the degree in Telecommunications Engineering, specializing in electronics, the Electronics Engineering degree, and the Ph.D. degree in Electrical Engineering from the Universitat Autònoma de Barcelona, Barcelona, in 2008, 2010, and 2014, respectively. His Ph.D. thesis concerned common mode suppression differential microwave circuits based on metamaterial concepts and semi-lumped resonators. During the Ph.D., he was awarded with a pre-doctoral teaching and research fellowship by the Spanish Government from 2011 to 2014. From 2015 to 2017, he was involved in the subjects related to metamaterials sensors for fluidics detection and characterization at LAAS-CNRS through a TECNIOSpring fellowship cofounded by the Marie Curie program. His current research interests include the miniaturization of passive circuits RF/microwave and sensors-based metamaterials through Juan de la Cierva fellowship. Dr. Vélez is a Reviewer for the IEEE Transactions on Microwave Theory and Techniques and for other journals.
 Marta Gil Barba (S’05–M’09) was born in Valdepeñas, Ciudad Real, Spain, in 1981. She received the Physics degree from Universidad de Granada, Spain, in 2005, and the Ph.D. degree in electronic engineering from the Universitat Autònoma de Barcelona, Barcelona, Spain, in 2009. She studied 1 year with the Friedrich Schiller Universität Jena, Jena, Germany. During her Ph.D. thesis she was the holder of a METAMORPHOSE NoE grant and National Research Fellowship from the FPU Program of the Education and Science Spanish Ministry. As a postdoctoral researcher, she was awarded a Juan de la Cierva fellowship working in the Universidad de Castilla-La Mancha. She was postdoctoral researcher in the Institut für Mikrowellentechnik und Photonik in Technische Universität Darmstadt and in the Carlos III University of Madrid. She is currently an assistant professor in the Universidad Politécnica de Madrid. She has worked in metamaterials, piezoelectric MEMS, and microwave passive devices. Her current interests include metamaterials sensors for fluidic detection.
 Ferran Martín (M’04—SM’08–F’12) was born in Barakaldo (Vizcaya), Spain in 1965. He received the B.S. Degree in Physics from the Universitat Autònoma de Barcelona (UAB) in 1988 and the Ph.D. degree in 1992. From 1994 up to 2006 he was Associate Professor in Electronics at the Departament d'Enginyeria Electrònica (Universitat Autònoma de Barcelona), and since 2007 he is Full Professor of Electronics. In recent years, he has been involved in different research activities including modeling and simulation of electron devices for high-frequency applications, millimeter wave and THz generation systems, and the application of electromagnetic bandgaps to microwave and millimeter wave circuits. He is now very active in the field of metamaterials and their application to the miniaturization and optimization of microwave circuits and antennas. Other topics of interest include microwave sensors and RFID systems, with special emphasis on the development of high data capacity chipless-RFID tags. He is the head of the Microwave Engineering, Metamaterials and Antennas Group (GEMMA Group) at UAB, and director of CIMITEC, a Research Center on Metamaterials supported by TECNIO (Generalitat de Catalunya). He has organized several international events related to metamaterials and related topics, including Workshops at the IEEE International Microwave Symposium (years 2005 and 2007) and European Microwave Conference (2009, 2015, and 2017), and the Fifth International Congress on Advanced Electromagnetic Materials in Microwaves and Optics (Metamaterials 2011), where he acted as Chair of the Local Organizing Committee. He has acted as Guest Editor for six Special Issues on metamaterials and sensors in five International Journals. He has authored and co-authored over 600 technical conference, letter, journal papers, and book chapters, he is co-author of the book on Metamaterials entitled Metamaterials with Negative Parameters: Theory, Design and Microwave Applications (John Wiley & Sons Inc.), author of the book Artificial Transmission Lines for RF and Microwave Applications (John Wiley & Sons Inc.), and co-editor of the book Balanced Microwave Filters (Wiley/IEEE Press). Ferran Martín has generated 19 PhDs, has filed several patents on metamaterials, and has headed several Development Contracts.
Prof. Martín is a member of the IEEE Microwave Theory and Techniques Society (IEEE MTT-S). He is the reviewer of the IEEE Transactions on Microwave Theory and Techniques and IEEE Microwave and Wireless Components Letters, among many other journals, and he serves as a member of the Editorial Board of IET Microwaves, Antennas and Propagation, International Journal of RF and Microwave Computer-Aided Engineering, and Sensors. He is also a member of the Technical Committees of the European Microwave Conference (EuMC) and International Congress on Advanced Electromagnetic Materials in Microwaves and Optics (Metamaterials). Among his distinctions, Ferran Martín has received the 2006 Duran Farell Prize for Technological Research, he holds the Parc de Recerca UAB – Santander Technology Transfer Chair, and he has been the recipient of three ICREA ACADEMIA Awards (calls 2008, 2013, and 2018). He is Fellow of the IEEE and Fellow of the IET.



