





Healthy ageing as promoted by the WHO emphasises functional ability as an outcome rather than mortality(1). Functional decline often precedes disability, nursing home admission, home care use and mortality(Reference Beauchamp, Jette and Ni2–Reference Mayhew, Griffith and Gilsing4). Intrinsic capacity has been proposed as a measure for monitoring healthy ageing(Reference Cesari, Araujo de Carvalho and Amuthavalli Thiyagarajan5). Some domains of intrinsic capacity require functional assessments using cut-off values, such as grip strength or walking speed. In addition, body composition and physical performance measures are particularly important in the diagnosis of sarcopenia, since many consensus definitions include cut-off points for appendicular muscle mass, strength and physical performance measures such as walking speed and chair stand. Consensus definitions from Asia(Reference Chen, Woo and Assantachai6) differ from Europe(Reference Cruz-Jentoft, Bahat and Bauer7) mainly with regard to these cut-off points. This is not surprising, as previous research shows that there are ethnic and geographic variations in muscle mass, strength and physical performance measures(Reference Woo, Arai and Ng8), showing differences between Asians and Caucasians and also between Asians in different geographic regions. There is global variation in grip strength measures, particularly between developed and developing regions of the world, suggesting that socio-economic factors may also influence reference range values and that there is a need for the establishment of region- as well as ethnic-specific cut-off points(Reference Dodds, Syddall and Cooper9). A unified conceptual definition of sarcopenia was proposed in the latest Global Leadership in Sarcopenia Consortium(Reference Kirk, Cawthon and Arai10), where only muscle mass and strength were included in the definition, while physical performance measures were included as outcomes. However, operationalisation of this new conceptual definition is still pending, and cut-off points for these measures still need to be defined.
There are increasing numbers of reports of reference ranges for body composition and physical performance measures from Italy, Canada, France and Asians, including Japanese, Chinese and Malays(Reference Landi, Calvani and Martone11–Reference Chen, Meng and Peng14). In addition, social determinants have been shown to affect these values in that a higher socio-economic position is associated with higher physical performance measures(Reference Dodds, Granic and Davies15,Reference Granic, Mossop and Engstrom16) .
Increasing body fat with age and its distribution is also of concern due to various adverse cardiometabolic diseases and mortality(Reference Chen, Meng and Peng14,Reference Kosugi, Eriguchi and Yoshida17) , and combined with sarcopenia, the diagnosis of sarcopenic obesity also requires consensus in definition and management strategies. While waist:hip ratio (WHR) has been used as a general indicator of visceral obesity, age-related changes in body composition suggest that normal reference values derived from the general adult population of all ages may not be appropriate for older adults(Reference Woo18). Furthermore, the Conicity Index (C-index) has been suggested to better represent abdominal fat distribution and predict CVD and metabolic diseases associated with central obesity(Reference Valdez19). However, normative reference data for the C-index in older populations remain scarce. A recent consensus panel on definition and diagnostic criteria of clinical obesity recommended that for an individual measure of health, a direct measurement of body fat or at least one anthropometric criterion with cut-off points appropriate to age, sex and ethnicity should be used(Reference Rubino, Cummings and Eckel20).
Therefore, reference ranges for these healthy ageing-related indicators for older adults disaggregated by age group and sex are needed. Since these values are affected by ethnicity, geography, lifestyle and other social determinants(Reference Xu, Cohen and Greaney21,Reference Park, Nicolaou and Dickens22) , reference values derived from one population may not be applicable to another population in different countries, or perhaps different population within the same country. Furthermore, previous studies typically focus on isolated variables or modules, such as handgrip strength or body composition, without integrating multiple dimensions of healthy ageing. Cross-cultural normative reference values for multidimensional healthy ageing indicators are essential for enabling global comparisons of health status and providing a scientific basis for healthy ageing worldwide.
This study aims to (1) establish age- and sex-specific normative reference ranges for eight key variables (grip strength, walking speed, 5-times chair stand test (CST), WHR, percentage body fat (PBF), weight, BMI and C-index) in older adults aged 65 years and above. (2) Compare these values between Chinese living in Hong Kong and Canadians to highlight the point that anthropometric values used to measure physical function and obesity are context-specific with respect to ethnicity, geography and other social determinants.
Methods
Data resource and study population
This study analysed physical performance measures and body composition data for males and females across four age groups (65–70 years, 71–75 years, 76–80 years and 81–85 years) from two ageing cohorts: the Canadian Longitudinal Study on Aging (CLSA) and the Mr. & Ms. Os in Hong Kong. This study is a secondary analysis of two datasets which represent two cohort studies which were approved by respective Clinical Research Ethics Committees. The CLSA recruited 51 338 community-dwelling participants aged 45–85 years at baseline from all ten Canadian provinces by stratified random sampling. Eligibility required the ability to complete interviews and clinic assessments in English or French. Residents of long‑term‑care facilities, individuals on First Nations reserves or in the three northern territories, full‑time military personnel and those with severe cognitive impairment were excluded. Participants were enrolled in either the Tracking cohort (n 21 241), which completed telephone interviews, or the Comprehensive cohort (n 30 097), which underwent in-depth in-person assessments. This study used baseline data from the Comprehensive cohort (Year 2011)(Reference Raina, Wolfson and Kirkland23). Baseline wave data collection for the comprehensive cohort occurred between 2012 and 2015. The Hong Kong Os study recruited 2000 Chinese males and 2000 Chinese females aged $\geqslant$
65 years from eighty community centres across Hong Kong at the baseline visit (collected from Year 2001 to Year 2003). Exclusions were inability to walk unaided, bilateral hip replacement, chronic corticosteroid or anti‑osteoporotic therapy, and disorders affecting bone metabolism(Reference Lau, Leung and Kwok24).
$\geqslant$
65 years from eighty community centres across Hong Kong at the baseline visit (collected from Year 2001 to Year 2003). Exclusions were inability to walk unaided, bilateral hip replacement, chronic corticosteroid or anti‑osteoporotic therapy, and disorders affecting bone metabolism(Reference Lau, Leung and Kwok24).
The present analysis included participants aged $\geqslant$
65 years with available physical function and body composition data from both cohorts. Eight physical performance and body composition measures were analysed, including grip strength, walking speed, 5-times CST, PBF, weight, BMI, WHR and C-index. Participants under 65 years of age and those with missing data for any of the eight targeted variables were excluded(Reference Lau, Leung and Kwok24).
$\geqslant$
65 years with available physical function and body composition data from both cohorts. Eight physical performance and body composition measures were analysed, including grip strength, walking speed, 5-times CST, PBF, weight, BMI, WHR and C-index. Participants under 65 years of age and those with missing data for any of the eight targeted variables were excluded(Reference Lau, Leung and Kwok24).
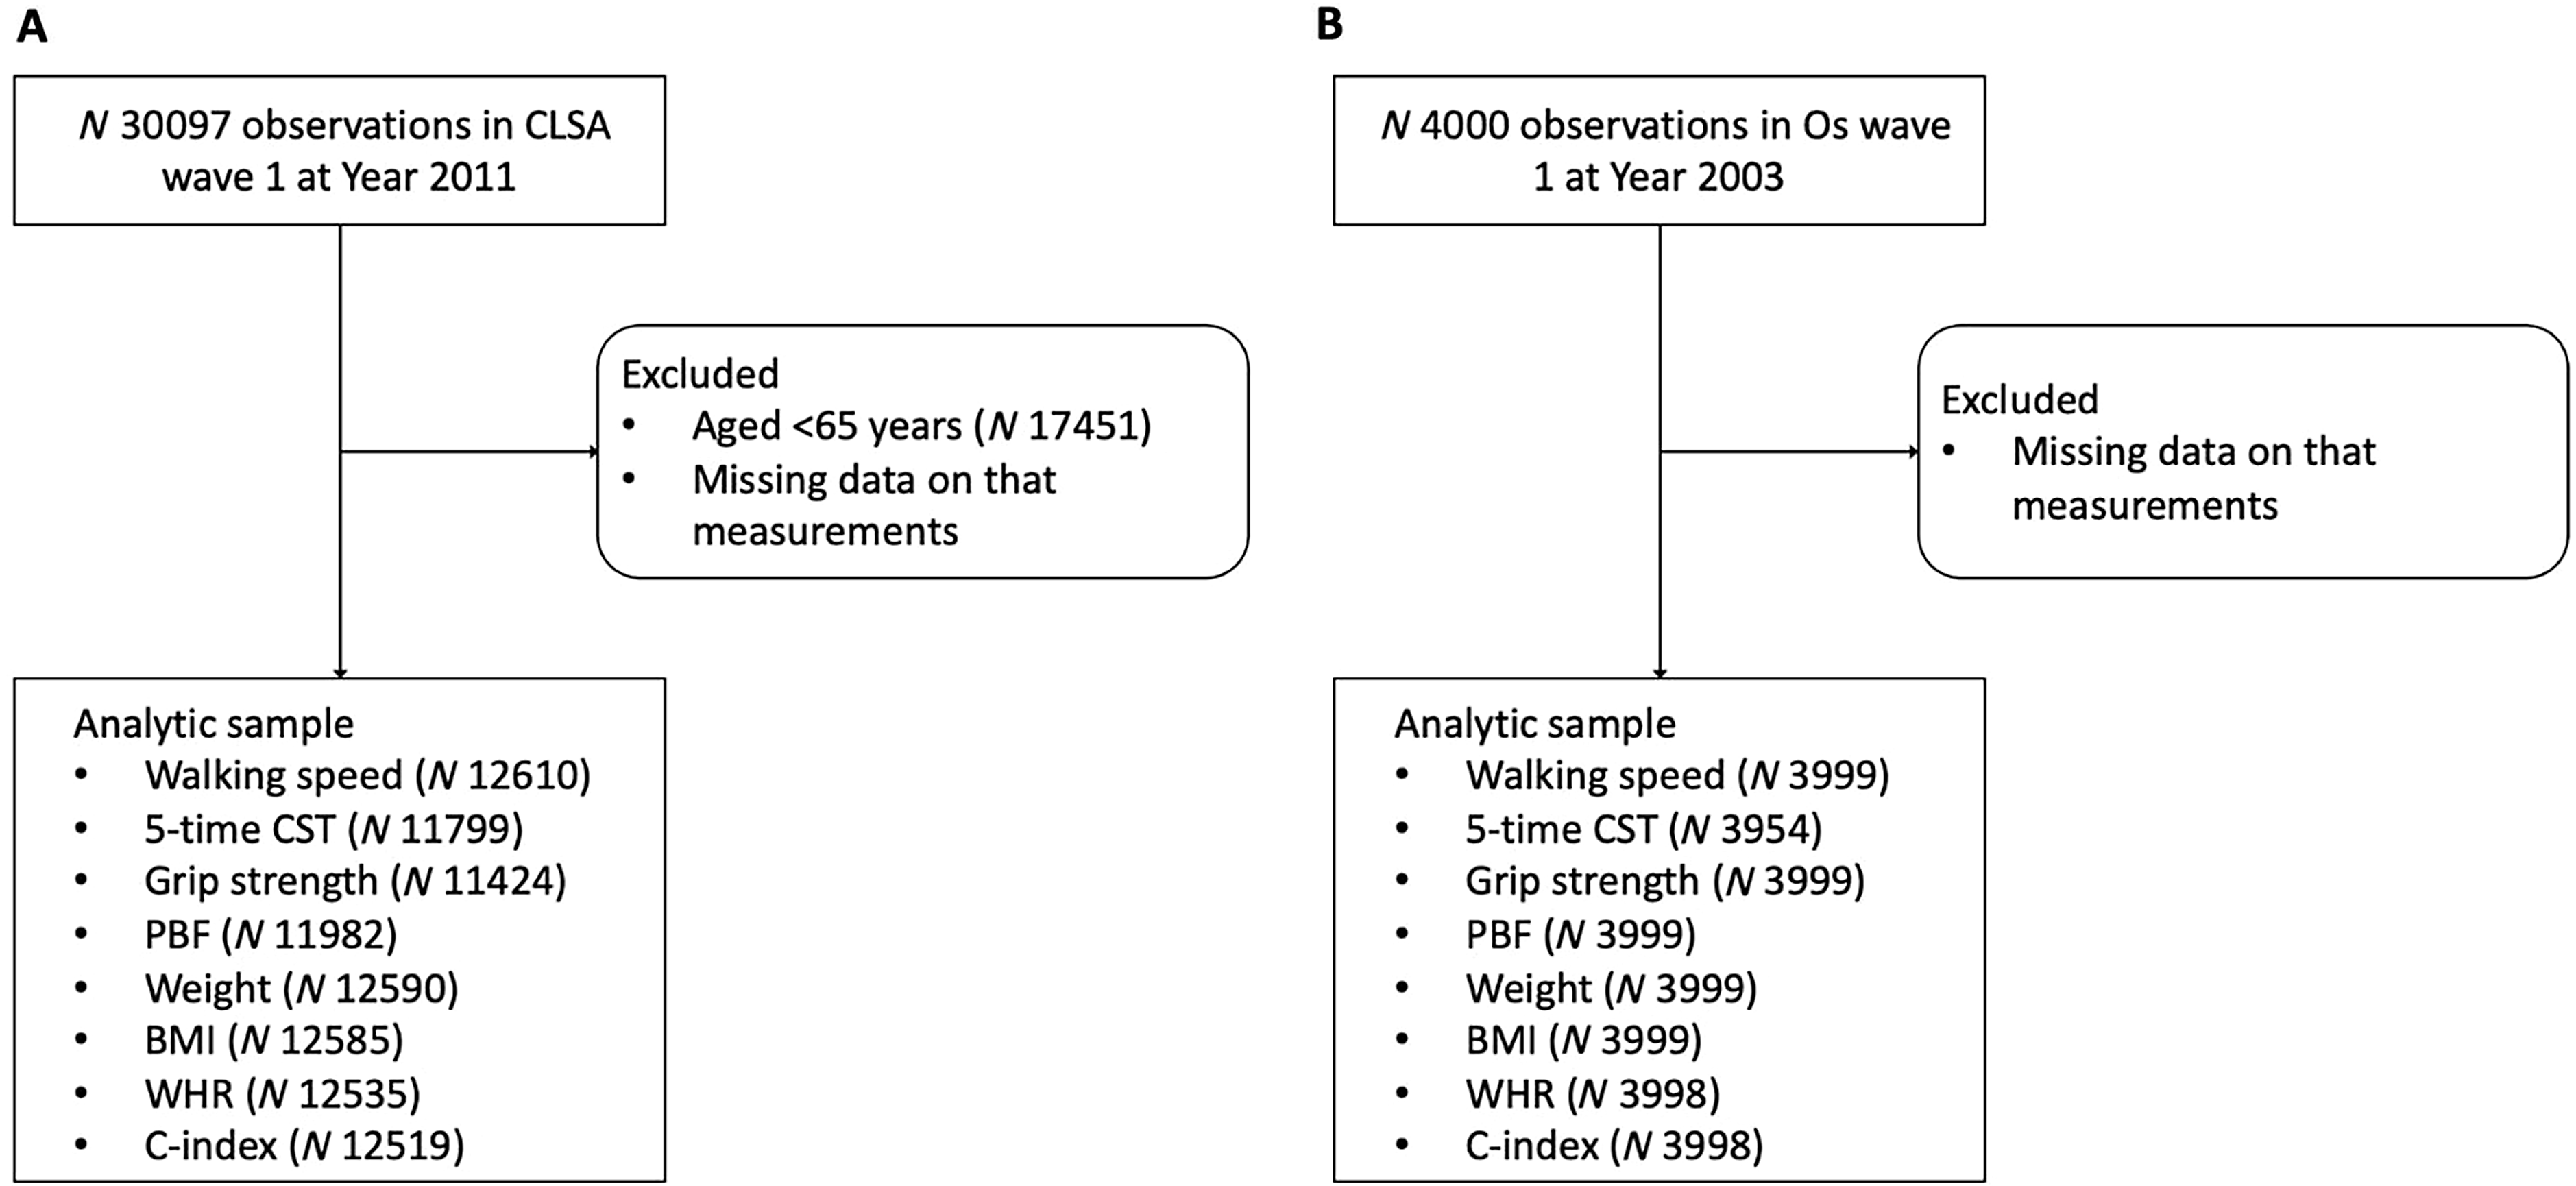
Participants with available physical function, body composition and anthropometric data were included from both cohorts. Eight physical performance and body composition measures were analysed, including grip strength, walking speed, 5-times CST, PBF, weight, BMI, WHR and C-index. Participants under 65 years of age and those with missing data for any of the nine targeted variables were excluded. Sample selection was performed separately for each variable, resulting in variable-specific sample sizes (Figure 1).
Study flow diagrams. CLSA, Canadian Longitudinal Study on Aging; CST, chair stand test; PBF, percentage body fat; WHR, waist:hip ratio; C-index, Conicity Index.

Physical performance measurements
In the CLSA cohort, grip strength was measured using the Tracker Freedom Wireless Grip Dynamometer(25). In the Os study, grip strength was measured using the JAMAR hand dynamometer (5030JI; Sammons Preston), while the maximum value from all trials was used for analysis, with participants maintaining a neutral forearm position and bending the elbow at a right angle(Reference Raina, Wolfson and Kirkland23,Reference Kwok, Gong and Wang26) . Walking speed was calculated as the distance walked divided by the time taken, using a 4-m walk in the CLSA(25) and a 6-m walk in the Os cohort. For the 5-times CST, participants were instructed to stand up and sit down five times as quickly and safely as possible without resting. The total time to complete the task was recorded(Reference Albalwi and Alharbi27).
Body composition measurements
Standing height (cm) and weight (kg) were measured using a stadiometer and a digital physician scale, respectively. BMI was calculated as weight (kg) divided by height (m) squared (m2)(25). Waist circumference (WC) was measured in centimetres at the uppermost lateral border of the ilium, while the participant was standing(25). WHR was obtained by the ratio of WC to hip circumference. Hip circumference was measured at the widest part of the hips and buttocks for females and at the hip bones for males(25). The specific mathematical formula for calculating the C-index is as follows: $C - index = {{WC} \over {0\cdot109 \times \sqrt {{{Weight} \over {Height}}} }}$
In the Os study, total body fat was measured using dual-energy X-ray absorptiometry with a Hologic QDR 4500 densitometer (Waltham). PBF was calculated as total body fat divided by weight. In the CLSA, PBF was measured using centrally analysed dual-energy X-ray absorptiometry scans from a Hologic Discovery ATM(25).
Statistical analysis
Within each population, the median (5th–95th percentile) value and mean and standard deviation of each variable were calculated stratified by age (65–70 years, 71–75 years, 76–80 years and 81–85 years) and sex. The normative reference range of each variable was defined as the 5th–95th percentile within each stratum. Between-group comparisons for eight targeted variables were conducted separately by sex within each age stratum. Independent-samples t test or Mann–Whitney U test was used for continuous variables, while χ 2 test was used for categorical variables. All statistical analyses were conducted using R version 4.3.0 with a significance level of 0·05.
Results
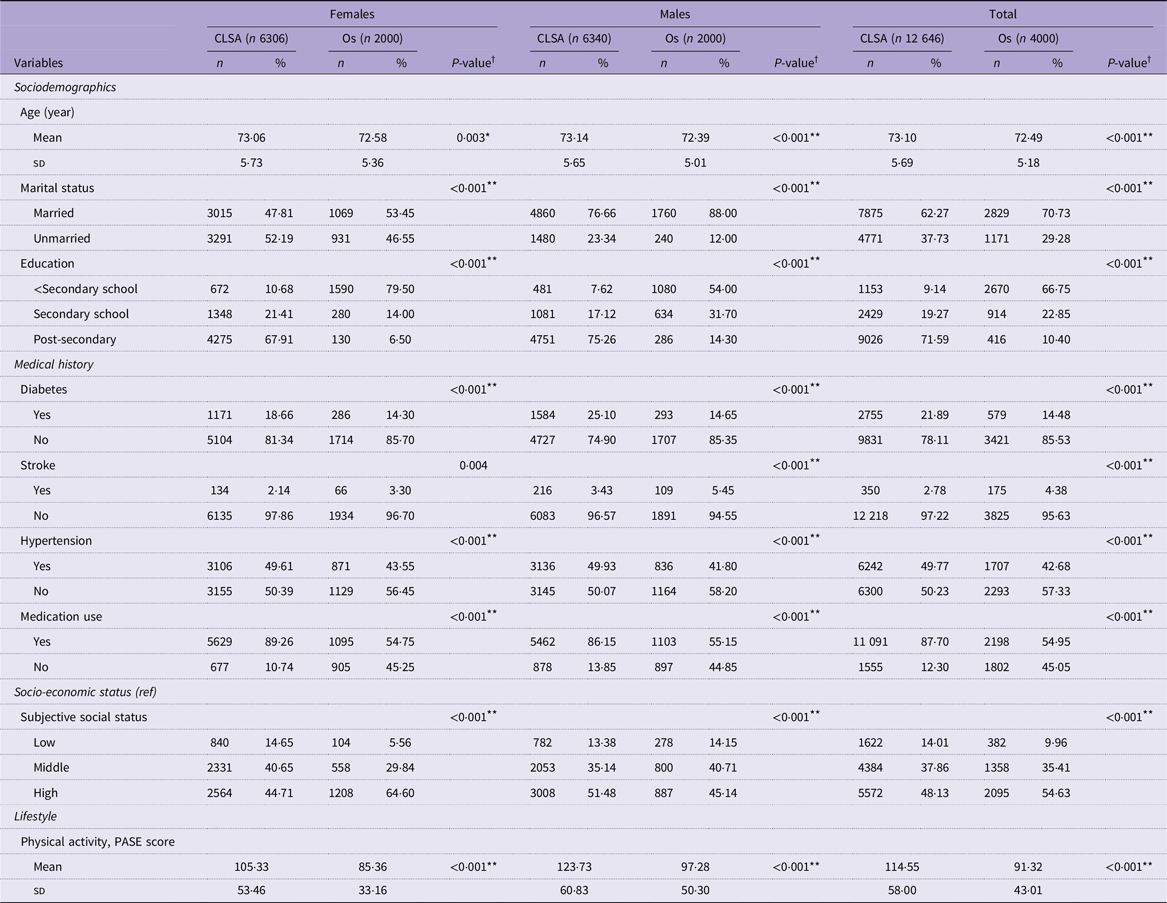
The overall profile of older adults from the CLSA and 4000 from the Os cohort are shown in Table 1. Significant differences were observed in the general characteristics of the study participants from Canada and Hong Kong. A higher proportion of Canadian older adults have post-secondary education (67·9 % in females and 75·3 % in males) compared with Hong Kong older adults (6·5 % in females and 14·3 % in males) (P < 0·001). Canadian older adults also had a higher prevalence of hypertension and diabetes, as well as a greater proportion of participants using medications compared with their Hong Kong counterparts (P < 0·001). Additionally, Canadian older adults had higher Physical Activity Scale of the Elderly (PASE) scores, indicating higher levels of physical activity (P < 0·001).
Baseline general characteristics of participants aged ≥ 65 years in the CLSA and Os by sexa

CLSA, Canadian Longitudinal Study on Aging (Canada); Os, Mr. & Ms. Osteoporosis (Hong Kong); PASE, Physical Activity Scale of the Elderly.
Ref: Adler, N.E., Epel, E.S., Castellazzo, G. and Ickovics, J.R. Relationship of subjective and objective social status with psychological and physiological functioning: preliminary data in healthy white women. Health Psychol 2000;19(6):586–92.
*P < 0·05.
**P < 0·001.
aData are mean (sd) for continuous variables and n (%) for categorical variables, unless otherwise indicated.
† P values for continuous variables and categorical variables were derived from the independent samples t tests and the χ 2 tests, respectively.
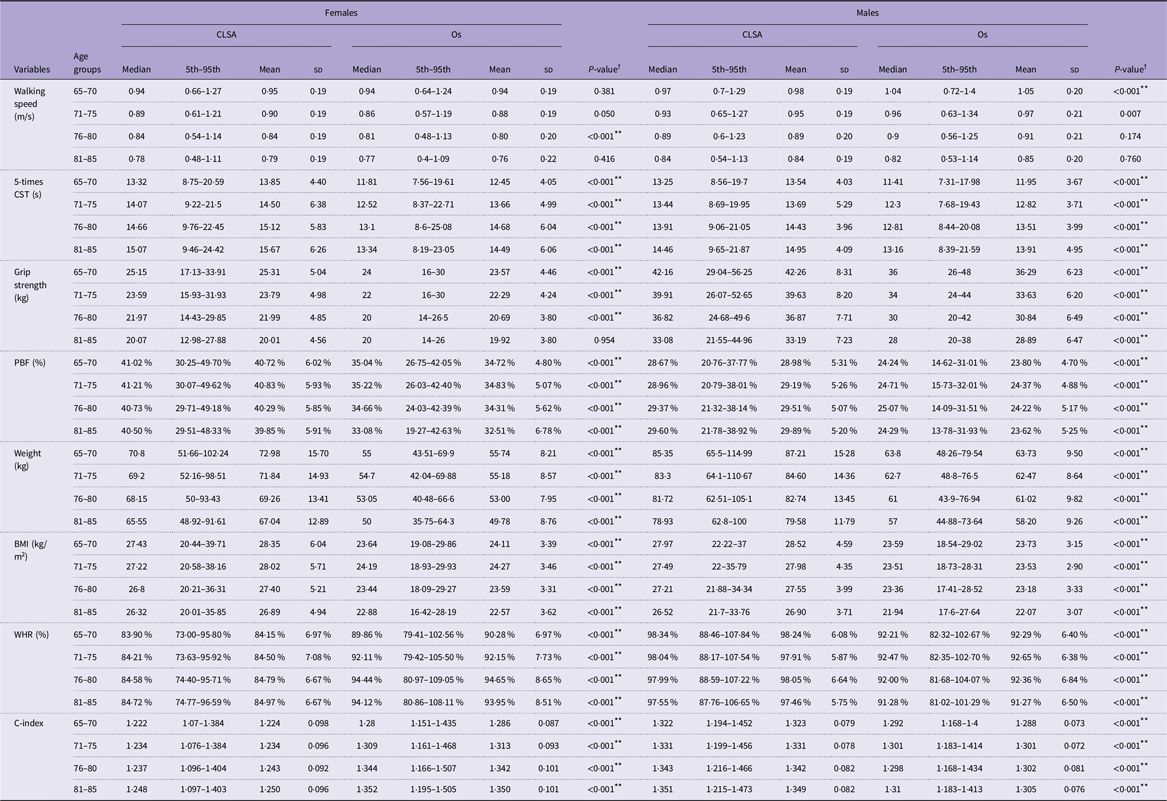
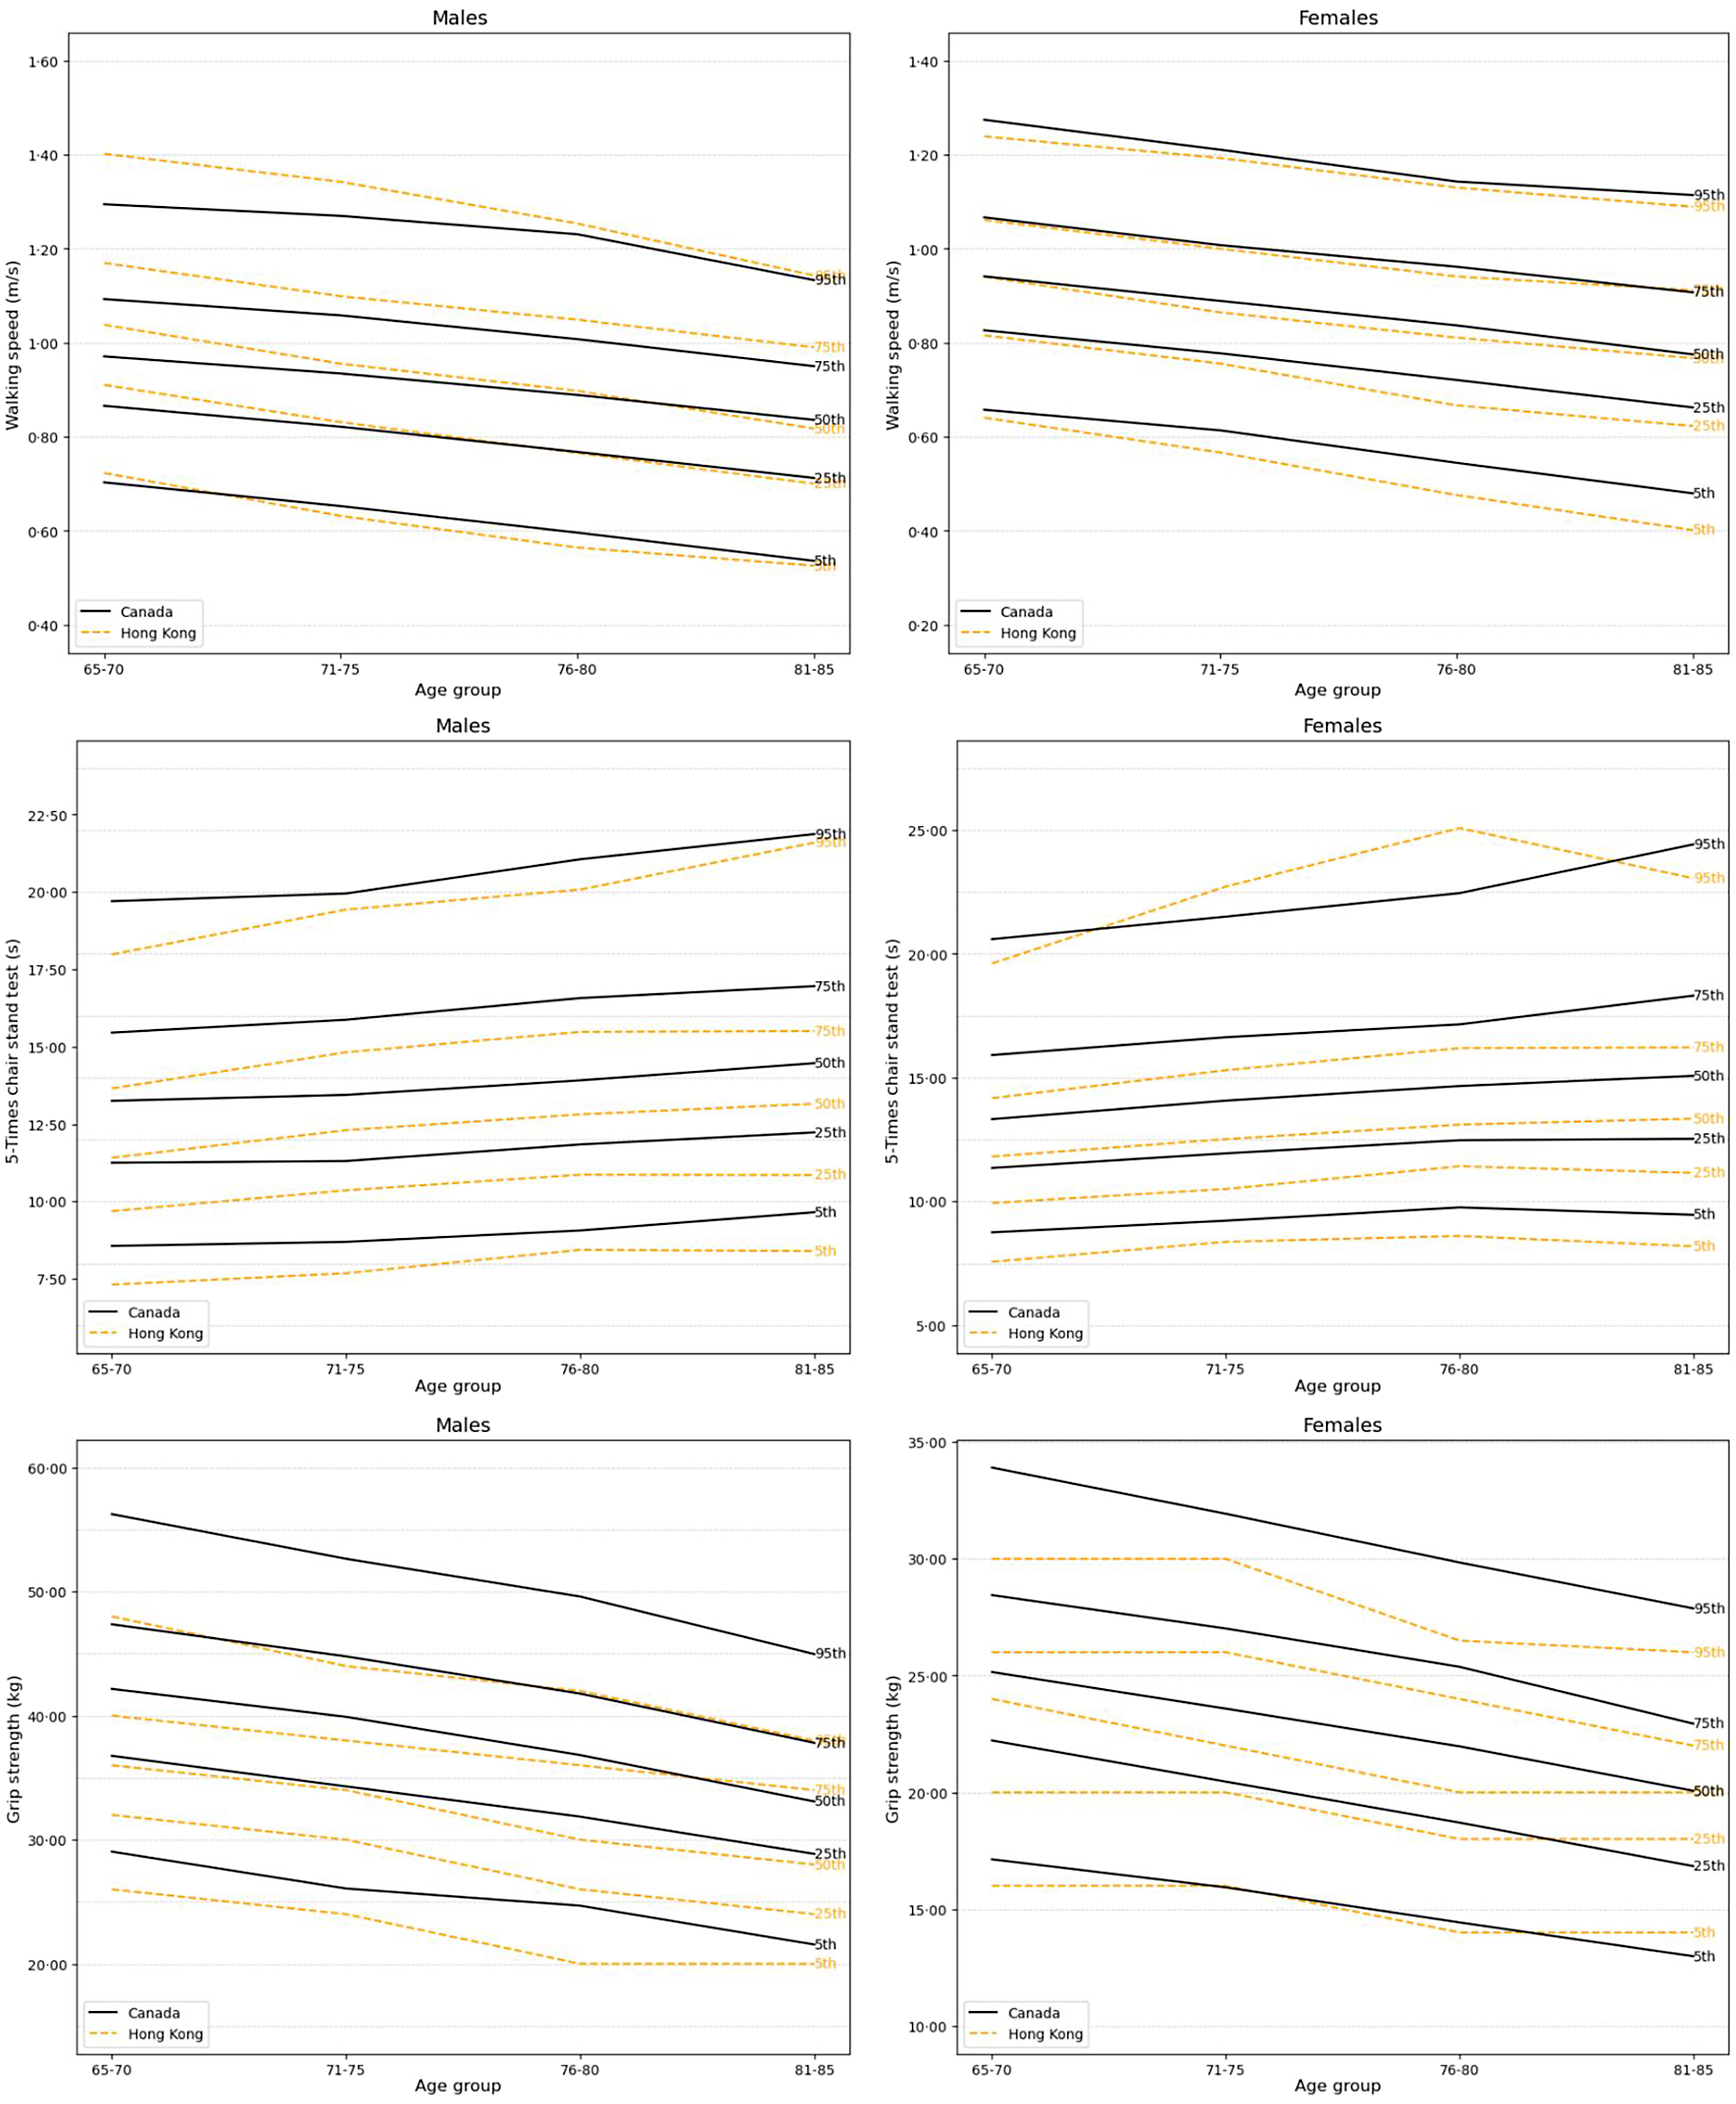
The sample selection process and the final sample size for each variable are detailed in Figure 1. Table 2 shows the normative reference ranges by population, age group and sex; and Figures 2, 3, and 4, respectively, show the centile values for physical performance measures, body composition, and anthropometrics of the same age and sex group by country.
Normative reference ranges median (5th–95th percentile) for physical performance measures and body composition, stratified by age, sex and population

CLSA, Canadian Longitudinal Study on Aging (Canada); Os, Mr. & Ms. Osteoporosis (Hong Kong); CST, chair stand test; PBF, percentage body fat; WHR, waist:hip ratio; C-index, Conicity Index.
Values are reported as median (5th–95th) and mean (sd).
*P < 0·05.
**P < 0·001.
† P values were derived from independent t tests.
Age- and sex-specific reference percentiles for physical performance measures, including walking speed, 5-times CST and grip strength, in older adults from Canada and Hong Kong. The 5th, 25th, 50th, 75th and 95th percentiles are shown in black for Canada and orange for Hong Kong.

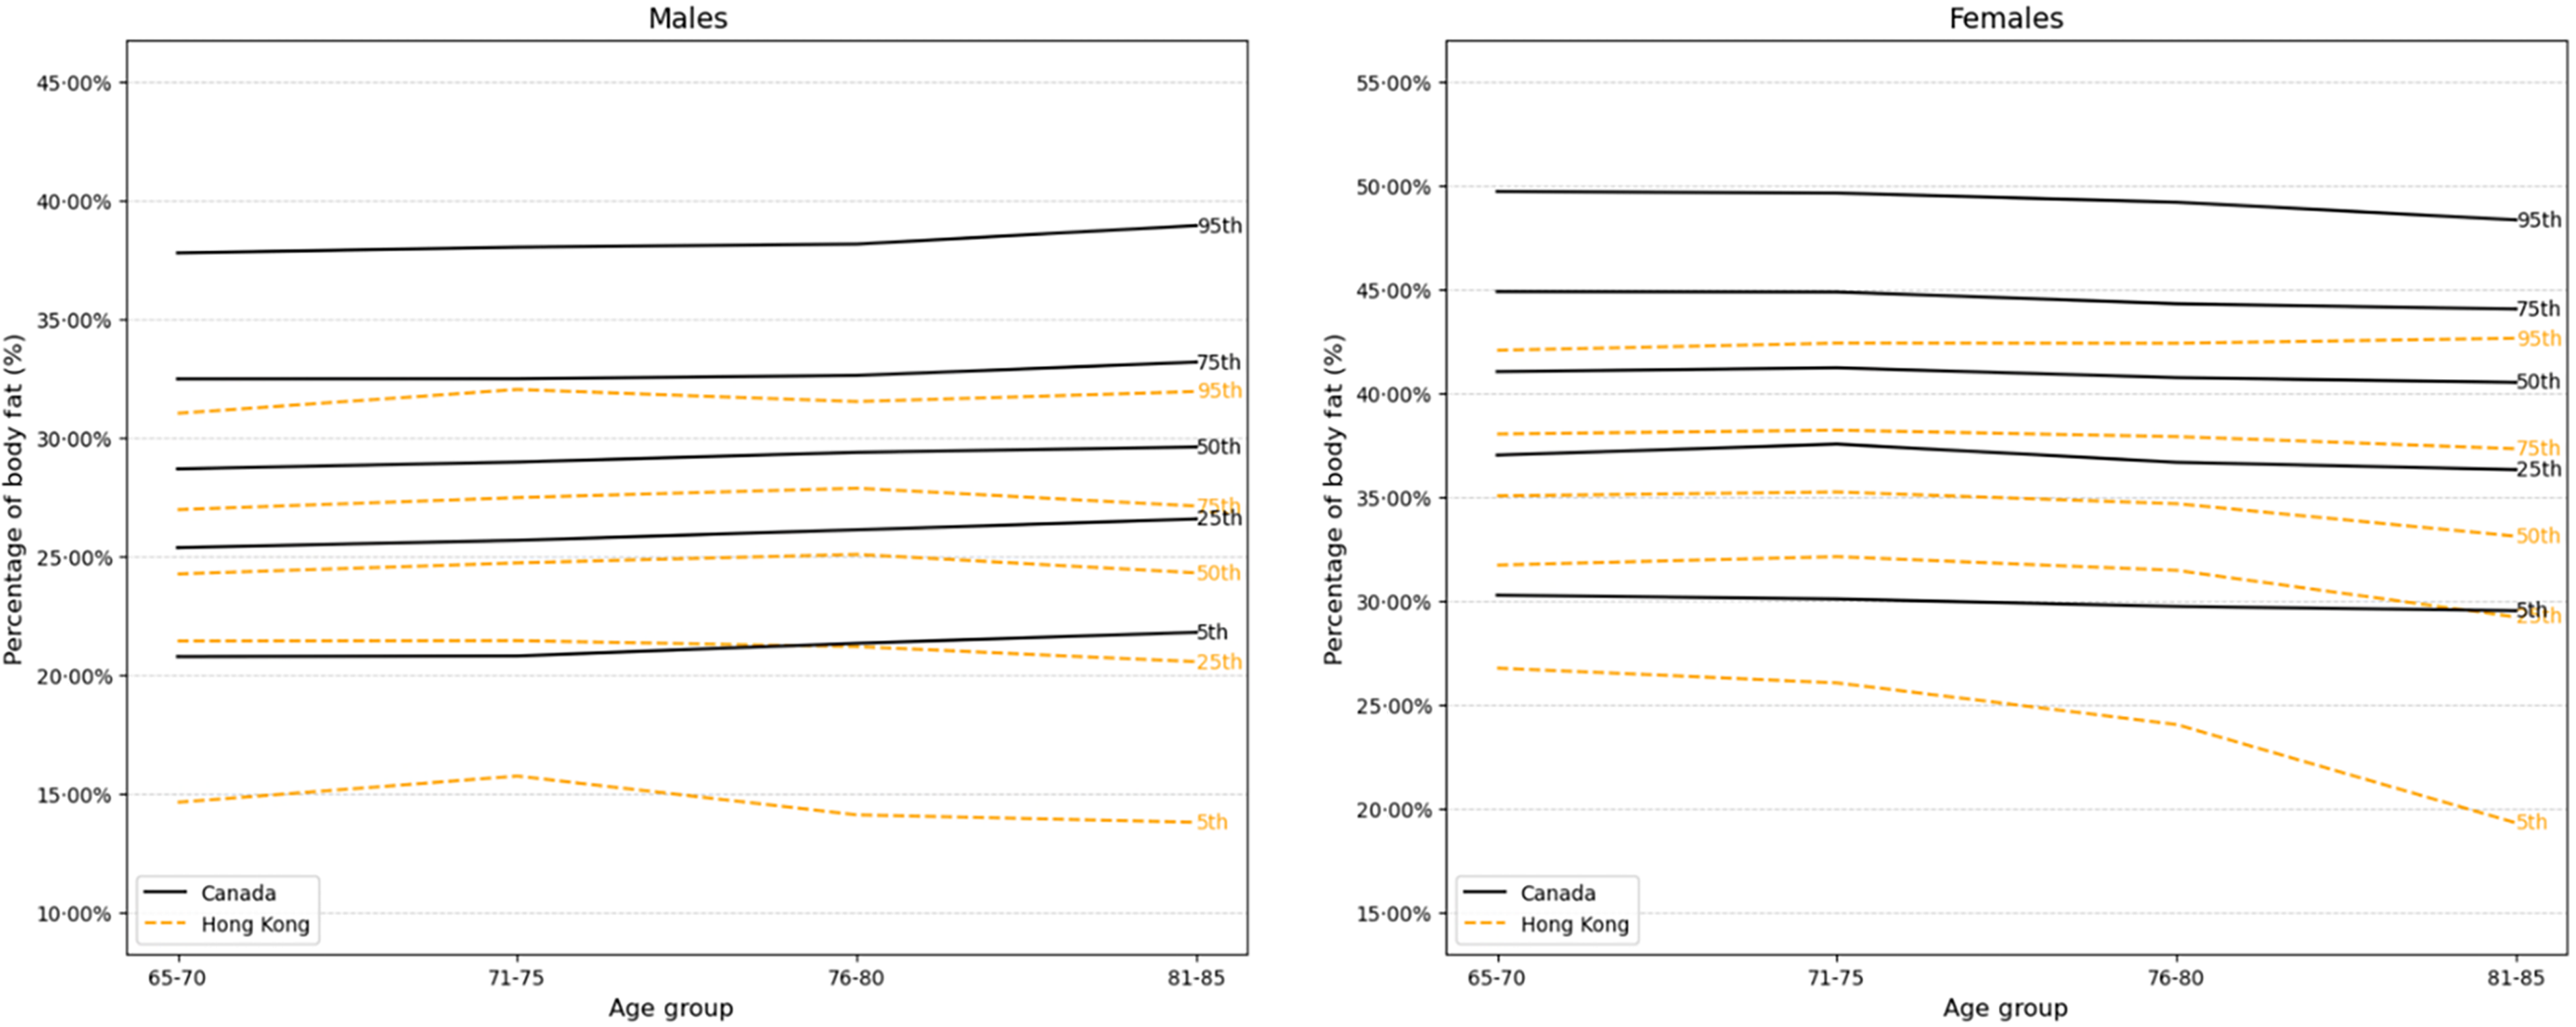
Age- and sex-specific reference percentiles for body composition measures and percentage body fat in older adults from Canada and Hong Kong. The 5th, 25th, 50th, 75th and 95th percentiles are shown in black for Canada and orange for Hong Kong.

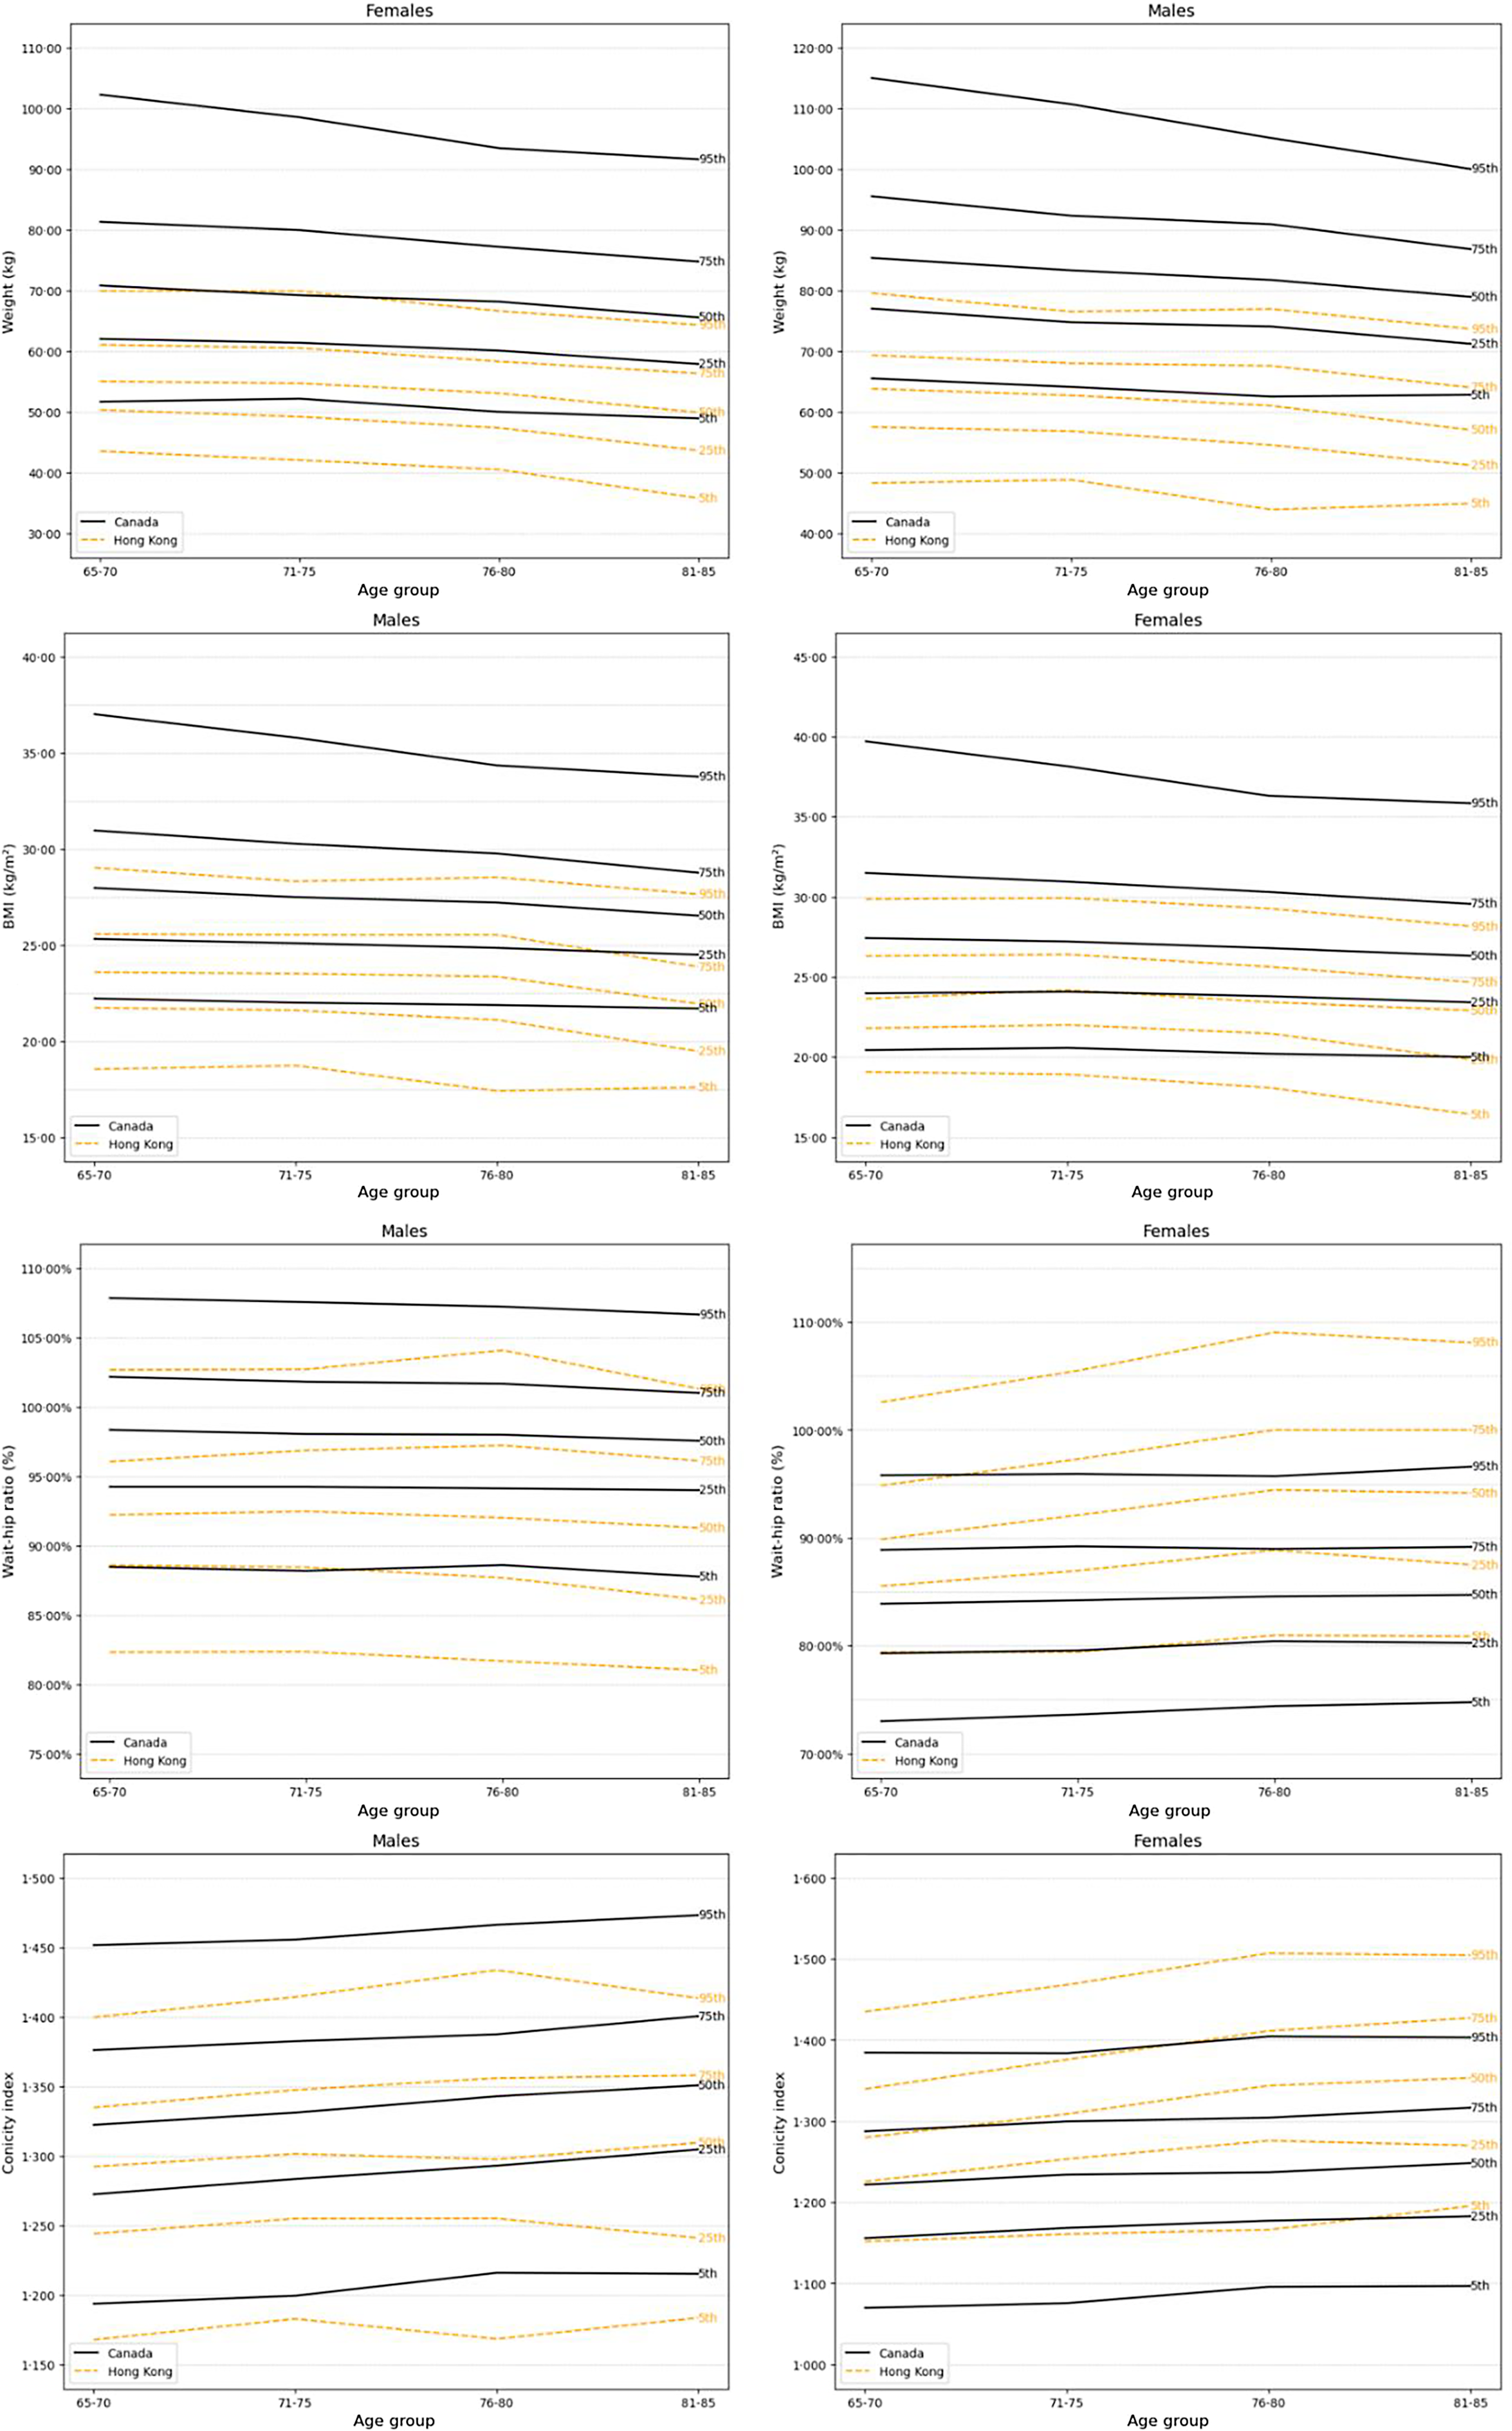
Age- and sex-specific reference percentiles for anthropometrics, including weight, BMI, WHR and C-index, in older adults from Canada and Hong Kong. The 5th, 25th, 50th, 75th and 95th percentiles are shown in black for Canada and orange for Hong Kong.

Hong Kong older males consistently outperformed Canadian counterparts in the 5-times CST across all age groups (P < 0·001). A similar trend was observed in female older adults, where Hong Kong participants demonstrated significantly faster completion times in all age groups (P < 0·001). Walking speed was significantly higher among Hong Kong older males only in the 65–70 age group (Os: median = 1·04 m/s, mean = 1·05 m/s; CLSA: median = 0·97 m/s, mean = 0·98 m/s; P < 0·001) and 71–75 age groups (Os: median = 0·96 m/s, mean = 0·97 m/s; CLSA: median = 0·93 m/s, mean = 0·95 m/s; P = 0·007). For older females, walking speeds were comparable between the two populations, except in the 76–80 age group (Os: median = 0·82 m/s, mean = 0·80 m/s; CLSA: median = 0·84 m/s, mean = 0·84 m/s; P < 0·001), where Canadian older females walked faster compared with Hong Kong females. Canadian older males of all age groups and Canadian older females in age groups younger than 81 years had higher median values for grip strength (P < 0·001). There was no difference between Canadian and Hong Kong females aged 81–85 years.
Weight, BMI, PBF and C-index were higher across all age groups in Canadian older males (P < 0·001). Weight and BMI were also higher in Canadian older females; however, Hong Kong older females appear to have a higher central fat distribution suggested by higher WHR and C-index across all age groups (P < 0·001).
Discussion
This study shows different normative values for body composition and physical performance measures between older populations of different ethnicities and in different geographic regions. The findings have important implications for the diagnosis of various conditions that depend on such values, such as sarcopenia and obesity, and that no universal values may apply across all populations. Ideally, cut-off values may need to be related to adverse health outcomes(Reference Woo, Leung and Morley28,Reference Studenski, Peters and Alley29) .
In terms of physical function, our findings are consistent with previous studies demonstrating variations in skeletal muscle mass among individuals of different ethnicities(Reference Woo, Arai and Ng8,Reference Dodds, Syddall and Cooper9,Reference Silva, Shen and Heo30) . These results are also consistent with the hypothesis that genetically mediated ethnic differences in muscle strength may exist(Reference Leong, Teo and Rangarajan31). However, factors other than ethnicity may also play a role, and further analysis of different ethnicities within the CLSA cohort would be able to address this question.
In this study, the education level for Hong Kong older adults is lower compared with Canadians. It has been observed that variations in muscle strength across populations may be partly attributed to differences in socio-economic status(Reference Sternang, Reynolds and Finkel32,Reference Botoseneanu, Bennett and Nyquist33) . A study of the UK population reported that individuals with lower socio-economic positions exhibited reduced muscle strength and an earlier onset of strength decline(Reference Carney and Benzeval34). Similarly, a Swedish study suggested a cross-sectional association between higher education level and stronger grip strength(Reference Sternang, Reynolds and Finkel32). It is possible that differences in socioeconomic position between the two cohorts may have contributed to the difference in grip strength. On the other hand, Hong Kong adults have superior performance in the 5-times CST, similar to values from studies on older adults in other Asian counties(Reference Lee, Choo and Pang35–Reference Gao, Xia and Wu39). This may be attributed to their leaner body types and lower BMI, which are associated with enhanced mobility and agility. These results are further supported by evidence from studies indicating that lower BMI is linked to better mobility performance in older adults(Reference Tsuji, Rantakokko and Portegijs40). The finding that Hong Kong males aged 65–75 years exhibited faster walking speeds than their Canadian counterparts, whereas the reverse was observed for older females aged 76 and 80 years, is intriguing and may highlight potential sex-specific ageing trajectories influenced by cultural, environmental or lifestyle factors. This observation emphasised the importance of considering both sex and cultural context in understanding physical function across ageing populations.
Anthropometric comparisons between the two populations yielded similar insights. Canadian males and females consistently had higher body weight and BMI across all age groups, reinforcing previous findings of higher obesity and central adiposity in Western populations compared with Asian populations(Reference Boutari and Mantzoros41). However, older Hong Kong females had higher WHR and C-index across all age groups. Although WHR has been used as an approximate indicator of abdominal obesity, the C-index has been shown to correlate significantly with hyperglycaemia, hypertriacylglycerolaemia, decreased high-density lipoprotein, elevated low-density lipoprotein and mortality(Reference Chung, Park and Chung42,Reference Zhang, Li and Ma43) . Its advantage lies in estimating total adiposity without requiring hip circumference measurements. The results of this study suggest that despite having lower BMI and body weight, Hong Kong older females may have more adverse fat distribution patterns, potentially indicating a higher risk of abdominal obesity. These findings highlight the potential for higher metabolic and CVD risks among older Hong Kong females, critical determinants of mortality risk. This increased risk could be attributed to hormonal changes after menopause, which are known to drive fat redistribution towards the abdomen(Reference Greendale, Han and Finkelstein44), as well as evidence showing that Asians are more prone to abdominal fat accumulation at the same BMI levels, resulting in higher C-index values(Reference Busetto, Dicker and Fruhbeck45,Reference Bays, Ng and Sicat46) . These findings underscore the need to prioritise older females with lower BMI but elevated WHR and C-index levels. Future research should explore postmenopausal fat redistribution and its differences across ethnic groups, providing insights to develop tailored interventions and population-specific reference ranges, rather than adopting a universal, ‘one-size-fits-all’ approach.
These differences in body composition and physical performance measures between Canadian and Hong Kong older adults likely result from the complex interplay of geographical, cultural, lifestyle, genetic, social and environmental factors. It is possible that the stark contrast in climate – Canada’s cold climate v. Hong Kong’s subtropical monsoon climate – may have a role in possibly influencing the evolutionary patterns of fat storage, dietary habits and physical activity levels across the regions. Specifically, previous studies have highlighted a well-established association between dietary protein intake, which varies by country, and muscle strength(Reference McLean, Mangano and Hannan47). Furthermore, dietary patterns also influence physical function and body composition in older adults(Reference Struijk, Guallar-Castillon and Rodriguez-Artalejo48,Reference Lengele, Grande de Franca and Rolland49) . The social and environmental contexts in which these two populations live are also markedly different. The high population density and spatial constraints in Hong Kong likely encourage more walking and climbing, while the high-stress social environment may negatively affect health behaviours and metabolism in older adults. In contrast, the more expansive, open spaces in Canada may lead to a lifestyle more dependent on transportation, with less emphasis on agility. Finally, disparities in education levels may contribute to observed differences.
This study is the first to compare normative reference ranges for two dimensions of healthy ageing indicators between older adults in Hong Kong and Canada, stratified by age and sex, that are clinically relevant. The age- and sex-specific stratifications enhance the utility and accuracy of these reference ranges that are required for diagnosis requiring normative values such as sarcopenia, overweight or obesity, leading to intervention strategies. While there may be consensus about conceptual definitions of these conditions(Reference Kirk, Cawthon and Arai10,Reference Rubino, Cummings and Eckel20) , there is debate on how these concepts may be operationalised in the clinical setting. Currently, there are two approaches to defining such values: using population reference ranges or relating values to adverse outcomes. The last approach may be more scientific, but values may vary depending on the outcome measured(Reference Woo18,Reference Woo, Leung and Morley28,Reference Studenski, Peters and Alley29) . From the clinical point of view, the first approach is often used. Using the diagnosis of sarcopenia as an example, the most widely used criteria are the European(Reference Cruz-Jentoft, Bahat and Bauer7) and the Asian(Reference Chen, Woo and Assantachai6). The European criteria include the following cut-off values for handgrip (< 27 kg for males; < 16 kg for females); chair stand (> 15 s) and walking speed (<= 0·8 m/sec), compared with the Asian criteria for handgrip (< 28 kg for males; < 18 kg for females); chair stand >= 12 s; and walking speed < 1·0 m/s. It is unclear whether these values were derived from population norms, as for the diagnosis of osteopenia or osteoporosis, or from a data-driven approach relating values to future adverse outcomes. The availability of population norms would facilitate an approach to diagnosis for osteoporosis. Consensus panels can agree on a percentile value as the cut-off for diagnosis, rather than specific values, in future recommendations. Studies providing normative values for some of these parameters have also been carried out in Italy(Reference Landi, Calvani and Martone11) and Singapore among older adults(Reference Pua, Tay and Clark37). These values differ slightly from consensus panel values within European and Asian countries, with greater differences between Europeans and Asians and also differ across age groups. A recent study used pooled data from some Asian countries to map normative muscle health metrics across the ageing continuum(Reference Chen, Meng and Peng14). These findings lend support to the use of ethnic and geographic norms in determining what cut-off values to use in the diagnosis of conditions dependent on anthropometric and physical performance measures.
However, certain limitations and uncertainties remain. While this study hypothesised potential reasons for the observed differences between populations, the underlying mechanisms are uncertain. It also remains unclear which reference range would best apply to individuals who migrate between countries or belong to ethnic minorities within a specific country. Further research would be able to address this point. Furthermore, it is not yet known whether factors such as ethnicity and genetics are more influential than social and geographic environments, or how long or to what extent environmental exposure is required to induce changes in these characteristics among older adults. Future research should focus on longitudinal changes in these healthy ageing indicators and the key determinants driving such changes and incident adverse health outcomes. Furthermore, given that there was a difference of 10 years between the baseline data collected in CLSA (2012–2015) and Os (2001–2003), differences in factors such as healthcare, lifestyle or technology may have impacted the measures.
There are limitations in this study, relating to the representativeness of the general population for the two cohorts, especially the Hong Kong Os study. For example, the baseline data from the Os study were not comparable with Hong Kong Census data. Nevertheless, the variables measured would not normally be included in general population survey data. Additionally, a potential limitation is the difference in walking speed measurements between the two cohorts. Although the literature suggests that both tests exhibit high reliability and consistency, this limitation should be considered in future cross-cultural studies, and ideally, standardised measurement tools and protocols should be used to enhance comparability across studies.
Conclusion
Reference values for physical function, body composition and anthropometric measures vary by geographic region and/or ethnicity for individuals of a given age and sex. These contextual factors should be carefully considered when interpreting healthy ageing indicators. Further research is needed to explore the potential determinants of these measures and to understand the factors driving longitudinal changes across different populations.
Acknowledgements
This research was made possible using the data/biospecimens collected by the Canadian Longitudinal Study on Aging (CLSA). Funding for the CLSA is provided by the Government of Canada through the Canadian Institutes of Health Research (CIHR) under grant reference LSA 94473 and the Canada Foundation for Innovation, as well as the following provinces, Newfoundland, Nova Scotia, Quebec, Ontario, Manitoba, Alberta and British Columbia. This research has been conducted using the CLSA Baseline Data from the Comprehensive Cohort (dataset version 7.0 was used), under application number ID 2310005. The CLSA is led by Drs Parminder Raina, Christina Wolfson and Susan Kirkland.
This study was funded by the Geriatric Research Fund, Department of Medicine & Therapeutics and the UBC Research Enrichment Fund in Population Health.
K. S.: Data curation, Formal analysis, Investigation, Methodology, Visualisation and Writing original draft. J. W.: Conceptualisation, Methodology, Project administration, Supervision, Draft of initial MS and Editing. J. L. was responsible for data management of the HK cohort and analysis. E. T. C. L. contributed to data handling and writing. K. L. S., S. E. S. and M. S. K. are responsible for data acquisition from the CLSA and contribute to writing of the MS. All authors read and approved the final version of the manuscript.
Data are available from the CLSA (www.clsa-elcv.ca) for researchers who meet the criteria for access to de-identified CLSA data.
All the derived data from the analysis used to support the findings of this study are available from the corresponding author upon reasonable request.
The authors declare no conflicts of interest.
The opinions expressed in this manuscript are the author’s own and do not reflect the views of the CLSA.

 Open access

