





1 Introduction
Thermal and stress effects play key roles in the interaction of light with solid materials[ Reference Feng, Wang, Liu, Sun, Fu, Ji, Liao and Tian 1 , Reference Kim, Kim, Joung, Choi and Koo 2 ]. Lasers with short wavelengths[ Reference Lin, Stehlin, Soppera, Zan, Li, Wieder, Ponche, Berling, Yeh and Wang 3 , Reference Rim, Chen, Liu, Bae, Kim and Yang 4 ] and ultrashort pulse durations[ Reference Malinauskas, Žukauskas, Hasegawa, Hayasaki, Mizeikis, Buividas and Juodkazis 5 , Reference Sugioka and Cheng 6 ] are popularly chosen to suppress thermal effects besides optimizing laser parameters. As for the stress effects, a typical strategy is to eliminate the nonuniform stresses, which can be realized by manipulating structured light fields, for example, homogenizing beam profiles[ Reference Kana, Bollanti, Di Lazzaro, Murra, Bouba and Onana 7 , Reference Catela, Liang, Vistas, Garcia, Tibúrcio, Costa and Almeida 8 ] and rotating light intensity for drill-like effects[ Reference Yamane, Sakamoto, Murakami, Morita and Oka 9 – Reference Brimis, Makris and Papazoglou 14 ]. The rotation speed was obtained at the 0–103 Hz level based on the rotating Doppler effect[ Reference Arlt, MacDonald, Paterson, Sibbett, Dholakia and Volke-Sepulveda 15 ]. Up to 100 MHz is available by acousto-optic modulation[ Reference Franke-Arnold, Leach, Padgett, Lembessis, Ellinas, Wright, Girkin, Ohberg and Arnold 16 ]. By utilizing electro-optical modulation, even the gigahertz level is achievable[ Reference Sakamoto, Oka, Morita and Murakami 17 ]. All-optical manipulation by laser interferences[ Reference Yamane, Sakamoto, Murakami, Morita and Oka 9 , Reference Kontenis, Gailevičius, Jukna and Staliūnas 11 ] has boosted the rotating velocity to the 10 THz order.
In fact, the currently reported methods of light field rotation can be referred to as intrapulse rotation (a continuous beam can be regarded as a pulse with a very long pulse width). To achieve multiple rotations within a single pulse, the pulse width must be significantly longer than the rotation period. This requirement limits our efforts to further improve laser processing quality by combining the low thermal effects of ultrashort pulses with the homogenizing effects of rotation. For instance, in a 100-fs laser pulse, if the light intensity undergoes more than five full rotations, the rotation period must be less than 20 fs, corresponding to a rotation speed exceeding 50 Trad/s (tera-radians per second). Such an ultrafast rotation significantly surpasses the timescale of thermal conduction, thereby limiting its practical applications[ Reference Kontenis, Gailevičius, Jukna and Staliūnas 11 , Reference Butkus, Jukna, Paipulas, Barkauskas and Sirutkaitis 18 ]. Conversely, if the rotation speed is slower than 10 Trad/s, the intensity rotates less than once within the pulse duration, substantially diminishing the rotational effect. Fortunately, the dilemma above can be overcome in scenarios involving laser–solid interactions through multi-pulse accumulation at high repetition rates. In such cases, thermal and stress effects can be homogenized by using structured light with interpulse intensity rotation rather than intrapulse rotation. Interpulse rotation can be achieved by controlling the azimuth-dependent intensity distribution by shot-to-shot control. However, this requires precise shot-to-shot control of the carrier-envelope phase (CEP), which currently relies on a sophisticated device, thus restricting the achievable repetition rate.
This paper proposes an interesting and efficient alternative to shot-to-shot control for homogenizing thermal and stress effects in multi-pulse accumulation by introducing stochastic shot-to-shot intensity rotation in an ultrafast laser. In our setup, a laser system is used with free-running CEP, which is analyzed and confirmed to exhibit largely stochastic fluctuation. This stochasticity enables the generation of ultrafast light fields with random shot-to-shot intensity rotation through an entirely passive optical setup – a specifically designed optical parametric amplification (OPA) system, which operates effectively across a wide range of repetition rates, limited only by the driving laser source. Unlike some spatiotemporal coupled optical fields with angular dispersion[ Reference Forbes, Oliveira and Dennis 19 , Reference Lin, Feng, Cai, Lu, Zeng, Wang, Xu, Li and Yuan 20 ], the shot-to-shot stochastic rotating beam is generated via the interference of vortex modes, making it scalable in power by conventional laser amplification without compromising temporal or spectral properties. This work may provide an effective method to produce a drill-like laser with great suppression of thermal and stress effects, having great potential for applications in precision laser processing and other high-field scenarios.
2 Principle
The ultrafast laser with intrapulse rotating intensity can be generated by the coherent superposition of two vortex pulses with the topological charges of l 1 and l 2, which can be expressed as follows:
 $$\begin{align}E_1&= E_{l1}\left(r,t\right)\exp \left(- i\omega _1t+ i l_1\theta + i\phi _1\right),\end{align}$$
 $$\begin{align}E_2&= E_{l2}\left(r,t\right)\exp \left(- i\omega _2t+ i l_2\theta + i\phi _2\right).\end{align}$$
Here, E l1 and E l2 describe the amplitudes and ω 1 and ω 2 are the angular frequencies of the two pulses with the initial phases of ϕ 1 and ϕ 2, respectively, while r and θ represent the radial coordinate and azimuth angle, respectively. The corresponding superposition light intensity shall be as follows:
 $$\begin{align}{I}_{\mathrm{s}}\left(r,\theta, t\right)&=\left| E_{l1}^2\right|+\left| E_{l2}^2\right|\nonumber\\& \quad+2\operatorname{Re}\left\{ E_{l1}\left(r,t\right) E_{l2}^\ast\left(r,t\right)\exp \left[i\left(\varPsi_{1}-\varPsi_{2}\right)\right]\right\},\end{align}$$
with Ψ 1 and Ψ 2 representing the phases of E 1 and E 2, respectively, Δl = l 1 – l 2 and Δω = ω 1 – ω 2. Obviously, the structured light intensity I s(r,θ, t) has a petal-like spatial intensity profile, depending on ΔΨ = Ψ 1 – Ψ 2 = –Δωt + Δlθ + (ϕ 1 – ϕ 2). The angular orientation θ at the peak of the intensity depends on the following:
 $$\begin{align}\theta =\frac{2 m\pi +\left(\phi _2-\phi _1\right)+\Delta \omega t}{\Delta l},\end{align}$$
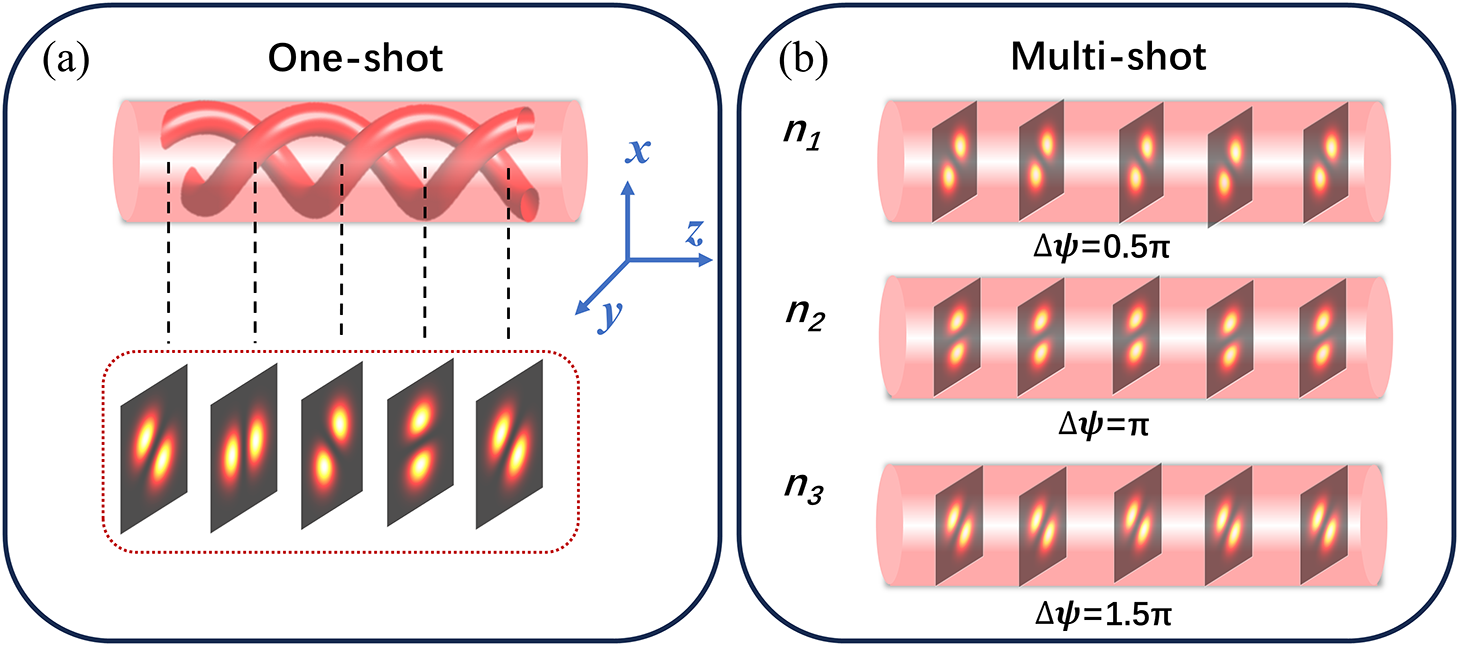
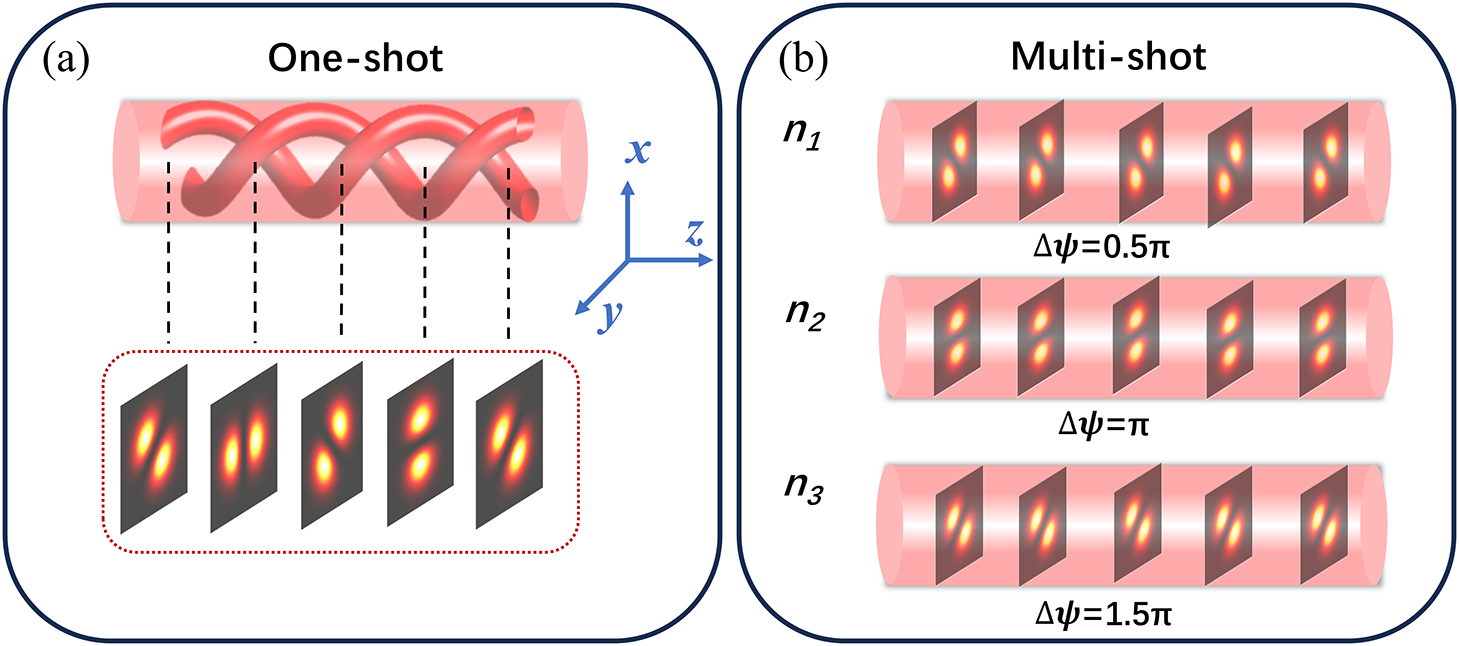
where m is an integer. If ∆ω ≠ 0, it is t-dependent. According to Equation (4), for a constant ∆Ψ + (ϕ 2 – ϕ 1), the light field has a transverse intensity I s(r,θ, t) rotating with time t by a constant angular velocity Ω = dθ/dt = ∆ω/Δl, or its intensity petals rotate with t for a given transverse section, so we call it the intrapulse intensity-rotating light field (intra-PIRLD) as shown in Figure 1(a). Otherwise, if ∆Ψ is shot-to-shot controlled, it is an interpulse intensity-rotating light field (inter-PIRLD), where the transverse intensity of the light field has a t-independent structure, but it relatively rotates by shot-to-shot control as shown in Figure 1(b). Due to the t-independence of the transverse intensity, we name both of them drill-like lasers.
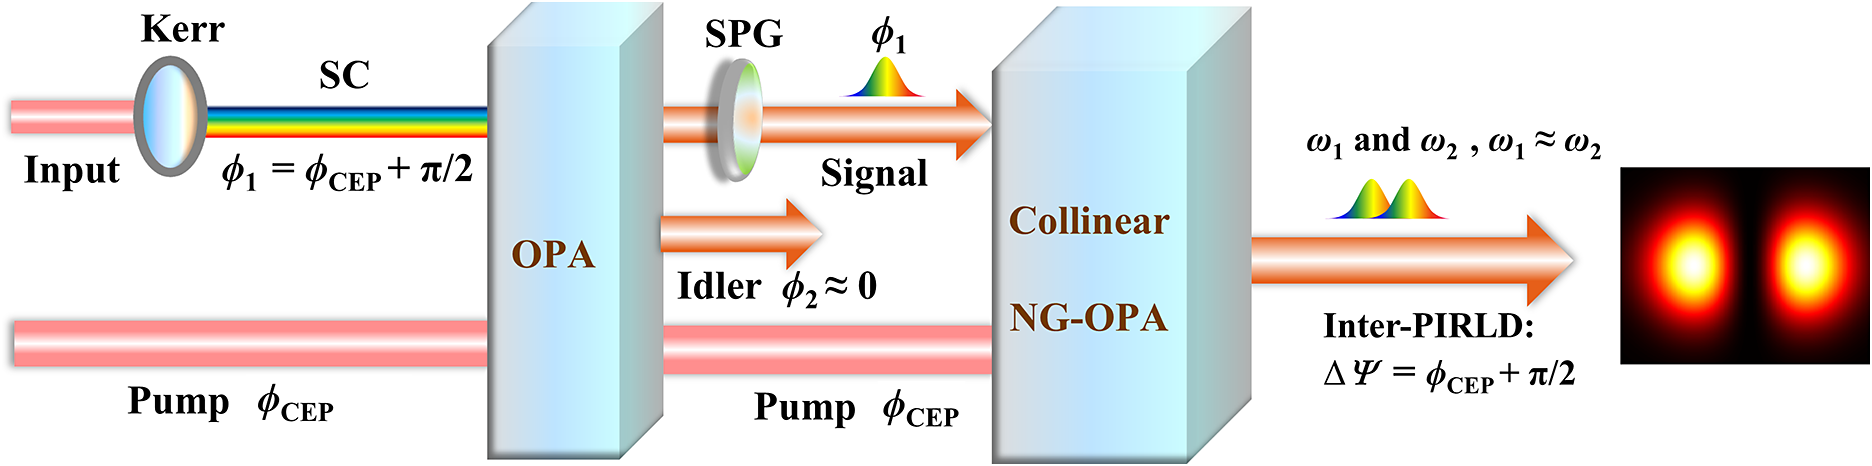
In the inter-PIRLD, for a given ∆Ψ, azimuthal angle θ can be manipulated by controlling ϕ 2 – ϕ 1. Consequently, the shot-to-shot stochastically rotating intensity can be obtained by randomizing the value of ϕ 2 – ϕ 1, which is realized via two cascade OPA-based amplifiers, as illustrated in Figure 2. In the first non-collinear OPA-based amplifier (NC-OPA), the pump is a femtosecond laser with an unlocked CEP, which is used to amplify part of its super-continuum (SC) to get a signal for the next near-degenerate collinear OPA-based amplifier (COPA). The vortex phase is added to the signal with a broadband Q-plate to carry a topological charge of l 1, so through the COPA, the idler is generated with a topological charge of l 2, and l 1 + l 2 = 0. Accordingly, light interference occurs between the signal and the idler, depending on the initial phase difference Δϕ = ϕ 2 – ϕ 1 for the near-degenerate configuration with Δω ≈ 0.
Schematic of the intra-PIRLD (a) and inter-PIRLD (b).
Schematic of the inter-PIRLD with the initial CEP being the same as the pump via two-stage cascade OPA. SC, super-continuum; SPG, spiral phase generator; NC-OPA, non-collinear OPA-based amplifier at the first stage; COPA, collinear OPA-based amplifier at the second stage.
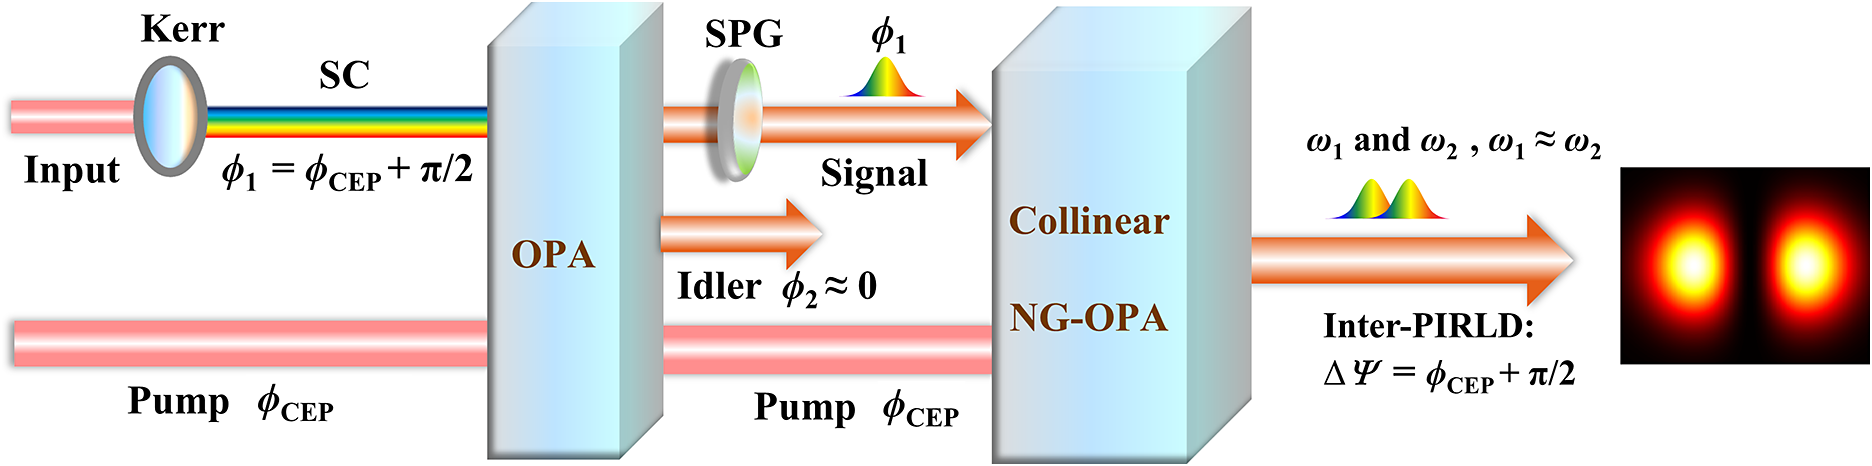
To be specific, according to three-wave coupling equations[ Reference Manzoni, Mücke, Cirmi, Fang, Moses, Huang, Hong, Cerullo and Kärtner 21 ], the part of the amplified SC keeps its CEP ϕ 1 to be ϕ CEP + π/2[ Reference Manzoni, Mücke, Cirmi, Fang, Moses, Huang, Hong, Cerullo and Kärtner 21 , Reference Cerullo, Baltuška, Mücke and Vozzi 22 ]. After modulation by a spiral phase generator (SPG) with a topological charge of l 1, the signal phase becomes ϕ 1 = ϕ CEP + π/2 + l 1 θ. Consequently, in the subsequent COPA, the generated idler has a topological charge of l 2 = –l 1 due to topological charge conversion; meanwhile, it has a stable CEP due to phase matching, ϕ 2 = l 2 θ. The signal and the idler of the COPA have the same polarization state, so they superimpose each other by a phase difference of Δωt + π/2 + 2l 1 θ + ϕ CEP, which is t, θ and ϕ CEP-dependent. Therefore, the inter-PIRLD is available by controlling ϕ CEP. The randomization of ϕ 2 – ϕ 1 is available by randomizing the pump CEP output from a femtosecond laser amplifier.
For a femtosecond laser, an oscillator is included with a high repetition rate, for example, 87.6 MHz, whose output pulses are picked out and amplified with a much lower repetition rate, 800 Hz in our setup. As is known, the absolute CEP variation of a laser pulse train can be unwrapped by the range of 0 ≤ ϕ CEP ≤ 2π, so the CEP variation between successive shots of an amplifier can be expressed by the following[ Reference Han, Wei, Zhang and Nie 23 ]:
 $$\begin{align}\Delta \phi_{\mathrm{CEP}}= \mathrm{Mod}\left[\left(k\Delta \phi_{\mathrm{slip}}+\sum \limits_{i=1}^k\delta \phi_{i}+\delta \phi_\mathrm{amp}\right),2\pi \right].\end{align}$$
Here k = f osc/f amp is the number of oscillator pulses between two consecutive amplified shots. The operator Mod [m, 2π] denotes the remainder after division by 2π. On the right-hand side of Equation (5), Δϕ slip represents the CEP slip between successive oscillator shots, while ∑ represents the accumulation of the noise δϕi in the oscillator from i = 1 to k, and δϕ amp corresponds to the intrinsic noise of the amplifier. In general, for oscillators with an uncontrolled CEP, the shot-to-shot CEP fluctuates due to perturbations from CEP slippage by a very weak stochastic trend[ Reference Helbing, Steinmeyer, Stenger, Telle and Keller 24 , Reference Apolonski, Poppe, Tempea, Spielmann, Udem, Holzwarth, Hänsch and Krausz 25 ]. By contrast, the CEP of the output from the amplifier exhibits unpredictable randomized CEP distributions due to its significant intrinsic noise sources and accumulated shot-to-shot CEP slippages[ Reference Han, Wei, Zhang and Nie 23 , Reference Zhu, Du, Wang, Teng, Han, Wei and Hou 26 ]. In the amplifier, the intrinsic noise is primarily dominated by intensity jitter, beam pointing variations in stretcher–compressor assemblies, nonlinear effects and environmental temperature/pressure fluctuations, which are substantially stronger than those in the oscillator. The amplifier repetition rate is much lower than the oscillator repetition rate (f osc/f amp ≈ 10–5). Consequently, CEP slip and oscillator noise accumulate over k pulses and, together with amplifier intrinsic noise, lead to an adequately stochastic CEP at the amplifier output.
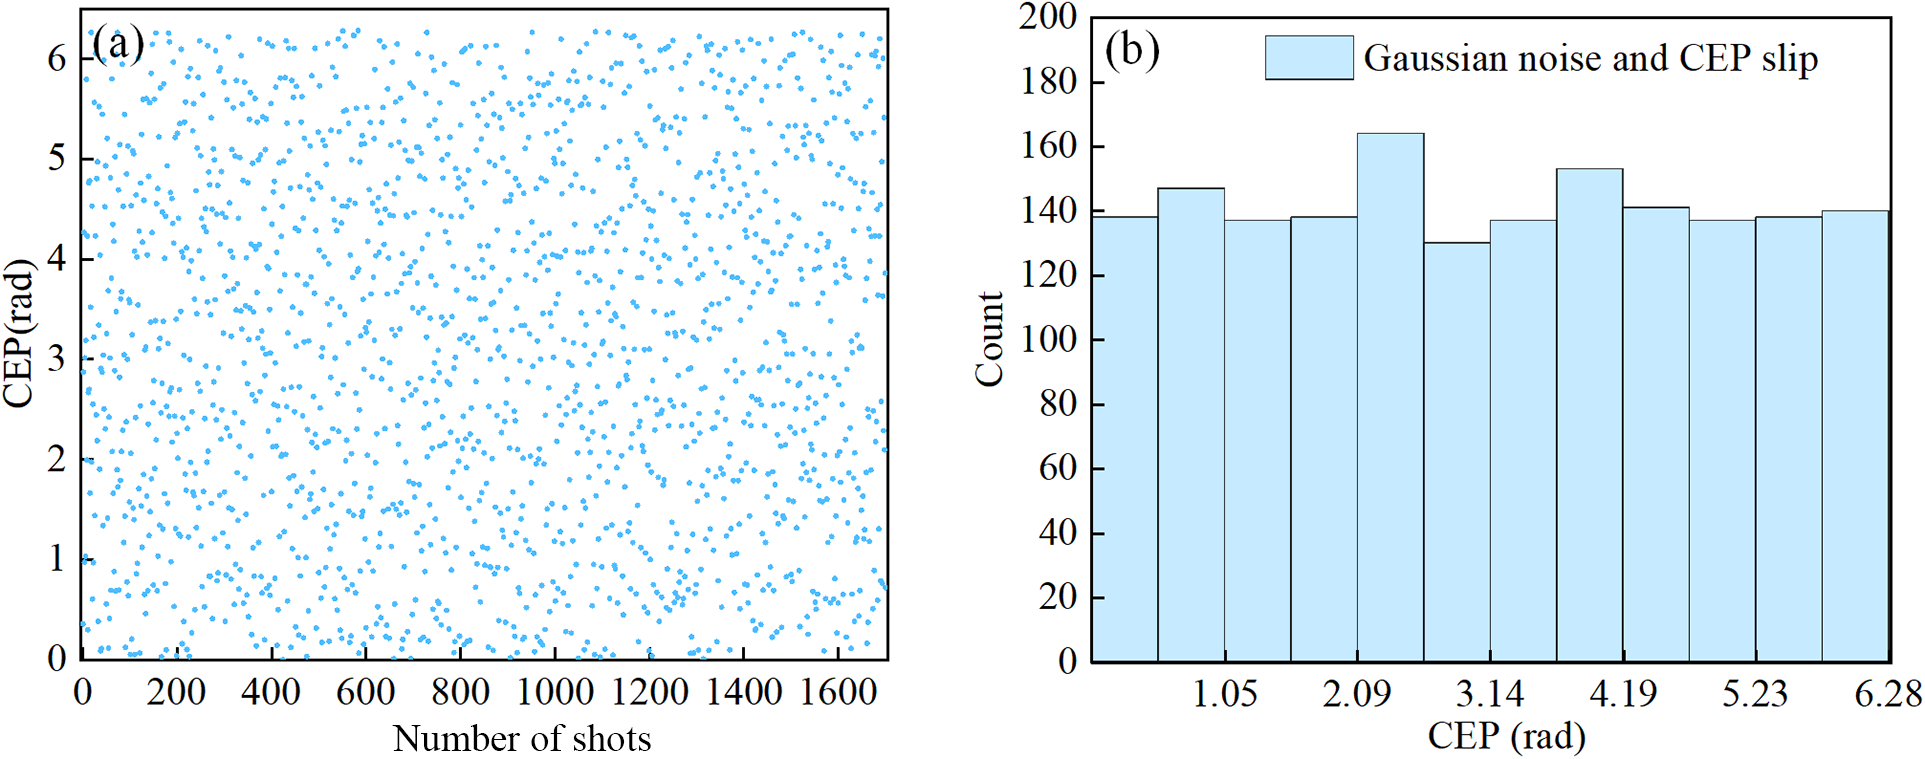
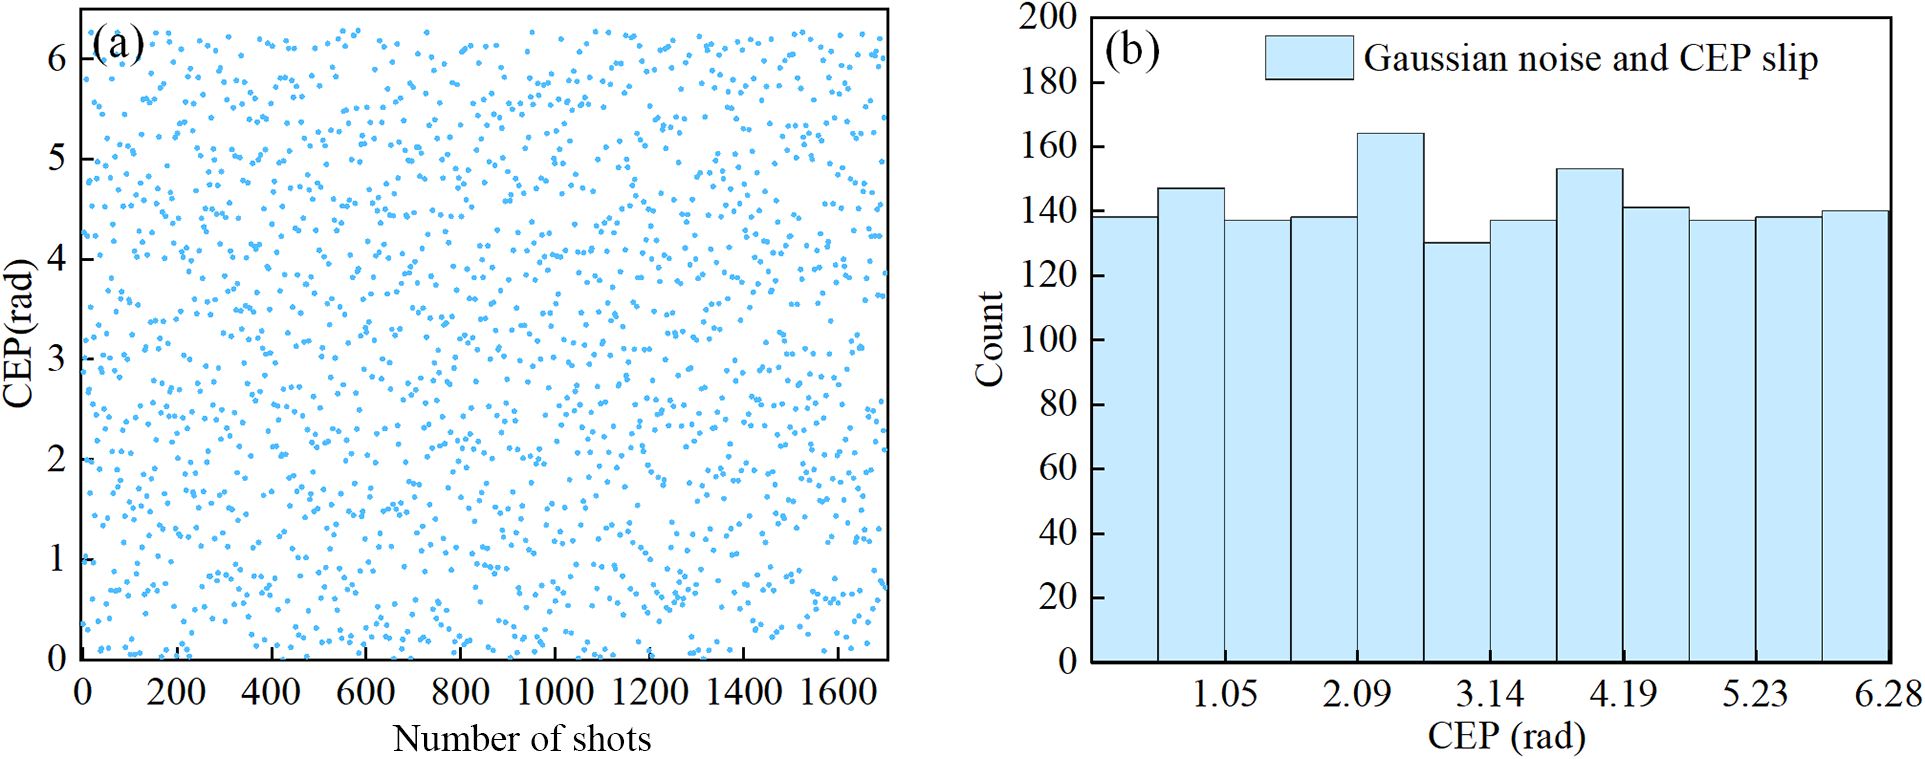
In our simulation, the Δϕ slip of each output pulse of the laser oscillator is typically estimated to be 1.5 rad. For practical experimental environments, according to the model analyses of amplifier noise[ Reference Han, Wei, Zhang and Nie 23 , Reference Helbing, Steinmeyer, Stenger, Telle and Keller 24 , Reference Zhu, Du, Wang, Teng, Han, Wei and Hou 26 , Reference Kakehata, Fujihira, Takada, Kobayashi, Torizuka, Homma and Takahashi 27 ], the CEP drift can be estimated as 0.08 rad by beam pointing fluctuations, 0.04 rad due to a temperature fluctuation of 0.01 K and 0.2 rad by laser intensity variation. Based on the above estimations, if the data collection lasts about 1 min, a random Gaussian noise is considered to be approximate 20% of the single-oscillator-pulse CEP slippage value. Figure 3(a) presents the simulation result of a laissez-faire CEP distribution, while Figure 3(b) is the interval statistical chart of CEP distribution, including CEP slips and Gaussian noise. One can see that the ultrafast interpulse rotating optical field generated by the pulse train from such an amplifier will exhibit unpredictable rotation by shot-to-shot control.
Theoretical simulation of the shot-to-shot CEP distributions of the pulses from a laser amplifier for 1700 shots: (a) scatter plot; (b) the interval statistical chart of CEP distribution with CEP slips and Gaussian noise.
3 Experimental setup and implementation
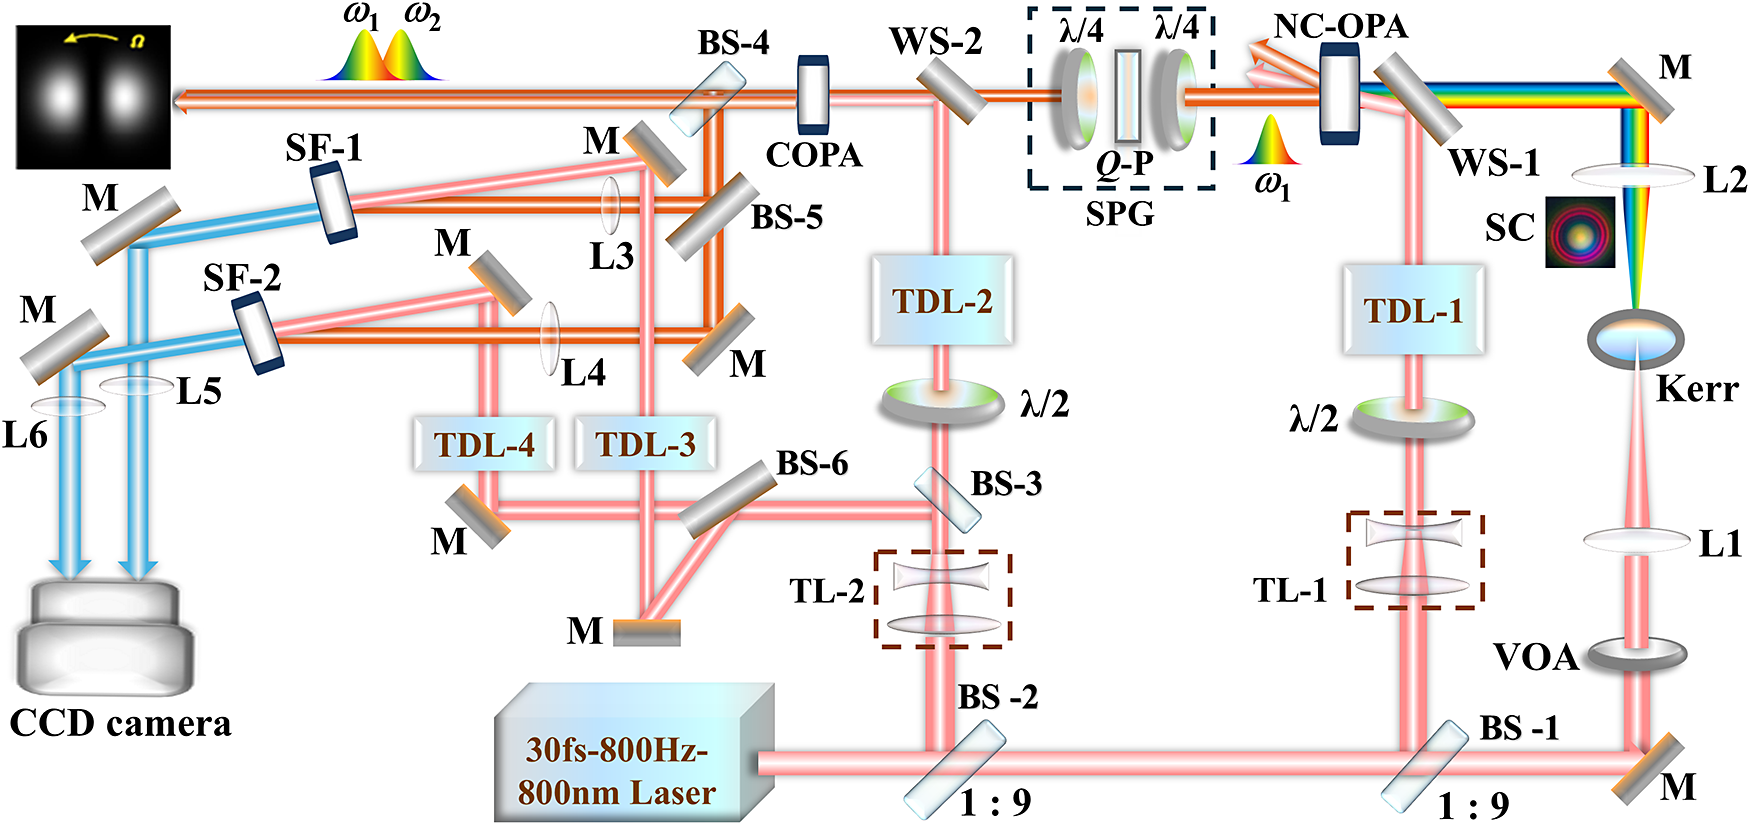
Figure 4 shows our experimental setup, where an approximately 30-fs–0.64-W–800-Hz–800-nm amplifier serves as the light source. The output pulse train of the source is split into three parts by two identical beam splitters (BS-1 and BS-2, T:R = 1:9). After passing through a variable optical attenuator (VOA), the transmission part through BS-2 and BS-1 (about 60 mW) is focused onto a Kerr medium, a 3-mm-thick sapphire plate, via a convex lens L1 (f = 500 mm) to generate an SC, which has the almost same CEP as its pump. A convex lens L2 (f = 75 mm) is used to collimate the SC, which is seeded as the signal to the subsequent NC-OPA by a non-collinear angle of approximately 1° with the pump. The NC-OPA is pumped by the 800 nm laser reflected by BS-1, whose spatial size can be changed with a telescope (TL-1, f 1 = 400 mm and f 2 = –75 mm). The amplified signal, whose central frequency can be tuned by changing the relative delay between the SC and its pump, is subsequently directed into an SPG, including a broad Q-plate between two quarter-wave plates, then it is seeded as the signal into a COPA. The pump of the COPA is the reflected beam by BS-2, and its beam size is changeable by another telescope optic (TL-2, f 1 = 300 mm and f 2 = –100 mm). Because the pump carries no spiral phase, its idler has a conjugated topological charge of its signal. Meanwhile, the conservation of energy forces the near-degenerate COPA to have its idler with a central frequency away from that of the signal. As a result, the collinear signal and idler of the COPA coherently superimpose to form an inter-PIRLD. In our experiment, a broadband Q-plate is chosen with a topological value of 1, so the inter-PIRLD intensity has two petal-like structures. The crystals used in these two stages of amplification are both type-I barium borate (BBO) crystals, with a cutting angle of 19.8° and a thickness of 2 mm.
Experimental setup of the inter-PIRLD. M, mirror; L1–L6, lenses; BS-1–BS-6, beam splitters; WS-1, WS-2, wavelength separators; λ/2, half-wave plate; λ/4, quarter-wave plate; TDL-1–TDL-4, time delay lines; Kerr, sapphire; VOA, variable optical attenuator; SPG, spiral phase generator; NC-OPA, non-collinear OPA-based amplifier; COPA, collinear OPA-based amplifier; TL-1, TL-2, telescopes; SF-1, SF-2, sum-frequency crystals.
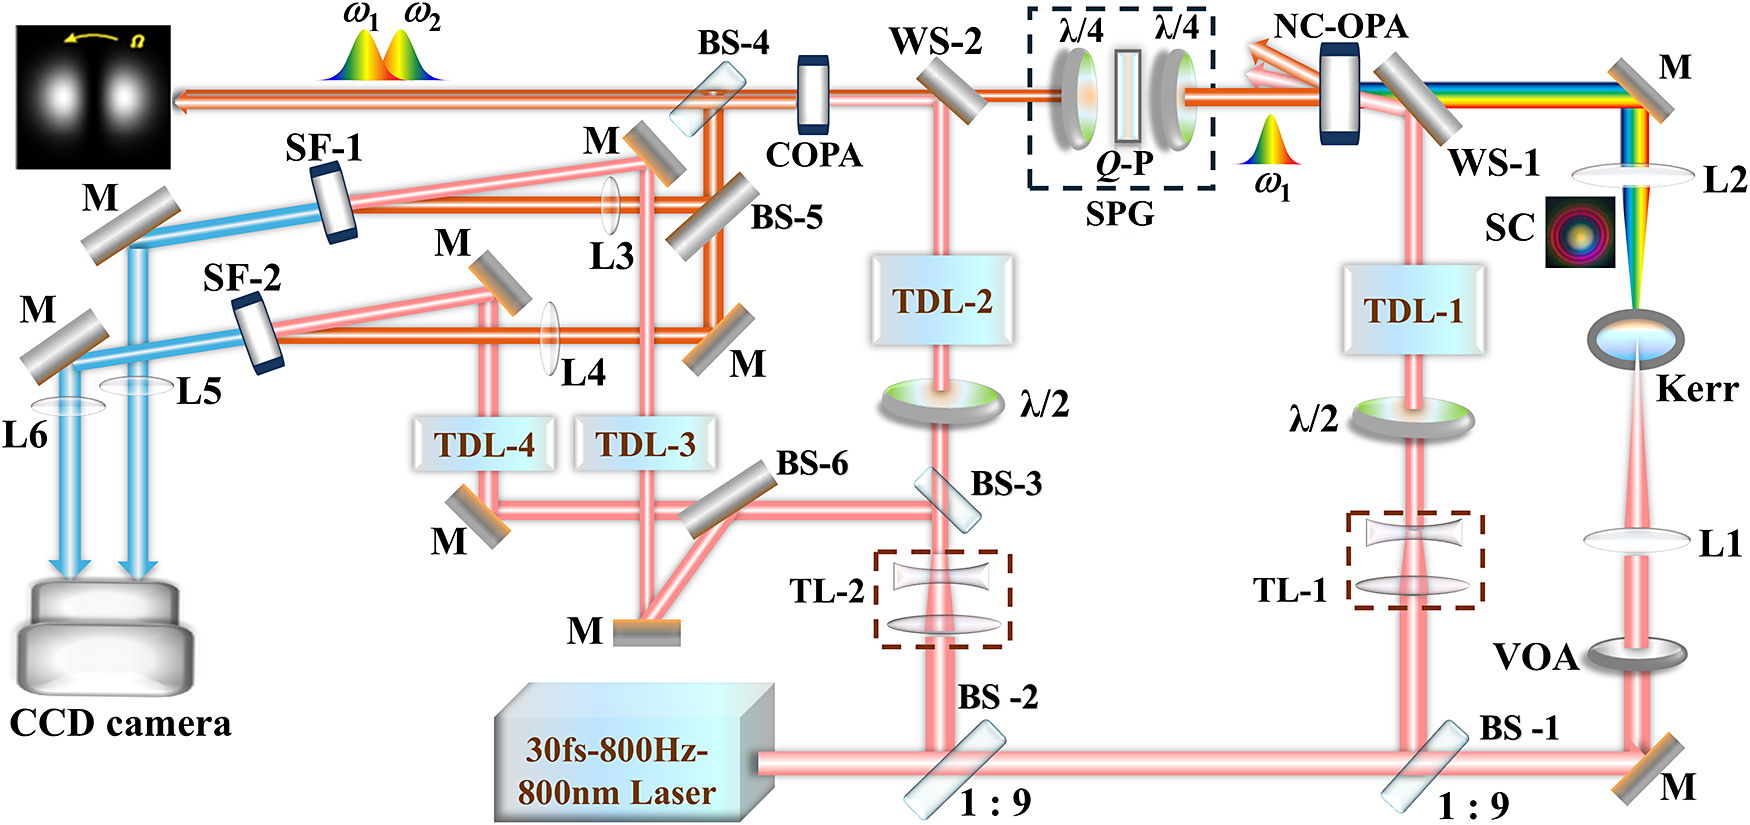
The generated inter-PIRLD has been characterized by nonlinear sum-frequency conversion. In order to check the intensity rotation, two sum-frequency crystals (SF-1 and SF-2, 0.2-mm-thick and 23.4°-cut β-BBO crystals) are used. As shown in Figure 4, the inter-PIRLD is sampled by approximately 0.16 W and divided equally into two beams, which are focused by two lenses (L3 and L4, f = 200 mm) into two sum-frequency crystals (SF-1 and SF-2), separately. Correspondingly, two probe beams are also extracted from the reflection of BS-2 and BS-3. Here, the relative time delay is temporally scanned for the incident beams to SF-1, but is constant for those to SF-2. Both the sum-frequency beams are finally captured by the same charge-coupled device (CCD; Basler ace acA2440-20gm).
4 Results and discussion
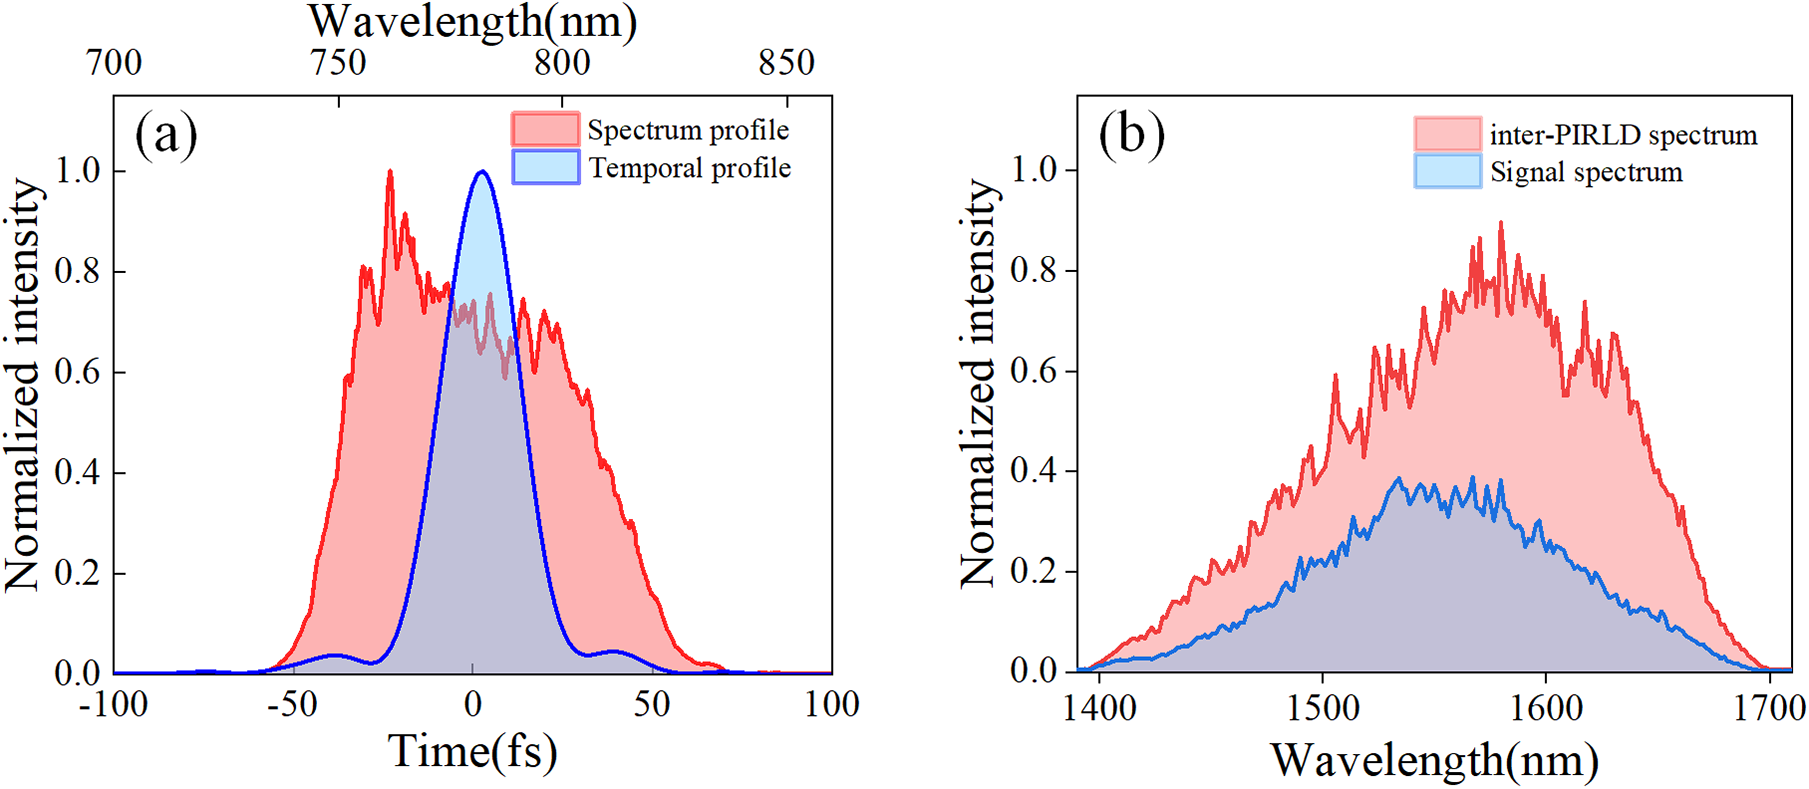
Figure 5(a) presents the output spectrum (red line) with a central wavelength of around 785 nm and a full width at half maximum (FWHM) of approximately 60 nm. The temporal profile of the output pulses is also measured as marked by the blue curve with a home-made spectral phase interferometry for direct electric-field reconstruction (SPIDER)[ Reference Cai, Chen, Zheng, Lin, Zeng, Li, Li and Xu 28 ], showing that the FWHM pulse duration is about 30 fs with a symmetric structure. Based on the above experimental arrangement, the SC excited by the 790 nm femtosecond pulses can extend up to 1.7 μm. TDL-1 is adjusted so that the SC is amplified around 1550 nm, as shown in Figure 5(b) by the red line. The pump intensity of the NC-OPA is found to be 50 GW/cm2. To estimate the gain of the NC-OPA, firstly, we record the spectrum of the supercontinuum seed by using a high-dynamic spectrometer based on InGaSe. Then we record the amplified spectrum (reducing the light intensity by a neutral density (ND) filter with a transmission of 0.01%) using the same spectrometer. Finally, we integrate the spectral intensity for both cases from 1400 to 1700 nm by taking into account the attenuation factor, and their ratio is the estimated gain of approximately 30,000.
Spectral and temporal characteristics of the pump and inter-PIRLD. (a) OPA pump spectrum (red) and temporal profile measured by the home-made SPIDER (blue). (b) Signal spectrum before the COPA (blue line) and the inter-PIRLD spectrum after the COPA (red line).
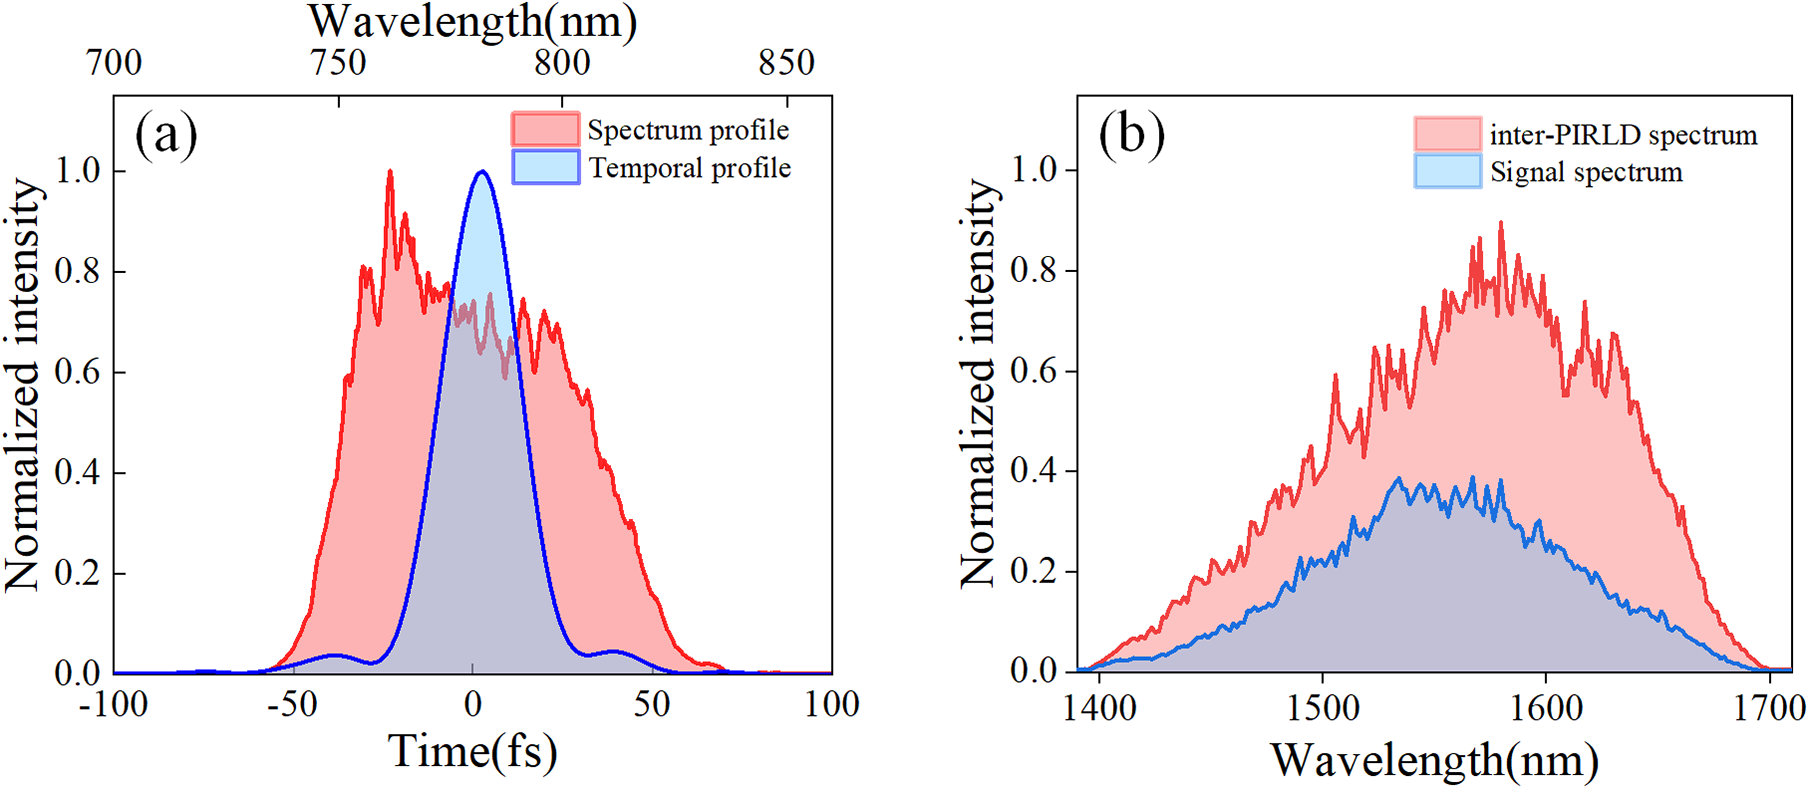
The 1550 nm signal is then amplified by the COPA, which is pumped under an intensity of 100 GW/cm2. Because this COPA works by collinear phase matching, o+o→e, the generated idler is spatially inseparable from the signal. The red curve in Figure 5(b) shows the combined spectrum of the amplified signal and idler after the COPA, with a centered wavelength around 1585 nm. The total power of the signal and the idler is about 320 mW by an OPA gain of approximately 104. The COPA operates in the near-degenerate regime, and the central wavelength shift compared to the seed spectrum can be attributed to its nonflat gain spectrum, high-gain saturation or cross-phase modulation (XPM) in such intense-pump, high-gain, broad-bandwidth OPA.
The inter-PIRLD images are recorded by the nonlinear sum-frequency, as shown in Figure 4. Traditionally, we detect the time-dependent spatial information by the pump–probe method. However, for shot-to-shot inter-PIRLD detection, the spatial information variations may be caused by the CEP variations of the pulses or the phase change within a pulse. Accordingly, we have designed a dual-line imaging method based on the sum-frequency. One line synchronizes two incident pulses, while the other can vary the time delay between the two incidences.
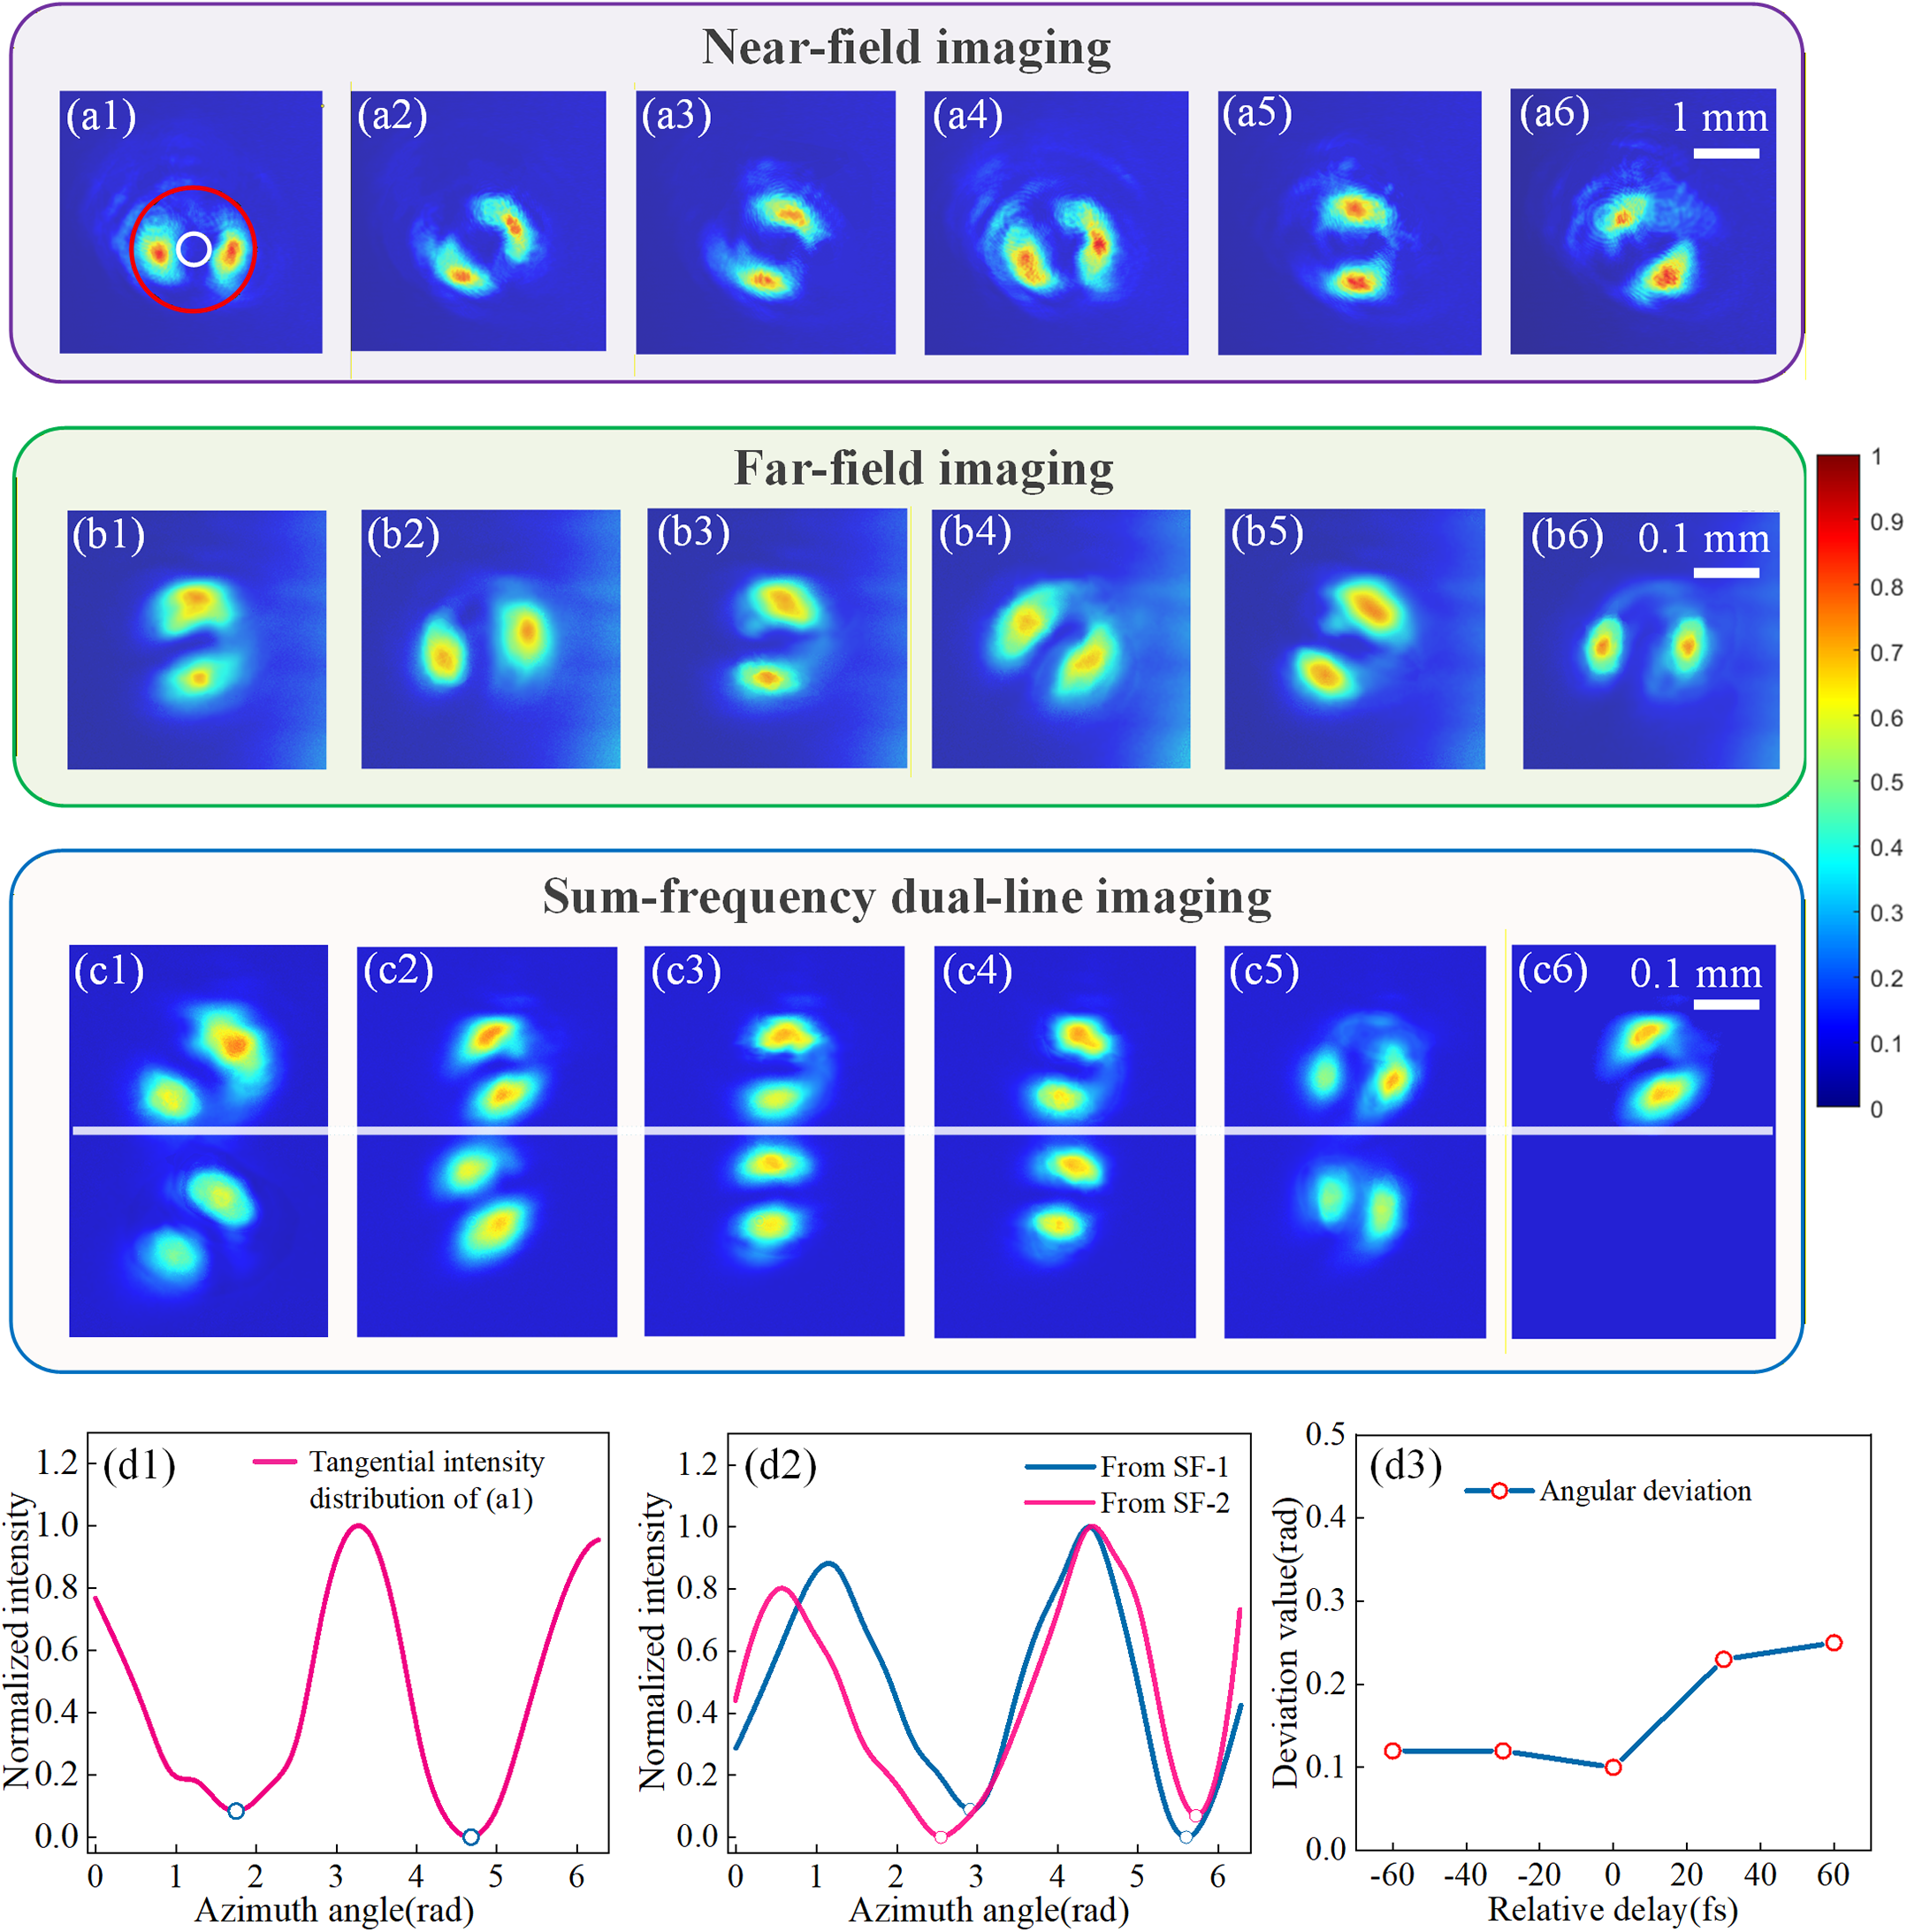
Figures 6(a1)–6(a6) are the recorded near-field images of the inter-PIRLD by imaging the COPA onto SF-1 and SF-2 with L3 and L4, respectively. The images clearly display the petal-like structures of the different inter-PIRLD shots with different orientations. If the COPA is set at the front focal plane, while SF-1 and SF-2 are at the rear focal planes of L3 and L4, the far-field inter-PIRLD can be recorded by a 1:10 4-f imaging system to enlarge the far-field images on the CCD cameras. As shown in Figures 6(b1)–6(b6), the far-field has similar petal-like structures to those in the near-field, which is easily explained by the fact that the inter-PIRLD is the superposition of the two near-Laguerre–Gaussian mode beams[ Reference Kontenis, Gailevičius, Jukna and Staliūnas 11 ]. Figure 6(d1) displays the tangential-intensity profile of the near-field image of the inter-PIRLD extracted from Figure 6(a1), which shows that the inter-PIRLD is the superposition of the two vortex beams with the topological charges of +1 and –1.
Intensity characteristics of the inter-PIRLD. (a1)–(a6) Six frames of near-field intensity distributions at different rotational orientations recorded by the CCD. (b1)–(b6) Six frames of far-field distributions of the inter-PIRLD (10×-magnification). (c1)–(c6) Single-shot two-frame sum-frequency patterns (10×-magnification) of temporal components in the far-field at the relative delay of (c1) –60 fs, (c2) –30 fs, (c3) 0 fs, (c4) 30 fs, (c5) 60 fs and (c6) 90 fs. (d1) Normalized intensity angular distribution of (a1). (d2) Intensity angular distribution of the two sum-frequency sub-inter-PIRLDs of (c1). (d3) Angular errors of the two sum-frequency sub-inter-PIRLDs at different relative time delays.
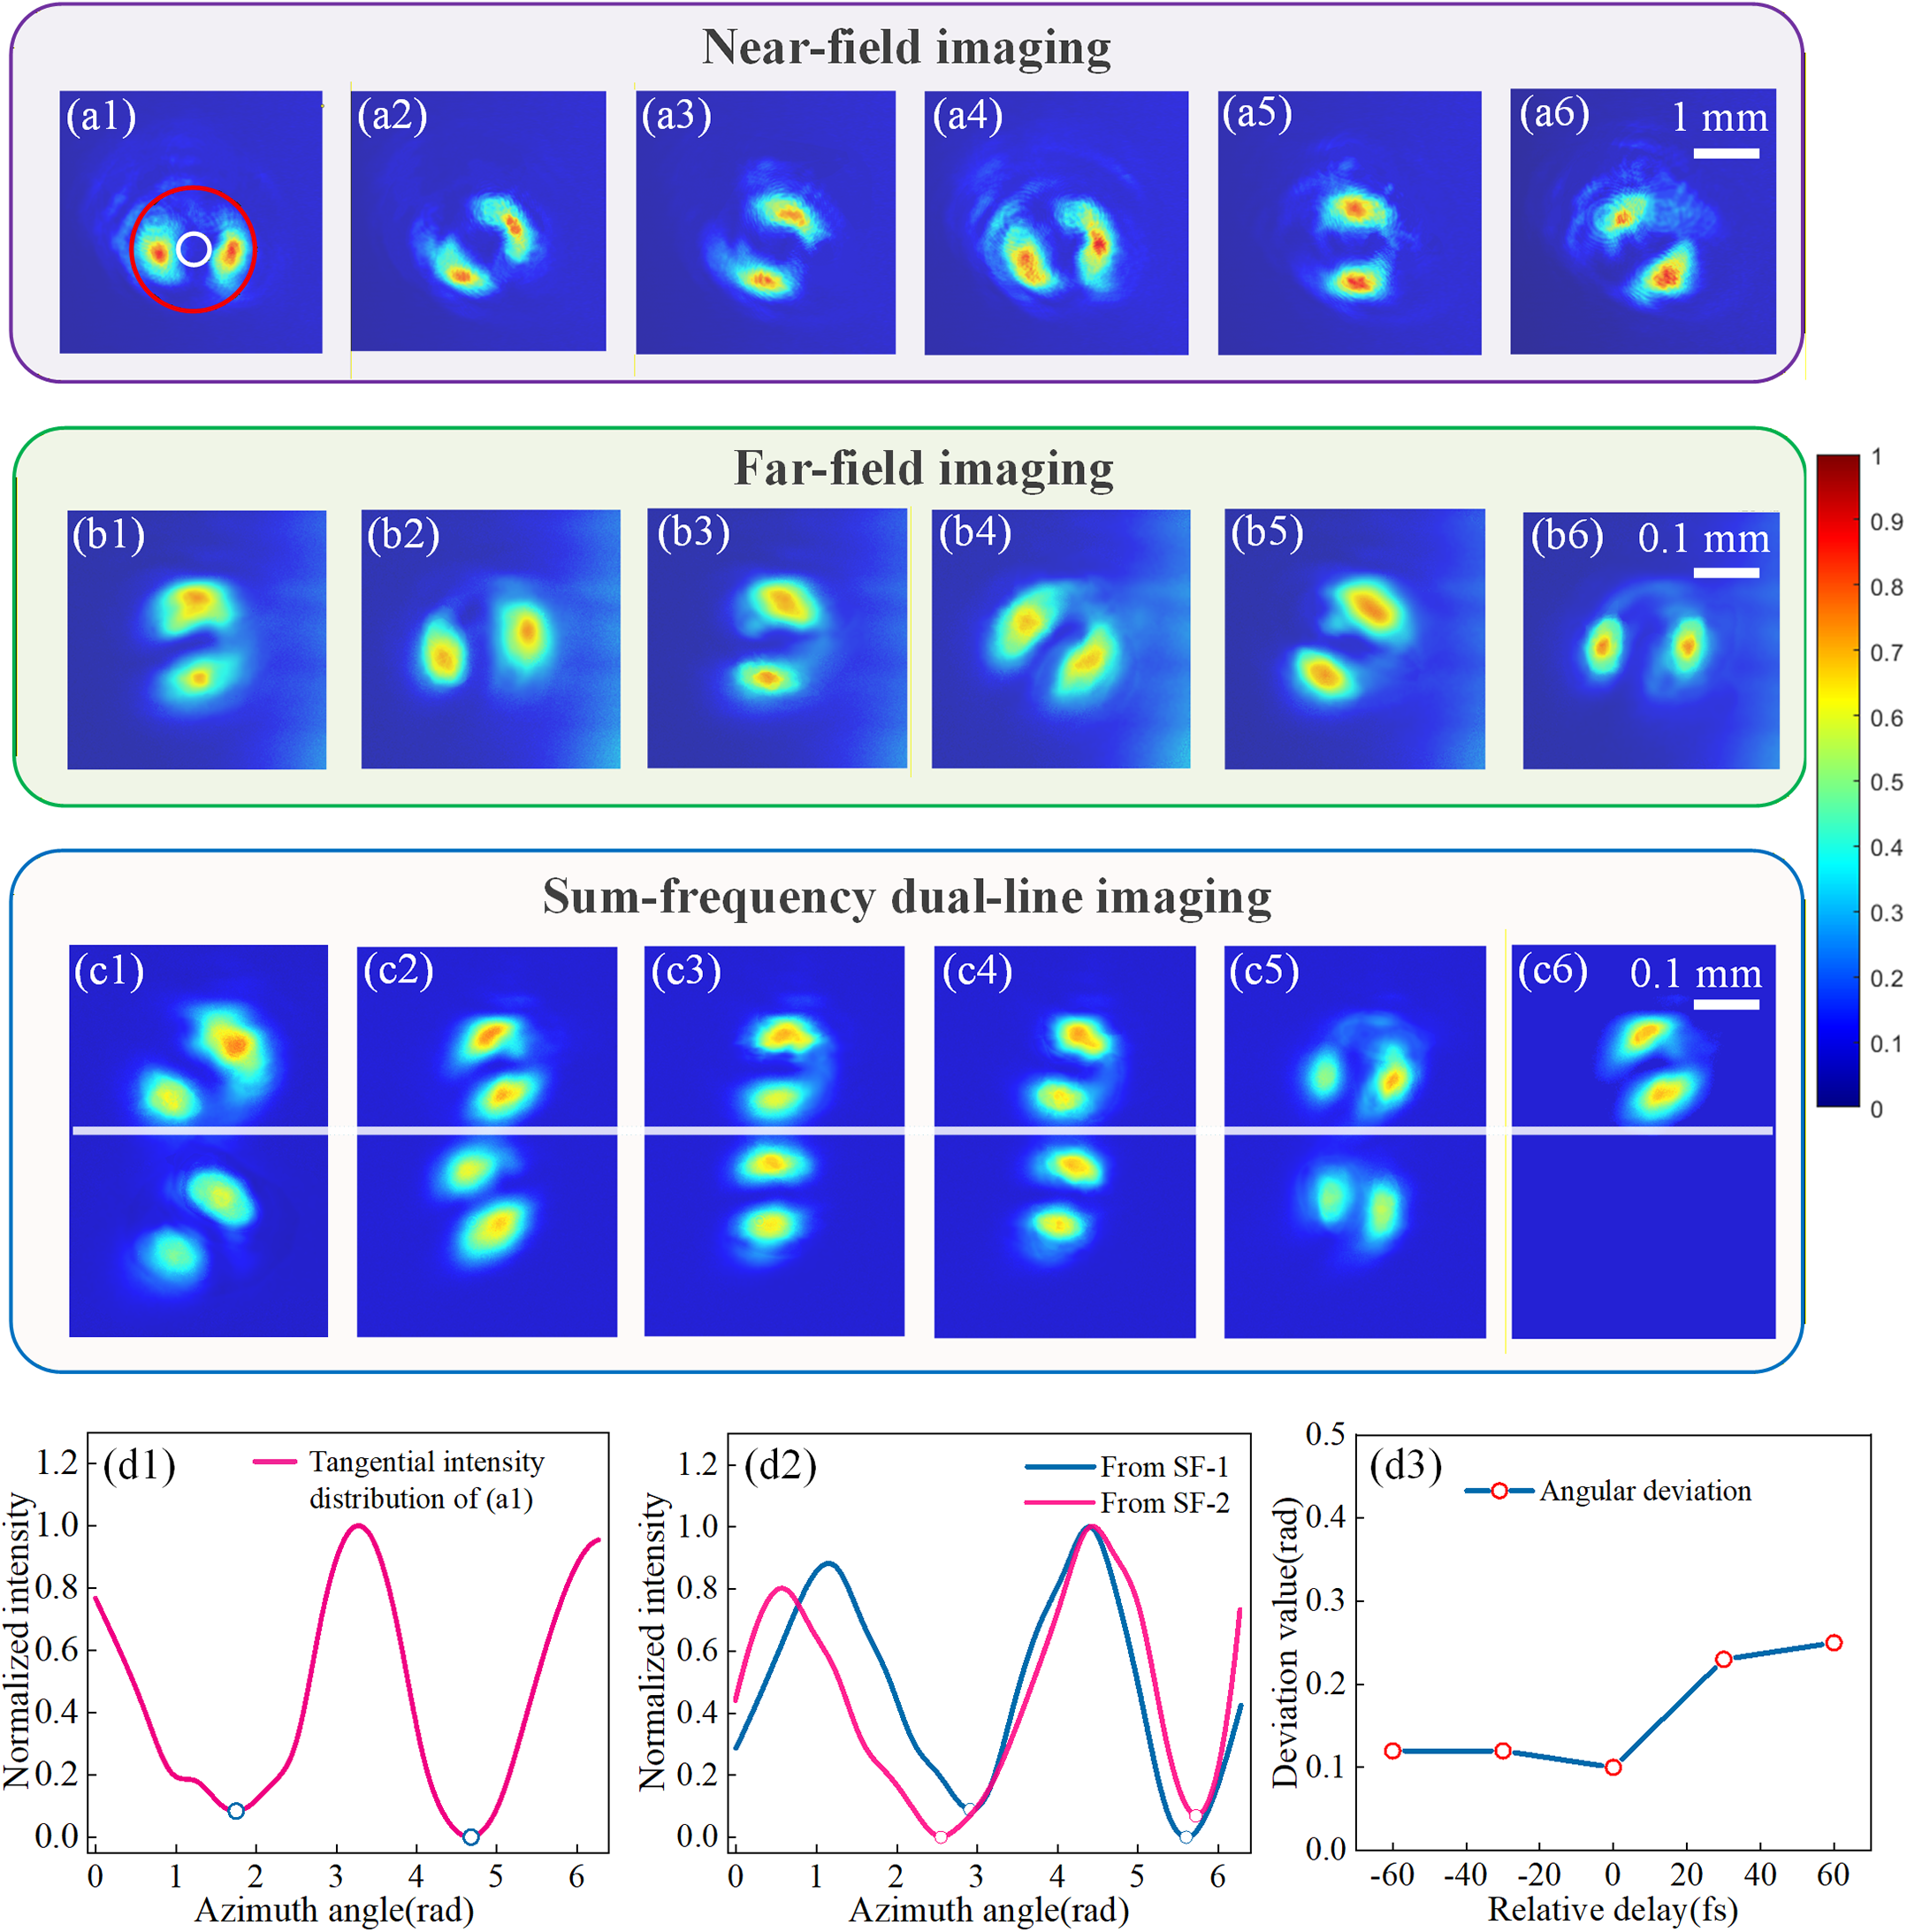
Figures 6(c1)–6(c6) show the measured results from SF-1 and SF-2. All the figures have recorded two beam spots. The upper ones are from SF-1 with two temporally synchronized incident beams, while the lower ones are from SF-2 with different time delays (–60, –30, 0, 30 or 60 fs) between its two incidences. In Figure 6(c6), the lower spot is too weak to be visible because it is recorded at a time far away from that of the peak intensity. Figure 6(c3) is recorded with zero time delay but a small azimuthal deviation is still there. The azimuthal deviations between the uppers and lowers have been calculated at 0.1 rad, which may be attributed to the calculation errors of tangential-intensity profiles, differences of two sum-frequency crystals and diffraction/nonlinear effects of the two beam paths. At the delay of 60 fs, the error is 0.25 rad. The azimuthal root mean squared error is calculated as 0.06 rad for these time delays. From these figures, we can see that, in spite of the different time delays, all the upper spots almost keep the same azimuth-dependent intensity profiles as their lower counterparts. Accordingly, it can be concluded that within a temporal scale (~120 fs), the azimuth-dependent intensity profile of the inter-PIRLD can be deemed to be unchanged. In other words, the orientation variations of the petal-like structures of different inter-PIRLD shots result from the CEP fluctuations of the shot-to-shot seed pulses.
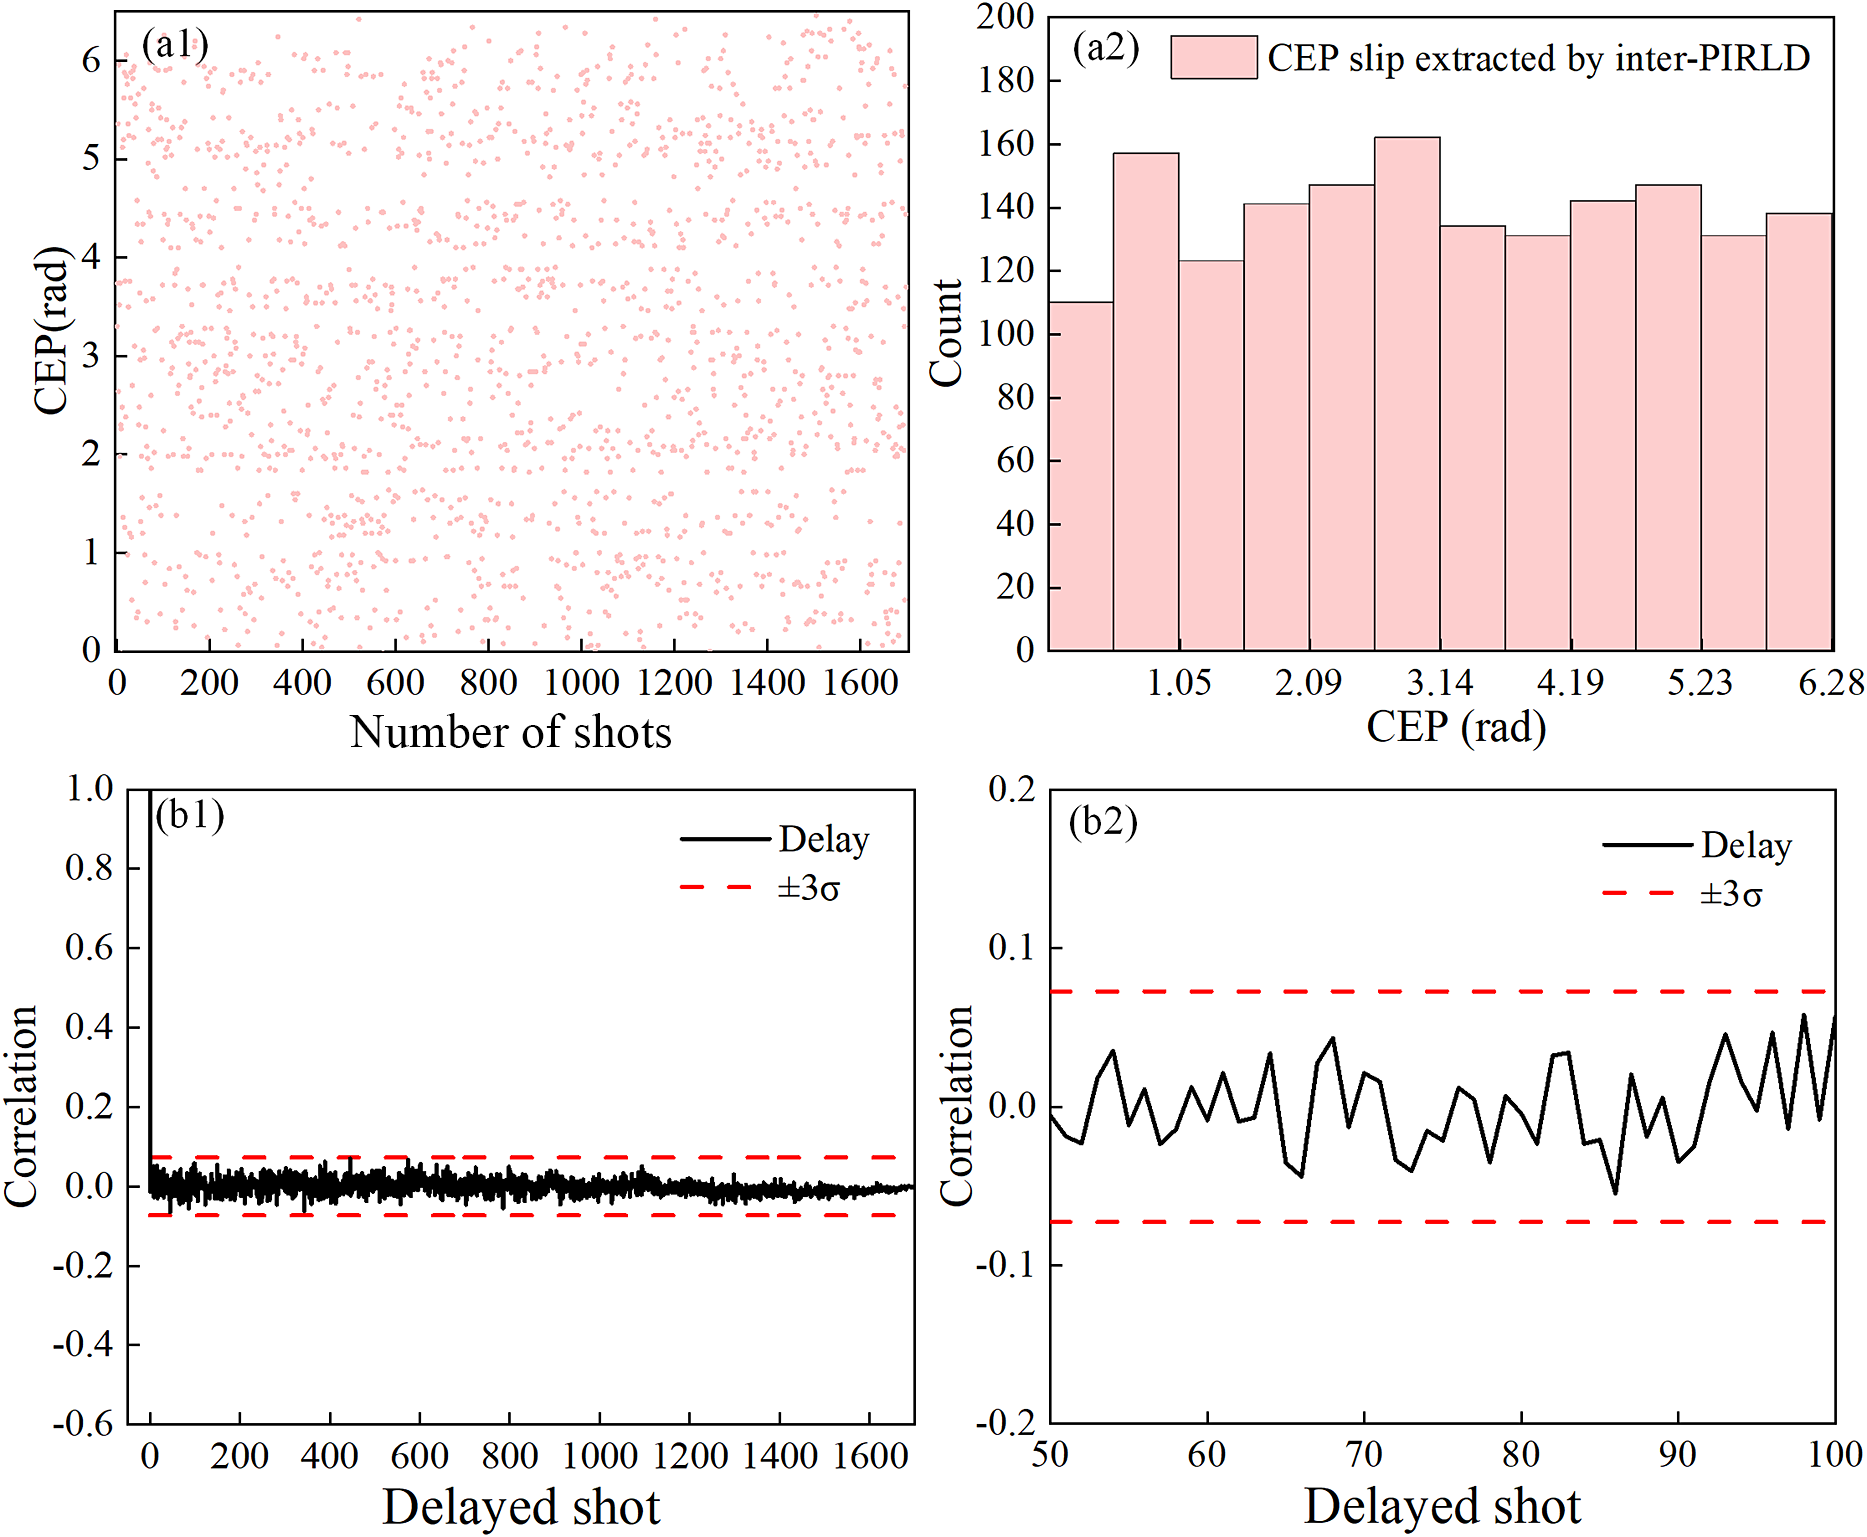
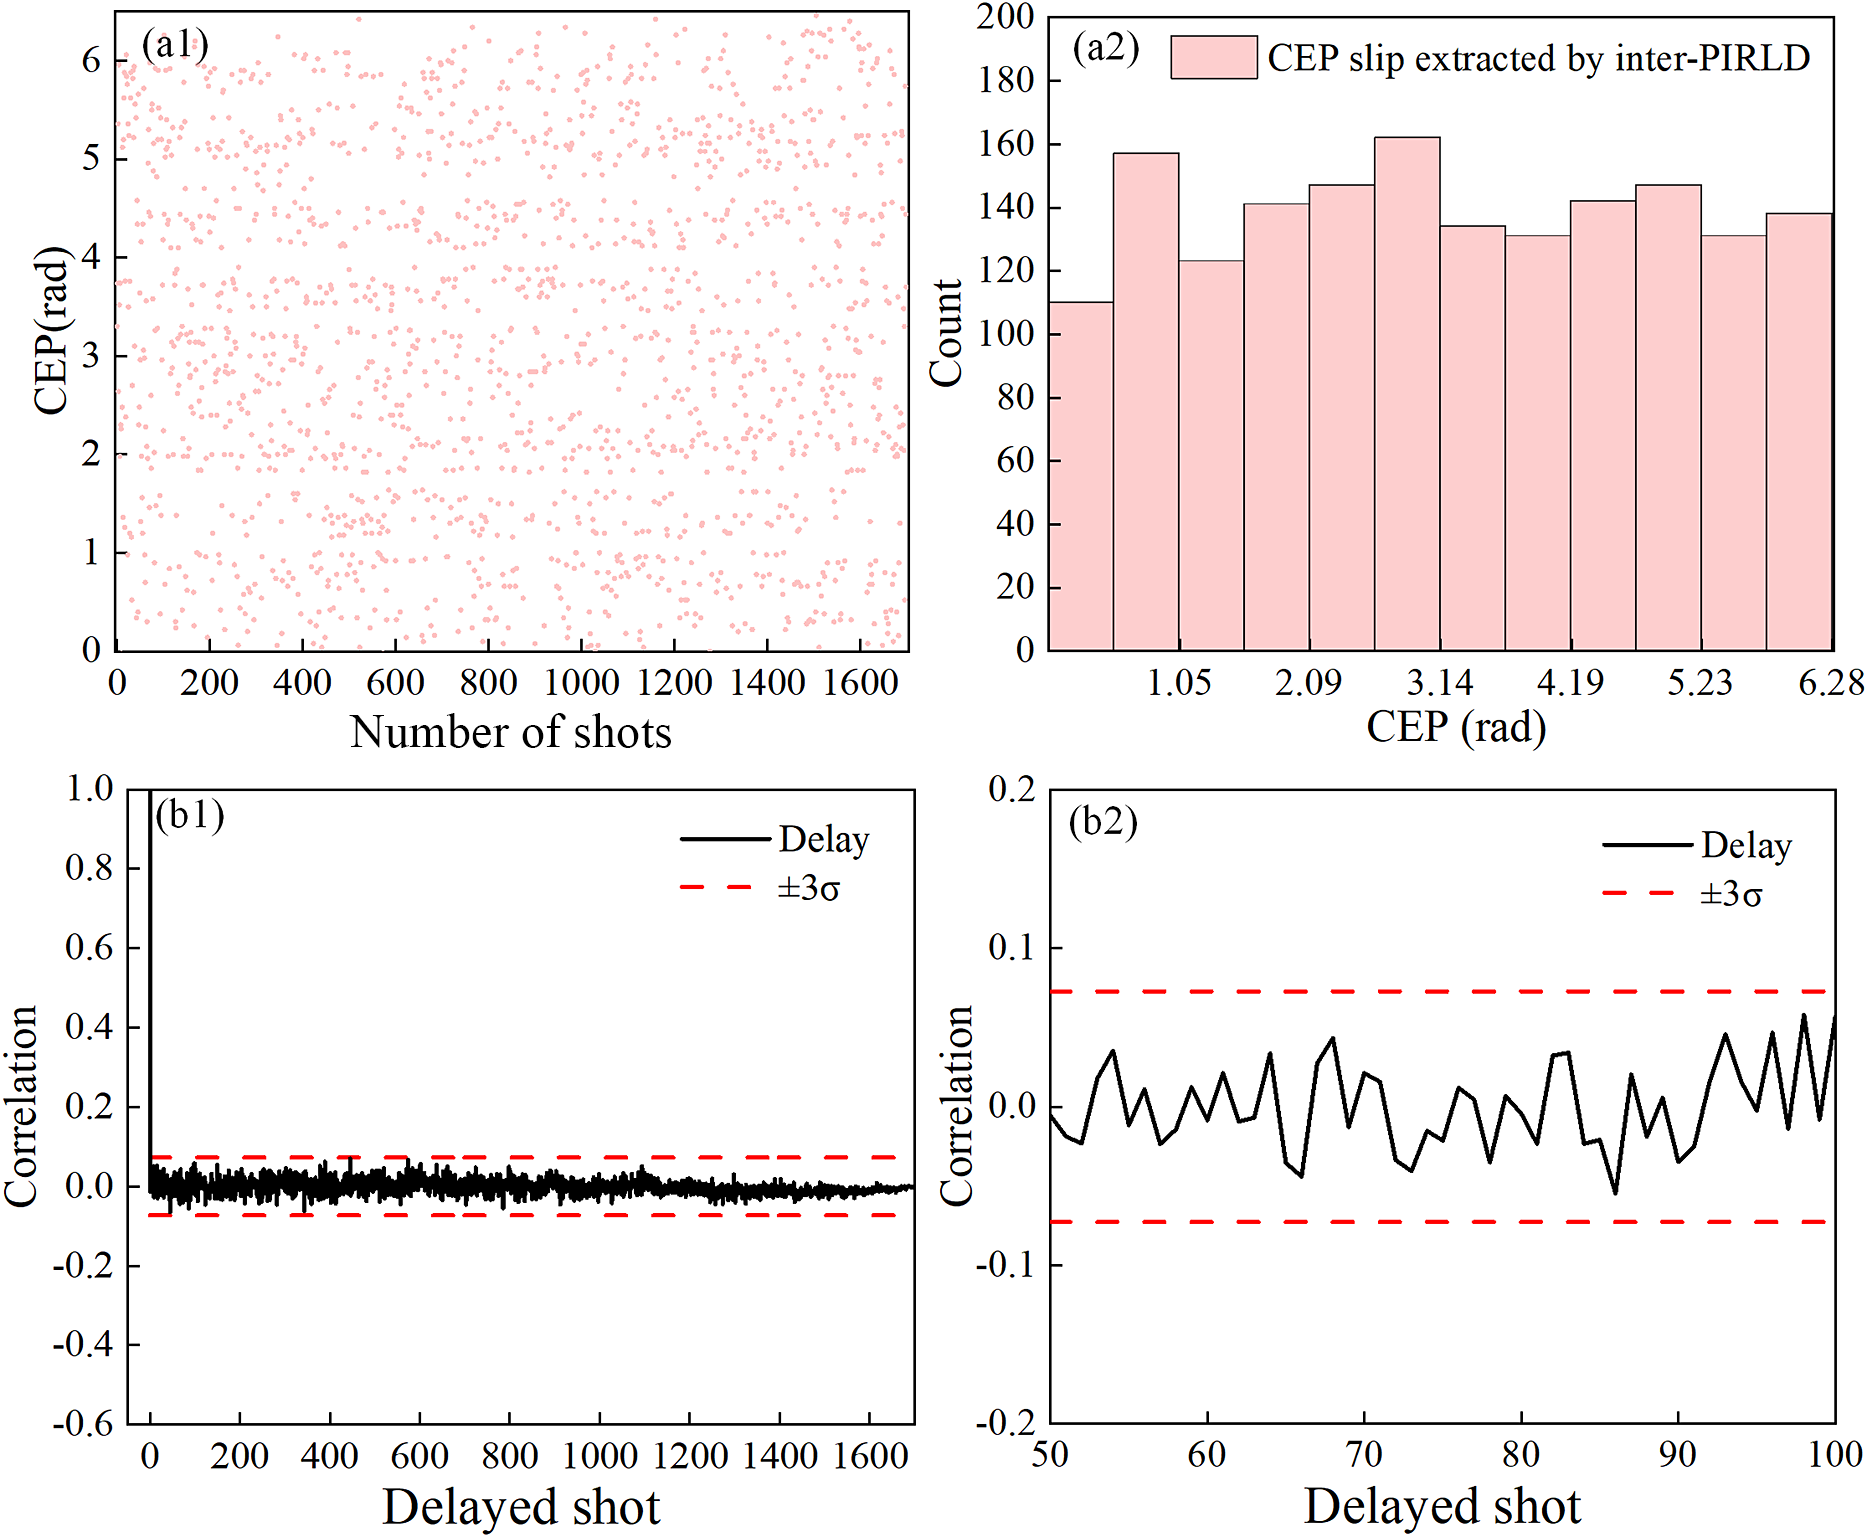
According to Equation (4), the CEP distribution is related to the relative phase between two superposition lights, and thus to the direction of the petals. Therefore, we indirectly obtain the distribution of the CEP from the petal orientation of the inter-PIRLD and the results are shown in Figures 7(a1) and 7(a2). Based on the recorded dataset, we evaluate the randomness of the measured inter-PIRLD fields by the autocorrelation function (ACF)[ Reference Li, Liu, Liu, Tian, Jin, Hu, Guo and Jin 29 ], which is defined as follows:
 $$\begin{align}r_k=\frac{\sum_{n=1}^{N-k}\left( X_n-\overline{X}\right)\left( X_{n+k}-\overline{X}\right)}{\sum_{n=1}^N{\left( X_n-\overline{X}\right)}^2}.\end{align}$$
Experimental CEP distributions and ACF plots of the recorded inter-PIRLD fields: CEP distribution (a1), the statistics chart of the recorded inter-PIRLD (a2), the random inter-PIRLD ACF plots from 1700 frame images (b1) and the details of the ACF from the 50th to the 100th delayed shot (b2).
Here, Xn
denotes the number n of X values in the sequence with the mean value of $\bar{X}$
and a lag coefficient of k. By changing k, we calculate the correlations rk
for the ACF plot to reveal the statistical characteristics of the dataset. If the plot exhibits some trends or significant spikes, it indicates that the data have inherent regularity. Otherwise, the irregular distribution in the ACF plot means gentle fluctuation. Figure 7(b1) depicts the ACF plot of the CEP extracted from 1700-frame inter-PIRLD data, where the black solid line marks the correlation coefficient values that exhibit small fluctuations around zero with no significant spikes or trends, consistent with the characteristics of irregular data distribution. Figure 7(b2) is a zoomed-in ACF diagram that displays the distribution of autocorrelation coefficients for the frame numbers between 50 and 100. The total sample number N = 1700 in the measurements, so the 3σ confidence interval is plotted as shown by the red line in Figure 7(b1) with its value of 3σ = 3/N
0.5 = 0.073. Correlations for all lag coefficients k are within 3σ, so it can be concluded that the CEP sequence is random, meaning that the inter-PIRLD exhibits interpulse random rotation[
Reference Li, Liu, Liu, Tian, Jin, Hu, Guo and Jin
29
].
$\bar{X}$
and a lag coefficient of k. By changing k, we calculate the correlations rk
for the ACF plot to reveal the statistical characteristics of the dataset. If the plot exhibits some trends or significant spikes, it indicates that the data have inherent regularity. Otherwise, the irregular distribution in the ACF plot means gentle fluctuation. Figure 7(b1) depicts the ACF plot of the CEP extracted from 1700-frame inter-PIRLD data, where the black solid line marks the correlation coefficient values that exhibit small fluctuations around zero with no significant spikes or trends, consistent with the characteristics of irregular data distribution. Figure 7(b2) is a zoomed-in ACF diagram that displays the distribution of autocorrelation coefficients for the frame numbers between 50 and 100. The total sample number N = 1700 in the measurements, so the 3σ confidence interval is plotted as shown by the red line in Figure 7(b1) with its value of 3σ = 3/N
0.5 = 0.073. Correlations for all lag coefficients k are within 3σ, so it can be concluded that the CEP sequence is random, meaning that the inter-PIRLD exhibits interpulse random rotation[
Reference Li, Liu, Liu, Tian, Jin, Hu, Guo and Jin
29
].
5 Conclusions
In summary, this paper presents an all-optical approach to homogenizing thermal and stress accumulation in interactions between a multi-pulse laser and materials. The method employs a two-stage OPA system. In the first stage, a vortex signal is produced for further amplification in the subsequent near-degenerate stage. The signal with its CEP close to that of the pump has its central wavelength about twice that of the pump. The second stage is configured to collinearly output idler and signal pulses carrying conjugated topological charges and distinct central wavelengths. Through coherent superposition, a structured light field is generated with a petal-shaped intensity distribution orientated with a CEP-dependent phase difference. Based on the design above, an 800 Hz, 800 nm Ti:sapphire femtosecond amplifier with a free-running CEP is used to generate experimentally an interpulse intensity rotation laser (inter-PIRLD) centered at 1.6 μm. It is measured to have a pulse energy of 0.4 mJ and a pulse duration of approximately 120 fs. The spatiotemporal properties of the structured beam have been characterized using dual-line detection based on sum-frequency generation together with statistical analysis via autocorrelation lag coefficients over 1700 consecutive shots. Results confirm stochastic CEP behavior, leading to random shot-to-shot rotation of the intensity pattern. Far-field measurements demonstrate that the inter-PIRLD maintains robust petal-shaped structures with excellent propagation stability. Without angular dispersion, it can be optically amplified without degrading its temporal or spectral properties. In principle, as long as proper thermal management is achieved, the fully passive optical setup supports high-repetition-rate operation – up to megahertz levels. These features make the inter-PIRLD a drill-like laser that can significantly mitigate thermal and stress accumulation during laser processing, showing strong potential for applications in precision laser processing and other high-field scenarios.
Acknowledgements
This work was supported by the National Key Research and Development Program of China (Grant No. 2023YFA1608504), the National Natural Science Foundation of China (Grant Nos. 12174264, 92050203, 62275163 and 62075138), the Natural Science Foundation of Guangdong Province (Grant Nos. 2024A1515010437 and 2024A1515011948), the Shenzhen Fundamental Research Program (Grant Nos. JCYJ20240813141432042 and JCYJ20240813141423031), the Shenzhen Science and Tcchnology Program (Grant No. JSGG20220831110601002) and the Scientific Instrument Developing Project of Shenzhen University (Grant No. 2023YQ006).

 Open access

