


1. Introduction
When a circular liquid jet impinges vertically onto a horizontal disk, it spreads radially outwards as a thin film. At a certain radial position, the film exhibits a circular hydraulic jump or a sudden rise in the thickness (Middleman Reference Middleman1995). This phenomenon is of pivotal fundamental importance in free-surface flow, and it is of relevance to many practical applications (Ishigai et al. Reference Ishigai, Nakanishi, Mizuno and Imamura1977; Kate, Das & Chakraborty Reference Kate, Das and Chakraborty2007; Mohajer & Li Reference Mohajer and Li2015; Askarizadeh et al. Reference Askarizadeh, Ahmadikia, Ehrenpreis, Kneer, Pishevar and Rohlfs2020). The formation of the jump is associated with a flow separation and the creation of a separation bubble, or a recirculating vortex, at the bottom in conjunction with the jump (Bohr et al. Reference Bohr, Ellegaard, Hansen and Haaning1996; Ellegaard et al. Reference Ellegaard, Hansen, Haaning, Hansen and Bohr1996), resulting from the film thickening across the jump and the simultaneous decrease in velocity. In turn, this induces a rise in pressure, which acts as an adverse wind to the flow, enabling it to separate into regions of upstream and downstream velocities of the type I jump (Bohr et al. Reference Bohr, Ellegaard, Hansen, Haaning, Putzkaradze and Watanabe1998). Both the separation length and the vortex size depend on the flow conditions (Nakoryakov, Pokusaev & Troyan Reference Nakoryakov, Pokusaev and Troyan1978; Craik et al. Reference Craik, Latham, Fawkes and Gribbon1981; Rao & Arakeri Reference Rao and Arakeri2001). The predictions of the jump radius and structure, the free-surface height and the vortex size have been of primary interest in the literature. However, the flow involving a circular hydraulic jump still lacks a coherent and systematic predictive theory for these different hydrodynamic features, even under laminar and steady-state conditions. Existing theoretical models are semi-empirical as they require some input from experiment to ensure the well-posedness of the problem. The objective of the present study is to develop a theoretical approach that addresses this issue and other drawbacks of existing models.
In the presence of gravity, the thin-film equations do not admit a similarity solution such as in the approach formulated by Watson (Reference Watson1964). Instead, the flow is commonly treated theoretically by reducing the boundary-layer equations using a mean-field or depth-averaging of the Kármán–Pohlhausen (KP) type (Schlichting & Gersten Reference Schlichting and Gersten2000). In the absence of surface tension, the thin-film approximation results in a hydrostatic pressure distribution that reflects the gravitational effect in the flow. By adopting a simple (often parabolic or cubic) velocity profile across the film layer, reasonably accurate quantitative predictions of the flow field and film profile can be obtained (Kurihara Reference Kurihara1946; Tani Reference Tani1949; Bohr, Dimon & Putzkaradze Reference Bohr, Dimon and Putzkaradze1993; Kasimov Reference Kasimov2008; Wang & Khayat Reference Wang and Khayat2019). However, the choice of the (radial) velocity profile constitutes a crucial step in the formulation. Almost any simple profile can lead to reasonably accurate prediction of the jump radius and height, but a more judicious choice is needed to capture more accurately the flow field. In this respect, the common practice has been to adopt a simple similarity profile, yielding a first-order equation for the film thickness, or a non-similarity profile that yields a second-order equation. We therefore refer to first- and second-order formulations when resulting in first- and second-order equations governing the film thickness, respectively. Various mechanisms can yield the second-order correction such as the inclusion of normal diffusive term (Razis, Kanellopoulos & van der Weele Reference Razis, Kanellopoulos and Van der Weele2021) or gravity effect (Bohr, Putkaradze, & Watanabe Reference Bohr, Putkaradze and Watanabe1997; Watanabe, Putkaradze & Bohr Reference Watanabe, Putkaradze and Bohr2003) by ensuring that the velocity profile satisfies the radial momentum equation at the disk.
The first-order model is typically derived by imposing a similarity profile for the radial velocity component. As a result, a singularity in either the velocity gradient or the film surface slope emerges at a finite radius, which is often assumed to coincide with the location of the jump (Kurihara Reference Kurihara1946; Tani Reference Tani1949; Wang & Khayat Reference Wang and Khayat2019). This approach is particularly attractive for two main reasons. On the one hand, the problem is reduced to a one degree of freedom, thus necessitating only one boundary condition, typically imposed at some upstream location. On the other hand, the location of the jump is determined without requiring any knowledge of the subcritical flow. Once the jump is located, the subcritical flow can be determined using a lubrication approach, which was shown to give reasonable prediction (Duchesne, Lebon & Limat Reference Duchesne, Lebon and Limat2014; Wang & Khayat Reference Wang and Khayat2019). Alternatively, Bohr et al. (Reference Bohr, Dimon and Putzkaradze1993) and Kasimov (Reference Kasimov2008) integrated the film equation radially forward upstream and backward downstream, hence generating inner and outer solutions, respectively. They assumed a simple parabolic velocity profile everywhere in the flow. In their inner solution, a boundary condition was arbitrarily imposed at a location slightly larger than the jet radius. In their outer solution, an infinite slope of either the average velocity or the film thickness was considered to coincide with the edge of the disk. Subsequently, Bohr et al. (Reference Bohr, Dimon and Putzkaradze1993), Kasimov (Reference Kasimov2008) and Dhar, Das & Das (Reference Dhar, Das and Das2020) located the jump upon matching both solutions through a Rayleigh shock (Rayleigh Reference Rayleigh1914) that satisfies the continuity of mass and radial momentum fluxes across the shock. Later, Wang & Khayat (Reference Wang and Khayat2019) adopted a similar solution process, but included a developing boundary-layer region near impact, thus allowing the fixing of an upstream boundary condition at the transition location between the boundary and viscous layers. The validity of the first-order model has been tested, yielding good agreement against experiment and numerical simulation, particularly for the jump radius. However, the model suffers from significant fundamental drawbacks as it prohibits proper analysis of the jump structure: the jump can only be treated as a (discontinuous) shock, with no possibility of examining the separation downstream or the viscous–inviscid interaction leading up to jump, the ellipticity of the boundary-layer equations is lost and the upstream influence cannot be addressed (Bowles & Smith Reference Bowles and Smith1992; Higuera Reference Higuera1994; Bowles Reference Bowles1995). We address these issues in some detail in the present study.
In an effort to capture the smooth variation of the jump and the vortex structure, second-order corrections were introduced by Bohr et al. (Reference Bohr, Putkaradze and Watanabe1997) and Watanabe et al. (Reference Watanabe, Putkaradze and Bohr2003). They accounted for additional gravity effect by ensuring their velocity profile to satisfy the momentum equation at the disk. The presence of the resulting additional shape parameter in the cubic velocity profile prevents the formation of the critical point and the singularity of the averaged first-order model, allowing the capture of the flow separation. However, two experimental points are needed in their solution to fix the boundary conditions, and some prior knowledge of the location of the jump is required. In this regard, even though their theory showed good agreement with the earlier measurements of Bohr et al. (Reference Bohr, Ellegaard, Hansen and Haaning1996), it remains somewhat semi-empirical. A similar approach was later adopted by Bonn, Andersen & Bohr (Reference Bonn, Andersen and Bohr2009) to study the hydraulic jump in a channel. However, results showing a jump-like profile were only presented to describe the vortex, whereas their comparison against measurements was limited to the simplified (first-order) version of the model in which the jump was treated as an abrupt shock connecting an inner and an outer solution. Fernandez-Feria, Sanmiguel-Rojas & Benilov (Reference Fernandez-Feria, Sanmiguel-Rojas and Benilov2019) obtained the jump profile by numerically integrating the boundary-layer equations. Their approach accommodates only an upstream boundary condition specified at some radial location close to impact. Similarly, Higuera (Reference Higuera1994) solved the boundary-layer equations numerically to generate the jump profile for two-dimensional flow. Unlike Fernandez-Feria et al. (Reference Fernandez-Feria, Sanmiguel-Rojas and Benilov2019), he ensured the upstream influence from the downstream flow condition at the edge of the disk.
More recently, Roberts & Li (Reference Roberts and Li2006) derived a model based on centre-manifold theory to describe the dynamics of thin films on curved substrates. A smooth profile was generated for the circular hydraulic jump on a flat substrate, and the vortex was captured as well. However, they simply imposed the boundary conditions in a manner similar to Watanabe et al. (Reference Watanabe, Putkaradze and Bohr2003). Mikielewicz & Mikielewicz (Reference Mikielewicz and Mikielewicz2009) proposed a simple model based on the solution of Bernoulli's equation for the planar viscous fluid flow, which incorporates the dissipation losses due to the change of the film thickness as well as the presence of eddies following the jump. The model does not predict the radius of the jump as accurately as the averaged boundary-layer equations. Moreover, the model requires a prior knowledge of the size of the vortex, which, in their case, was fixed as a quarter of the subcritical depth. A more serious attempt was made by Razis et al. (Reference Razis, Kanellopoulos and Van der Weele2021) to capture the continuous jump in an inclined channel. They extended the Saint-Venant equations by including the effect of the longitudinal normal stress. They derived analytically an approximate expression for the jump length as a function of the Froude and effective Reynolds numbers, highlighting the strong interplay among inertia, gravity and viscous diffusion, as contributing to the balance of forces that shape the jump.
The aim of the present study is to present a coherent approach that predicts the different features of the continuous circular hydraulic jump problem. We are particularly interested in predicting the continuous jump profile so the effects of the flow conditions on the separation length and the vortex size can be explored. The rest of this paper is organized as follows. In § 2, we describe the general problem and physical domain. In § 3, we formulate the problem in terms of the general governing equations and boundary conditions in each region of the flow. The KP integral method is adopted, and the solution strategy is clearly described with a case illustration. In § 4, we validate our theoretical predictions against existing numerical and experimental results. Some further results and analysis are given in § 5, where we examine the influence of the flow rate over the same experimental range as that of Duchesne et al. (Reference Duchesne, Lebon and Limat2014). Flow details are considered which were not reported in their experiment. Additional results on the influence of gravity and viscosity are also given. Finally, concluding remarks are given in § 6.
2. The physical domain and problem statement
Consider the steady laminar incompressible flow of a circular (axisymmetric) jet of a Newtonian fluid emerging from a nozzle of radius a, impinging at a volume flow rate Q on a flat disk of radius  ${R_\infty }$ lying normal to the jet direction. The flow configuration is depicted schematically in figure 1, where dimensionless variables and parameters are used. The problem is formulated in the $(r,\theta ,z)$ fixed coordinates, with the origin coinciding with the disk centre. The flow is assumed to be independent of θ, thus excluding polygonal flow. In this case, $u(r,z)$ and $w(r,z)$ are the corresponding dimensionless velocity components in the radial and vertical directions, respectively. The r axis is taken along the disk radius and the z axis is taken along the jet axis. The length and the velocity scales are conveniently taken to be the radius of the jet a and the average jet velocity $W \equiv Q/{\rm \pi}{a^2}$, both in the radial and vertical directions. Since the pressure is expected to be predominantly hydrostatic for a thin film, it is scaled by ρga, where g is the acceleration due to gravity. In the absence of surface tension, two main dimensionless groups emerge in this case: the Reynolds number $Re = Wa/\nu$, where ν is the kinematic viscosity, and the Froude number $Fr = W/\sqrt {ag}$. Another useful and related number is the Galileo number $Ga = R{e^2}/F{r^2}$.
Schematic illustration of the axisymmetric jet flow impinging on a flat stationary disk and the hydraulic jump of type I with one vortex downstream. Shown are the developing boundary-layer region  $(0 < r < {r_0})$ and the fully developed viscous region $({r_0} < r < {r_\infty })$. The fully developed viscous region comprises a region $({r_0} < r < {r_1})$ where gravitational effects are moderate, and a second region where gravitational effects are strong $({r_1} < r < {r_\infty })$. All notations are dimensionless. In this case, the jet radius is equal to one. The film is allowed to fall freely over the edge of the disk where an infinite slope in the film thickness occurs, $h^{\prime}(r = {r_\infty }) \to - \infty$. Shown in dashed-red curve is the schematic film-thickness profile reflecting the approach of Wang & Khayat (Reference Wang and Khayat2019), terminating with a singularity at a finite radius denoted here by ${r_s}$. The jump location coincides with $h^{\prime\prime}({r_J}) = 0$, and $h({r_m}) = {h_{max}}$.

As shown in figure 1, we identify three main regions of the flow: a developing boundary-layer region  $(0 < r < {r_0})$ where gravity is essentially dominated by inertia, a fully developed viscous region $({r_0} < r < {r_1})$ with moderate gravitational effect and a fully developed viscous region $({r_1} < r < {r_\infty })$ with strong gravitational effect. The jump is a smooth transition region that connects the (upstream) supercritical and the (downstream) subcritical regions. Again, the analysis of the boundary-layer region, near impact, is crucial in order to fix an upstream boundary condition for the thin-film viscous flow, relevant to the jet conditions. Throughout this study, the stagnation or impingement region is not considered, and the boundary layer is assumed to originate at the stagnation point. However, we examine in some detail the validity of this assumption (see § 3.1).
The boundary layer grows until it reaches the film surface at the transition location  $r = {r_0}$. Here, the film thickness is defined as ${h_0} \equiv h(r = {r_0})$ which corresponds to an upstream boundary condition for the flow in the fully developed viscous region. We denote by $\delta (r)$ the boundary-layer thickness. The leading edge of the boundary layer is taken to coincide with the disk centre. We let $U(r) \equiv u(r,z = h)$ denote the velocity at the free surface. Assuming the jet and stagnation flows to be inviscid irrotational, the radial velocity outside the boundary layer is then $U(0 \le r \le {r_0}) = 1$ as the fluid there is unaffected by the viscous stresses. We recall that both velocity components have been scaled by the (inviscid) jet velocity W. The potential flow ceases to exist in the fully developed viscous region ${r_0} < r < {r_\infty }$, and U becomes dependent on r. We note that ${r_0}$ is the location beyond which the viscous stresses become appreciable right up to the free surface, where the entire flow is of the boundary-layer type. We follow Rojas et al. (Reference Rojas, Argentina, Cerda and Tirapegui2010) and take the jump location ${r_J}$ to coincide with the vanishing of the concavity: $h^{\prime\prime}(r = {r_J}) = 0$. We denote by $r = {r_m}$ the location of the maximum film height: $h(r = {r_m}) = {h_{max}}$. The definition of the jump radius at the location where the free surface changes concavity is reasonable as this location is very close to the start of the separation zone which is experimentally considered as the location of the jump in the literature (Bohr et al. Reference Bohr, Ellegaard, Hansen and Haaning1996). Downstream of the jump, the film decreases in thickness and eventually falls freely over the edge of the disk, at $r = {r_\infty }$, where an infinite (downward) slope in thickness is assumed (Bohr et al. Reference Bohr, Dimon and Putzkaradze1993; Kasimov Reference Kasimov2008; Dhar et al. Reference Dhar, Das and Das2020). In fact, we shall see that the infinite slope is directly related to the stress singularity expected to occur at the disk edge (Higuera Reference Higuera1994; Scheichl, Bowles & Pasias Reference Scheichl, Bowles and Pasias2018). More details on the condition at the disk edge and upstream influence are given later. Finally, we assume throughout the present study that the locations ${r_\textrm{1}}$ and ${r_m}$ coincide with the locations of the leading and trailing edges of the jump, respectively.
Unless otherwise specified, the Reynolds number is assumed to be moderately large so that our analysis is confined to the laminar regime. Consequently, for steady axisymmetric thin-film flow, in the presence of gravity, the mass and momentum conservation equations are formulated using a thin-film or Prandtl boundary-layer approach, which amounts to assuming that the radial flow varies much slower than the vertical flow (Schlichting & Gersten Reference Schlichting and Gersten2000). We observe that the pressure for a thin film is hydrostatic as a result of its vanishing at the film surface (in the absence of surface tension) and the small thickness of the film, yielding  $p(r,z) = h(r) - z$. By letting a subscript with respect to r or z denote partial differentiation, the reduced dimensionless relevant conservation equations become
 \begin{equation}{u_r} + \frac{u}{r} + {w_z} = 0,\quad Re(u{u_r} + w{u_z}) ={-} \frac{{Re}}{{F{r^2}}}h^{\prime} + {u_{zz}},\end{equation}
where a prime denotes total differentiation with respect to r. These are the thin-film equations commonly used to model the spreading liquid flow (Tani Reference Tani1949; Bohr et al. Reference Bohr, Dimon and Putzkaradze1993, Reference Bohr, Ellegaard, Hansen and Haaning1996; Kasimov Reference Kasimov2008; Wang & Khayat Reference Wang and Khayat2019). At the disk, the no-slip and no-penetration conditions are assumed to hold at any r. In this case
 \begin{equation}u(r,z = 0) = w(r,z = 0) = 0.\end{equation}
At the free surface  $z = h(r)$, the kinematic and dynamic conditions for steady flow take the form
 \begin{equation}w(r,z = h) = u(r,z = h)h^{\prime}(r),\quad {u_z}(r,z = h) = 0.\end{equation}
The conservation of mass at any location upstream and downstream of the jump yields the following relation in dimensionless form:
 \begin{equation}\int_0^{h(r)} {u(r,z)\,\textrm{d}z} = \frac{1}{{2r}}.\end{equation}
Finally, a useful expression for the convective terms is obtained by first eliminating the transverse velocity component by noting from (2.1a) and (2.2b) that  $w(r,z) ={-} (1/r)(\partial /\partial r)(r\int_0^z {u\,\textrm{d}z} )$. In this case
 \begin{equation}u{u_r} + w{u_z} = \frac{1}{r}{(r{u^2})_r} - \frac{1}{r}{\left( {u\int_0^z {{{(ru)}_r}\,\textrm{d}z} } \right)_z}.\end{equation}
The flow field is sought separately in the developing boundary-layer region for  $0 < r < {r_0}$, the fully developed viscous region with moderate gravity for ${r_0} < r < {r_1}$ and fully developed viscous region with strong gravity for ${r_1} < r < {r_\infty }$. Additional boundary conditions are needed, which are given when the flow is analysed in each region.
3. Formulation and solution strategy
In this section, we first present the formulation of the steady flow in the developing boundary-layer region in order to obtain the upstream boundary condition needed for the flow in the fully developed viscous region. Next, we present the formulations of the flow in the fully developed viscous region. In particular, effects of moderate gravity and strong gravity are discussed. We see that, depending on the level of importance of the gravitational effects, different governing equations can be used in different regions. The general strategy to obtain a unique solution of the free-surface profile and flow field, and to locate the jump, is finally described.
Aside from some specific cases, boundary-layer and thin-film flows are generally non-self-similar in character (Schlichting & Gersten Reference Schlichting and Gersten2000; Drazin & Riley Reference Drazin and Riley2006). Therefore, we seek an approximate solution in each flow region. An integral approach of the KP type (Schlichting & Gersten Reference Schlichting and Gersten2000) is adopted in the developing boundary-layer and fully developed viscous regions. The KP method has been widely adopted in the literature for steady and transient jumps, not only when the thin-film equations are parabolic (Watson Reference Watson1964; Bush & Aristoff Reference Bush and Aristoff2003; Kate et al. Reference Kate, Das and Chakraborty2007; Dressaire et al. Reference Dressaire, Courbin, Crest and Stone2010; Prince, Maynes & Crockett Reference Prince, Maynes and Crockett2012; Wang & Khayat Reference Wang and Khayat2018; Baayoun, Khayat & Wang Reference Baayoun, Khayat and Wang2022) but also when the equations are weakly elliptic (Tani Reference Tani1949; Bohr et al. Reference Bohr, Dimon and Putzkaradze1993, Reference Bohr, Putkaradze and Watanabe1997; Watanabe et al. Reference Watanabe, Putkaradze and Bohr2003; Kasimov Reference Kasimov2008; Fernandez-Feria et al. Reference Fernandez-Feria, Sanmiguel-Rojas and Benilov2019; Wang & Khayat Reference Wang and Khayat2019; Dhar et al. Reference Dhar, Das and Das2020; Ipatova, Smirnov & Mogilevskiy Reference Ipatova, Smirnov and Mogilevskiy2021). The problem becomes weakly elliptic when the relatively weak effect of gravity upstream of the jump is not neglected in the analysis. In this case, the upstream influence caused by the downstream condition is small but not negligible. It is well established from the literature for impinging jet flow and hydraulic jump (Prince et al. Reference Prince, Maynes and Crockett2012; Prince, Maynes & Crockett Reference Prince, Maynes and Crockett2014; Wang & Khayat Reference Wang and Khayat2018, Reference Wang and Khayat2019, Reference Wang and Khayat2020; Baayoun et al. Reference Baayoun, Khayat and Wang2022) that a cubic similarity velocity profile taken in the supercritical region leads to close agreement with Watson's (Reference Watson1964) similarity solution. Consequently, in this study, we also adopt a cubic profile for the velocity, which is considered to be the leading-order solution in a comprehensive spectral approach for nonlinear flow (Khayat & Kim Reference Khayat and Kim2006). Other profiles such as the parabolic profile were also used in the literature (Bohr et al. Reference Bohr, Dimon and Putzkaradze1993; Kasimov Reference Kasimov2008).
3.1. The flow in the impingement zone and boundary-layer region  $(0 < r < {r_0})$

As depicted in figure 1, we assume that the inception of the boundary layer coincides with the stagnation point, thus assuming the impingement zone to be negligibly small, which is a common practice for an impinging jet. In fact, the velocity outside the boundary layer rises rapidly from 0 at the stagnation point to the impingement velocity in the inviscid far region. The impinging jet is predominantly inviscid close to the stagnation point, and the boundary-layer thickness remains negligibly small. Obviously, this is the case for a jet at relatively large Reynolds number. Indeed, the analysis of White (Reference White2006) shows that the boundary-layer thickness is constant near the stagnation point, and is estimated to be  $O(R{e^{ - 1/2}})$. Ideally, the flow at the boundary-layer edge should correspond to the (almost parabolic) potential flow near the stagnating jet, with the boundary-layer leading edge coinciding with the stagnation point (Liu & Lienhard Reference Liu and Lienhard1993). However, the assumption of uniform horizontal flow near the wall and outside the boundary layer is reasonable. The distance from the stagnation point for the inviscid flow to reach uniform horizontal velocity is small, of the order of the jet radius (Lienhard Reference Lienhard2006). In the absence of gravity, the steady flow acquires a similarity character. In this case, the position or effect of the leading edge is irrelevant. This assumption was adopted initially by Watson (Reference Watson1964), and has been commonly used in existing theories (see e.g. Bush & Aristoff Reference Bush and Aristoff2003; Prince et al. Reference Prince, Maynes and Crockett2012, Reference Prince, Maynes and Crockett2014; Wang & Khayat Reference Wang and Khayat2018, Reference Wang and Khayat2019, Reference Wang and Khayat2020).
Nevertheless, in an effort to validate the assumption of negligible impingement zone, we find it helpful to examine its extent for the free-surface jet. We therefore assume, given the strong inertia of the downward jet, that the flow above the viscous layer is purely inviscid. For a free-surface jet with no surface tension, Lienhard (Reference Lienhard2006) showed that the radial velocity component of the potential flow is given by  $U(r) = cr + O({r^2})$, where c = 0.46. The radial velocity component in the stagnation region is then expressed as $u(r,z) = U(r)F^{\prime}(\eta )$ in terms of the similarity variables $\eta = z{(cRe)^{1/2}}$, and $w(r,z) ={-} (U^{\prime}F + (U/r)F)/\sqrt {cRe}$. A prime indicates total differentiation. Substituting into (2.1b) and neglecting gravity effects, the equation for F becomes (see also Maiti Reference Maiti1965) $F^{\prime\prime\prime} + 2FF^{\prime\prime} - F^{\prime2} + 1 = 0$, which is solved subject to $F(0) = F^{\prime}(0) = 0$ and $F(\eta \to \infty )\sim 1$. The boundary-layer height in the impingement zone is then given by $\delta = {\eta _\delta }/\sqrt {cRe}$, where ${\eta _\delta }$ is a constant that depends on Re. The extent of the impingement zone is assessed once the flow is sought in the developing boundary-layer region.
In this region, the boundary layer grows with radial distance, eventually invading the entire film depth, reaching the free surface at the transition,  $r = {r_0}$, where the fully developed viscous region begins. For $0 < r < {r_0}$ and above the boundary-layer outer edge, the free surface lies at some height $z = h(r) > \delta (r)$. The flow in the developing boundary-layer region is assumed to be sufficiently inertial for inviscid flow to prevail between the boundary-layer outer edge and the free surface (see figure 1). In this case, the following conditions at the outer edge of the boundary layer $z = \delta (r)$ and beyond must hold:
 \begin{equation}u(r < {r_0},\delta \le z < h) = 1,\quad {u_z}(r < {r_0},z = \delta ) = 0.\end{equation}
The height of the free surface in the developing boundary-layer region is determined from mass conservation inside and outside the boundary layer. Therefore, for  $r < {r_0}$, (2.4) becomes
 \begin{equation}\int_0^{\delta (r)} {u(r,z)\,\textrm{d}z} + h(r) - \delta (r) = \frac{1}{{2r}}.\end{equation}
Upon integrating (2.1b) across the boundary-layer thickness and considering the integral form of the convective terms in (2.5), we obtain the following weak form:
 \begin{equation}\frac{{Re}}{r}\frac{\textrm{d}}{{\textrm{d}r}}\int_0^\delta {ru(u - 1)\,\textrm{d}z} ={-} \frac{{Re}}{{F{r^2}}}\delta h^{\prime} - {\tau _w}.\end{equation}
Here we introduced the wall shear stress or skin friction  ${\tau _w}(r) \equiv {u_z}(r,z = 0)$. For simplicity, we choose a similarity cubic profile for the velocity, satisfying conditions (2.2a) and (3.1). Thus, we let
 \begin{equation}u(r \le {r_0},z) = {\textstyle{3 \over 2}}\eta - {\textstyle{1 \over 2}}{\eta ^3} \equiv f(\eta ),\end{equation}
where  $\eta = z/\delta $. Clearly, (3.4) does not satisfy the momentum equation at the disk. In this case, the effect of gravity is not accounted for in the velocity profile. This assumption should be reasonable as the effects of gravity are negligible near impingement where inertia is more dominant (Watson Reference Watson1964). In this case, (3.4) represents a self-similar velocity profile in the boundary-layer flow.
Upon inserting (3.4) into (3.2) and (3.3), we obtain the following equations for the boundary-layer and free-surface heights:
 \begin{equation}h - \frac{3}{8}\delta = \frac{1}{{2r}},\quad \frac{{39}}{{280}}\frac{{Re}}{r}\delta (r\delta )^{\prime} = \frac{{Re}}{{F{r^2}}}{\delta ^2}h^{\prime} + \frac{3}{2}.\end{equation}
These equations are solved numerically subject to  $\delta (r = 0) = 0$. The transition location is found when the boundary-layer thickness becomes equal to the film thickness. Consequently, the boundary condition for the film thickness at the transition location ${h_0} \equiv h(r = {r_0})$ is obtained. Clearly, the formulations presented for the flow in the developing boundary-layer region are the same as those of Wang & Khayat (Reference Wang and Khayat2019).
Figure 2 illustrates the influence of inertia (Re) and gravity (Fr) on the size of the impingement zone and the boundary-layer profile dictated by (3.5). The intersection indicates the extent of the impingement zone, which depends on Fr (figure 2a) and Re (figure 2b). We recall that the height of the viscous layer in the impingement zone does not change with position and is independent of Fr for a Newtonian jet, and behaves like  $1/\sqrt {Re}$. Figure 2(a) shows that the extent of the impingement zone decreases as Fr increases, remaining essentially of O(1). The extent saturates asymptotically to the value 1.22 for infinite Fr, when gravity is neglected in (3.5). Figure 2(b) indicates that the length of the impingement zone is essentially insensitive to the variation of the Reynolds number; only its thickness decreases with Re. Therefore, we conclude that, unless the Froude number is very low such as under strong gravity or low flow rate of the jet, the impingement-zone length is of the order of the jet radius, and can be neglected (see also Lienhard Reference Lienhard2006).
Influence of gravity and viscosity on the size of the impingement zone (distance between the origin and the point of intersection with the boundary-layer height). (a) Influence of Fr for Re = 100 and (b) influence of Re for Fr = 4. The horizontal lines are the thickness of the viscous layer in the impingement zone, and the curves are the boundary-layer profiles emanating from the origin.

3.2. The flow in the fully developed viscous region $({r_0} \le r \le {r_\infty })$

Downstream of the transition point  $(r > {r_0})$, the potential flow ceases to exist, with the velocity at the free surface becoming dependent on r:
 \begin{equation}u(r > {r_0},z = h) = U(r).\end{equation}
In this case, the weak form of the momentum equation (2.1b) reads
 \begin{equation}\frac{{Re}}{r}\frac{\textrm{d}}{{\textrm{d}r}}\int_0^h {r{u^2}\,\textrm{d}z} ={-} \frac{{Re}}{{F{r^2}}}hh^{\prime} - {\tau _w}.\end{equation}
 If the similarity velocity profile  $u(r > {r_0},z) = U(r)f(\eta )$ is adopted, where $f(\eta )$ is still given in (3.4) with $\eta = z/h$, then, after eliminating $U = 4/5rh$ using (2.4), we recover, from (3.7), the film thickness equation of Wang & Khayat (Reference Wang and Khayat2019):
 \begin{equation}Re\left( {\frac{5}{{4F{r^2}}} - \frac{{68}}{{175}}\frac{1}{{{r^2}{h^3}}}} \right)h^{\prime} = \frac{1}{{r{h^2}}}\left( {\frac{{68}}{{175}}\frac{{Re}}{{{r^2}}} - \frac{3}{{2h}}} \right),\end{equation}
which is solved subject to  $h(r = {r_0}) = {h_0}$. This equation is equivalent to that developed originally by Tani (Reference Tani1949). Although it (or equivalent model) has been extensively (and successfully) used in the literature (Bohr et al. Reference Bohr, Dimon and Putzkaradze1993; Kasimov Reference Kasimov2008; Fernandez-Feria et al. Reference Fernandez-Feria, Sanmiguel-Rojas and Benilov2019; Wang & Khayat Reference Wang and Khayat2019; Dhar et al. Reference Dhar, Das and Das2020), it presents significant drawbacks when describing the jump structure and flow. Clearly, (3.8) exhibits a singularity at some finite radial position. The jump radius is typically assumed to lie between two singular points reached when (3.8) is integrated forward (from some initial location) and backward when integrated from the disk edge (Bohr et al. Reference Bohr, Dimon and Putzkaradze1993; Kasimov Reference Kasimov2008). Alternatively, unlike other approaches, Wang & Khayat (Reference Wang and Khayat2019) integrated (3.8) starting from the transition point. They successfully identified the jump radius as coinciding with the location of the singularity, validating their approach against experiment. Fernandez-Feria et al. (Reference Fernandez-Feria, Sanmiguel-Rojas and Benilov2019) validated further this approach through comparison against their numerical solution of the boundary-layer equations. However, the flow downstream of the singularity cannot be captured by continuing the solution beyond the singularity. Consequently, (3.8) cannot be used to describe the continuous jump or to capture the vortex structure downstream of the jump. Finally, given the inherent ellipticity of the boundary-layer problem, (3.8) cannot account for any upstream influence (Bowles & Smith Reference Bowles and Smith1992; Higuera Reference Higuera1994). Next, we address these issues by considering the second-order model.
We again assume a cubic velocity profile subject to conditions (2.2a), (2.3b) and (3.6). In order to obtain a continuous jump profile, we take the profile to satisfy the momentum equation (2.1b) at the disk, namely  $- (Re/F{r^2})h^{\prime} + {u_{zz}}(r,z = 0) = 0$. In this case, the radial velocity profile is non-self-similar, and is given as a function of the surface velocity U(r) and the gravitational term $(Re/F{r^2}){h^2}h^{\prime}$ as
 \begin{equation}u(r > {r_0},z) = \frac{1}{4}\left[ {\left( {6U - \frac{{Re}}{{F{r^2}}}{h^2}h^{\prime}} \right)\eta + 2\frac{{Re}}{{F{r^2}}}{h^2}h^{\prime}{\eta^2} - \left( {2U + \frac{{Re}}{{F{r^2}}}{h^2}h^{\prime}} \right){\eta^3}} \right].\end{equation}
Here  $\eta = z/h(r)$. We observe that the non-self-similarity is due to the presence of the gravity term. An equivalent profile to (3.9) was adopted by Watanabe et al. (Reference Watanabe, Putkaradze and Bohr2003), who introduced a shape parameter λ(r), and the profile by Bonn et al. (Reference Bonn, Andersen and Bohr2009) for the hydraulic jump in a channel. Clearly, if (3.9) is adopted, the skin friction coefficient or wall shear stress is given by ${\tau _w}(r) = {\textstyle{1 \over 4}}(6(U/h) - (Re/F{r^2})hh^{\prime})$. The flow separation points are identified by setting ${\tau _w}(r) = 0$. This is the case when $h^{\prime}$ is relatively large and positive. In contrast, the flow separation cannot be captured if the similarity profile is used, as it yields ${\tau _w}(r) = {\textstyle{3 \over 2}}(U/h) > 0$. Upon substituting (3.9) into (2.4) and (3.7), we obtain
 \begin{gather}\frac{{Re}}{{F{r^2}}}{h^2}h^{\prime} = 30U - \frac{{24}}{{rh}},\end{gather}
 \begin{gather}
- \dfrac{1}{{140}}\left( {\dfrac{{11}}{6}\dfrac{{Re}}{{F{r^2}}}{h^2}h^{\prime} +
41U} \right)hU^{\prime} = \dfrac{3}{{4F{r^2}}}hh^{\prime} + \dfrac{3}{{2Re}}\dfrac{U}{h} \nonumber\\
+ \,\dfrac{1}{{28}}\left(
{\dfrac{{Re}}{{F{r^2}}}U{h^2}h^{\prime} -
\dfrac{{27}}{5}{U^2} -
\dfrac{{R{e^2}}}{{60F{r^4}}}{h^4}{{h^{\prime}}^2}}
\right)\left( {h^{\prime} + \dfrac{h}{r}} \right),
\end{gather}
\begin{gather}
- \dfrac{1}{{140}}\left( {\dfrac{{11}}{6}\dfrac{{Re}}{{F{r^2}}}{h^2}h^{\prime} +
41U} \right)hU^{\prime} = \dfrac{3}{{4F{r^2}}}hh^{\prime} + \dfrac{3}{{2Re}}\dfrac{U}{h} \nonumber\\
+ \,\dfrac{1}{{28}}\left(
{\dfrac{{Re}}{{F{r^2}}}U{h^2}h^{\prime} -
\dfrac{{27}}{5}{U^2} -
\dfrac{{R{e^2}}}{{60F{r^4}}}{h^4}{{h^{\prime}}^2}}
\right)\left( {h^{\prime} + \dfrac{h}{r}} \right),
\end{gather}respectively. We observe that system (3.10) is equivalent to the system of (2.25) in Watanabe et al. (Reference Watanabe, Putkaradze and Bohr2003). Eliminating U, we obtain an ordinary differential equation of second order in h:
 \begin{align}
&\dfrac{{R{e^2}}}{{F{r^2}}}{r^2}{h^4}\left(
{4\dfrac{{Re}}{{F{r^2}}}r{h^3}h^{\prime} + 41}
\right)h^{\prime\prime} = 1632Re(rh)^{\prime} - 6300{r^2}\nonumber\\
& \quad - 2\dfrac{{Re}}{{F{r^2}}}{r^2}{h^3}h^{\prime}\left[
{\dfrac{{R{e^2}}}{{F{r^2}}}{h^3}h^{\prime}(5rh^{\prime} +
h) + 41Reh^{\prime} + 2100r} \right].
\end{align}
\begin{align}
&\dfrac{{R{e^2}}}{{F{r^2}}}{r^2}{h^4}\left(
{4\dfrac{{Re}}{{F{r^2}}}r{h^3}h^{\prime} + 41}
\right)h^{\prime\prime} = 1632Re(rh)^{\prime} - 6300{r^2}\nonumber\\
& \quad - 2\dfrac{{Re}}{{F{r^2}}}{r^2}{h^3}h^{\prime}\left[
{\dfrac{{R{e^2}}}{{F{r^2}}}{h^3}h^{\prime}(5rh^{\prime} +
h) + 41Reh^{\prime} + 2100r} \right].
\end{align}
We refer to system (3.10) or (3.11) as the second-order model. It is not difficult to see that (3.8) can be deduced from (3.11) for small film thickness, slope and curvature. However, it is helpful to proceed in a more systematic manner, and derive a hierarchy of equations, reflecting the (small) level of the film thickness.
For this, we introduce more appropriate length scales for the radial position and the film thickness; recall that the jet radius has been adopted so far as the common length scale. Thus, a suitable scaling that reduces (3.11) to a one-parameter equation is
 \begin{equation}r = R{e^{2/3}}F{r^2}\bar{r},\quad h = R{e^{ - 1/3}}\bar{h}.\end{equation}
When the rescaled variables (3.12) are used, (3.11) reduces to an equation involving only one parameter, namely  $\varepsilon \equiv R{e^{ - 2/3}}F{r^{ - 4}}$, which is indeed typically small in practice. For instance, for the flow of silicone oil in the experiment of Duchesne et al. (Reference Duchesne, Lebon and Limat2014), Re = 169.1 and Fr = 16.87 so $\varepsilon = 4 \times {10^{ - 7}}$. Therefore, we take ε as perturbation or ordering parameter to generate the following equations to first and second orders:
 \begin{gather}O(\varepsilon
):\quad 136\varepsilon (\bar{r}\bar{h})^{\prime} -
525{\bar{r}^2} - 350{\bar{r}^3}{\bar{h}^3}\bar{h^{\prime}}
= 0,\end{gather}
\begin{gather}O(\varepsilon
):\quad 136\varepsilon (\bar{r}\bar{h})^{\prime} -
525{\bar{r}^2} - 350{\bar{r}^3}{\bar{h}^3}\bar{h^{\prime}}
= 0,\end{gather} \begin{gather}
O({\varepsilon ^2}):\quad {\varepsilon
^{3/2}}{{\bar{r}}^2}{{\bar{h}}^4}(4\sqrt \varepsilon
\bar{r}{{\bar{h}}^3}\bar{h^{\prime}} +
41)\bar{h^{\prime\prime}} = 1632{\varepsilon
^2}(\bar{r}\bar{h})^{\prime} - 6300{{\bar{r}}^2}\nonumber\\
- \,2{{\bar{r}}^2}{{\bar{h}}^3}\sqrt \varepsilon
[{\varepsilon
^{3/2}}{{\bar{h}}^3}{{\bar{h^{\prime}}}^2}(5\bar{r}\bar{h^{\prime}}
+ \bar{h}) + \bar{h^{\prime}}(41\varepsilon
\bar{h^{\prime}} + 2100\bar{r})]. \end{gather}
\begin{gather}
O({\varepsilon ^2}):\quad {\varepsilon
^{3/2}}{{\bar{r}}^2}{{\bar{h}}^4}(4\sqrt \varepsilon
\bar{r}{{\bar{h}}^3}\bar{h^{\prime}} +
41)\bar{h^{\prime\prime}} = 1632{\varepsilon
^2}(\bar{r}\bar{h})^{\prime} - 6300{{\bar{r}}^2}\nonumber\\
- \,2{{\bar{r}}^2}{{\bar{h}}^3}\sqrt \varepsilon
[{\varepsilon
^{3/2}}{{\bar{h}}^3}{{\bar{h^{\prime}}}^2}(5\bar{r}\bar{h^{\prime}}
+ \bar{h}) + \bar{h^{\prime}}(41\varepsilon
\bar{h^{\prime}} + 2100\bar{r})]. \end{gather}
Several observations are made here. Model (3.8) is recovered to  $O(\varepsilon )$, with a slight difference as equation (3.13a) has a factor of one instead of the factor 5/4 on the left-hand side of (3.8). The original second-order (3.11) corresponds to the $O({\varepsilon ^2})$ (3.13b). The hierarchy in (3.13) shows how the effect of gravity, in particular, influences the type of film equation. We therefore deduce that (3.13a) or (3.8) is suitable for a flow under moderate gravity effect, and (3.13b) or (3.11) should be the choice under relatively strong gravity effect. This important observation forms the basis of our solution strategy.
3.3. Solution strategy
In order to obtain a unique free-surface profile that ensures a smooth continuous jump, the following steps are taken in the solution process:
(1) System (3.5) is solved subject to
$\delta (r = 0) = 0$ over the range $0 \le r \le {r_0}$ to obtain the boundary-layer and film-thickness profiles between the impingement point and the transition point $r = {r_0}$.(2) Subject to the boundary condition
$h(r = {r_0}) = {h_0}$ obtained, (3.8) is integrated forward in r over the range ${r_0} \le r \le {r_s}$, hence generating a film thickness profile that exhibits a singularity at some finite radius $r = {r_s}$. Although this location is not used in the solution process, it gives a close estimate of the jump location (Wang & Khayat Reference Wang and Khayat2019).(3) Next, we integrate the second-order (3.11) over the range
${r_1} \le r \le {r_\infty }$, where ${r_0} \ll {r_1} < {r_s}$ (see figure 1), subject to the known values of the height $h(r = {r_1})$ and slope $h^{\prime}(r = {r_1})$ from the solution of (3.8). The location of the starting point ${r_1}$ for the solution of (3.11) is determined by ensuring that $h^{\prime}(r = {r_\infty }) \to - \infty$.


In sum, the composite film profile is determined by solving system (3.5) over the range  $0 \le r \le {r_0}$, (3.8) over the range ${r_0} \le r \le {r_1}$ and (3.11) over the range ${r_1} \le r \le {r_\infty }$. We take the jump location $r = {r_J}$, to coincide with $h^{\prime\prime}({r_J}) = 0$. Hence, ${r_1}$ is the leading edge of the jump. Finally, it is important to point out that, given the sensitivity of the solution of (3.11) on the initial conditions and the ensuing numerical instability (Watanabe et al. Reference Watanabe, Putkaradze and Bohr2003; Roberts & Li Reference Roberts and Li2006), the solution must begin at a location close to the jump, thus rendering crucial the introduction of the boundary-layer and moderate-gravity regions. This, in turn, ensures the imposition of appropriate boundary conditions: $h(r = {r_1})$ and $h^{\prime}(r = {r_1})$.
3.4. Upstream influence and the free-interaction problem
Figure 3 illustrates the solution process of the two-point boundary-value problem, with Re = 800, Fr = 5 and  ${r_\infty } = 25$. The flow for $0 < r < {r_1}$ covers the developing boundary-layer and moderate-gravity regions. Equation (3.11) is solved subject to five different initial conditions corresponding to five locations of the leading edge and height of the jump. The figure illustrates the strong influence of the starting location $r = {r_1}$ and ${h_1} = h(r = {r_1})$ on the ensuing solution of (3.11), and how the film profile (figure 3a) and wall shear stress (figure 3b) can be obtained uniquely over the entire domain. We recall that ${r_1} < {r_s}$, where ${r_s}$ is the location of the singularity reached by solving the first-order equation (3.8) with initial conditions at ${r_0} = 4.18$ (red curve). In particular, the figure illustrates how the jump profile is influenced by the choice of ${r_1}$. When ${r_1}$ is close to ${r_s}$, ${r_1} = 11.30$, the film profile follows closely the first-order solution but avoids the singularity exhibited by the solution of the first-order equation (3.8), rising slightly and dropping soon after. For a smaller ${r_1}$, here ${r_1} = 11.00$, the profile extends further in the subcritical region and becomes singular at some location upstream of the disk edge. Only one value, ${r_1} = 10.79$, ensures that the tail singularity $(h^{\prime} \to - \infty ,\;{\tau _w} \to \infty )$ occurs at $r = {r_\infty }$. When ${r_1}$ is taken further upstream, the profile overshoots the edge of the disk. The process illustrates clearly how the upstream influence is ensured in the present approach.
A sample case (Re = 800, Fr = 5 and  ${r_\infty } = 25$), illustrating the shooting method and the effect of the upstream and downstream boundary conditions on the jump location (upstream influence). The distributions of film profiles (a) and the wall shear stress (b) are obtained for different initial conditions. The green solid and dashed curves correspond to the profiles of the film and boundary layer, respectively, in the developing boundary-layer region. Here, the transition location is at $r = {r_0} = \; 4.18$ (green vertical line). The red curve corresponds to the variation of the film thickness in the moderate-gravity viscous region, obtained by solving the first-order equation (3.8), and exhibiting a singularity at $r = {r_s} = 12.3$ (red vertical line). The black and blue curves show branches of the solution for the film thickness variation in the strong-gravity viscous region obtained by solving the second-order equation (3.11). Depending on the value of ${r_1}$ (and consequently h 1) the solution may or may not reach the edge. The unique solution to the problem (blue curve), corresponding to an infinite slope at the edge of the disk, is obtained for ${r_1} = 10.7931$ (blue vertical line).

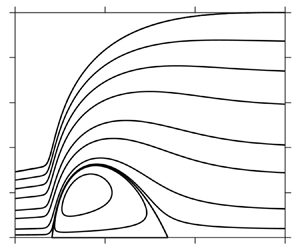
The profiles in figure 3, obtained subject to different initial conditions, are reminiscent of the profiles in figure 3 of Bowles (Reference Bowles1995), who examined the free-interaction problem of the planar flow of a sloped liquid layer over an obstacle. Bowles described the internal structure of the continuous jump as dominated by the viscous–inviscid interaction between the hydrostatic pressure gradient and the viscous effects near the solid wall (see also the earlier work of Gajjar & Smith (Reference Gajjar and Smith1983) and the dissertation of Bowles (Reference Bowles1990)). As Bowles (Reference Bowles1995) observes, the free interaction in the internal jump structure involves one of two types of mechanism, depending on the pressure development: ‘The pressure may increase, possibly leading to separation (a compressive interaction) or it may decrease, leading perhaps to a finite-distance singularity in the solution (an expansive interaction)’. The solution branches in our figure 3 reflect the two possibilities, namely an expansive interaction with a singularity and no separation for  ${r_1} = 11.00$ and 11.30, and a compressive interaction for ${r_1} = 10.20$, 10.60 and 10.79 with separation. We recall that imposing these different initial locations is equivalent to imposing different initial film heights provided through the solution of (3.8).
Similarly, by varying the initial conditions, Bowles (Reference Bowles1995) sought the solution for the sloped film flow by imposing a perturbation on the otherwise uniform film surface and corresponding half-Poiseuille flow far upstream. The flow was sought as a superposition of the base flow and an exponentially developing flow. The resulting (linearized) eigenvalue problem was solved numerically. Bowles found that the type of film profile obtained depends on the level of the perturbation of the uniform film. For a perturbed film with a slightly diminished thickness, the film profile was found to terminate in an expansive interaction, similar to the two profiles starting at  ${r_1} = 11.00$ and 11.30 in our figure 3, with the derivative of the layer's depth becoming large and negative (figure 3a). The corresponding skin friction in figure 3(b) becomes large and positive, while the depth of the film remains finite of O(1). Higuera (Reference Higuera1994) showed that this type of singularity is algebraic rather than logarithmic as in the problem of the free interaction in hypersonic flow (Brown, Stewartson & Williams Reference Brown, Stewartson and Williams1975; Bowles Reference Bowles1990). For a perturbed film with a slightly augmented height relative to the upstream uniform height, Bowles (Reference Bowles1995) found that the film surface becomes horizontal far downstream (with no singularity). For a relatively large bed slope, a jump emerges for a positively perturbed film height. In that case, a separation occurs with compressive interaction, which is reflected in our figures 3(a) and 3(b) for ${r_1} = 10.20$, 10.60 and 10.79. Figure 3(a) indicates that if the solution starts at a relatively distant ${r_1}$ from impingement, a weak jump forms as a result of strong viscous and weak inertial effects; the film comes to a halt. Conversely, if the initial distant ${r_1}$ is closer to impingement, fluid accumulates with a strong jump and upward slope, causing the development of an adverse pressure gradient and a separation. Consequently, we highlight an important distinction from the observations of Bowles (Reference Bowles1995), which we demonstrate throughout the present study: the hydraulic jump can actually form without being followed by a recirculation zone. Finally, it is worth mentioning that the magnitude of the perturbations imposed by Bowles (Reference Bowles1995) was relatively small (of the order of 10−6 to 10−2 compared to 1, the normalized film depth). This suggests that the solution is sensitive to initial conditions, which is also the case in our computations (see also Watanabe et al. Reference Watanabe, Putkaradze and Bohr2003).
3.5. Asymptotic flows
Two well-established limit flows are worth including for reference. The first is the limit of infinite Froude number in the supercritical region. We note that the supercritical flow consists essentially of a balance between inertia and viscosity effects with negligible gravity effects. This limit was first considered by Watson (Reference Watson1964) and later adopted by others (see Wang & Khayat (Reference Wang and Khayat2019) and references therein). For  $Fr \to \infty$, the solution of (3.5) upstream of the transition point reduces to
 \begin{align}\delta (r < {r_0}) = 2\sqrt {\frac{{70}}{{39}}\frac{r}{{Re}}} ,\quad h(r < {r_0}) = \frac{1}{4}\left( {\sqrt {\frac{{210}}{{13}}\frac{r}{{Re}}} + \frac{2}{r}} \right),\quad U(r < {r_0}) = 1.\end{align}
The transition point is determined by setting  $\delta ({r_0}) = h({r_0})$, yielding ${r_0} = {(78Re/875)^{1/3}}$, which is closely reflected in figure 3. Based on (3.14a), the boundary layer grows like $\sqrt r$, and the film height decreases predominantly like 1/r, as is also reflected in figure 3. Downstream of the transition point, the flow is governed by (3.8). Setting $Fr \to \infty$, it is not difficult to show that the solution reduces to
 \begin{equation}h(r \ge {r_0}) = \frac{{233}}{{340}}\frac{1}{r} + \frac{{175}}{{136}}\frac{{{r^2}}}{{Re}},\quad U(r \ge {r_0}) = \frac{4}{{5rh}},\end{equation}
suggesting that h decreases like 1/r for small r and increases like  ${r^2}$ for large r, as reflected in figure 3. For comparison, Watson's expressions are reproduced here in dimensionless form:
 \begin{equation}h(r > {r_0}) = \frac{{3c(3\sqrt 3 c - {\rm \pi})}}{{8{\rm \pi}}}\frac{1}{r} + \frac{{2{\rm \pi}}}{{3\sqrt 3 }}\frac{{{r^2}}}{{Re}},\quad U(r > {r_0}) = \frac{{3\sqrt 3 {c^2}}}{{4{\rm \pi} rh}},\end{equation}
where c = 1.402. Comparison of the numerical coefficients between (3.15) and (3.16) reveals a surprisingly close agreement between Watson's similarity solution and that based on the cubic velocity profile (see also Prince et al. Reference Prince, Maynes and Crockett2012).
The second asymptotic flow often used in the literature is the limit of negligible inertia in the subcritical region. The flow is captured using lubrication theory, which consists of integrating equation (2.1b) subject (2.2a) and (2.3b) to obtain the parabolic velocity profile  $u = (Re/F{r^2})h^{\prime}({z^2}/2 - hz)$. Upon using the mass conservation equation (2.4), we obtain the equation for h. This finally yields the following profiles for the film thickness and surface velocity:
 \begin{equation}h = {\left[ {h_\infty^4 + 6\frac{{F{r^2}}}{{Re}}\ln \left( {\frac{{{r_\infty }}}{r}} \right)} \right]^{1/4}},\quad U = \frac{3}{{4rh}},\end{equation}
where we recall  ${h_\infty }$ to be the thickness at the edge of the disk.
4. Validation
In this section, we validate our approach against existing measurements and numerical simulation. Additional features are reported on the flow observed and simulated, which illustrates the capabilities of our approach to capture some of the jump and vortex structure not captured by existing models.
4.1. Validation against numerical models
We first validate our approach against the numerical solutions of the Navier–Stokes equations and the boundary-layer equations (2.1) of Fernandez-Feria et al. (Reference Fernandez-Feria, Sanmiguel-Rojas and Benilov2019), as well as the depth-averaged model of Kasimov (Reference Kasimov2008). Unlike the first-order equation (3.8) which requires upstream and downstream boundary conditions to generate the inner and outer solutions (Kasimov Reference Kasimov2008; Wang & Khayat Reference Wang and Khayat2019), the boundary-layer equations (2.1) and (3.11) can accommodate two boundary conditions specified at the same or two different radial locations. However, specifying the two boundary conditions at the same location, such as near impact, may not generate an accurate profile, as seen in figure 4(a) from the boundary-layer profile. In this regard, Higuera (Reference Higuera1994) recognized the elliptic nature of the boundary-layer equations, and the need to ensure the upstream influence of the flow near the edge; boundary conditions must be imposed upstream and downstream of the jump. We note that Kasimov (Reference Kasimov2008) imposed (arbitrarily) the surface velocity and the film thickness at a radius 20 % larger than the jet radius. At this radius, Kasimov set the surface velocity equal to the jet velocity at impingement, and the film thickness was imposed by satisfying the conservation of mass. As shown in figure 4(a), our approach yields a better agreement with the Navier–Stokes solution compared with the boundary-layer and the first-order models. Clearly, the boundary-layer solution, which is not subject to a downstream boundary condition, fails to capture the free-surface profile close to the edge of the disk. On the other hand, the condition  $h^{\prime}(r = {r_\infty }) \to - \infty$ imposed in our approach and in the first-order model of Kasimov (Reference Kasimov2008) yields a close agreement with the Navier–Stokes solution. We see that Kasimov's solution overestimates the supercritical film thickness and underestimates the jump location. This is a consequence of the over-representation of viscous friction when using the parabolic profile. Moreover, this model cannot capture the vortex below the jump due to the shock-like assumption of the jump and the simple similarity profile adopted. Our close agreement with the Navier–Stokes supercritical profile confirms the necessity of first determining the boundary-layer flow near impact; this yields the suitable upstream boundary condition for the solution of (3.8), and further (3.11), in the viscous region. Simultaneously, the treatment of the flow in the developing boundary-layer region circumvents the need to fix arbitrarily or empirically an upstream boundary condition as in the case of Kasimov (Reference Kasimov2008) or Fernandez-Feria et al. (Reference Fernandez-Feria, Sanmiguel-Rojas and Benilov2019).
(a) Comparison of the free-surface profile based on the present approach against the boundary-layer and Navier–Stokes profiles of Fernandez-Feria et al. (Reference Fernandez-Feria, Sanmiguel-Rojas and Benilov2019), as well as the depth-averaged based profile of Kasimov (Reference Kasimov2008) for Re = 854.29, Fr = 97.19 and r∞ = 80. (b) Visualization of the flow field based on the present approach (U and  ${\tau _w}$ distributions in inset).

Figure 4(b) shows our predictions of the flow streamlines, as well as the wall shear stress and the surface velocity distributions (inset). The flow structure clearly shows a vortex at the bottom in conjunction with the jump. The shear stress decreases monotonically upstream of the jump. This monotonicity is expected given the weak gravity effect in the supercritical region; in the boundary-layer region, the wall shear stress  ${\tau _w} = 3/2\delta $, and further downstream, the film slope is negligibly small and (3.9) indicates that ${\tau _w} \approx 3U/2h$. In the vicinity of the jump, a recirculation zone appears, corresponding to ${\tau _w}(r) \le 0$. The separation and the reattachment of the flow are the consequence of the rapid change of the hydrostatic pressure induced by the rapid increase of the film thickness at the jump. We note that profile (3.9) indicates that ${\tau _w}$ vanishes when $U = Re{h^2}h^{\prime}/6F{r^2}$. Consequently, (3.10a) reduces to $Re{h^2}h^{\prime}/F{r^2} = 6/rh$, indicating that $h^{\prime} > 0$. Thus, the separation and reattachment occur below the ascending film portion; the vortex is therefore confined below the jump (Higuera Reference Higuera1994). The vortex also takes a similar shape to that based on the boundary-layer approach of Higuera (Reference Higuera1994), as well as the second-order models of Watanabe et al. (Reference Watanabe, Putkaradze and Bohr2003), Roberts & Li (Reference Roberts and Li2006) and Bonn et al. (Reference Bonn, Andersen and Bohr2009). The vortex is always placed under the jump region as a result of the balance between the shear forces applied by the disk and the flow above the vortex, which are directed towards the disk edge, and the hydrostatic pressure force, directed towards the impingement zone (Higuera Reference Higuera1994). The surface velocity U decreases after experiencing a weak maximum (not visible here).
Figure 5 shows a further comparison between the present approach and the numerical solution of the boundary-layer equations of Fernandez-Feria et al. (Reference Fernandez-Feria, Sanmiguel-Rojas and Benilov2019). Shown are the radial distributions of the film profile h (figure 5a), the wall shear stress  ${\tau _w}$ (figure 5b), the gravity term $- (Re/F{r^2})hh^{\prime}$ (figure 5c) and the radial momentum flux term $m \equiv (Re/r)(\textrm{d}/\textrm{d}r)\int_0^h {r{u^2}\,\textrm{d}z}$ (figure 5d) in (3.7). The comparison of the flow details shows surprisingly close agreement given the simplicity of the present approach and its capability in reproducing the physical mechanisms at the jump. As Fernandez-Feria et al. (Reference Fernandez-Feria, Sanmiguel-Rojas and Benilov2019) observed, upstream of the jump the radial momentum flux almost balances the shear stress at the wall, the gravitational term being almost negligible in comparison with the inertial and viscous terms. Close to the jump inception, the shear stress drops suddenly (figure 5b), becoming negative but small in magnitude. This drop is compensated by the abrupt growth of the gravity term (figure 5c) to balance the momentum flux (figure 5d), causing the jump to form (figure 5a). Hence, while the shear stress is negative and small in the recirculating flow region, the momentum flux is balanced almost exclusively by gravity. Further downstream, inertia becomes negligible, leaving the viscous and gravity forces in balance. Thus, downstream of the recirculation zone, the flow reaches a lubrication limit so that the velocity profile is practically parabolic. This is the reason why the lubrication assumption in the subcritical region yields an accurate description of the flow (Duchesne et al. Reference Duchesne, Lebon and Limat2014; Wang & Khayat Reference Wang and Khayat2018, Reference Wang and Khayat2019). However, and as we discuss below, the lubrication character in the bulk subcritical region does not extend all the way to the edge of the disk, where inertia, viscosity and gravity (as well as surface tension) become equally important (Higuera Reference Higuera1994). Fernandez-Feria et al. (Reference Fernandez-Feria, Sanmiguel-Rojas and Benilov2019) mentioned that the boundary-layer or thin-film approach equations are no longer valid (nor, of course, is the lubrication approximation) near the edge of the disk. This is, of course, true in principle as |h′| becomes very large at the edge. However, as our calculations and the agreement in figure 4 suggest, the boundary-layer or the present thin-film approach seems to hold around the sharp corner at the edge of the disk; the coincidence of the singularity with the edge location turns out to be sufficient to account for the upstream influence analysed by Higuera (see below).
Comparison of the present approach (solid curves) against the numerical solution of the boundary-layer equations (open circles) of Fernandez-Feria et al. (Reference Fernandez-Feria, Sanmiguel-Rojas and Benilov2019) for the radial distributions of (a) the film profile, (b) the wall shear stress, (c) the gravity term and (d) the radial momentum flux term in (3.7). Here the liquid is silicone oil with Re = 164.98, Fr = 16.87 and r∞ = 31.

4.2. Comparison against experiment
Next, we validate our approach against the measurements of Duchesne et al. (Reference Duchesne, Lebon and Limat2014) for silicone oil (20 cSt) of density  $960\ {\rm kg}\ {\rm m}^{-3}$ and kinematic viscosity $2 \times {10^{ - 5}}\ {\rm m}^{2}\ {\rm s}^{-1}$. The liquid was injected downward from a jet of radius a = 1.6 mm onto a horizontal circular disk of radius ${R_\infty } = 15\ \textrm{cm}$. The flow conditions in dimensionless form correspond to Re = 169.1, Fr = 16.87 and ${r_\infty } = 93.75$. The comparison of the free-surface profiles based on our approach and experiment is shown in figure 6. We also included the prediction from the Navier–Stokes numerical solution of Zhou & Prosperetti (Reference Zhou and Prosperetti2022). As in the numerical simulation of Wang & Khayat (Reference Wang and Khayat2021), the steady state was reached through the evolution of the transient flow. Zhou & Prosperetti (2022) reported that the computational domain was initially full of a gas medium with density and viscosity three orders of magnitude smaller than those of the liquid. The jet was injected from the inlet with a uniform velocity profile. For all wall boundaries the no-slip condition was used. At the outlet of the domain, the flow was essentially fully developed, with the static pressure fixed to a reference value. A standard outlet condition was used for the velocity; the velocity gradient normal to the boundary was set equal to zero.
Comparison of the free-surface profiles between our present approach (black solid line) and the measurements (open blue circles) of Duchesne et al. (Reference Duchesne, Lebon and Limat2014). The Navier–Stokes solution of Zhou & Prosperetti (Reference Zhou and Prosperetti2022) is also included (red solid line) as well as the lubrication solution (green dashed line). Arrows point to the jump heights  ${H_{J1}} = {h_{max}}$ and ${H_{J2}}$ based on the present and lubrication approaches, respectively. Here, Re = 169.1, Fr = 16.87 and r∞ = 93.75.

The present approach agrees well with experiment, but like the numerical solution it underestimates slightly the supercritical film thickness. Measuring the film height in this thin-film region may be associated with uncertainties. In contrast, in the subcritical region, the theoretical and numerical predictions almost fit all the experimental data points, except near the disk edge. The agreement with the Navier–Stokes solution of Zhou & Prosperetti (Reference Zhou and Prosperetti2022) is surprisingly close. We recall that the effect of surface tension was neglected in our model but was included in the numerical simulation (see also Wang & Khayat Reference Wang and Khayat2021), confirming that, in this case, the effect of surface tension may only be important near the edge and at the jump. We recall that the agreement was equally close between our approach and the numerical simulation in the absence of surface tension (figure 4). We discuss the edge thickness in more detail later. As far as the location of the jump is concerned, we see that the experimental data suggest a slightly smaller jump radius than that predicted by our approach and the numerical simulation. However, our theoretical prediction of the free-surface profile agrees well with the numerical one in the jump region. Finally, we have also included in figure 6 the subcritical profile based on the lubrication solution for reference, showing close agreement with experimental and numerical results, with some discrepancy near the jump.
Further theoretical details of the flow in figure 6 are given in figure 7, where we show our predictions of the flow streamlines (figure 7a), the wall shear stress (figure 7b) as well as the surface velocity (figure 7c) profiles. The flow structure in figure 7(a) clearly shows a vortex at the bottom in conjunction with the jump. The film thickness predicted using the first-order model (3.8) (depicted by the red curve) does not cross the jump since it terminates by a singularity. Nevertheless, the location of the singularity  $(r = {r_s})$ is shown to be close to the end of the separation zone predicted using the second-order theory.
Flow details corresponding to the profile in figure 6 using the present approach. Shown are the flow streamlines (a), the wall shear stress distribution (b) and the surface velocity distribution (c). The results are plotted in dimensionless form with Re = 169.10, Fr = 16.87 and r∞ = 93.75. In (a), the red curve represents the supercritical free surface of the film, showing a singularity, predicted using the first-order model (3.8).

Figure 7(b) depicts the distribution of the wall shear stress over the entire disk. The shear stress decreases monotonically upstream of the jump. As mentioned earlier, this monotonicity is expected given the weak gravity effect in the supercritical region. In this case, (3.9) indicates that  ${\tau _w} \approx 3U/2h$, which explains the sharper drop of the stress than the velocity as h increases with r. Further downstream, near the jump, a small separation zone corresponding to ${\tau _w} \le 0$ is observed over the range $7.93 < r < 9.58$. We recall from our earlier observation that separation occurs while the film slope is positive. Therefore, the vortex is confined between ${r_J}\;\textrm{and}\;{r_m}$, with $h^{\prime\prime}({r_J}) = h^{\prime}({r_m}) = 0$. Simultaneously, U decreases, after experiencing the maximum shown in the inset of figure 7(c). Indeed, at the separation point, we recall that $(Re/F{r^2}){h^2}h^{\prime} = 6/rh$, leading to $U = 1/rh$. In this case, $U^{\prime} ={-} 1/{r^2}h - (F{r^2}/Re)(6/{r^2}{h^5}) < 0$. Downstream of the separation region, the wall shear stress remains almost unchanged before exhibiting a sharp increase at the disk edge. The stress profile mimics well the flow condition at the disk edge, where a corner or stress singularity occurs (Higuera Reference Higuera1994; Scheichl et al. Reference Scheichl, Bowles and Pasias2018). This, in turn, justifies taking an infinite slope at the edge of the disk. The correlation between the stress singularity and infinite slope becomes evident when we deduce the wall shear stress from profile (3.9) and use (3.10a) to eliminate U:
 \begin{align}{\tau _w}(r = {r_\infty }) = \frac{1}{4}{\left( {6\frac{U}{h} - \frac{{Re}}{{F{r^2}}}hh^{\prime}} \right)_{r = {r_\infty }}} = \frac{1}{5}{\left( {\frac{6}{{r{h^2}}} - \frac{{Re}}{{F{r^2}}}hh^{\prime}} \right)_{r = {r_\infty }}} \approx{-} \frac{{Re}}{{5F{r^2}}}{(hh^{\prime})_{r = {r_\infty }}},\end{align}
which confirms the equivalence between the stress and geometrical singularities, and justifies taking an infinite slope at the edge of the disk as a result of the stress singularity (Higuera Reference Higuera1994; Kasimov Reference Kasimov2008; Dhar et al. Reference Dhar, Das and Das2020).
Figure 7(c) shows that the surface velocity remains equal to one in the developing boundary-layer region, then decreases, under viscous effects, almost linearly until the jump occurs. A small rise in the surface velocity is observed near the jump (see the inset of figure 7c, showing a small bump in U at  $r \approx 7.93$). In fact, U experiences a local maximum, coinciding with the change in the concavity at the jump radius. Indeed, upon differentiating (3.10a) and noting the dominance of the surface slope, we see that $U^{\prime} \approx {\textstyle{1 \over {15}}}(Re/F{r^2})hh^{\prime2}$, reflecting the increase in U at the jump location. Further downstream, U decrease monotonically and maintains an almost constant value in the subcritical region. In fact, inertia in this region is negligible, so the flow can be predicted reasonably well using the lubrication theory (see Duchesne et al. Reference Duchesne, Lebon and Limat2014; Wang & Khayat Reference Wang and Khayat2018, Reference Wang and Khayat2019; Baayoun et al. Reference Baayoun, Khayat and Wang2022). However, as discussed by Higuera (Reference Higuera1994), inertia becomes important again as the flow approaches the edge, resulting in a velocity increase close to the edge. Unlike the lubrication approach, our theory captures the flow complexity near the edge (see next).
Figure 8 shows the influence of Fr on the jump radius in figure 8(a), on the maximum film height  ${h_{max}}$ in figure 8(b) and on the Froude number at the jump in figure 8(c). The measurements of Duchesne et al. (Reference Duchesne, Lebon and Limat2014) are included for comparison over the same range of Fr as the experiment. The dependence on Fr reflects the dependence on the jet flow rate, in which case the Galileo number is maintained at $Ga = R{e^2}/F{r^2} = 100$. Our predictions are in good agreement with the measurements, essentially over the entire range of flow rates, reflecting a growth ${r_J}\sim F{r^{7/10}}$ (inset in figure 8a). This behaviour is essentially the same as that reported by Hansen et al. (Reference Hansen, Horluck, Zauner, Dimon, Ellegaard and Creagh1997), based on their measurements for silicone oil $({r_J}\sim F{r^{0.72}})$.
Influence of Fr (flow rate) on (a) the jump radius  ${r_J}$ (inset shows ${r_J} \approx 1.08F{r^{7/10}}$), (b) the maximum film height ${h_{max}}$ (inset shows ${h_{max}} \approx 1.32F{r^{4/25}}$) and (c) the Froude number at the jump $F{r_J}$ over the experimental flow rate range of Duchesne et al. (Reference Duchesne, Lebon and Limat2014), corresponding to 50.11 < Re < 551.25 or Ga = 100. Theoretical results (black solid curves) are compared against the measurements (blue circles) of Duchesne et al. (Reference Duchesne, Lebon and Limat2014). In (c), the open blue and red circles represent the $F{r_J}$ values based on the measured heights ${H_{J1}}$ and the height ${H_{J2}}$ (see figure 7).

Figure 8(b) shows an overall good agreement for  ${h_{max}}$ against the measurements of Duchesne et al. (Reference Duchesne, Lebon and Limat2014), suggesting that ${h_{max}}\sim F{r^{4/25}}$ (inset in figure 8b). This growth is most likely accompanied by a similar or faster growth of the supercritical film thickness, eventually leading to the vanishing of the jump as gravity continues to weaken (see below). Duchesne et al. (Reference Duchesne, Lebon and Limat2014) observed that the Froude number at the jump, $F{r_J} \equiv Fr/2{r_J}h_{max}^{3/2}$, is independent of Fr. Figure 8(c) shows that this independence seems to hold when we compare our prediction against the measured $F{r_J}$. Indeed, recalling from figures 8(a) and 8(b) that ${r_J}\sim F{r^{7/10}}$ and ${h_{max}}\sim F{r^{4/25}}$, we deduce that $F{r_J}\sim F{r^{0.06}}$, confirming the quasi Fr independence.
Figure 9 shows the dependence of the jump location on the Froude number (flow rate), where comparison is carried out against the measurements of Hansen et al. (Reference Hansen, Horluck, Zauner, Dimon, Ellegaard and Creagh1997), the spectral inertial-lubrication solution of Rojas et al. (Reference Rojas, Argentina, Cerda and Tirapegui2010) as well as the Navier–Stokes solution of Zhou & Prosperetti (Reference Zhou and Prosperetti2022) for water and silicone oil. We have included our results using the same log–log ranges used by Rojas et al. (Reference Rojas, Argentina, Cerda and Tirapegui2010) in their figure 2 and Zhou & Prosperetti (Reference Zhou and Prosperetti2022) in their figure 3. Our predictions are in close agreement with both numerical results. The agreement with the oil data is quite good. That with the water data is less so, although our results are in very close agreement with those of Rojas et al. (Reference Rojas, Argentina, Cerda and Tirapegui2010) and Zhou & Prosperetti (Reference Zhou and Prosperetti2022). We may also note that Hansen et al. (Reference Hansen, Horluck, Zauner, Dimon, Ellegaard and Creagh1997) stated that the radius of the jump was oscillating for Q greater than approximately  $15\ {\rm cm}^{3}\ {\rm s}^{-1}$ (Fr > 1.5) so that the experimental data reported are mean values. Zhou & Prosperetti (Reference Zhou and Prosperetti2022) noted that the unsteadiness mentioned by Hansen et al. (Reference Hansen, Horluck, Zauner, Dimon, Ellegaard and Creagh1997) was not observed in their simulation. We also recall that Rojas et al. (Reference Rojas, Argentina, Cerda and Tirapegui2010) had to impose the thickness at the edge of the disk as measured by Hansen et al. (Reference Hansen, Horluck, Zauner, Dimon, Ellegaard and Creagh1997). Both the present theoretical and existing numerical predictions tend to overestimate equally the jump radius compared to the measurements for water. The discrepancy appears to be higher for low flow rates, for a given liquid. A plausible explanation for the discrepancy is the difficulty in accurately locating the jump radius in reality. The qualitative and quantitative agreement with the numerical models is especially encouraging given the simplicity of the present approach compared with the spectral approach and numerical simulation.
Comparison of our approach (solid lines) for the jump radius with the measurements of Hansen et al. (Reference Hansen, Horluck, Zauner, Dimon, Ellegaard and Creagh1997) (open circles). Results for water (Ga = 627 840) are in red, those for silicone oil (Ga = 2790) are in blue. The dash-dotted lines are the predictions of the spectral inertial-lubrication model developed by Rojas et al. (Reference Rojas, Argentina, Cerda and Tirapegui2010), and the dashed lines those of the Navier–Stokes simulations of Zhou & Prosperetti (Reference Zhou and Prosperetti2022).

4.3. The nature of the subcritical flow
The present approach seems to capture well the turnaround usually observed at the edge of the disk. This is particularly obvious from our comparison with experiment and the solution of the boundary-layer and Navier–Stokes equations as shown in figures 4(a), 5(a) and 6. As the work of Higuera (Reference Higuera1994) suggests, both inertia and gravity become important at the edge. Obviously, inertia is neglected in a lubrication approach for the subcritical flow, which seems to yield an accurate description of the flow, including the vicinity of the jump, but less so near the edge, where the acceleration of the flow tends to infinity as a result of strong gravity effect (Duchesne et al. Reference Duchesne, Lebon and Limat2014; Wang & Khayat Reference Wang and Khayat2018, Reference Wang and Khayat2019). Consequently, at the edge, the wall shear stress should exhibit a (corner) singularity, and viscous effects are confined to a thin boundary layer that develops near the wall, similar to the free-surface flow exiting a channel (Tillet Reference Tillett1968; Khayat Reference Khayat2014, Reference Khayat2016, Reference Khayat2017). Higuera (Reference Higuera1994) carried out a matched asymptotic expansion and developed the solution in the viscous thin layer near the plate and matched it to the bulk solution in the inviscid region lying above. Higuera also estimated the order of magnitude of the region near the edge where inertial effects cease to be negligible in the subcritical region to be  $1 - x = O({(F{r^2}R{e^3}/{L^3})^{1/3}})$. This range is recast here in terms of the jet Froude and Reynolds numbers, where L is the half-length of the plate scaled by the half-width of the jet, and x = 1 coincides with the plate edge. We follow Higuera (Reference Higuera1994), and establish a similar estimate in our axisymmetric case by balancing the inertial term with the hydrostatic pressure gradient term in the momentum equation (2.1b), or by setting $ReU(\textrm{d}U/\textrm{d}r)\sim (Re/F{r^2})(\textrm{d}h/\textrm{d}r)$, where U and h are the subcritical surface velocity and film thickness. On the other hand, ignoring the convective terms, and integrating (2.1b), we arrive at the lubrication result: $U ={-} {\textstyle{1 \over 2}}(Re/F{r^2})(\textrm{d}h/\textrm{d}r){h^2}$. Following Higuera (Reference Higuera1994) and setting ${h_\infty } \approx 0$, we obtain from (3.17a): $h = {[(6F{r^2}/Re)\ln ({r_\infty }/r)]^{1/4}}$. Finally, the range where inertial effects become important near the edge is $1 - r/{r_\infty } = O({(F{r^2}R{e^3}/r_\infty ^8)^{1/3}})$.
5. Further results
In this section, we examine further the influence of the flow rate on the flow and jump structure over the same range of flow rates as considered by Duchesne et al. (Reference Duchesne, Lebon and Limat2014). We also keep the same conditions as in their experiment. In this case,  $5 < Fr < 55$ and $Re = \sqrt {Ga} Fr$, where the Galileo number remains very close to $Ga = 100$. Although the additional theoretical details reported in this section do not have their counterpart in the experiment of Duchesne et al. (Reference Duchesne, Lebon and Limat2014), the aim of including them here is to motivate further measurements. The influence of gravity and viscosity is also examined. We particularly focus on the film profile, the wall shear stress distribution and the flow field in the vicinity of the jump.
5.1. The influence of the flow rate
Further details of the influence of the flow rate on the flow are reported in figure 10, where the radial distributions of the film profile, wall shear stress and surface velocity are shown in figures 10(a), 10(b) and 10(c), respectively. Although similar or equivalent flow details were not reported by Duchesne et al. (Reference Duchesne, Lebon and Limat2014), the results in figure 10 and this section correspond to the same range of flow rates and conditions of their experiment. Figure 10(a) shows that the boundary-layer thickness diminishes with increasing flow rate, following closely (3.14a), with the film thickness profile well reflected in (3.14b). The figure indicates that although the jump radius and height both grow with the Froude number (as shown in figure 8), the shape of the jump, particularly its steepness or slope, is insensitive to the Froude number. While the supercritical region extends and diminishes in thickness, the subcritical region shrinks in length with diminishing thickness growth with flow rate, evolving from an essentially linear to a logarithmic (lubrication) profile (excluding the vicinity of the edge). Figure 10(b) suggests that the recirculation zone increases with flow rate, with the rate of drop in the wall shear stress diminishing until it eventually vanishes. Hence, the vortex beneath the jump widens but the height behaves inconsistently as the flow rate increases.
Influence of the Froude number (flow rate) on (a) the film profile, (b) wall shear stress (inset shows amplification in the downstream vicinity of the jump) and (c) surface velocity (insets show local profile for Fr = 5 and amplification near the disk edge). Here, Ga = 100 (50.11 < Re < 551.25) and r∞ = 93.75, corresponding to the range of flow rate in the experiment of Duchesne et al. (Reference Duchesne, Lebon and Limat2014).

Although the surface velocity appears to decrease monotonically with radial distance (figure 10c), this is not the case upon local scrutiny. We have already seen in figure 7(c) that U experiences a weak maximum just where the stress drops. This is confirmed further in the first inset of figure 10(c) for Fr = 5 where a relatively strong maximum occurs. The second inset in figure 10(c) indicates that while the velocity increases with distance as the flow approaches the edge of the disk at relatively low Fr, it decreases with distance at relatively high Fr. Physically, this reversal in trend is the result of the enhanced accumulation of the subcritical fluid with increasing flow rate.
It is worth mentioning first that the trend reversal in figure 10(c) is not predictable for subcritical lubrication flow. Indeed, recalling (3.17b) above or (5.6) from Wang & Khayat (Reference Wang and Khayat2019) for the parabolic velocity profile for lubrication flow, we see from mass conservation that  $U = 3/4rh$ or $U^{\prime} ={-} (3/4r{h^2})(h^{\prime} + h/r)$. When applied at the edge of the disk, and recalling the dominant slope, this relation yields ${U^{\prime}_\infty } \approx{-} 3{h^{\prime}_\infty }/4{r_\infty }h_\infty ^2$, confirming that ${U^{\prime}_\infty }$ is always positive for a draining fluid $({h^{\prime}_\infty } < 0)$. Rewriting equation (3.10b), after using (3.10a), as
 \begin{equation}- \frac{1}{{35}}\left( {24U - \frac{{11}}{{rh}}} \right)hU^{\prime} = \frac{3}{{4F{r^2}}}hh^{\prime} + \frac{3}{{2Re}}\frac{U}{h} + \frac{{12}}{{35}}\left( {{U^2} - \frac{1}{{{r^2}{h^2}}}} \right)\left( {h^{\prime} + \frac{h}{r}} \right),\end{equation}
we first observe that the coefficient of  $U^{\prime}$ is always negative at the edge for any flow rate. Consequently, when applying (5.1) at the disk edge, we see that the sign of ${U^{\prime}_\infty }$ depends on the competition among gravity, viscosity and inertia effects, represented by the terms $(3/4F{r^2})hh^{\prime}$, $(3/2Re)(U/h)$ and ${\textstyle{{12} \over {35}}}({U^2} - 1/{r^2}{h^2})(h^{\prime} + h/r)$, respectively, on the right-hand side of (5.1). As we recall from Wang & Khayat (Reference Wang and Khayat2019), the thickness and velocity at the edge of the disk are ${h_\infty } = O(F{r^{2/3}})$ and ${U_\infty } = O(F{r^{ - 2/3}})$, respectively. Therefore, the viscous term is $O(R{e^{ - 1}}F{r^{ - 4/3}})$ and is negligible at the edge, so that ${U^{\prime}_\infty }\sim{-} [(3/4F{r^2}){h_\infty } + {\textstyle{{12} \over {35}}}(U_\infty ^2 - 1/r_\infty ^2h_\infty ^2)]{h^{\prime}_\infty }$. From (3.10a), we deduce that $U_\infty ^2 - 1/r_\infty ^2h_\infty ^2$ is always negative. For relatively small flow rate (Fr < 25 in figure 10c), ${U^{\prime}_\infty }$ is positive, and becomes negative as Fr exceeds a critical value (Fr > 25).
One of the difficulties plaguing both theory and experiment is the identification of the jump location (Hansen et al. Reference Hansen, Horluck, Zauner, Dimon, Ellegaard and Creagh1997; Rojas, Argentina & Tirapegui Reference Rojas, Argentina and Tirapegui2013; Duchesne et al. Reference Duchesne, Lebon and Limat2014). Ideally, the jump location should correspond to the location where the local Froude number  $F{r_l}$ reaches unity, changing from $F{r_l} > 1$ in the supercritical region to $F{r_l} < 1$ in the subcritical region. In the present work, we assumed that the jump location coincides with the vanishing of the film surface concavity: $h^{\prime\prime}(r = {r_J}) = 0$. We now verify the plausibility of this assumption by examining the value of $F{r_l}$ at the jump radius. We introduce the local Froude number in terms of the average velocity and film height as $F{r_l} = Fr\langle u\rangle /\sqrt h$. Noting from (2.4) that $\langle u\rangle = 1/2rh$, then $F{r_l} = Fr/2r{h^{3/2}}$. Figure 11 depicts the influence of Fr (flow rate) on the distribution of $F{r_l}$ for the same range of flow rates as in the experiment of Duchesne et al. (Reference Duchesne, Lebon and Limat2014) and the profiles in figure 10. We have also plotted in the inset the critical radius that satisfies $Fr/2{r_c}h_c^{3/2} = 1$ as a function of Fr (flow rate), where ${h_c} \equiv h(r = {r_c})$ is the critical height, along with the theoretical and measured jump radius from figure 8(a). The inset shows that the ${r_J}$ and ${r_c}$ profiles are surprisingly close, hardly distinguishable. This excellent agreement confirms the accuracy of our assumption, $h^{\prime\prime}(r = {r_J}) = 0$, for identifying the location of the jump. The sharp drop of $F{r_l}$ with distance in figure 11 shows how quickly the effect of gravity increases in the supercritical region and across the jump, mostly relative to inertia (see figure 10c). Figure 11 also shows a sharp increase in $F{r_l}$, reflecting a drop in gravity effects compared with inertia.
Influence of Fr (flow rate) on the local Froude number  $F{r_l}$. Inset shows the distribution of the numerically predicted jump radius (black solid curve) and the critical radius (red dashed curve), as well as the experimental data of Duchesne et al. (Reference Duchesne, Lebon and Limat2014) (open blue circles). Here, Ga = 100 and r∞ = 93.75, corresponding to the experiment parameters.

Figure 12 shows the dependence of the vortex size, namely vortex length  ${L_{vortex}}$ and vortex height ${H_{vortex}}$, on the flow rate or Fr, for the same range as in the experiment of Duchesne et al. (Reference Duchesne, Lebon and Limat2014). The vortex length ${L_{vortex}}$ increases monotonically with Fr, behaving roughly like $F{r^{1/2}}$. Therefore, increasing the flow rate stretches the jump region in the streamwise direction (see also figure 10a), and thereby increasing the size of the recirculation zone (refer to the vertical dotted lines in figure 12(b–d) that delimit the jump length). However, the growth of the jump and vortex lengths is not commensurate with the growth of the vortex height, which tends to level off or saturates with increasing flow rate. The vortex immediately downstream of the jump also takes a similar shape to the one based on the boundary-layer approach of Higuera (Reference Higuera1994), as well as the second-order models of Watanabe et al. (Reference Watanabe, Putkaradze and Bohr2003) and Bonn et al. (Reference Bonn, Andersen and Bohr2009).
Dependence of the vortex size and structure on Fr (flow rate). (a) The vortex length and height and (b–d) the vortex structure for Fr = 5–55 (vertical dotted lines delimit the jump region/length). Here Ga = 100 and r∞ = 93.75, corresponding to the parameters in the experiment of Duchesne et al. (Reference Duchesne, Lebon and Limat2014).

5.2. The jump of type 0
Referring back to figure 10, we saw in particular from figure 10(b) that the vortex strength weakens with increasing flow rate, but the vortex does not vanish since its size remains essentially insensitive to the increase in the flow rate. Simultaneously, the jump intensity or steepness also remains, surprisingly, unaffected by the flow rate as the vortex strength diminishes. This begs the question as to whether a hydraulic jump can indeed exist for some flow conditions in the absence of recirculation. Some but little evidence of the existence of a type-0 jump can be found in the literature, particularly for a jump with an obstacle placed at the edge of the disk. Liu & Lienhard (Reference Liu and Lienhard1993) observed several forms of the circular hydraulic jump that appeared sequentially in their experiments as the downstream thickness was increased. For a small difference between the supercritical and subcritical depth, they observed a smooth jump of gradually increasing depth without any flow reversal. Later, the numerical simulation of Passandideh-Fard, Teymourtash & Khavari (Reference Passandideh-Fard, Teymourtash and Khavari2011) showed that a circular jump exists with no flow separation if the obstacle height is relatively small. More recently, a similar observation was made by Saberi, Teymourtash & Mahpeykar (Reference Saberi, Teymourtash and Mahpeykar2020) in their simulation for a jump on a convex target plate. Finally, Askarizadeh et al. (Reference Askarizadeh, Ahmadikia, Ehrenpreis, Kneer, Pishevar and Rohlfs2020) observed that for small obstacles (disk height-to-diameter ratio <0.05), the flow exhibits no vortices, and the streamlines perfectly follow the interfacial shape that represents the circular jump, which they termed as a jump of type 0. We next examine two situations by varying the effects of gravity and viscosity where separation may or may not occur.
The influence of gravity is assessed in figure 13 by varying Fr and keeping Re and the disk size fixed. Figure 13(a) shows that as the jump radius and height increase with Fr, the jump gets washed out of the disk for large Fr. This increasing trend of the jump radius with Fr also agrees with the simulation results of Passandideh-Fard et al. (Reference Passandideh-Fard, Teymourtash and Khavari2011) and the measurements of Avedisian & Zhao (Reference Avedisian and Zhao2000); both groups investigated the influence of gravity on the hydraulic jump. We emphasize that although the effect of gravity is weak in the supercritical region, this effect is crucial to include in the formulation for establishing the proper upstream conditions for the flow in the viscous region. In contrast, the subcritical film thickness increases significantly with Fr, as more flow accumulates (unable to drain) under lower gravity. In fact, the influence of Fr on the film thickness in both the supercritical and subcritical regions corroborates well the profiles in figure 2 of Higuera (Reference Higuera1994) for a planar jump. Figure 13(b) indicates that  ${\tau _w}$ decreases sharply with Fr downstream of the recirculation, but eventually saturates for large Fr. The boundary layer and film thickness as well as the wall shear stress remain essentially uninfluenced by gravity in the supercritical region, confirming the weak influence of gravity ahead of the jump, and the earlier predictions of Wang & Khayat (Reference Wang and Khayat2018, Reference Wang and Khayat2019). This is particularly evident from the inset in figure 13(b).
Influence of the Froude number (gravity) on (a) the free surface profile (solid curves) and the boundary-layer thickness (dashed curves), (b) the wall shear stress and (c) the local Froude number. The inset in (c) shows the distribution of the numerically predicted jump radius (black solid curve) and the critical radius (red dashed curve). (d–g) The streamlines for Fr = 2, 5, 10 and 15. Here, Re = 800 and r∞ = 25.

In the region near the jump, where the film height undergoes a significant change, the response is not as consistent. In fact, the influence of Fr on the separation length in figure 13(b) is not monotonic; the vortex size increases with Fr, reaches a maximum and decreases, to eventually vanish at some critical Froude number (Fr ≈ 13); the non-monotonic response is also illustrated in figure 13(d–g). Therefore, the jump can exist without a recirculation at a finite Froude number. The disappearance of the vortex suggests that there is no more flow separation, which is reflected by the wall shear stress remaining positive over the entire disk range (figure 13b). Recalling the discussion on the dissipation model by Mikielewicz & Mikielewicz (Reference Mikielewicz and Mikielewicz2009) and their figure 3, it is clear that a constant value of P, which is roughly the ratio of the downstream film height and the mean vortex radius, is unrealistic, as the vortex does not exist when Fr is sufficiently large, leading to an infinite P in this situation. It is worth noting that the hydraulic jump is not an essentially vortex or flow-separation phenomenon as indicated by Craik et al. (Reference Craik, Latham, Fawkes and Gribbon1981). The numerical simulation of Passandideh-Fard et al. (Reference Passandideh-Fard, Teymourtash and Khavari2011) also showed hydraulic jumps without flow separation. Here in figure 13(a) we show that the hydraulic jump still exists when the vortex disappears. In order to confirm that the profile is indeed a hydraulic jump in the absence of a vortex, we plot the value of the local Froude number in figure 13(c), showing that the local Froude number is equal to unity where the surface concavity vanishes. The inset in figure 13(c) also confirms that the critical radius coincides with the jump radius. In reality, the disappearance of the recirculation bubble may be associated with an instability at high Fr; the flow may become oscillatory and then turbulent downstream of the jump where the depth has increased (Craik et al. Reference Craik, Latham, Fawkes and Gribbon1981). However, and as we confirm below, the existence of the recirculation is intimately tied to the strength of the upstream curvature of the jump and the jump steepness.
The influence of the viscosity is depicted in figure 14, where Re is varied and Fr is fixed. As expected, a larger Re (lower fluid viscosity) results in a thinner boundary layer and film thickness in the developing boundary-layer region (figure 14a). In contrast to the effect of gravity, the supercritical flow is evidently dependent on viscous effects, as depicted by the dependence of the film (figure 14a) and stress (figure 14b) profiles. As Re increases, the film profile becomes flatter, with a weakening of the supercritical minimum and subcritical maximum film thickness, as the jump is pushed towards the disk edge (figure 14a). The increase in the jump radius is in agreement with the simulation of Passandideh-Fard et al. (Reference Passandideh-Fard, Teymourtash and Khavari2011). The jump becomes essentially non-existent at a relatively large value of Re. Simultaneously, the vortex diminishes in size as Re increases, and vanishes at Re much smaller than that corresponding to the vanishing of the jump (figure 14b). The distribution of the local Froude number in figure 14(c) also confirms the existence of the jump for all Re values.
Influence of Re (viscosity) on (a) the free surface profile (solid curves) and the boundary-layer thickness (dashed curves), (b) the wall shear stress and (c) the local Froude number. The inset in (c) shows the distribution of the numerically predicted jump radius (black solid curve) and the critical radius (red dashed curve). (d–g) The streamlines around the jump region for Re = 200, 400, 600 and 800. Here, Fr = 10 and r∞ = 25.

This clearly shows that the existence of a jump is not necessarily accompanied by the formation of a vortex (figure 14d–g). Finally, it is interesting to observe that the rate of increase of  ${\tau _w}$ with Re in the supercritical region (inset of figure 14b) is essentially the same as near the edge of the disk. We also observe that the strength of the singularity of the stress (equivalently of the film slope) at the edge weakens considerably with Re.
6. Conclusion
We examined the structure of the circular hydraulic jump and the recirculation appearing for a jet impinging on a disk. We formulated a composite mean-field thin-film approach, which consists of subdividing the flow domain into three regions of increasing gravity strength: a developing boundary layer near impact, an intermediate supercritical viscous layer leading up to the edge of the jump and a region comprising the jump and subcritical flow. The flow is assumed to drain at the edge of the disk. Unlike existing formulations that capture the continuous jump profile and the recirculation zone, the present approach does not require any empirically or numerically adjustable boundary conditions. The governing boundary-layer equations for the thin film are elliptic given the presence of the hydrostatic pressure gradient in the original boundary-layer equations, thus resulting in a two-point boundary-value problem, requiring upstream and downstream boundary conditions, particularly at the edge of the disk. The ellipticity is preserved through the presence of the gravity term in the velocity profile that was taken to satisfy the momentum equation at the disk. We demonstrated that the stress or corner singularity for a film draining at the edge is equivalent to the infinite slope of the film surface, which we impose as the downstream boundary condition. We validated our approach against existing measurements and numerical data. Comparison against numerical solutions of the boundary-layer equations and Navier–Stokes equations showed excellent agreement (figures 4–6), as well as that against existing models of the averaged film equations (figure 4). Comparison against existing measurements of the film profile and jump radius also showed close agreement and/or equally accurate predictions as existing numerical solutions (figures 6, 8 and 9).
In an effort to stimulate further experimental work, we examined the influence of flow rate (inertia) in some detail, over the same range of experimental conditions as that of Duchesne et al. (Reference Duchesne, Lebon and Limat2014). The results in § 5.1 highlight the influence of the flow rate on the film profile and vortex structure (figures 10 and 12). The film profile was found to have a significant influence on the jump size and vortex structure. We also address and resolve one of the difficulties facing theory and experiment in identifying the jump location. We assumed the jump radius to coincide with the change in the film surface concavity. We showed that this assumption is accurate since the predicted jump radius is very close to the critical radius based on the local Froude number (figure 11).
Finally, the flow in the supercritical region remains insensitive to the change in gravity (figure 13) but is greatly affected by viscosity (figure 14). The existence of the jump is not necessarily commensurate with the presence of a recirculation zone. We identify as type 0 the class of such jumps.
Funding
The financial support of the Natural Sciences and Engineering Research Council of Canada (grant number 05414) is gratefully acknowledged.
Declaration of interests
The authors report no conflict of interest.


 Open access