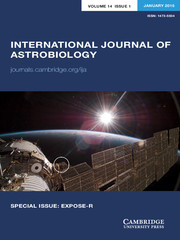


Introduction
Space research provides astrobiology the unique opportunity for in situ investigations under authentic conditions of outer space. Of special interest is to study the role of extreme solar and cosmic radiation in chemical evolution processes (Cottin et al. Reference Cottin2012) as well as in prebiotic and biological evolution processes on Earth (Betrand et al. Reference Betrand, Chabin, Brack, Cottin, Chaput and Westall2012; Wassmann et al. Reference Wassmann2012) and, potentially, on other celestial bodies. Space experiments allow also testing the likelihood of the Panspermia hypothesis (Horneck et al. Reference Horneck, Rettberg, Reitz, Wehner, Eschweiler, Strauch, Panitz, Starke and Baumstark-Khan2001), which assumes that life can be distributed beyond its planet of origin.
The ESA exposition facility for EXPOSE-R mission (EXPOSE-R) on board of the International Space Station (ISS) was provided by the European Space Agency (ESA) for astrobiological studies in low Earth orbit (LEO) outside of the ISS. The radiation field, encountered in this environment is of pivotal interest to astrobiology (Ferrari & Szuszkiewicz Reference Ferrari and Szuszkiewicz2009). To provide information about the diurnal variation of this radiation, the EXPOSE-R payload accommodated the radiation risks radiometer-dosimeter (R3DR). R3DR is a low mass and small dimensions automated device, which measures solar electromagnetic radiation (UV, VIS) in four channels and cosmic ionizing radiation. Its primary role was to monitor the time profile of cosmic radiation exposure during the EXPOSE-R mission.
The ionizing radiation field around the ISS is complex, composed of galactic cosmic rays (GCRs), trapped radiation of the Earth's radiation belts, solar energetic particles, albedo particles from Earth's atmosphere and secondary radiation produced in the shielding materials of the spacecraft or space suit of the astronauts, and in biological objects, exposed to it. The absorbed dose at a certain location, either outside or inside the spacecraft, is affected by both, the radiation field and the shielding of surrounding material (Badhwar et al. Reference Badhwar, Atwell, Cash, Petrov, Akatov, Tchernykh, Shurshakov and Arkhangelsky1998; Benton & Benton Reference Benton and Benton2001; NCRP, Report No. 142 2002). In LEO, the dose characteristics also depend on several other parameters, such as the spacecraft orbit parameters, solar cycle phase and current helio- and geophysical parameters. The profile of the ionizing radiation exposure between the Earth surface and free space was recently studied by use of Liulin-type instruments, i.e. low mass, low-power consumption or battery-operated dosimeters, which have been used in a variety of space missions (Dachev Reference Dachev2013b).
In this paper, we analyse long-term measurements of the radiation environment outside the Russian Zvezda module of the ISS generated by different radiation sources, including (i) GCRs, (ii) inner radiation belt (IRB)-trapped protons in the region of the South Atlantic anomaly (SAA) and (iii) outer radiation belt (ORB) relativistic electrons. The dose rates and fluxes were measured by the R3DR active dosimeter in the EXPOSE-R facility outside the Russian Zvezda module of the ISS in the period 11 March 2009–20 August 2010. Because of a failure of the computer connecting the external facility to the ISS and to ground (Rabbow et al. Reference Rabbow2014), no data were retrieved in three large time spans: 24 June–28 December 2009, 21 January–18 February 2010 and 12 March–21 March 2010.
The solar–geomagnetic conditions during the EXPOSE-R mission were clearly divided into two periods. The first one lasted from March 2009 to 10 January 2010 and was characterized by very low solar activity connected with an unusual deep minimum of the sunspot cycle 23 (Nandy et al. Reference Nandy, Muñoz-Jaramillo and Martens2013). In the ensuing period from January to August 2010, with the progressing of the sunspot cycle 24, the solar and geomagnetic activities were increased. The most interesting phenomenon observed in this period were the relativistic electron fluxes and dose rate variations during April–May 2010 geomagnetic disturbances. These variations in the R3DR data on the ISS were connected with the second largest fluence of electrons with energies >2 MeV in the history of the Global Geostationary Weather Satellite (GOES) measurements (Dachev et al. Reference Dachev, Horneck, Häder, Lebert, Richter, Schuster and Demets2012a, Reference Dachev, Tomov, Matviichuk, Dimitrov, Bankov, Reitz, Horneck, Häder, Lebert and Schuster2013; Dachev Reference Dachev2013a).
Materials and methods
R3DR instrument description
The R3DR for the EXPOSE-R facility (R3DR), which was mounted outside the Russian Zvezda module of the ISS is a Liulin-type miniature spectrometer-dosimeter (Horneck et al. Reference Horneck1999; Dachev et al. Reference Dachev2002; Häder & Dachev Reference Häder and Dachev2003). Figure 1 presents the external view of the EXPOSE-R facility (Rabbow et al. Reference Rabbow2009; Reference RabbowRabbow et al. this issue) and the R3DR instrument (Dachev et al. Reference Dachev2002; Dachev Reference Dachev2009), which is situated in the upper right corner of the picture. Its size is 76×76×34 mm, and weight about 0.12 kg. The alignment of the four photodiodes of the solar irradiance spectrometer is well seen in the centre of the R3DR. The ionizing radiation PIN diode with a 2 cm2 area is located beneath the aluminium cover and is therefore not visible. The R3DR instrument was mounted on the EXPOSE-R facility using four (4 mm) bolts in the corner pockets.
External view of the EXPOSE-R facility, mounted on the Zvezda module of the ISS, and the R3DR instrument, which is situated in the upper right corner of the picture. The four photodiodes of the solar irradiance spectrometer can be clearly seen in the centre of the R3DR. The ionizing radiation PIN diode with a 2 cm2 area is beneath the aluminium cover and therefore not visible (the photo was taken by the Russian astronauts during the process of mounting of the facility outside the Russian Zvezda module of ISS).

The ionizing radiation detector of the R3DR instrument was mounted about 3 mm below the 1 mm thick aluminium cover plate. Additionally, there was a technological shielding of 0.2 mm copper and 0.2 mm plastic material, resulting in less than 0.6 g cm−2 total shielding. This allows the measurement direct hits by electrons with energies higher than 1.18 MeV and by protons with energies higher than 27.5 MeV (Berger Reference Berger2009). (Remark: the above-mentioned values for the R3DR shielding and minimal energies were obtained recently by more precise calculations of the total shielding and have to replace the previously published values for the R3DE/R shielding of less than 0.4 g cm−2; see e.g. Dachev et al. Reference Dachev, Horneck, Häder, Lebert, Richter, Schuster and Demets2012a.) The surface of the detector (2 cm2 by 0.3 mm thickness) was oriented to the open space.
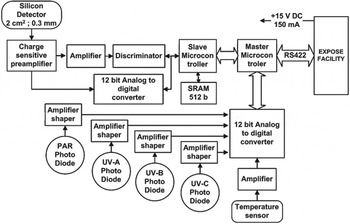
Figure 2 shows the block diagram of the R3DR instrument. The instrument obtained one fixed voltages of +15 V DC from EXPOSE-R. The telemetry output from the instrument was arranged as an RS422 serial interface with a maximum rate of 19.2 kbps. The instrument was controlled by a master microprocessor, which contained a 12 bit analogue-to-digital converter (ADC) for the UV data channels and the multiplexer. The ionizing radiation dose and flux measurements were arranged by a charge sensitive preamplifier and another fast 12 bit ADC. The slave microcontroller determined the deposited energy spectrum. Then the spectrum was transferred to the master micro-controller and to the telemetry system. The measurement cycle of the instrument was fixed at 10 s. During this time one energy deposition spectrum from the cosmic ionizing radiation channel was accumulated. Pulse height analysis technique was used for obtaining the deposited energy spectrum, which is further used for the calculation of the absorbed dose and flux in the silicon detector (Dachev Reference Dachev2009; Dachev et al. Reference Dachev, Horneck, Häder, Lebert, Richter, Schuster and Demets2012a).
Block diagram of the R3DR instrument. Upper part of the figure presents the ionizing radiation block schema, while in the bottom part the solar radiation and temperature block schema is presented.
Data analysis and dose interpretation procedure
The main measurement unit in the ionizing radiation spectrometer was the amplitude of the pulse after the preamplifier generated by particles hitting the detector. It is proportional to the energy loss in the detector by a factor of 240 mV MeV−1, and likewise to the dose and the linear energy transfer of the particle. These amplitudes were digitized and organized in a 256-channel spectrum using only the first 8 bits of the 12 bit fast ADC. The dose D(Si) in Grey [Gy], which is by definition one Joule deposited in 1 kg, was calculated by dividing the summarized energy deposition in the spectrum in J by the mass of the detector:
 $$D({\rm Si}) = K\sum\limits_{i = 1}^{{\rm 255}} {ik_i A_i} {\rm MD}^{ - 1}, $$
where MD is the mass of the detector in kg, k i is the number of pulses in channel ‘i’, A i is the amplitude in V of pulses in channel ‘i’, K is a coefficient, and K·i·k i ·A i is the deposited energy (energy loss) in J in channel ‘i’. Depending on the deposited energy for one exposure time, all 255 deposited dose values form the deposited energy spectrum.
The energy of the protons incident normally to the detector is calculated using the experimental formula described by Heffner (Reference Heffner1971). The exact formula used for calculating the proton energies from the measured specific dose (SD) values is detailed in Dachev (Reference Dachev2009).
Instrument calibrations
The R3DR instrument is a Liulin-type instrument, which was calibrated in a wide range of radiation fields. First, they were irradiated in gamma and neutron (137Cs, 60Co, AmBe and 252Cf) isotope source radiation fields and at the European organization for nuclear research (CERN-EC) high-energy reference field (Dachev et al. Reference Dachev2002; Spurny & Dachev Reference Spurny and Dachev2003). The calibrations revealed that except for charged energetic particles, the detector has high effectiveness for detecting gamma rays. The detector's neutron effectiveness depends on the energy of the neutrons. The absolute dosimetric calibrations with a standard 137Cs gamma source gave an error of the dose rate measured by a Liulin spectrometer of not more than 8–10% (Dachev et al. Reference Dachev2002; Spurny & Dachev Reference Spurny and Dachev2003).
Next, the spectrometers were calibrated at the cyclotron at Université Catholique de Louvain, Louvain-la-Neuve, Belgium (Dachev et al. Reference Dachev2002), and using proton and heavy ion beams from the NIRS Cyclotron facility and the HIMAC heavy ion synchrotron facility at NIRS, Chiba, Japan (Uchihori et al. Reference Uchihori, Kitamura, Fujitaka, Dachev, Tomov, Dimitrov and Matviichuk2002, Reference Uchihori, Kitamura, Yasuda, Kentaro, Yajima and Dachev2008). All calibration results and also the GEANT-4 and PHITS code simulations (Ploc et al. Reference Ploc, Uchihori, Kitamura and Sihver2011) revealed very good coincidence between measured and predicted energy depositions and proved the effectiveness of the Liulin spectrometers for the purposes of characterization of the space radiation field (Uchihori et al. Reference Uchihori, Kitamura, Yasuda, Kentaro, Yajima and Dachev2008; Dachev Reference Dachev2009).
Results
Data selection
From the data obtained with R3DR the following three expected radiation sources were selected: (i) GCR particles, (ii) protons with more than 27.5 MeV energy in the SAA region of the IRB and (iii) relativistic electrons with energies above 1.18 MeV in the ORB according to Dachev (Reference Dachev2009) and Dachev et al. (Reference Dachev, Horneck, Häder, Lebert, Richter, Schuster and Demets2012a). The simplest method to distinguish between the contribution of the IRB protons and the ORB electrons is based on the Heffner formulae (Heffner Reference Heffner1971), which uses the SD, which is the ratio of dose to flux (D/F). When the SD is less than 1 nGy cm−2 part−1 then the expected predominant type of radiation in a 10 s interval is electrons (of the ORB) of energies above 1.18 MeV. When the SD is greater than 1 nGy cm−2 part−1, then it is caused by protons (of the IRB) of energies above 27.5 MeV. The GCR source contributes to both ranges. It is easy to select them from the other two sources, because its dose rates are very low, i.e. below 20 μGy h−1. In conclusion, the same data selection procedure was used for the specification of the different radiation sources in R3DR data as those described in Dachev et al. (Reference Dachev, Horneck, Häder, Lebert, Richter, Schuster and Demets2012a) for R3DE data of the ESA exposition facility for EXPOSE-E mission (EXPOSE-E).
Most R3DR measurements were concentrated in GCR points. Ideally, 8640 measurements (3600×24=86 400/10=8640) per day with 10 s resolution would be possible because GCR are a permanently and globally existing source. For the whole period with available data (304 days) the average number of GCR measurements was 7599 per day, and 8140 per day as maximal number of GCR measurements. The dose rate covered a range between 0.03 and 20–25 μGy h−1. The lowest dose rates were close to the minimal L values (McIlwain Reference McIlwain1961; Heynderickx et al. Reference Heynderickx, Lemaire and Daly1996), e.g. to the magnetic equator because at each geographic location, the minimum momentum per unit charge (magnetic rigidity) a vertically incident particle can have and still reach a given location above the Earth is called the geomagnetic vertical cutoff rigidity (Shea & Smart Reference Shea and Smart2001). The highest GCR dose rates were at high latitudes equatorward from both magnetic poles.
The second most frequent amount of the R3DR measurements was for protons in the IRB. For the whole period of available data (302 days) the average number of IRB measurements per day with 10 s resolution was 511, with a maximal number of 648 and a minimal one of 128. The dose rates in the IRB varied between 10–15 and 2649 μGy h−1.
The average amount of the R3DR observations of sporadic relativistic electrons precipitating from the ORB (Dachev et al. Reference Dachev, Tomov, Matviichuk, Dimitrov and Bankov2009, Reference Dachev, Horneck, Häder, Lebert, Richter, Schuster and Demets2012a, Reference Dachev, Tomov, Matviichuk, Dimitrov, Bankov, Reitz, Horneck, Häder, Lebert and Schusterb) was 125 per day (for 300 days). This amount varied between 1 and 578 measurements per day. The highest dose rate from ORB electrons, namely 21 131.6 μGy h−1, was obtained from a single 10-s ORB measurement on 06 April 2010 at 13:03:34 UTC at 368 km altitude at coordinates longitude=139.2°E and latitude=49.8°S.
IRB dose rates and proton energies
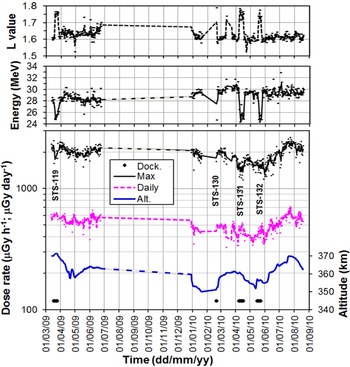
Figure 3 shows the IRB dose measurements obtained with the R3DR instrument for the time span of 12 March 2009–19 August 2010. IRB L values, proton energies in MeV, maximal dose rates in μGy h−1, daily dose rates in μGy day−1 and the average altitude in km are presented in the three panels. The periods of lacking data are 24 June–28 December 2009, 21 January–18 February 2010 and 12 March–21 March 2010. The curves are generated as moving averages over 2 points. The periods of the space shuttle docking http://www.nasa.gov/ are shown in the bottom of Fig. 3 with heavy dots and more accurately in Table 1. The orbital parameters of the ISS used in this paper were calculated by the KADR-2 software (Galperin et al. Reference Galperin, Ponamarev and Sinizin1980). The space shuttle dockings at the ISS (labelled with Dock. Points in Fig. 3)
Daily and hourly IRB L-values, protons energy, maximal and daily dose rates measured with the R3DR instrument during the EXPOSE-R mission. The space shuttle visits are marked with the STS number of flight.
Space Shuttle docking and undocking dates and UTC during the EXPOSE-R mission

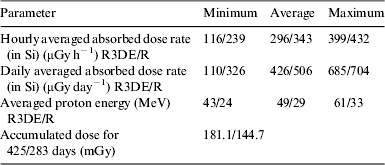
The maximal dose rates are the value in the interval from 00:00 to 24:00 h, which were larger than any other SAA 10-s measurement during that period. The largest value here was 2649 μGy h−1 obtained on 23 September 2010 at 08:14:44 UTC at 372 km altitude at a point with coordinates longitude=48.45°W and latitude=31.92°S. The average IRB dose rate for the whole measurement period was 347 μGy h−1. The daily IRB dose rates were obtained from all ‘full day’ (283 from 302 days of data) IRB 10-s doses (full day means more than 400 measurements per day). Next, the obtained average dose was multiplied by the number of the measurements per day which varied between 283 and 648 in dependence of the exact path of the ISS per 24 h through the IRB. The average number of measurements in the IRB per day was 531 from 283 full days of measurements. The average IRB daily dose rate was 506 μGy day−1 and the range was between 326 and 704 μGy day−1 (Fig. 3). The IRB statistics for the 283 full day measurements is presented in Table 2 and compared with that of the EXPOSE-E mission, obtained from Dachev et al. (Reference Dachev, Horneck, Häder, Lebert, Richter, Schuster and Demets2012a). It is remarkable that during the EXPOSE-R mission the values of the hourly and daily average dose rates were much higher than those of the EXPOSE-E mission. This difference is attributed to the lower surrounding shielding mass distribution around the R3DR instrument compared to the R3DE instrument shielding, which allowed the penetration of a higher flux of energetic IRB protons, as has been comprehensively studied and described by Dachev (Reference Dachev2013a).
Statistics of IRB parameters, as measured with the R3DR instrument during the EXPOSE-R missions (second value in each column after the slash) and compared to the IRB parameters obtained during the EXPOSE-E mission (first value in each column)
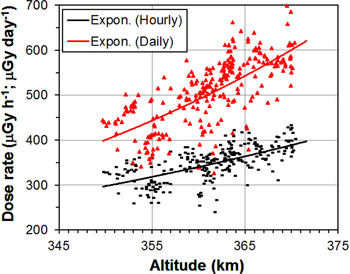
In Fig. 3, the average altitude values of the ISS were determined at the same points, from which the average daily dose rates were obtained. Comparison of these curves reveals a positive correlation between the long-term variation of the maximal and daily dose rates and the variations of the altitude of the station. This is more clearly shown in Fig. 4 as direct dependence of the dose rates from the altitude of the ISS. The points present the obtained hourly and daily dose rates, while the two curves are the obtained exponential fittings of the points. It is seen that for a relatively small rise of the altitude from about 350 to 370 km the average hourly dose rate rose from 300 to 400 μGy h−1, and the average daily dose rate from 400 to 600 μGy day−1. This altitudinal dependence in the bottom part of the IRB is a well-known phenomenon which has been competently described elsewhere (Filz & Holeman Reference Filz and Holeman1965; Gusev et al. Reference Gusev, Pugacheva, Jayanthi and Schuch2003; Dachev Reference Dachev2013b). Therefore, it will not be discussed further.
Dependence of the IRB average hourly and daily dose rates of the altitude of the ISS.
During three Space Shuttle docking events (STS-119, STS-131 and STS-132 mission) the IRB maximal dose rates fell by 200–300 μGy h−1 and reached an average level of 1700–1900 μGy h−1, The daily average IRB dose rate was also decreased by about 150 μGy day−1 for the dockings of the Space Shuttles during the STS-131 and STS-132 missions; however, it was practically not affected by the docking of STS-119. Similar decreases of the daily average IRB dose rate during Space Shuttle dockings to the ISS were observed during the EXPOSE-E mission (Dachev et al. Reference Dachev2011). Because the EXPOSE-R facility with the R3DR instrument was located at a larger distance from the Space Shuttle body than the EXPOSE-E facility with the R3DE instrument (Dachev Reference Dachev2013a), the decrease of the dose rate, measured here, was considerably smaller, displaced in time and sometimes even rising up. Similar reductions of the IRB dose rates during the Space Shuttle dockings were observed by Semones (Reference Semones2008) with the TEPC dosimeter in the Columbus module for the period 4–24 March 2008. Because of the larger shielding inside the Columbus module the reduction reported by Semones (Reference Semones2008) was from 120 to 97 μGy day−1 during the STS-123 docking time. Benghin et al. (Reference Benghin, Petrov, Drobyshev, Panasyuk, Nechaev, Miasnikov and Volkov2008) also reported about changes in the ratio of daily dose rates of the unshielded detectors numbers 2 and 3 of the DB-8 system during the dockings of Shuttles to the ISS.
The dockings of the Shuttles to the ISS decreased also the averaged energy of the protons in the IRB region from about 29 to 24 MeV (Fig. 3). The decrease of the averaged proton energy in the IRB region during the Shuttle dockings can be explained with the increase of the L values of their observations, shown in the upper panel of Fig. 3. The L value increase was generated by the hourly dose decrease, which moved the position of the average values towards higher L values where the average energy is less (Vette Reference Vette1991). It seems that being far away from the Space Shuttle body the R3DR protons energy data were not as strongly affected by the dockings as those observed with the R3DE instrument. This is also seen in the smaller average IRB protons energy of 29 MeV than in the R3DE value, which was 49 MeV. Smaller surrounding masses around the R3DR instrument (Dachev Reference Dachev2013a) is another reason for smaller IRB protons energy.
GCR daily doses
Figure 5 shows the daily dose rate history of the GCR component of space radiation in the period 12 March 2009–19 August 2010. There are four parameters in the lower panel: daily GCR absorbed dose rates, averaged for the same places L values, the times of Space Shuttle dockings with the ISS and daily averaged Oulu NM count rates (http://cosmicrays.oulu.fi/). This is a cosmic ray database from neutron monitoring, established in April 1964.
Daily GCR dose rates (heavy line) measured with the R3DR instrument during the EXPOSE-R mission, averaged L values (dashed line) obtained for the position of the GCR data, Space Shuttle dockings with the ISS (heavy dots) (bottom panel) and daily averaged Oulu neutron monitor (NM) counts rate (CR) (upper panel).

The GCR daily absorbed dose rates were obtained by first separation of all full day GCR 10-s doses. The full days of data are 286 from 304 mission days. One day of data is considered to be a full day if there were more than 5000 measured values from a maximum observed 8140. The daily number of GCR measurements is formed as the difference between maximum possible number of measurements (8400) and the sum of the IRB and ORB measurements. Next the obtained average hourly dose rate was multiplied by 24 (h) to calculate the daily dose. This is reasonable because GCR are permanently present at the orbit of the ISS. The average number of measurements per day in GCR was 7872 from 286 full days of measurements. More details about the GCR statistics are provided in Table 3.
Statistics of GCR parameters, as measured with the R3DE/R3DR instruments during the EXPOSE-E/EXPOSE-R missions

All hourly and daily R3DR values were smaller than those observed by the R3DE instrument during the EXPOSE-E mission. Most likely, these lower GCR dose rates in the R3DR instrument were produced partly by the decreased flux of secondary particles generated in the masses surrounding the instrument (Dachev 2013a) and partly by a lower GCR flux at the Earth radiation environment caused by the higher solar activity.
Figure 5 shows relatively high and constant values of the daily dose rates in the first period of measurements (12 March 2009–10 March 2010) and lower values with strong variations in the second period (10 March 2010–19 August 2010). These variations were caused by the solar modulation of the GCR flux (Usoskin et al. Reference Usoskin, Bazilevskaya and Kovaltsov2011) as explained in the following.
It is seen in Fig. 5 that the data sets of the daily GCR dose rates correlate well with the long-term ‘(Oulu NM CR)’ variations. (The Oulu neutron monitor count rate is available online at http://cosmicrays.oulu.fi/). Both, the GCR fluxes and the neutron count rates are influenced by the solar activity. The higher daily GCR dose rates in the first period of the observations were caused by the decrease of the interplanetary magnetic field connected with the unusual deep minimum at the end of the sunspot cycle 23 (Nandy et al. Reference Nandy, Muñoz-Jaramillo and Martens2013). This decreased interplanetary magnetic field allowed a higher number of GCR particles to penetrate into the heliosphere and reach the orbit of the ISS (Usoskin et al. Reference Usoskin, Bazilevskaya and Kovaltsov2011).
Another important phenomenon seen in Fig. 5 is the short-term correlation between the GCR daily values and the L values, which characterize the position, at which the average value is obtained. The explanation is well understood and is connected with the increase of the Earth magnetic field towards smaller L values, which decrease the GCR flux. This has also been observed during the EXPOSE-E mission with the R3DE data (Dachev et al. Reference Dachev, Horneck, Häder, Lebert, Richter, Schuster and Demets2012a).
During the dockings of the Space Shuttles no. 119 and 131, the GCR daily dose rates went through a minimum. However, these minima were not generated by the presence of the shuttles, but by the decrease of the GCR flux towards the Earth, as it is demonstrated in the Oulu NM count rate and the decrease in L values (Fig. 5).
ORB daily doses
Relativistic electron enhancements in the ORB are one of the major manifestations of space weather (Zheng et al. Reference Zheng, Lui, Li and Fok2006; Wrenn Reference Wrenn2009) near the Earth's orbit. These enhancements occur mainly after magnetic storms. The variations of the R3DE/R ORB daily fluences and dose rates have already been studied earlier (Dachev et al. Reference Dachev, Horneck, Häder, Lebert, Richter, Schuster and Demets2012a, Reference Dachev, Tomov, Matviichuk, Dimitrov, Bankov, Reitz, Horneck, Häder, Lebert and Schusterb, Reference Dachev, Tomov, Matviichuk, Dimitrov, Bankov, Reitz, Horneck, Häder, Lebert and Schuster2013; Dachev Reference Dachev2013a).
The R3DR daily ORB dose rates were obtained by first separation of all full day (286 from 302 days of data) 10-s doses. Because of the very sporadic character of the ORB electron fluxes, we considered only those days as full days, in which at least ten observations were made. Next, the obtained average dose was multiplied by the number of measurements per day which varied between 10 and 578 in dependence of the geomagnetic activity. The average number of measurements per day from ORB was 145 from 286 full days of measurements. The average ORB dose rate was 89 μGy day−1 in the range between 0.64 and 2348 μGy day−1. More details about the ORB statistics are seen in Table 4.
Statistics of the ORB parameters, as measured with the R3DE/R3DR instrument during the EXPOSE-E/EXPOSE-R mission
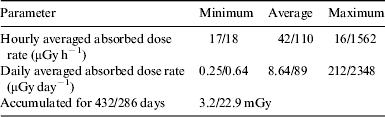
Figure 6 accumulates in the bottom panel all available R3DR data of averaged daily fluences of relativistic electrons (ISS Flu) and daily absorbed dose rates (ISS AD). The daily R3DR absorbed dose rates followed very closely the daily fluence because of a strong linear dependence between them as seen from formulae (1). The R3DR daily fluences were obtained from the available flux data especially to be compared with the GOES-11 daily fluence data for energies above 2 MeV (see MA GOES curve in Fig. 6). This comparison is possible because the average place of the ISS ORB fluence data were at L=4.4, whereas the GOES-11 daily fluence data were obtained at L=6.6. The daily global Ap index (Ap index is averaged planetary daily index), which characterize the Earth magnetic field activity (http://www.swpc.noaa.gov/info/Kindex.html) is shown in the upper panel of Fig. 6. All curves represent the moving average over 2 points of the raw data.
Results for the daily ORB dose rate (ISS AD) deposited by electron fluence (ISS flu) measured with the R3DR instrument on ISS. These data are compared with the daily GOES-11 satellite >2 MeV (GOES) fluence and the daily global Ap index in the upper panel.
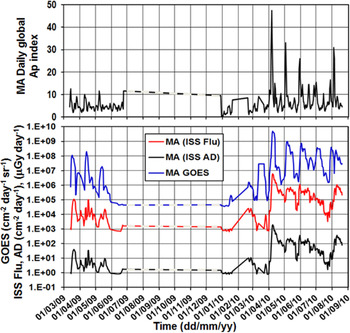
As seen from the upper panel in Fig. 6 the period between 1 March 2009 and 1 March 2010 is characterized by low solar and magnetic activity, which is the main reason for the low ORB activity. Despite the small Ap indexes in this period Fig. 6 shows that each increase in the Ap or each new magnetic storm increased the fluence recorded on both satellites, GOES and ISS (Zheng et al. Reference Zheng, Lui, Li and Fok2006).
The most interesting period in Fig. 6 began on 1 April 2010 and covered all data till 20 August. The R3DR and GOES-11 daily relativistic electrons fluences almost explosively increased on 6 and 7 April. Although the created magnetic storm on 6 April was moderate (daily Ap=49, minimal Dst=−72 nT at about noon), the second largest values in history of GOES fluences of electrons with energies >2 MeV were measured. The increase in the GOES-11 fluence of electrons with energies more than 2 MeV was by 4.5 orders of magnitude, whereas the R3DR>1.18 MeV daily fluences and daily absorbed doses increased less than 3.5 orders of magnitude. Till the end of the measurements with the R3DR instrument at 20 August 2010, a few smaller Ap maxima were observed and they were reflected by very similar responses on the GOES satellite, while the ISS data correlation was much smaller. The geomagnetic conditions on 2–3 May 2010 were similar in magnitude as those on 6 April, but the response of the R3DR daily fluence and dose rate of the 3 May storm was about 1.5 orders of magnitude less than the 5–6 April response. We do not have any explanation of the reasons for these large differences in the responses and we hope that our experimental data will support the theoretical study of the ORB physics.
In the case of very high daily relativistic electron fluxes as on 7 April 2010 the daily absorbed ORB dose rate increased up to 2348 μGy day−1, which is much higher than that of the IRB and GCR sources. During this period of intense ORB energetic electrons precipitations, three extra vehicular activities (EVAs) were performed by the STS-131 astronauts on 9, 11 and 13 April 2010 (http://www.nasa.gov/mission_pages/shuttle/shuttlemissions/sts131/main/index.html). The accumulated doses (mainly from ORB and GCR) calculated from R3DR measurements during those 6 h EVAs were between 440 and 300 μGy. These values pose no extreme danger to the health of the astronauts because the daily average absorbed dose rates inside of the ISS, reported by Reitz et al. (Reference Reitz, Beaujean, Benton, Burmeister, Dachev, Deme, Luszik-Bhadra and Olko2005), vary in the range 74–215 mGy day−1. On the other hand, the relativistic electrons did not have enough energy to penetrate into the body of the astronauts and therefore deposited their dose mainly in the skin and eyes. The same is valid for the EXPOSE-R samples. Only those biological or chemical objects, which were at very low shielding, would have been exposed to the ORB source.
Discussion
The obtained total daily dose rate was calculated as the sum of the IRB, GCR and ORB dose rates, which is equal to 675.4 μGy day−1. This value is close to the one obtained by Reitz et al. (Reference Reitz2009) for a depth dose at 0.6 g cm−2 shielding measured at the surface of the human phantom Matroshka, which was attached to the outside of the ISS and exposed to open space from January 2004 to August 2005.
The value of the daily GCR dose rate inside the Russian segment of the ISS, measured with an unshielded detector (no. 4) of the DB-8 system in the period March–June 2009 (Benghin et al. Reference Benghin, Petrov, Panasyuk, Volkov, Lyagushin, Nikolaev, Nechaev, Tel'tsov and Lichnevskii2010), was estimated to range at about 100 μGy day−1, which is slightly higher than the 81.4 μGy day−1 obtained by R3DR instrument (Table 3). Part of the larger values obtained inside the ISS can be attributed to secondary particles generated by the walls of the ISS.
The value of the daily IRB dose rate inside the Russian segment of the ISS, measured with an unshielded detector (no. 4) of the DB-8 system in the period March–June 2009 (Benghin et al. Reference Benghin, Petrov, Panasyuk, Volkov, Lyagushin, Nikolaev, Nechaev, Tel'tsov and Lichnevskii2010; see slide no. 15) was estimated to range at about 105 μGy day−1, which is much less than the averaged values of 506 μGy day−1 obtained with the R3DR instrument (Table 2). This difference can be explained by the fact that the latter data were obtained behind much less shielding of about 0.6 g cm−2 compared to more than 20 g cm−2 of the ISS walls.
The daily dose rate inside the ISS varies considerably, depending on the location inside the ISS and the shielding by the ISS walls. According to Gaza et al. (2010) the total daily dose rate (GCR+IRB), measured by 22 passive dosimeters (ISS Radiation Area Monitors), varied from about 160 μGy day−1 in well-shielded locations up to 360 μGy day−1 in less shielded locations.
The measurements of ORB doses outside the ISS, obtained by the R3DE/R instruments are still unique. Therefore, we were not able to compare them with any other measurement. The dynamics of the ORB doses measured for the whole EXPOSE-mission periods confirm conclusions made by Dachev et al. (Reference Dachev, Tomov, Matviichuk, Dimitrov, Bankov, Reitz, Horneck, Häder, Lebert and Schuster2013) that the ORB relativistic electrons are common on the ISS. Although the obtained doses do not pose extreme risks for the astronauts being on EVA, they have to be considered as a permanently present source, which requires additional comprehensive investigations.
As mentioned above, it is one of the purposes of the R3DR measurements, to provide information on the diurnal variation of the space radiation to the scientists from other EXPOSE-R experiments. The detector of the R3DR instrument was located behind 0.6 g cm−2 shielding at the level of the first samples (see Fig. 1). The EXPOSE-R facility with the R3DR instrument was far away from the body of the Zvezda module, so that there were not any other high mass objects around it. Therefore, it is expected that all samples within EXPOSE-R had similar GCR, IRB and ORB daily dose rates as those obtained with the R3DR instrument (see Tables 2–4). One has to consider that the IRB doses in the samples will decrease with increasing thickness of the shielding as shown in Nealy et al. (Reference Nealy2007). In order to obtain the total accumulated dose from any of the sources it is necessary to multiply the average daily dose rate by the number of exposure days. Some small increase of the GCR doses can be expected behind thicker shielding because additional doses will result from secondary particles generated in the shielding (Nealy et al. Reference Nealy2007).
The IRB proton and ORB electron daily dose rates are valid behind less than 0.6 g cm−2 shielding. The calculated values of ORB doses account only for the first few mm thickness, because the doses of ORB electrons, having less penetration, decrease rapidly with the depth of the samples.
Acknowledgements
The authors are grateful to the following colleagues: B. Tomov, Yu. Matviichuk, Pl. Dimitrov and N. Bankov from the Space Research and Technology Institute at the Bulgarian Academy of Sciences for help in the development, building and data interpretation of the R3DR instrument.
Conflict of Interest
None.



