


1. Introduction
1.1 Voicing in Laurentian French
A number of studies have investigated the realization of obstruent voicing in Canadian French. These studies have all been conducted on varieties of Laurentian French, the dialect that originates in the Saint Lawrence River Valley and is spoken from Quebec to British Columbia (a different variety, Acadian French, is spoken in Atlantic provinces). Early studies initially claimed that stop voicing in monolingual Montreal French speakers has an atypical Voice Onset Time (VOT) distribution, with voiced stops exhibiting either a lead or a short lag VOT and voiceless stops showing a short lag VOT (Caramazza et al. Reference Caramazza, Yeni-Komshian, Zurif and Carbone1973; Caramazza & Yeni-Komshian Reference Caramazza and Yeni-Komshian1974), resulting in some overlapping VOT-values. Results of identification tests also suggested a less than categorical perception of stop voicing but failed to identify the other acoustic properties that would have been involved in the contrast (Caramazza et al. Reference Caramazza, Yeni-Komshian, Zurif and Carbone1973). More recent studies converge on a simpler picture, in which the Laurentian French voicing contrast produced by monolinguals is quite similar to that of European French varieties, with clear lead VOT in voiced stops and short to mid lag VOT in voiceless stops (Jacques Reference Jacques1984; Ryalls et al. Reference Ryalls, Larouche, Dupont and Fournier1990; Jacques & Gurlekian Reference Jacques and Gurlekian1992; Ryalls et al. Reference Ryalls, Cliché, Fortier-Blanc, Coulombe and Prud’hommeaux1997; MacLeod Reference MacLeod2006; Fowler et al. Reference Fowler, Sramko, Ostry, Rowland and Hallé2008; MacLeod & Stoel-Gammon Reference MacLeod and Stoel-Gammon2009; Louër Reference Louër2019). A possible exception is Sundara (Reference Sundara2005), who reports some overlap in VOT in dental stops and proposes that the voicing contrast may be reinforced by differences in burst intensity and mean burst frequency. The existence of such secondary cues to stop voicing was pointed out in the 1980s by Jacques (Jacques Reference Jacques1984; Jacques & Charbonneau Reference Jacques, Charbonneau, Raquel Delgado-Martins, André Bothorel, Wioland and Zerting1989), who found a longer total duration and burst duration in voiceless stops, as well as a higher f0 and flatter F1 transitions in vowels immediately adjacent to voiceless stops. The voicing contrast in Montreal French fricatives has also been shown to largely depend on the presence of phonetic voicing, although voiced fricatives tend to be shorter, have longer preceding vowels, and are generally followed by vowels with a lower f0 (Jacques Reference Jacques1984, Reference Jacques1990).
Although not directly relevant for the research questions of the present study, a few words about the VOT contrast of French-English bilinguals is in order since all participants in the current study also speak Canadian English. Several studies of Laurentian French voicing have looked at the effect of bilingualism in English on the production of voicing. These studies all concur that early French-English bilinguals show VOT distributions that are less categorical than those of monolinguals in either language. In practice, early bilingual speakers tend to have a shorter negative VOT in their French voiced stops and a longer positive VOT in their French voiceless stops (Caramazza et al. Reference Caramazza, Yeni-Komshian, Zurif and Carbone1973; MacLeod & Stoel-Gammon Reference MacLeod and Stoel-Gammon2005; MacLeod Reference MacLeod2006; Sundara, Polka & Baum Reference Sundara, Polka and Baum2006; Fowler et al. Reference Fowler, Sramko, Ostry, Rowland and Hallé2008; MacLeod & Stoel-Gammon Reference MacLeod and Stoel-Gammon2009).
1.2 The aerodynamic voicing constraint and the mechanisms used to circumvent it
The production of phonetic voicing (i.e., vocal fold vibrations) in obstruents is constrained by the presence of a full or partial oral closure causing a pressure buildup in the supraglottal cavity and thus hindering the transglottal airflow. This long-known mechanism has been termed the aerodynamic voicing constraint (AVC) (Ohala Reference Ohala and MacNeilage1983, Reference Ohala2011).
The AVC varies by place of articulation (Westbury & Keating Reference Westbury and Keating1986): for instance, voicing should be easier to maintain in bilabials than in more posterior obstruents because of their larger supraglottal cavity volume (Ohala Reference Ohala and MacNeilage1983). One would also expect fricatives to be less affected by the AVC than stops because of their partial closure. However, as argued by Ohala, voiced fricatives are cross-linguistically rarer than voiced stops because fricatives, regardless of voicing, require a high oral pressure that impairs the transglottal airflow required for voicing and possibly have a different vocal fold setting (Ohala Reference Ohala and MacNeilage1983, Reference Ohala2011; Ohala & Solé Reference Ohala, Solé, Fuchs, Toda and Zygis2010). It is therefore expected that voiced fricatives are affected by the AVC and require a lower supraglottal pressure than their voiceless counterparts.
Languages use a variety of mechanisms to override the AVC (overviews in Rothenberg Reference Rothenberg1966 and Westbury Reference Westbury1983). Voiced stops can be produced with oral and nasal leakage in order to lower supraglottal pressure (Kent & Moll Reference Kent and Moll1969; Solé Reference Solé2018). Various mechanisms can also be used to expand the supraglottal cavity. These include the passive compression of soft tissues, but also more active maneuvers like the expansion of the pharynx (mainly by advancing the tongue root), the vertical expansion of the oral cavity by either raising the velum or lowering the tongue body, and the lowering of the larynx.
Pharyngeal expansion in voiced obstruents has been documented in English (Kent & Moll Reference Kent and Moll1969; Perkell Reference Perkell1969; Bell-Berti Reference Bell-Berti1975; Westbury Reference Westbury1983). Recent ultrasound studies have confirmed that the pharyngeal cavity is enlarged by fronting the tongue root in the voiced stops of a number of languages with voicing contrasts such as American English, Brazilian Portuguese (Ahn Reference Ahn2018a, Reference Ahn2018b), German (Ahn Reference Ahn2018b), and Arabic (Alamri Reference Alamri2022). Tongue root advancement in voiced stops has also been found in languages with more than a two-way laryngeal contrast, such as Hindi (four-way laryngeal contrast) and Thai (three-way laryngeal contrast) (Ahn Reference Ahn2018b). Similar results are obtained in MRI studies: the voiced geminates of the Ikema dialect of Miyako Ryukyuan are produced with pharyngeal expansion (Fujimoto, Shinohara & Mochihashi Reference Fujimoto, Shinohara and Mochihashi2023), as are English voiced stops (Zhang & Goldstein Reference Zhang and Goldstein2023) and voiced fricatives (Narayanan, Alwan & Haker Reference Narayanan, Alwan and Haker1995; Proctor, Shadle & Iskarous Reference Proctor, Shadle and Iskarous2010). Interestingly, there is evidence that sonorants do not merely pattern with voiced or voiceless obstruents in terms of pharyngeal expansion. In an X-ray study, Westbury (Reference Westbury1983) reported that the width of the pharynx during English nasal stops is intermediate between voiceless and voiced oral stops.
Tongue body lowering seems to be frequently associated with obstruent voicing in English, Portuguese, Italian and Ewe (Perkell Reference Perkell1969; Bell-Berti & Hirose Reference Bell-Berti and Hirose1975; Svirsky et al. Reference Svirsky, Stevens, Matthies, Manzella, Perkell and Wilhelms-Tricarico1997; Ahn Reference Ahn2018a; Coretta Reference Coretta2020). However, there is evidence that in English (Svirsky et al. Reference Svirsky, Stevens, Matthies, Manzella, Perkell and Wilhelms-Tricarico1997; Ahn Reference Ahn2018a) and German (Ahn Reference Ahn2018b), it may be more strongly associated with bilabial stops than with stops in other places. Velum raising is also reported in English by Bell-Berti & Hirose (Reference Bell-Berti and Hirose1975) but not by Zhang & Goldstein (Reference Zhang and Goldstein2023).
In addition, larynx lowering has been found in English voiced obstruents (Ewan & Krones Reference Ewan and Krones1974; Riordan Reference Riordan1980; Westbury Reference Westbury1983; Zhang & Goldstein Reference Zhang and Goldstein2023) and could be responsible for the lowering of the hyoid bone found in these consonants (Kent & Moll Reference Kent and Moll1969). The maximum lowering of the larynx measured by Westbury (Reference Westbury1983) during the closure of a voiced stop was 6.5 mm. Westbury (Reference Westbury1983) additionally reported that the larynx is systematically lower during nasal stops than oral ones, which does not seem attributable to the circumvention of the AVC. One of Fujimoto et al. (Reference Fujimoto, Shinohara and Mochihashi2023)’s two Miyako Ryukyuan speakers also exhibited larynx lowering in voiced geminates.
Few studies have looked at the strategies used to bypass the AVC in French (Solé Reference Solé2018; Zhang & Goldstein Reference Zhang and Goldstein2023). Solé (Reference Solé2018) obtained aerodynamic evidence for nasal leakage and cavity expansion in French /b, d/, and for implosivization in French /b/, likely attributable to larynx lowering. Zhang & Goldstein (Reference Zhang and Goldstein2023) found in a real-time MRI study that French voiced stops are realized with a greater oral aperture, a greater velum height, a more advanced tongue root and a greater post-constriction cavity area than their voiceless counterparts but did not find evidence that they are produced with a lower larynx.
1.3 Research questions
The goal of this paper is to investigate the articulatory adjustments used to circumvent the AVC by enlarging the volume of the supraglottal cavity during the production of Laurentian French voiced obstruents. Specifically, the role of tongue root advancement, tongue body lowering and larynx lowering will be considered. Three main questions are the focus of this research:
-
1) Which of these anti-AVC maneuvers are used in the production of Laurentian French obstruent voicing?
-
2) Do certain segments employ these mechanisms to a greater extent than others and if so, which ones?
-
a. It is expected that these maneuvers will be more prevalent and have a greater magnitude in stops, in which there is a full closure, than in fricatives (Ohala Reference Ohala and MacNeilage1983; Ohala & Solé Reference Ohala, Solé, Fuchs, Toda and Zygis2010), and that these will be more noticeable in both types of obstruents than sonorants, as sonorants are not thought to be affected by the AVC.
-
b. It is predicted that labial obstruents will make less use of anti-AVC maneuvers because their larger supraglottal cavity results in a less dramatic oral pressure buildup than more posterior obstruents (Ohala Reference Ohala and MacNeilage1983; Westbury & Keating Reference Westbury and Keating1986). That said, the tongue position is less constrained during labial closures so a greater use of lingual anti-AVC maneuvers remains possible.
-
-
3) Finally, is there a correlation between the use of anti-AVC maneuvers and the duration of phonetic voicing in stop closures and fricatives?
2. Methodology
Ultrasound imaging was employed to explore the use of the three anti-AVC maneuvers being investigated. Laryngeal ultrasound data was collected first, followed by lingual ultrasound data. Acoustic signals were also recorded during both ultrasound recording sessions.
2.1 Participants
Data from thirteen native Laurentian French speakers (8 female) with an age range of 18 to 24 years old (mean = 20) is presented here. Three additional participants (two male) were excluded due to poor quality of the ultrasound images or misplacement of the probe prior to recording. All participants were born and raised in Canada, either in the provinces of Ontario or Quebec, and speak French predominantly with their family and/or peers. All participants are also bilingual in English with ages of acquisition ranging from zero to nine years of age. Participants were all students at the University of Ottawa and received either course credit or a $20 CAD compensation.
2.2 Target words
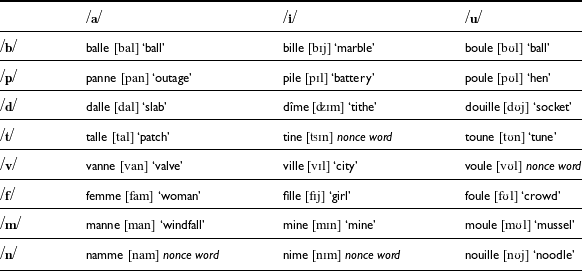
Target words included monosyllabic words with word-initial voiced and voiceless stops and fricatives across two places of articulation: labial (/b/, /p/, /m/, /f/, /v/) and coronal (/d/, /t/, /n/) and preceding the corner vowels (/a/, /i/ and /u/), leading to a total of 24 unique words (see Table 1). The high vowels /i/ and /u/ were produced slightly centralized, [ɪ] and [ʊ] respectively, the result of a well-known process of high vowel laxing in Laurentian French final closed syllables (Dumas & Boulanger Reference Dumas and Boulanger1982; Dumas Reference Dumas1987; Friesner Reference Friesner2010). Additionally, /t/ and /d/ were affricated and produced as [ʦ] and [ʣ] when preceding the high front vowel /i/, as expected in Laurentian French (Dumas Reference Dumas1987; Friesner Reference Friesner2010). All words had sonorant codas. Nasal stops were included as a baseline given that the AVC is not thought to apply to sonorants. All words were feminine nouns preceded by the definite determiner /la/ in order to homogenize the utterance context and ensure that the vowel preceding the target consonant was always /a/. This also means that all target segments were in intervocalic position. Each word was placed in the frame sentence Je dis la ____ lentement (I say the ___ slowly). Three words (namme, voule, tine) were nonce words as no word meeting the desired criteria exists in Laurentian French. An additional nonce word, nime, was chosen and presented as a nonce word given the atypical spelling of the existing city name Nîmes whose final ‘s’ could have led to mispronunciation.
List of target words to be produced

2.3 Laryngeal ultrasound
2.3.1 Procedure
Larynx height has been investigated using various methodologies, such as the cricothyrometer (Gandour & Maddieson Reference Gandour and Maddieson1976), videofluorography (Laukkanen et al. Reference Laukkanen, Takalo, Vilkman, Nummenranta and Lipponen1999; Hong et al. Reference Hong, Hong, Jun and Hwang2015), EMA (Shosted, Carignan & Rong Reference Shosted, Carignan and Rong2011; Bückins, Greisbach & Hermes Reference Bückins, Greisbach and Hermes2018), MRI (Oh & Lee Reference Oh and Lee2018; Oh et al. Reference Oh, Byrd, Goldstein and Narayanan2019) and laryngoscopy (Brunelle Reference Brunelle, Nguyên and Nguyên2010). Vilkman et al. (Reference Vilkman, Takalo, Maatta, Laukkanen, Nummenranta and Lipponen1997) measured the movement of the cricothyroid space during the production of Finnish vowels with ultrasound. Similarly, Moisik, Lin & Esling (Reference Moisik, Lin and Esling2014) used ultrasound together with simultaneous laryngoscopy to investigate larynx movement in the production of Mandarin tones. Due to its non-invasive nature and high temporal resolution, ultrasound is especially well-suited for research questions such as those posed in the current study.
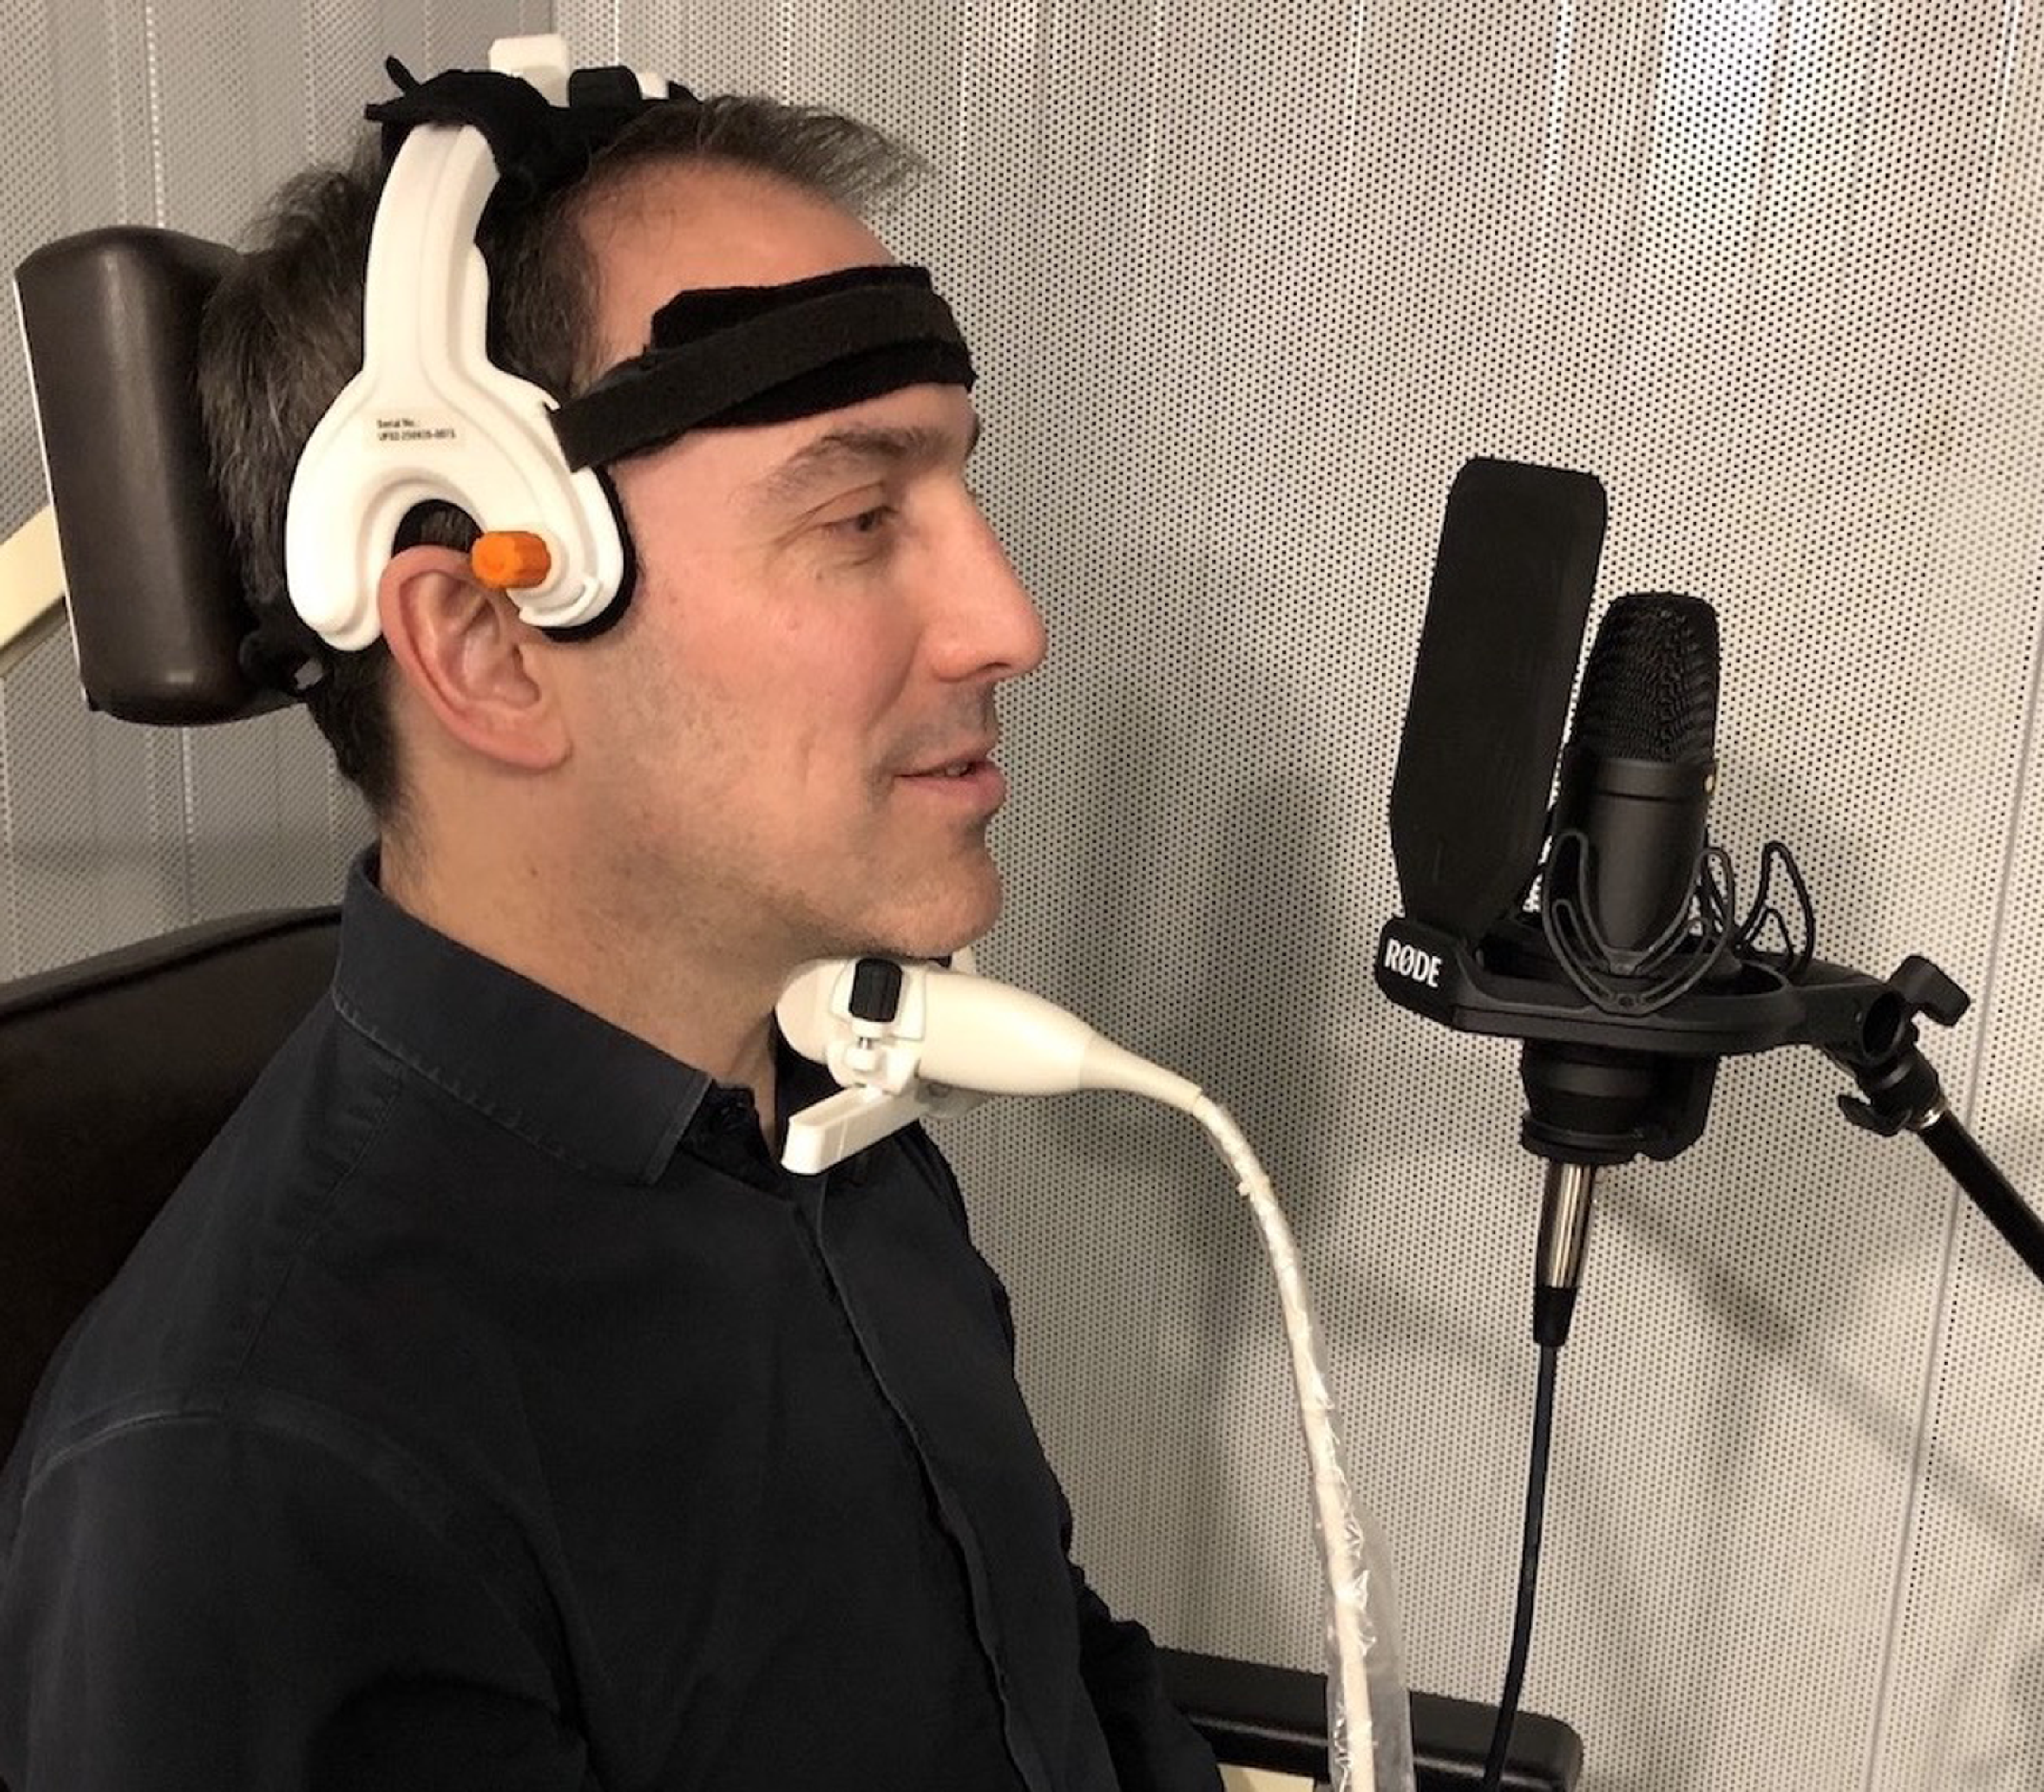
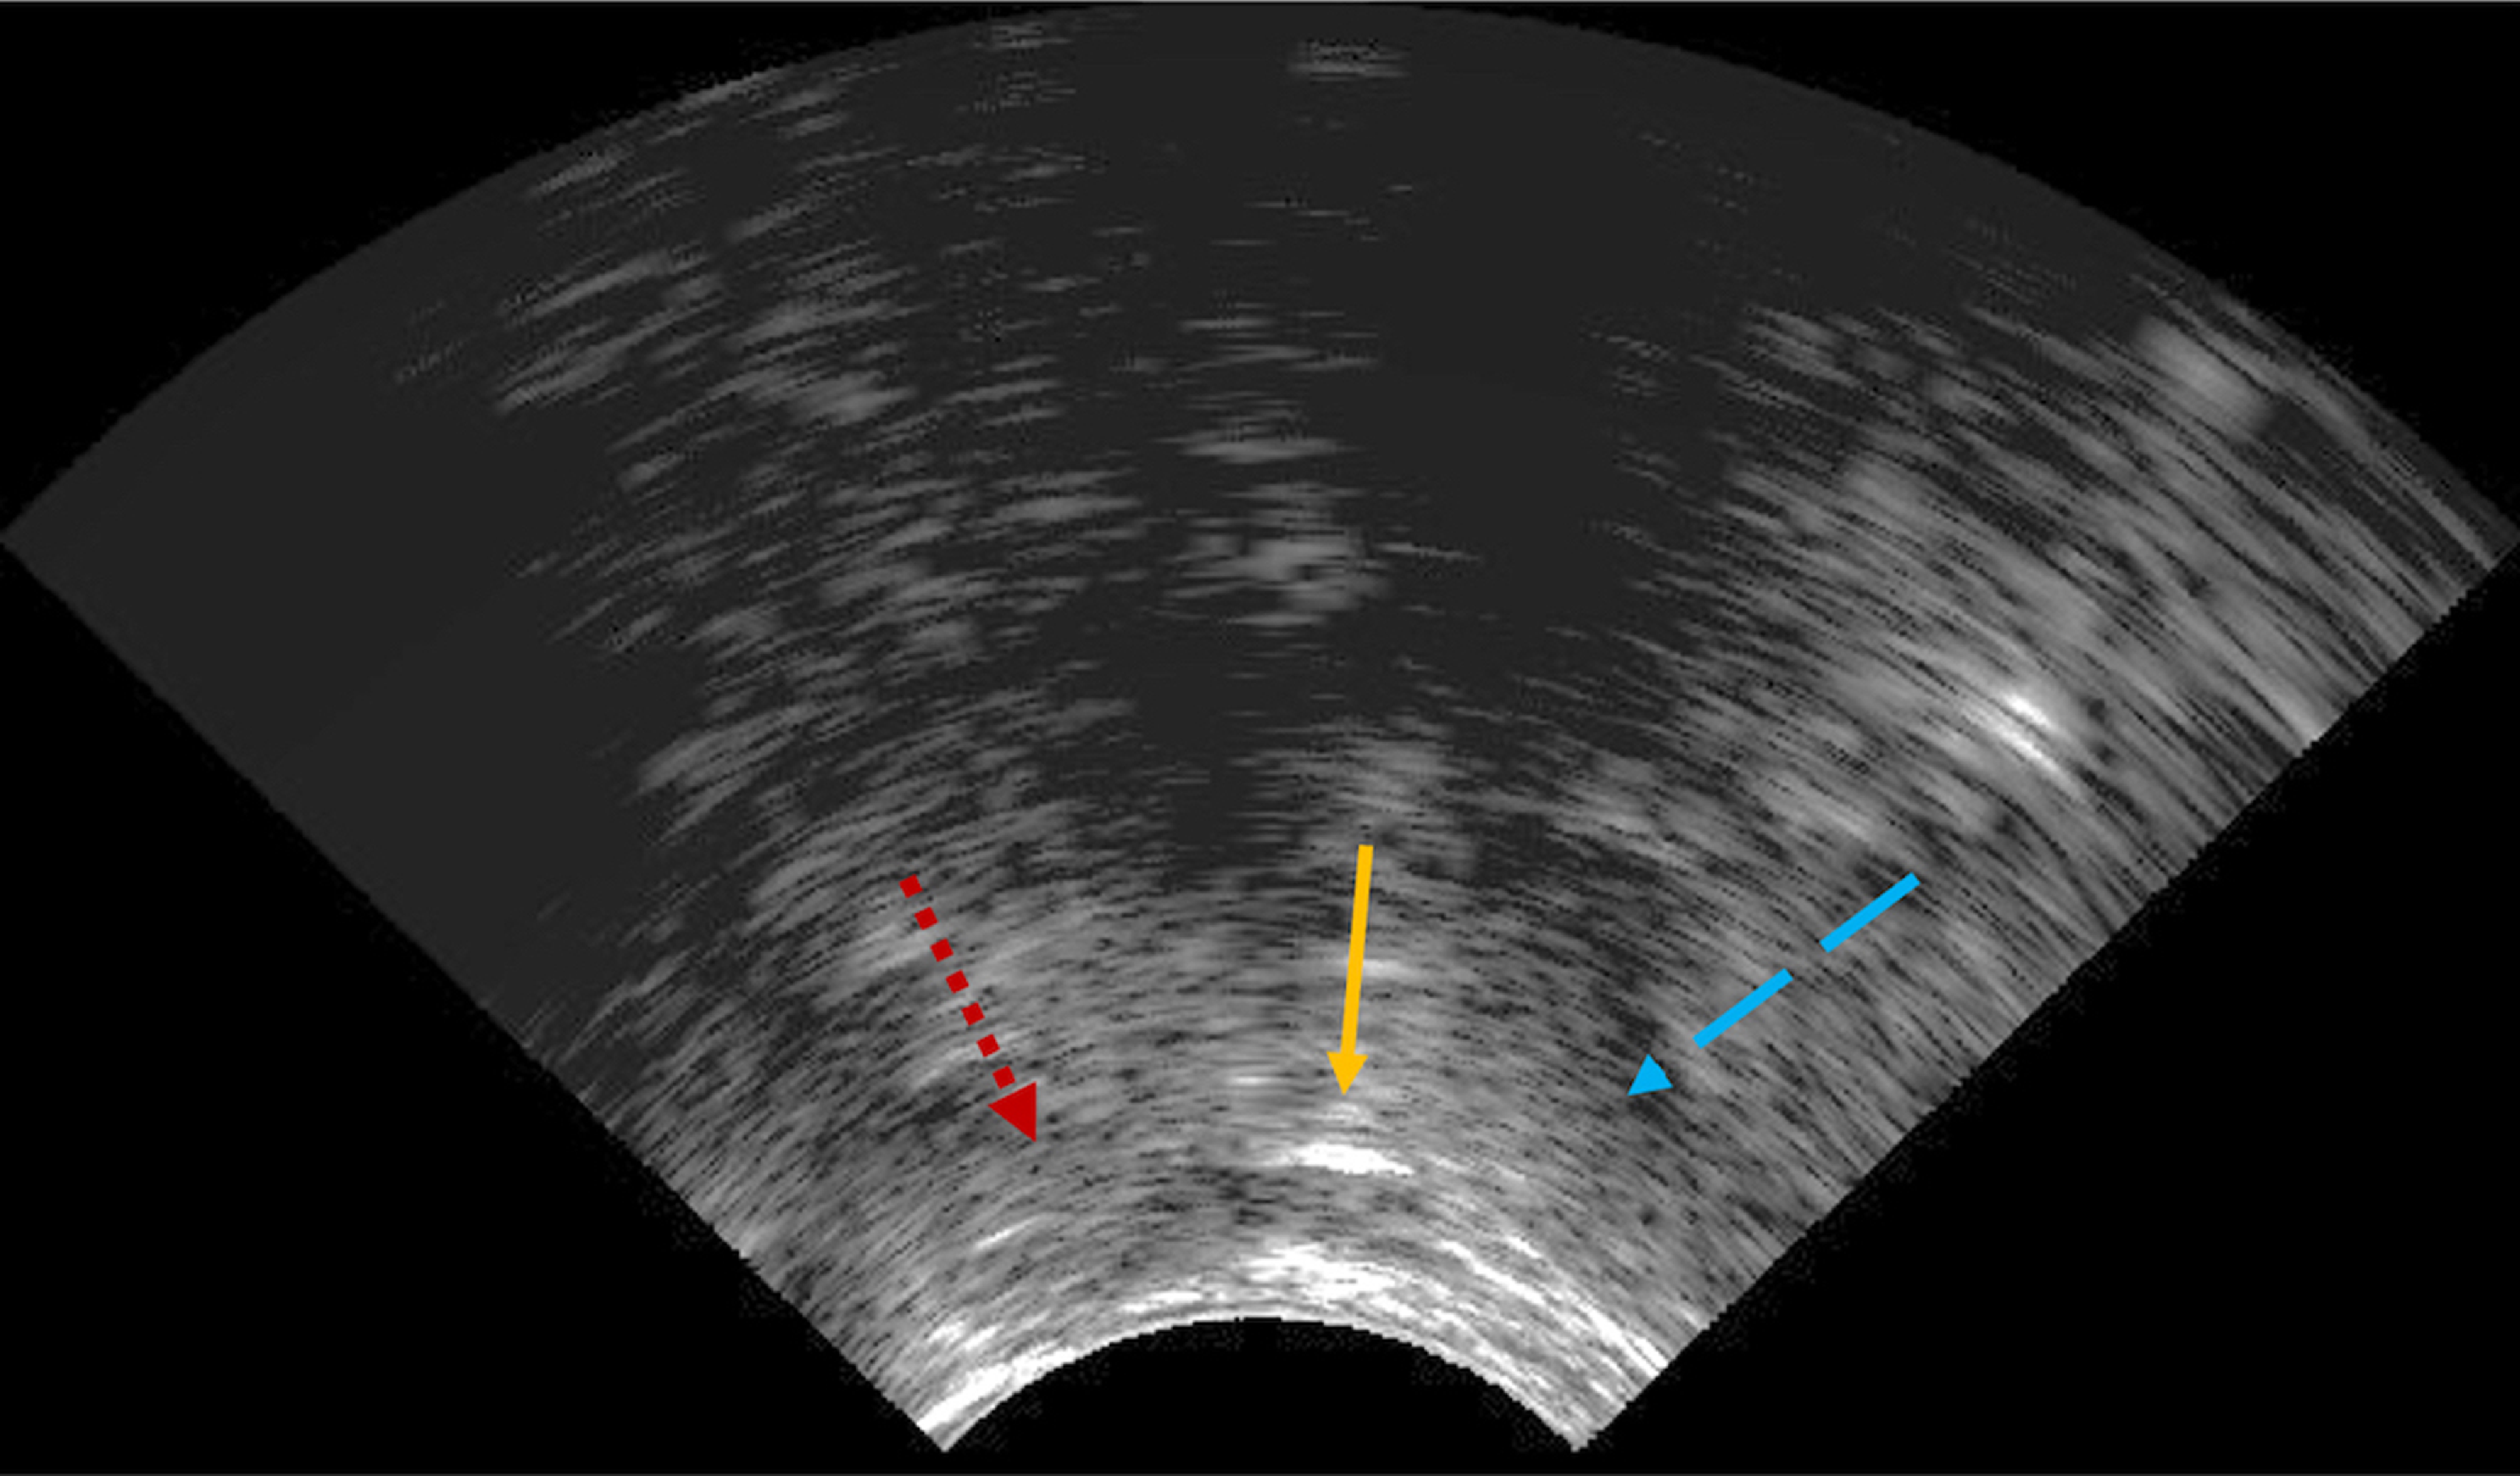
Before beginning the experiment, participants were asked to read aloud the list of target words in a randomized order to ensure familiarity. They were informed that some of the words were nonce words and should be pronounced as written. Participants then sat in a chair inside a soundproof booth at the University of Ottawa. The ultrasound images were recorded using a Micro ultrasound system. A Telemed MC4-2R20S-3 convex probe was placed on the participant’s larynx in a midsagittal plane and held in place with an UltraFit helmet (Spreafico, Pucher & Matosova Reference Spreafico, Pucher and Matosova2018). For participants with a protruding Adam’s apple, the probe was placed slightly to the side to reduce possible discomfort and enhance image quality. The probe was positioned so that the cricothyroid membrane appeared in the center of the ultrasound image in resting position. The cricothyroid membrane was easily identifiable as a hyperechoic structure (a bright white line) with the hypoechoic thyroid and cricoid cartilages on either side (Kristensen, Teoh & Rudolph Reference Kristensen, Teoh and Rudolph2016). The central placement of the probe ensured that the maximum height of the cricothyroid membrane could be visualized. The laryngeal ultrasound set-up is presented in Figure 1 (the individual in the picture was not a participant). A sample ultrasound image from a male participant in the study with relevant structures indicated is seen in Figure 2.
The placement of the ultrasound probe and helmet for the laryngeal recording.

An example image of the larynx of a male participant during the vowel /a/. The surface of the neck, i.e. the location of the ultrasound probe, is oriented towards the bottom and the upper part of the larynx, i.e. the thyroid cartilage, is oriented towards the right. The relevant structures used to position the probe are indicated by the colored arrows (dotted red: cricoid cartilage; solid yellow: cricothyroid membrane; dashed blue: thyroid cartilage).

The depth setting was set to 60 mm and the frequency to 3 MHz with an image rate of approximately 90 frames per second. Participants were first asked to produce a few words to guarantee the larynx was always within frame. The researchers then left the soundproof booth and controlled the experiment from a computer located outside the booth. Participants’ speech was recorded with a Røde NT1 microphone placed at a distance of approximately 15 cm from the participant’s mouth. The audio signal and the ultrasound images were collected simultaneously in the program AAA (Articulate Assistant Advanced, Articulate Instruments Ltd., 2012). Each stimulus was presented on a screen placed approximately two meters in front of the participant in the soundproof booth. The 24 target words were randomized and six repetitions of the same randomized list were collected. Participants were instructed to read as naturally as possible. This portion of the experiment lasted ten to twelve minutes.
2.3.2 Articulatory analysis (optical flow)
The larynx movement of interest in this study is largely monodirectional (vertical) and involves the displacement of the entire structure rather than a precise point. As few studies have utilized ultrasound to measure larynx movement, few methodologies have been tested. Vilkman et al. (Reference Vilkman, Takalo, Maatta, Laukkanen, Nummenranta and Lipponen1997) measured cricothyroid distance manually on a frame-by-frame basis. Moisik et al. (Reference Moisik, Lin and Esling2014) developed an optical flow algorithm in MatLab (The MathWorks, Inc. 2022) to track the movement in pixels across frames through cross-correlation. A benefit of optical flow is its ability to analyze a large amount of data with near autonomy, requiring little post-analysis correction. Therefore, an optical flow algorithm developed by Witsil (Reference Witsil2019), available as the R (R Core Team 2022) package imagefx, was used to analyze the laryngeal ultrasound data in the current study.
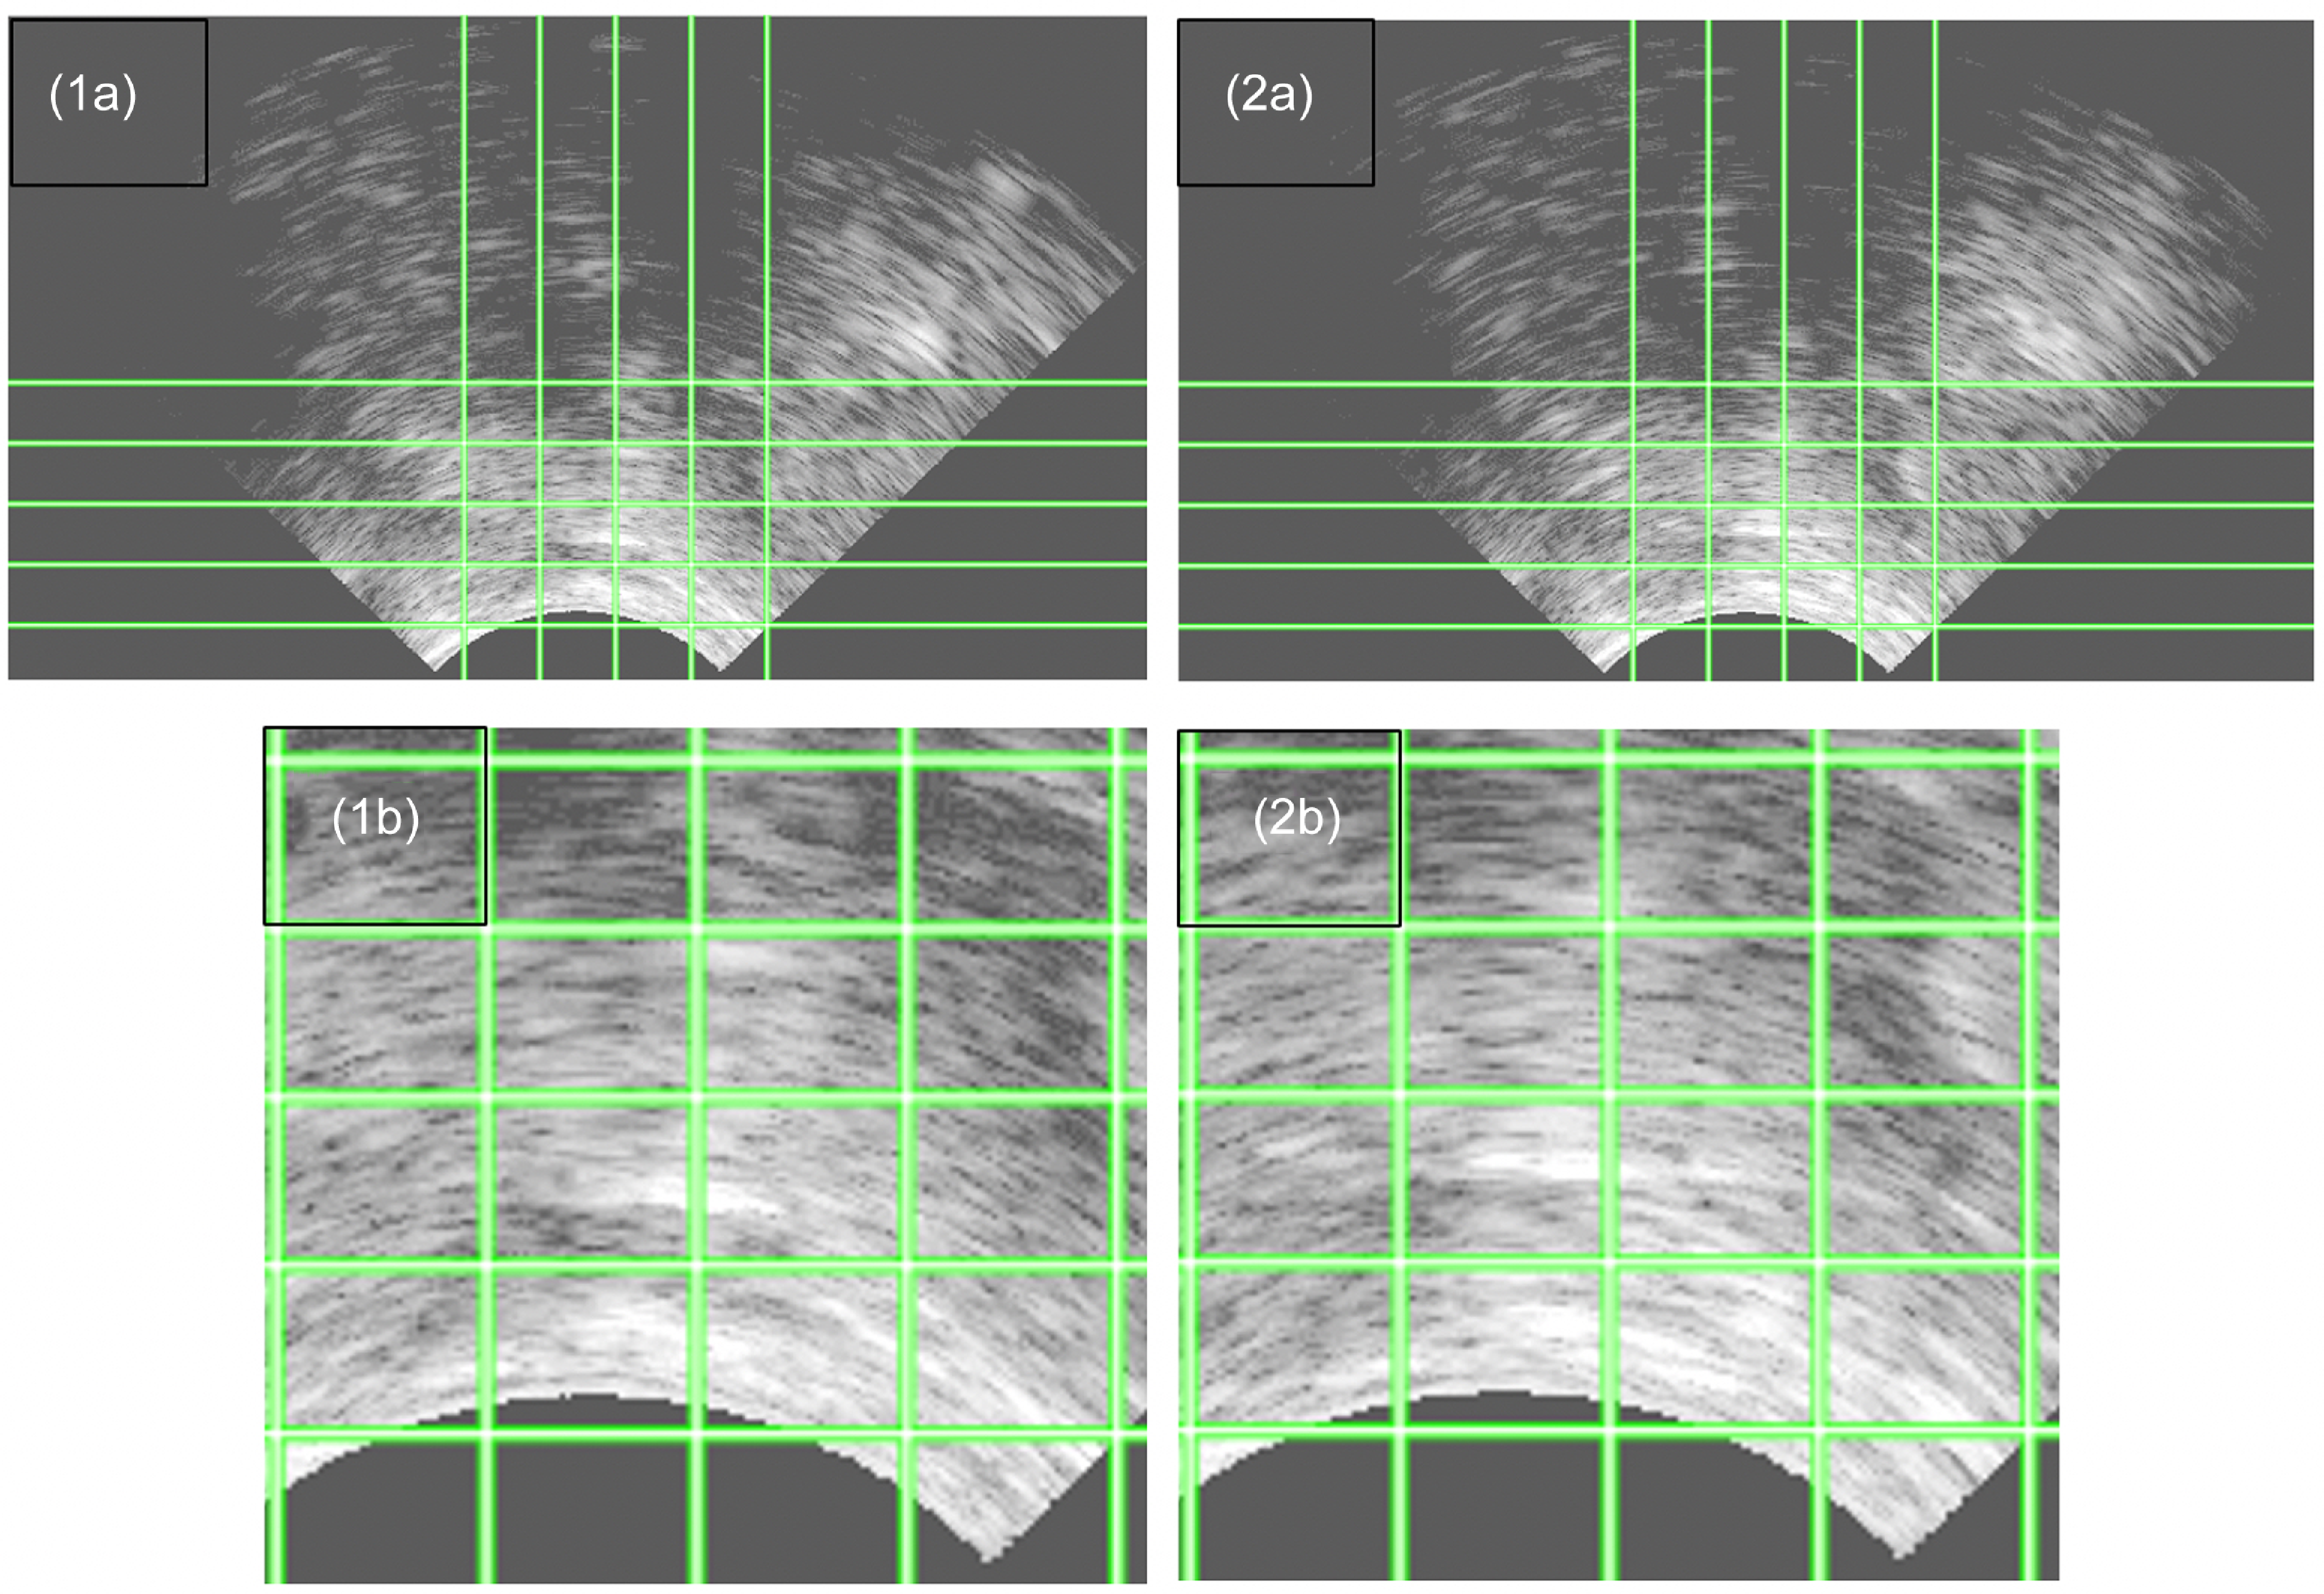
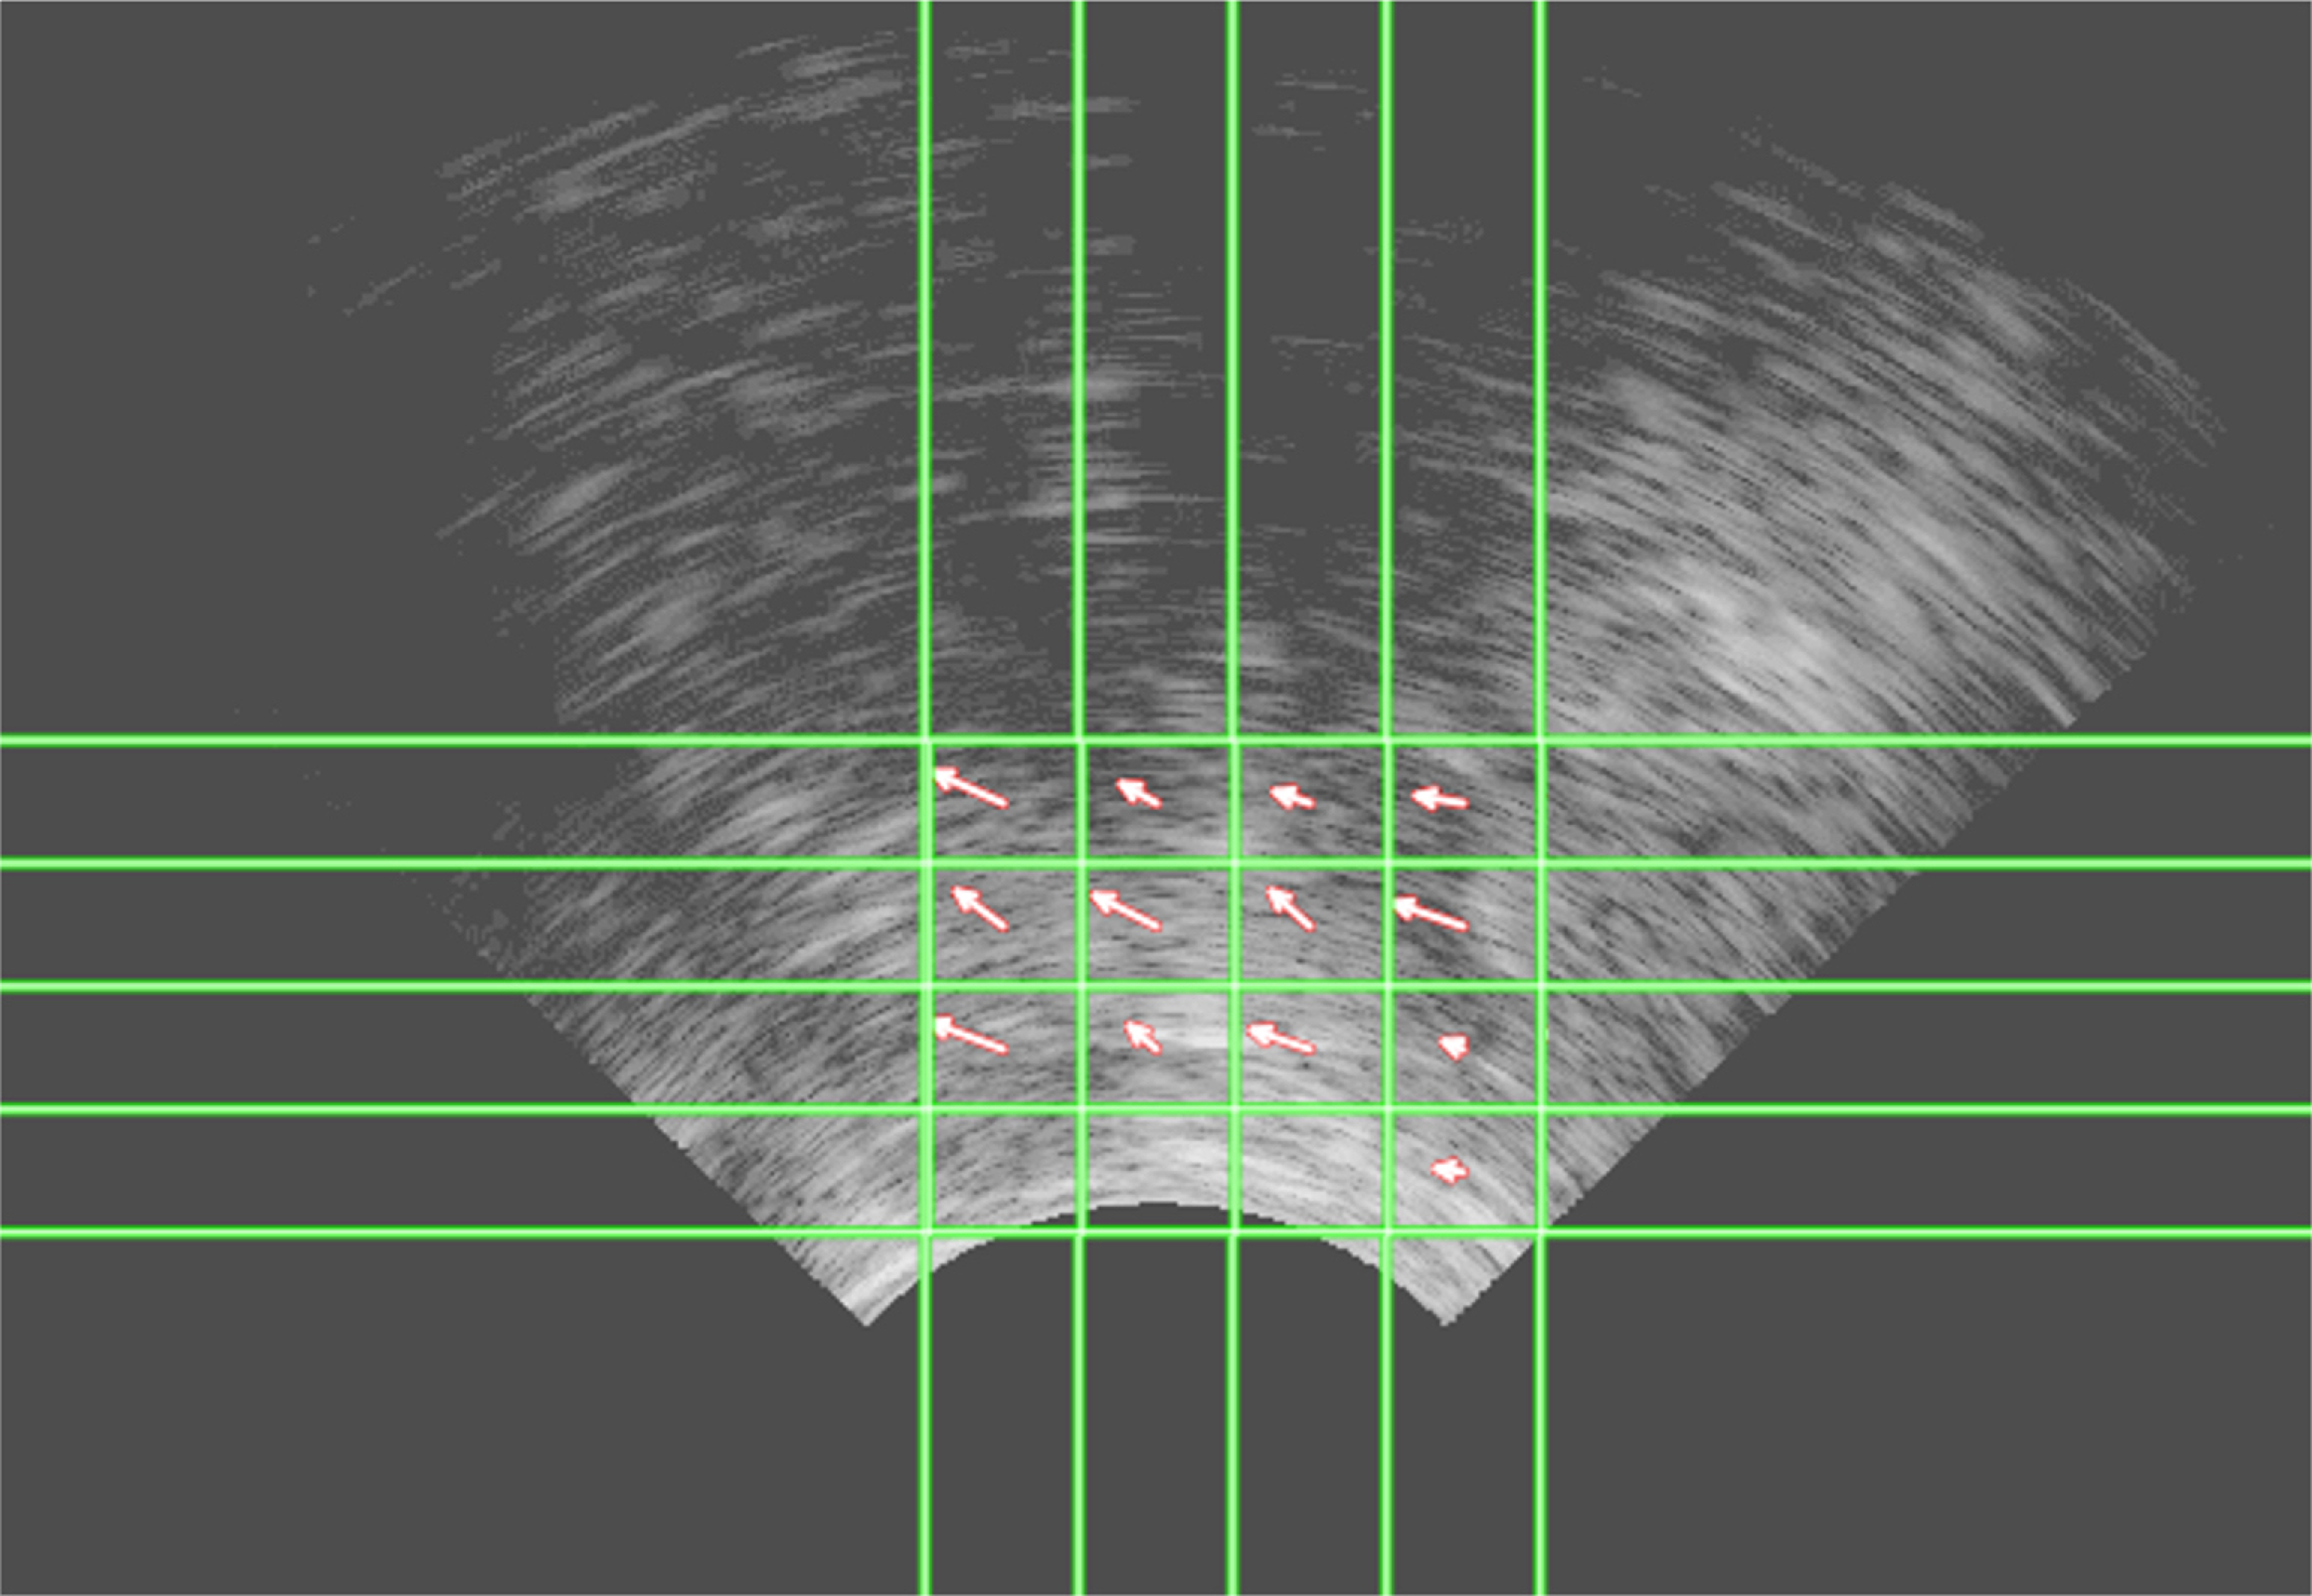
Larynx movement was measured during the vowel preceding the target consonant (/a/), the stop closure or frication portion of the consonant and the following vowel. Individual JPEG ultrasound images were extracted from AAA with dimensions of 640x480 pixels. Each image was overlayed with a 15x15 grid, as proposed by Moisik et al. (Reference Moisik, Lin and Esling2014), resulting in 225 individual boxes. However, to ensure exclusion of possible reverberation effects or artifacts present in the ultrasound images (more likely at greater depths), a smaller zone of interest was chosen on which the optical flow analysis was performed. This zone corresponded to 12-16 grid boxes, depending on the size of the participant’s larynx, and included the portion of the image encompassing the thyroid cartilage, cricothyroid membrane and cricoid cartilage. The precise zone of interest was manually chosen for each participant based on observation of multiple tokens of all three vowels so as to include all relevant laryngeal structures regardless of the target syllable. Example laryngeal ultrasound frames, with the superimposed zone of interest, are shown in Figure 3.
Two ultrasound images, corresponding to the first frame (1a) and the last frame (2a) of a single instance of the vowel /a/ in the target word la boule produced by a male speaker. The zone of interest, composed of 16 regions in the center, encompasses the thyroid cartilage on the right, the cricothyroid membrane in the center and the cricoid cartilage on the left-side of the image. Images (1b) and (2b) zoom in on the region of interest, evidencing the slight leftward movement observed during this segment, particularly of the cricothyroid membrane. This leftward pixel movement corresponds to downward laryngeal movement.

Next, a Gaussian window was applied to each of the individual boxes to ensure movement in the middle of each region, rather than on its edges, was given more weight. Then, each pair of successive images was compared by means of a cross correlation in a nested loop over both the X and Y directions to calculate average pixel displacement in each region (Witsil Reference Witsil2019). Displacements higher than |4| pixels were excluded as spurious. This threshold was deemed appropriate after analyzing histograms of all movement values across all participants and determining that 95% of values were below |4|. Visual inspection of the magnitude of movement between image pairs confirmed that values larger than |4| were likely due to noise. If any movement was detected in the comparison of two consecutive images, all values of zero were excluded. Values of zero, indicative of a lack of movement, were for the most part registered in shadowed regions of the image due to low resolution or reflection of the ultrasound beam or in a static portion of the image, indicative of insufficient contact between the probe and the participant’s skin. It is unlikely that certain parts of the cricothyroid region can remain still while others move. An example outcome of the optical flow analysis for a single instance of the vowel /a/ is shown in Figure 4. In this figure, the individual movement vectors corresponding to each box of the grid are shown as arrows, whose length and direction correspond to the pixel movement tracked across the sequence of images. The leftward movement of the arrows indicates larynx lowering which, in this case, is due to the following segment being a voiced stop.
Individual movement vectors superimposed on an example laryngeal image of a single instance of the vowel /a/ in the target word la boule produced by a male speaker. The length of each arrow corresponds to the movement in pixels in the direction indicated by the arrowhead. In this image, downward larynx movement is indicated by leftward pixel displacement.

Subsequently, the mean of all remaining values of pixel movement across all boxes within the zone of interest was separately calculated for horizontal movement (corresponding to a vertical displacement of the larynx) to obtain a single vertical movement index for each pair of images. Individual vertical movement indices were then summed cumulatively across image pairs to obtain the overall displacement through time for each token. Finally, movement in pixels was converted into millimeters based on the pixel-to-millimeter ratio of the images exported from AAA. One millimeter corresponds to approximately 5.25 pixels. A positive value indicates larynx elevation while a negative value indicates larynx lowering. As the size and shape of speakers’ larynges are variable, movement values were z-normalized by speaker before aggregating them in figures or analyzing them statistically. For ease of interpretation, these z-scores were converted back to millimeter values by multiplying the z-score by the standard deviation of each speaker and adding this value to the mean of all speakers.
Time normalization across tokens and speakers was also required. This was done by calculating the mean duration of the three relevant segments across all speakers: the vowel preceding the target consonant, the closure or frication portion of the target consonant and the vowel following the target consonant. Then, the vertical movement indices obtained for each frame were equidistantly distributed across the mean duration of each of these three segments.
2.4 Lingual ultrasound
2.4.1 Procedure
After completing the laryngeal ultrasound, participants took a short 5-minute break, during which they filled out a language background questionnaire. Then, the lingual ultrasound procedure was carried out. Participants were recorded in the soundproof booth as they produced the same target words as in the laryngeal ultrasound recordings, again presented on a screen. For the lingual ultrasound, the probe was placed under the chin and positioned so that the entirety of the tongue was visible in the image with the hyoid bone shadow at the leftmost edge. The depth setting was set to 80 mm and the frequency of the ultrasound signal to 2 MHz. The microphone was positioned approximately 15 cm from the participant’s mouth and the audio signal and ultrasound images were collected simultaneously using the program AAA. A total of six repetitions of the same target words in the same randomized order as in the first recording session were collected. This recording session also lasted ten to twelve minutes.
2.4.2 Articulatory analysis
AAA was used to trace the tongue contour for each ultrasound frame corresponding to the vowel preceding the target (/a/), the stop closure or frication portion and the following vowel. A participant-specific template was drawn for each vowel and semi-automatic tracking was executed, followed by manual adjustments to ensure accurate representation of the tongue contour. Only X and Y coordinates tracked with a 100% confidence interval were retained and measured.
It is common for lingual ultrasound data to be analyzed by means of Smoothing Spline ANOVA (Gu Reference Gu2002; Davidson Reference Davidson2006). However, this method does not allow for the visualization of the change in tongue position over time nor for the aggregation of data from multiple speakers to test the significance of general trends. For this reason, discrete values for tongue root advancement and tongue body height were calculated for each ultrasound frame. The recorded ultrasound image is composed of 42 fanlines, the coordinates of which can be tracked frame by frame. As the size of a participant’s tongue determines how many of these 42 fanlines contain traced coordinate values, fanlines cannot mechanically be compared across speakers. Various approaches have been taken regarding the selection of the most appropriate fanlines to track the movement of a specific part of the tongue. Lawson, Scobbie & Stuart-Smith (Reference Lawson, Scobbie and Stuart-Smith2013) chose the fanline indicating maximum constriction during Scottish English /r/ through visual inspection of each speaker’s ultrasound data. Strycharczuk & Scobbie (Reference Strycharczuk and Scobbie2015) rather selected the two fanlines (one for the alveolar and another for the velar gesture of English vocalic /l/) for which the maximum displacement occurred. To investigate the role of tongue body height, Kirkham & Nance (Reference Kirkham and Nance2017) chose the fanline that corresponded to the highest point in the vowel. For the tongue root, Kirkham & Nance (Reference Kirkham and Nance2017) visually inspected each speaker’s tongue images during the production of tense and lax vowels in Twi and Ghanaian English and manually drew a single line that best corresponded to the tongue root across all images. To investigate how tongue root advancement during voiced stops affects the length of the following vowel in Italian and Polish, Coretta (Reference Coretta2020) chose the fanline that presented the highest standard deviation across all tokens separately for each participant.
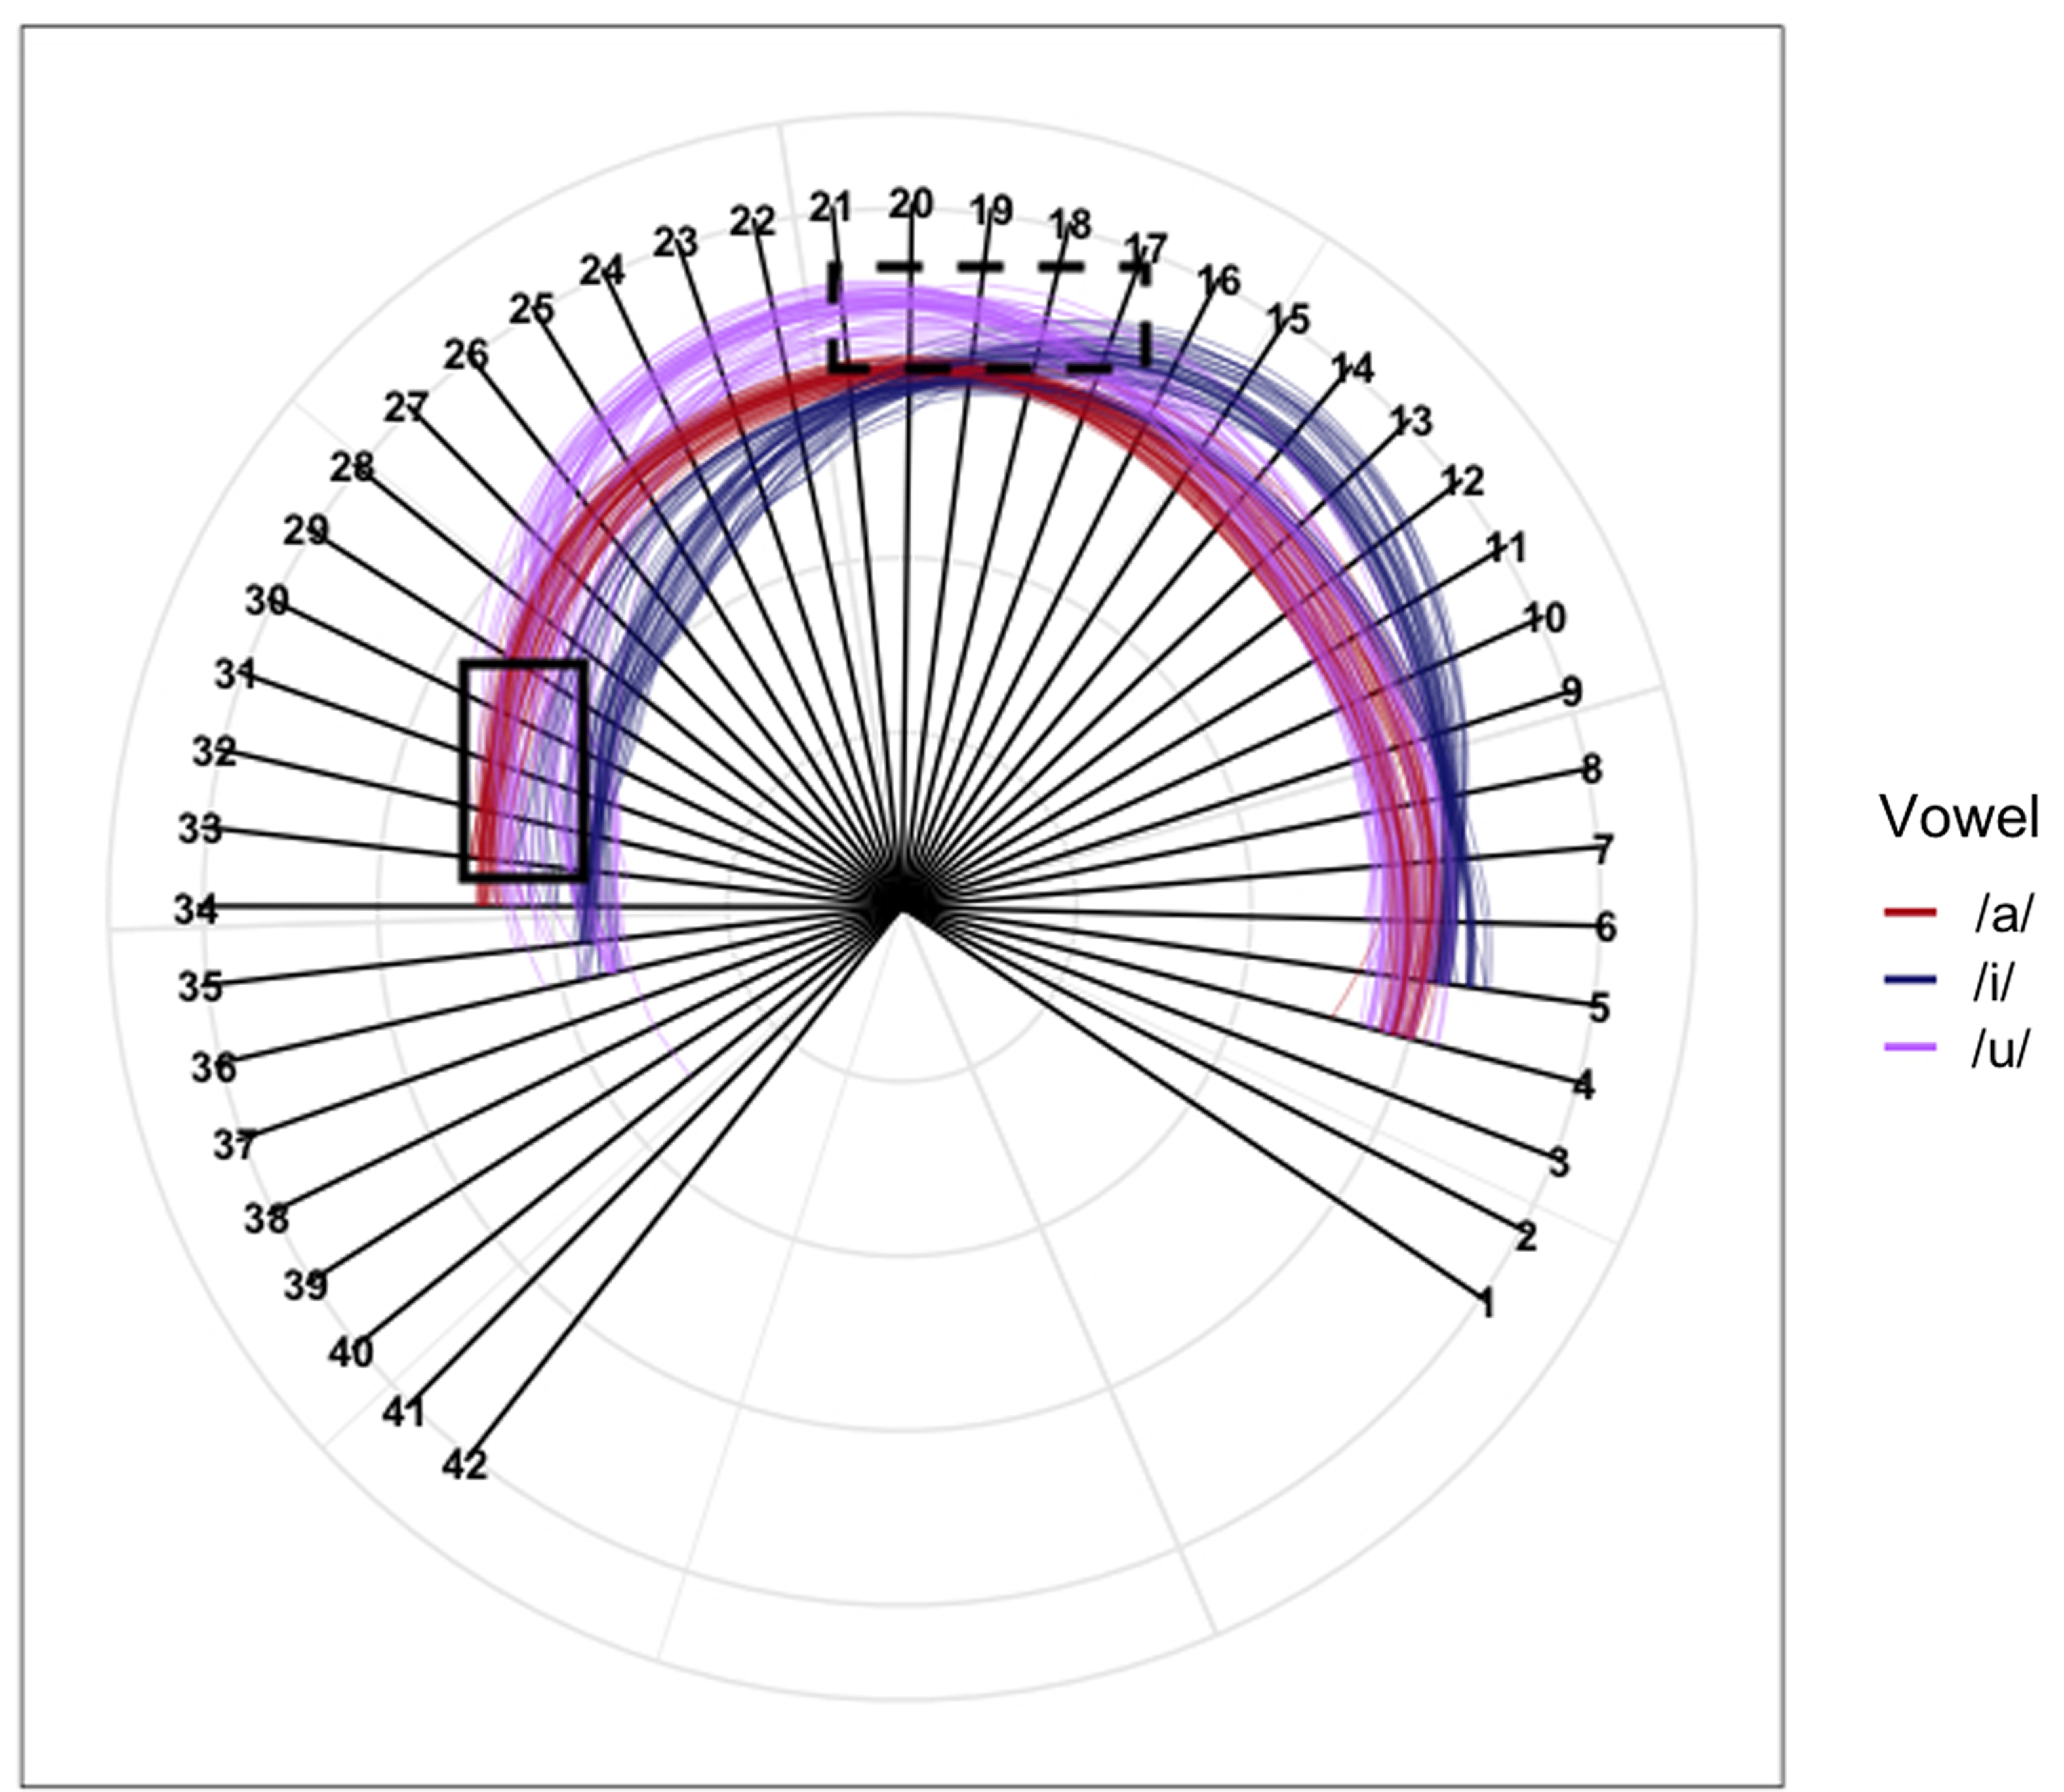
For the current study, the following procedure was deemed best suited to the data and research questions. Of the 42 fanlines, the actual tongue contour crossed on average 30. Only the lines for which a spline coordinate value was present in at least 75% of frames across all repetitions of each word were considered for an individual speaker. As the actual tongue root encompasses multiple fanlines, the X values of the most posterior fanline plus the four preceding fanlines were averaged together. This obviated the need to focus on a single physical point of the tongue and, as a result, values corresponded more generally to the entire tongue root region, thus facilitating cross-speaker comparison. For tongue height, the fanline containing the maximum Y value for each token was selected given that the highest Y coordinate is thought to correspond to the point of maximum tongue body constriction (Mielke Reference Mielke2015; Kirkham & Nance Reference Kirkham and Nance2017). Out of these maximum Y fanlines, the five most frequently occurring across all tokens were averaged together to obtain a general value of tongue height. The fanlines selected through this procedure were verified by superimposing the tongue contours at the end of the closure onto the corresponding fanlines, as in Figure 5. The tokens in the figure are plotted with polar coordinates, but only Cartesian coordinates (X and Y values) were used in the subsequent plots and statistical models. The five fanlines chosen for the tongue root are enclosed in a solid black rectangle while the dashed black rectangle indicates the fanlines chosen to measure tongue body movement.
Spline coordinates at the end of closure of all tokens produced by a single speaker plotted across fanlines, corresponding to ultrasound scans. The solid black box encloses the lines chosen to measure tongue root movement while the dashed black box encloses the lines selected to measure tongue body movement. Only the Cartesian coordinates overlayed on the fanlines were used in subsequent statistical models and plots.

Finally, to enable aggregation of data and observation of across-speaker tendencies, mean X (tongue root advancement) and Y (tongue height) values were normalized. This was carried out using the same z-normalization and reconversion into a millimeter scale as for the larynx movement values, as described in section 2.3.2. In addition, all data was time-normalized following the same procedure as for the larynx.
2.5 Acoustic analysis
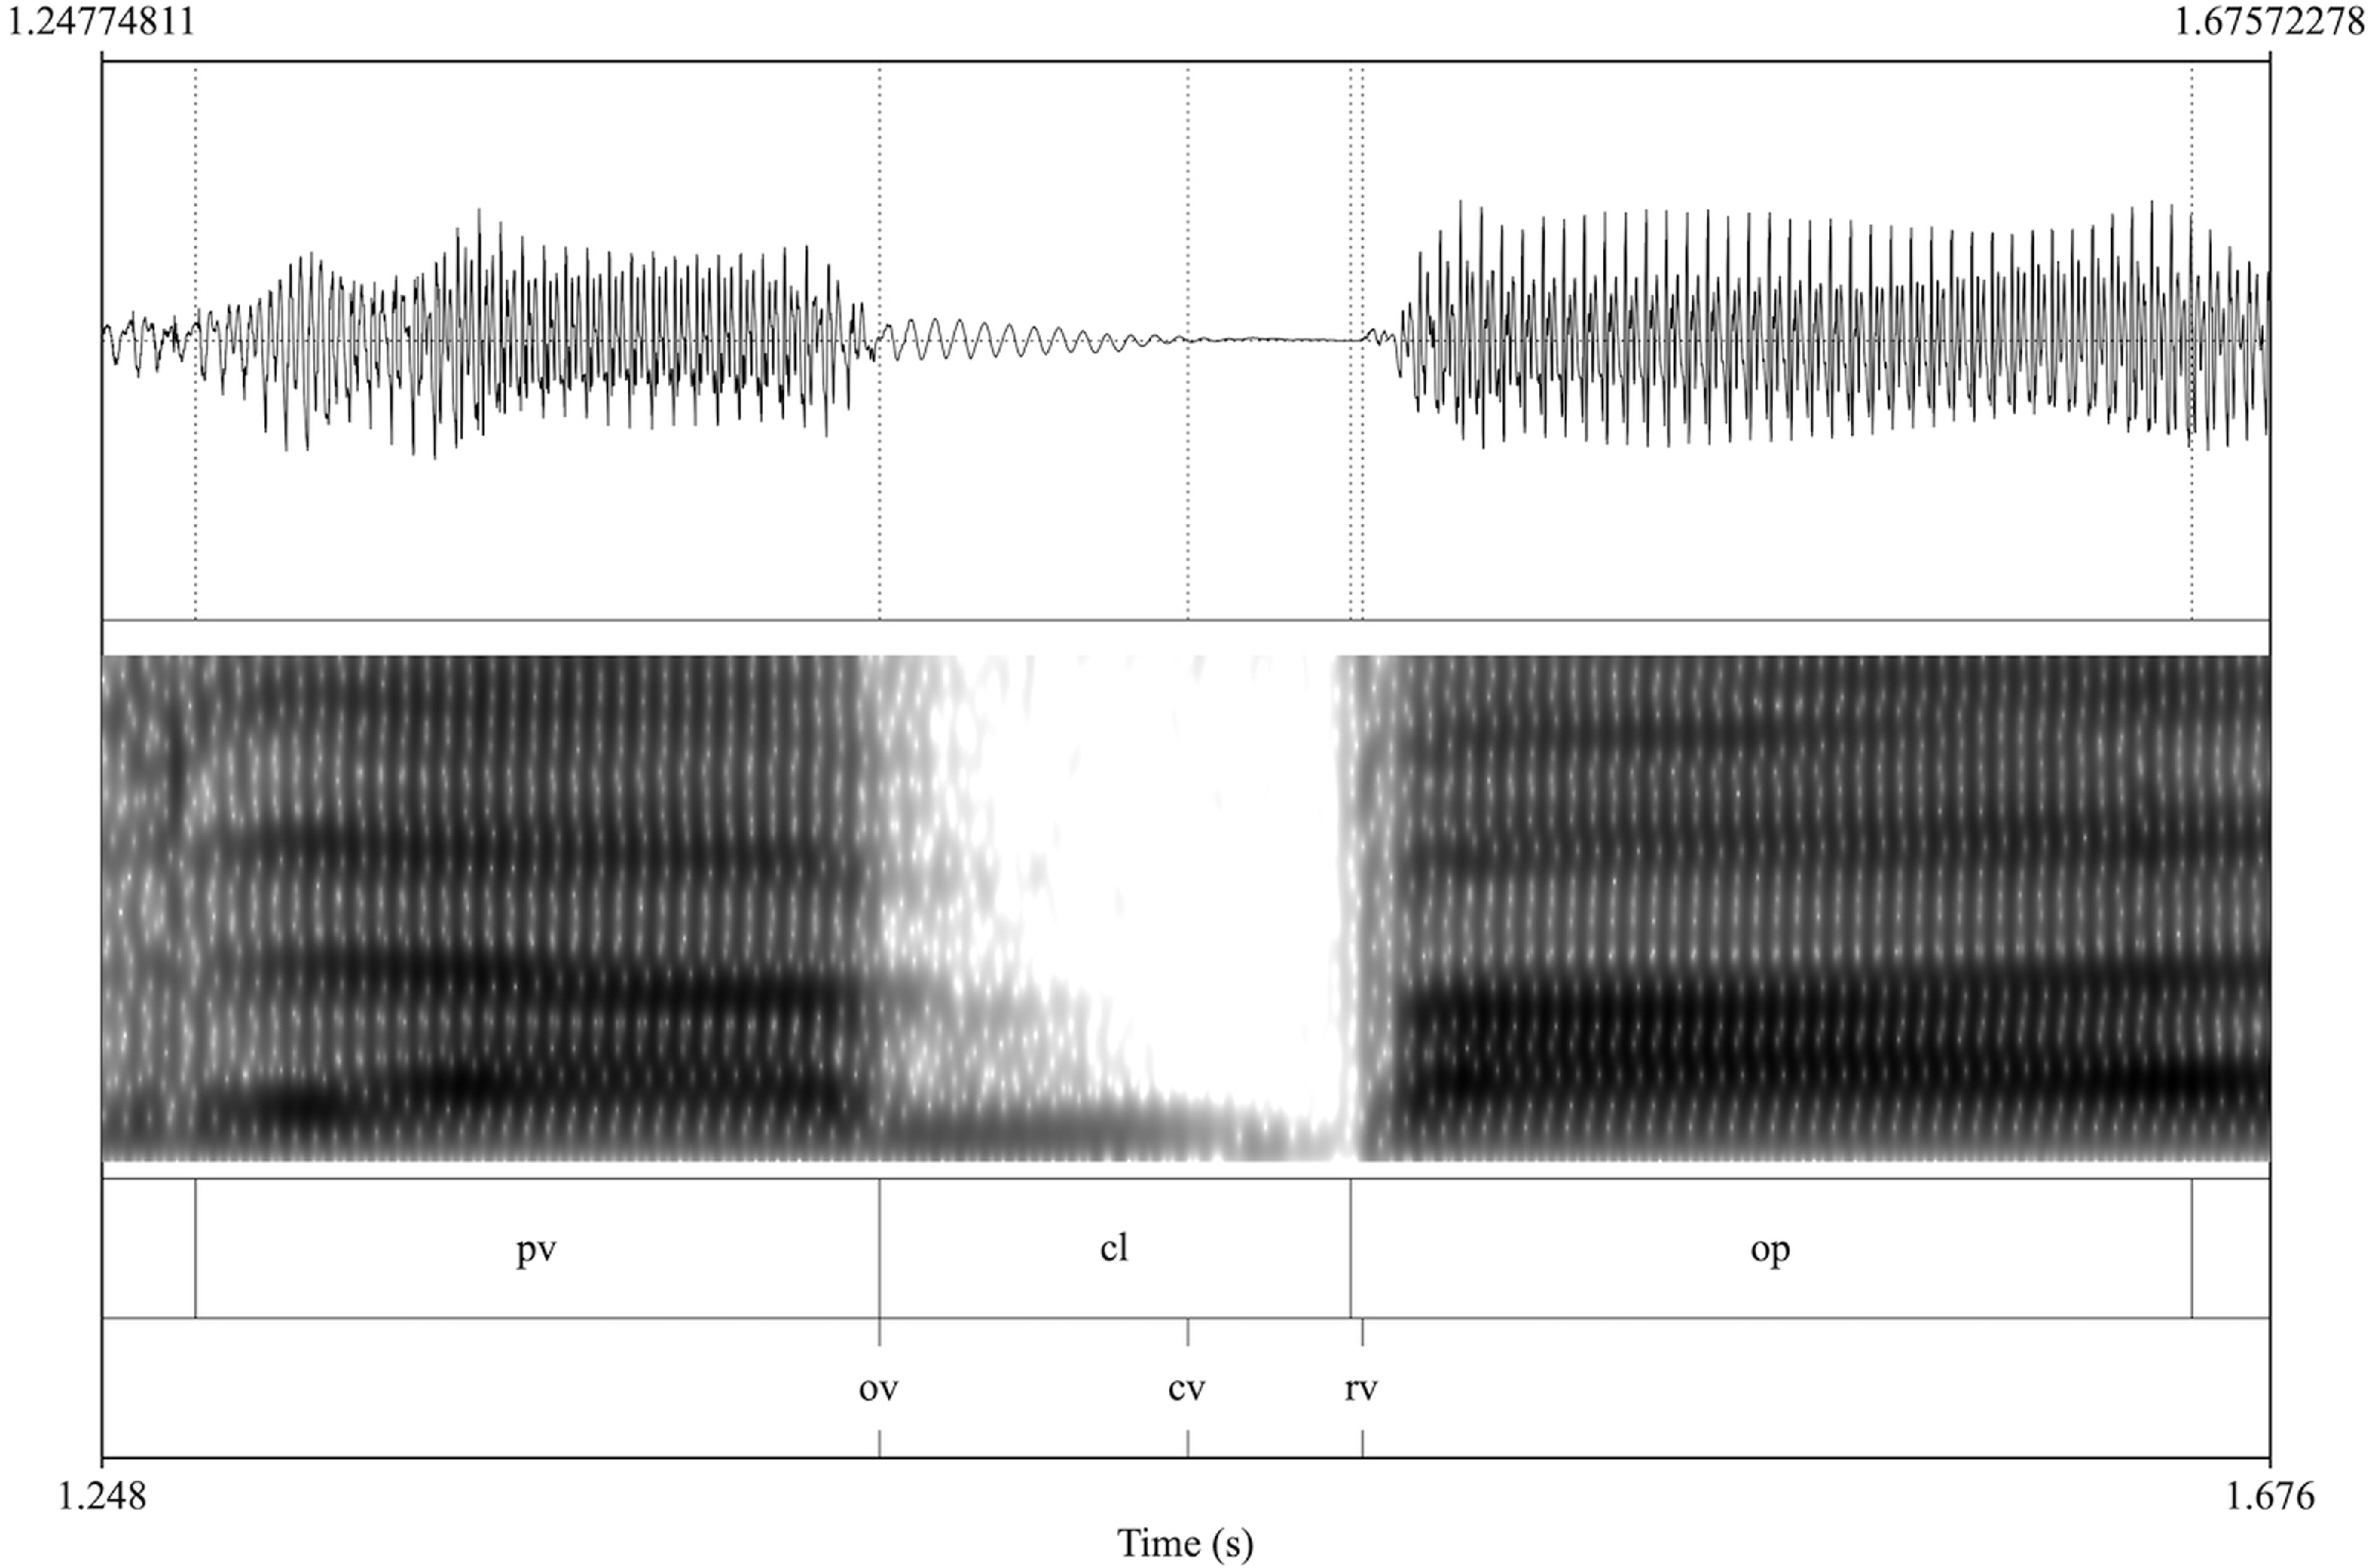
Acoustic data was analyzed in Praat (Boersma & Weenink Reference Boersma and Weenink2022). The /a/ preceding the target consonant, the stop closure or frication portion of the target and the following vowel including any post-release aspiration were annotated. For the segments /ti/ and /di/ which undergo affrication in Laurentian French, the affrication was included in the interval of the following vowel as a parallel to aspiration present in voiceless stops. The precise timing of onset, cessation and resumption of voicing was annotated by means of visual inspection of both the waveform and the spectrogram, assisted by the Pulse function in Praat. The voicing threshold was set to 0.6 to exclude small fluctuations that likely do not correspond to real vocal fold vibrations. Figure 6 presents an example annotation of the word balle [bal] ‘ball’.
Relevant annotations of the waveform and spectrogram for the word balle [bal] ‘ball’. Labels indicate: previous vowel (pv), closure (cl), following vowel (op), onset of voicing (ov), cessation of voicing during closure (cv) and post-release resumption of voicing (rv).

2.6 Statistical analysis
Linear mixed effect regressions were built using lmerTest (Kuznetsova, Brockhoff & Christensen Reference Kuznetsova, Brockhoff and Christensen2017) to determine the significance of the differences in larynx and tongue position between segments. For the laryngeal data, two measures were investigated. The first was the maximal downward movement from the start of /a/ preceding the target consonant up to the end of the closure. The second was the point in time during the closure when this maximal low point was achieved.
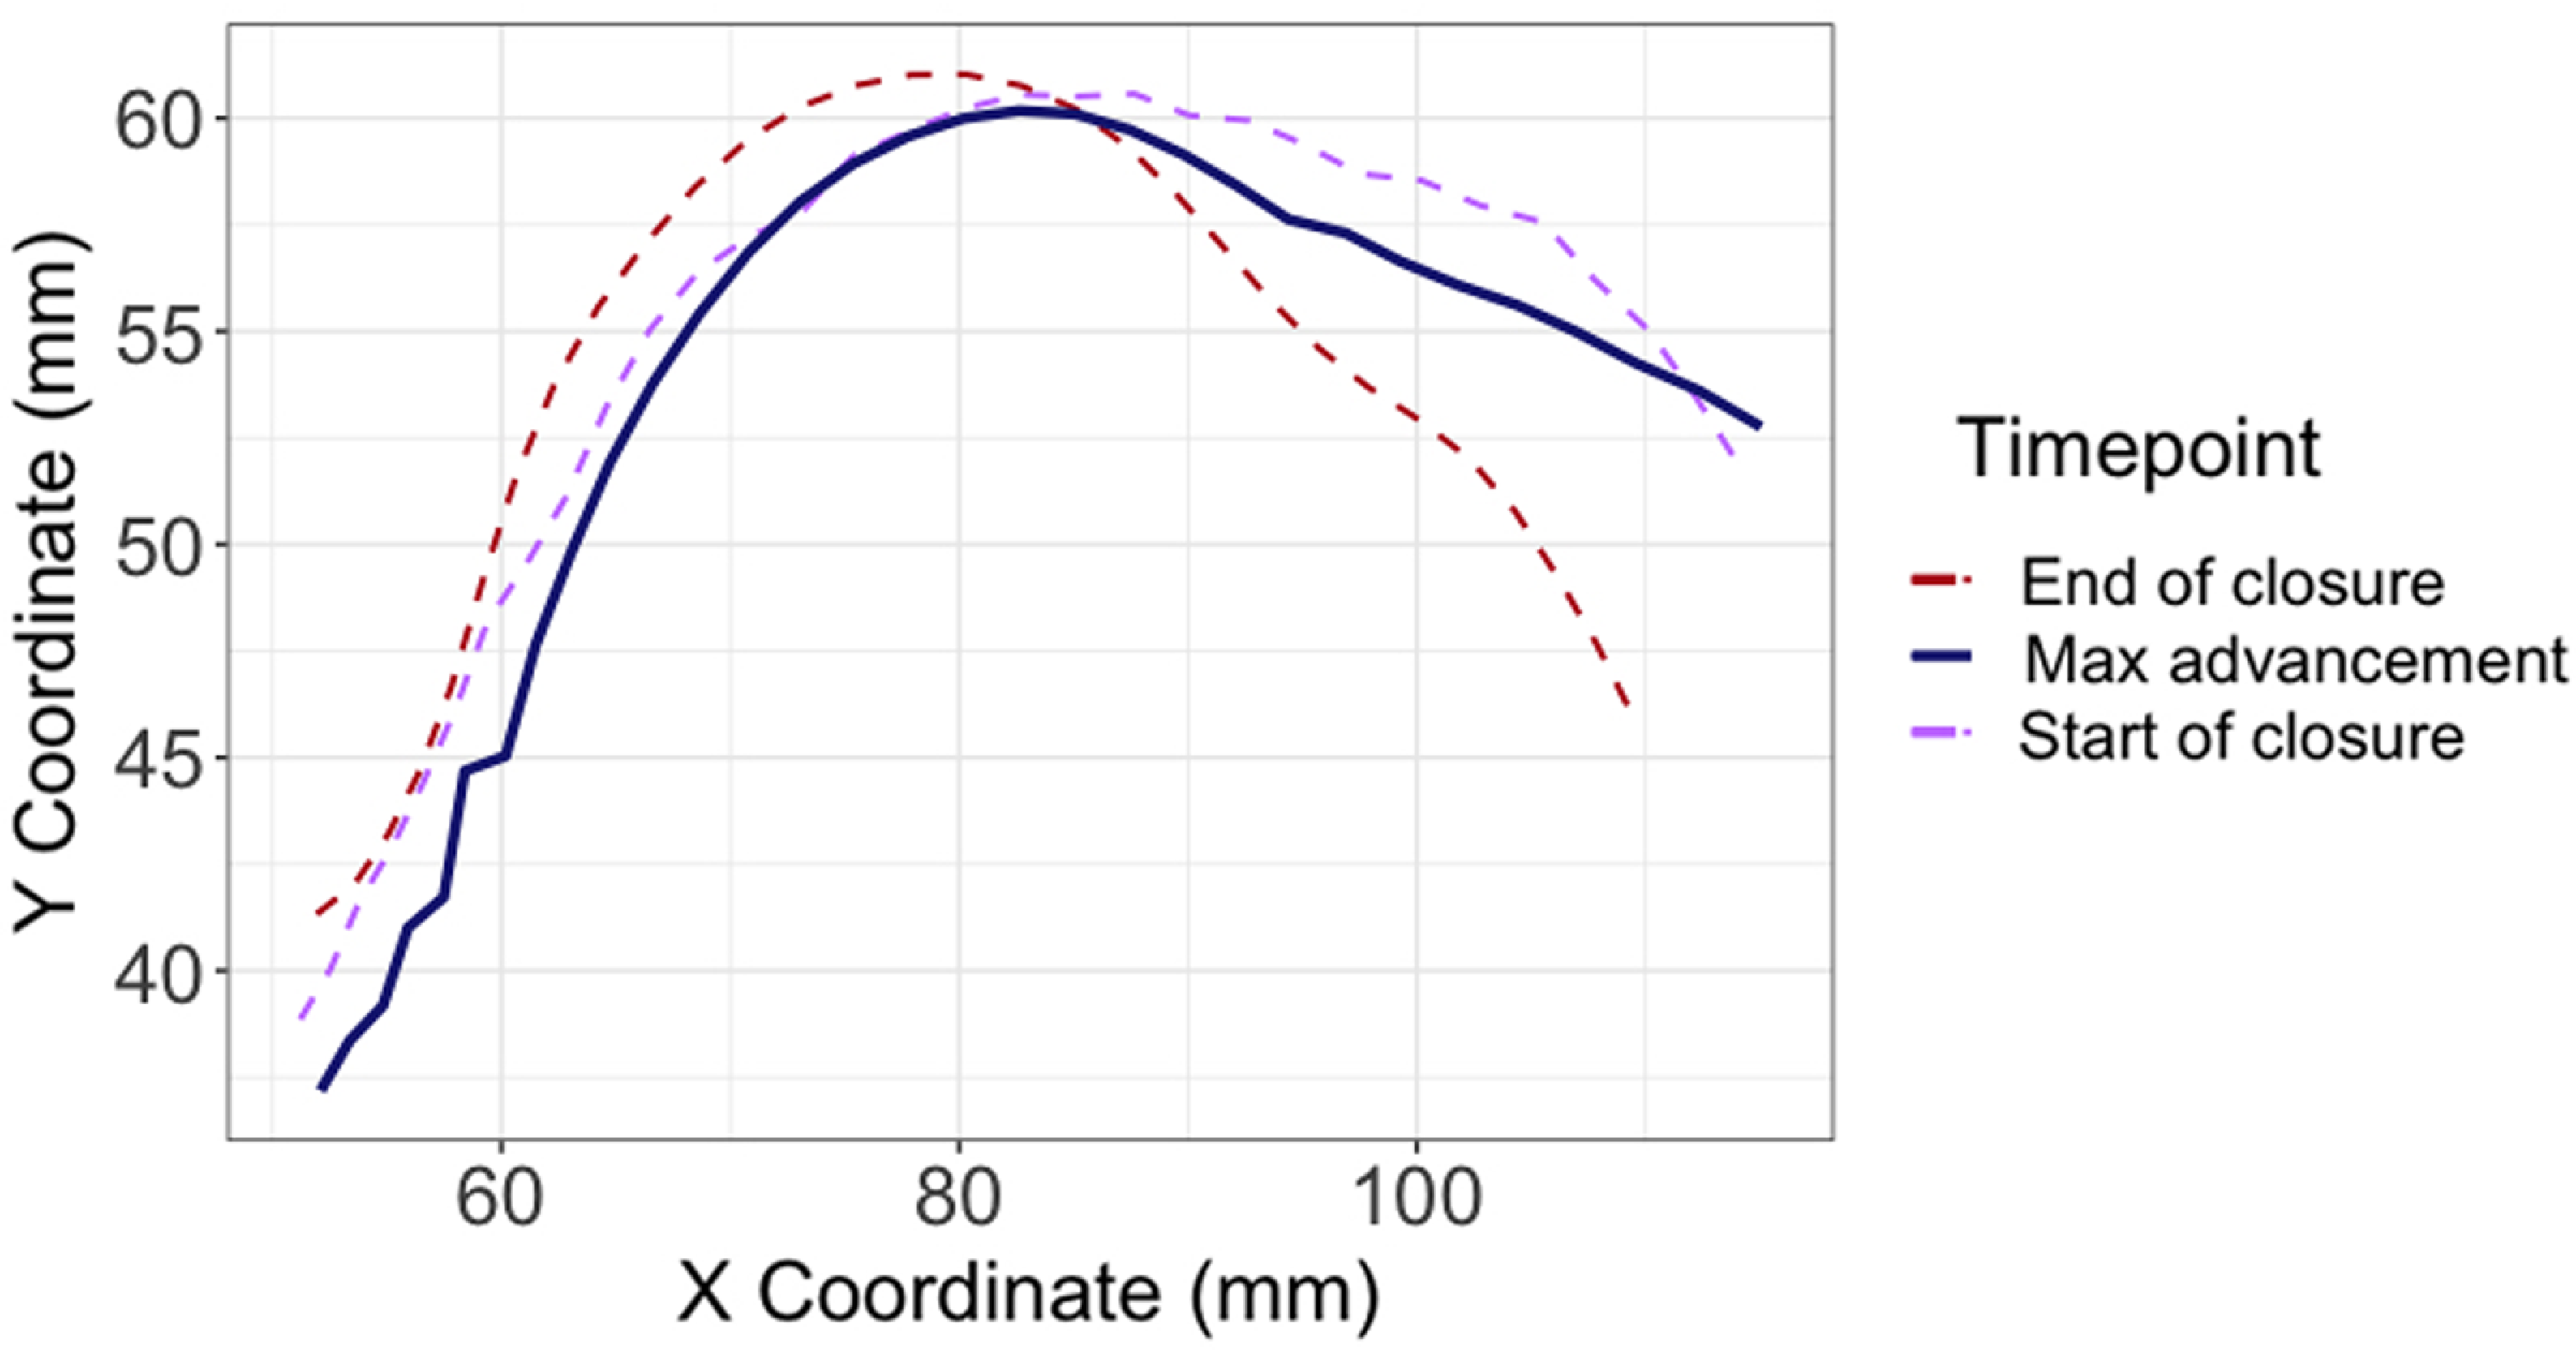
For the lingual data, two measures were also analyzed. Models were fitted on the maximum coordinate value on the X-axis for the tongue root (representing degree of advancement) and on the minimum coordinate value of the Y-axis for the tongue body (representing degree of lowering) during the closure or frication portion of the onset. Figure 7 shows the traces of three key ultrasound frames during the closure of the word dame [dam] ‘lady’. The dark solid line is the maximum value on the X-axis, indicating the point of maximum tongue root advancement, approximately 42% into the closure.
Maximum point of tongue root advancement during the closure of a token of dame [dam] ‘lady’, visualized as the dark solid line. The additional lines illustrate the first and last frame of the closure, flanking the point of maximum advancement.

The timepoints at which maximum tongue root fronting is achieved are most often near the release of obstruents. Minimal tongue height, on the other hand, often coincides with the beginning of the oral closure. For example, the tongue is often raised and fronted continuously in anticipation of the following vowel in consonants followed by /i/. Therefore, rather than fitting linear regressions on the timepoints at which greatest tongue displacement is achieved, models fitted on tongue root position and tongue height at the midpoint of the closure were chosen to complement the models fitted on maximum tongue root fronting and minimum tongue lowering. These two types of models yielded highly similar results.
Thus, six main mixed models were constructed. The independent variables, with reference levels in bold, were VOICING (voiced, voiceless), FOLLOWING VOWEL (/a/, /i/, /u/), PLACE of articulation (labial, coronal) and MANNER of articulation (oral stop, fricative and nasal stop). The maximal models included all three-way interactions and by-subject random intercepts. By-word random intercepts were not included because a single word was composed of all possible combinations of vowel, place and manner, which would have resulted in overfitting. Random slopes were excluded because the models including them did not converge. The maximal models were simplified stepwise. At each step, the factor or interaction with the lowest F-value was dropped and the resulting model was only retained if it had a significantly lower or equivalent AIC than the previous model. Factors and interactions were not dropped if they were part of a more complex interaction, and significant factors and interactions were never dropped. Therefore, if an interaction is absent in the model, it is because it was not found to be significant. The final simplified models are presented in Appendix I.
To investigate the effectiveness of such anti-AVC maneuvers in maintaining closure voicing, correlation tests were run between the duration of closure voicing and relevant movement variables for the subset of the data that included only voiced, non-nasal segments. For the larynx, the variable was the maximum lowering, for tongue root advancement, the maximum fronting and for tongue body height, the minimum height.
3. Results
3.1 Larynx movement
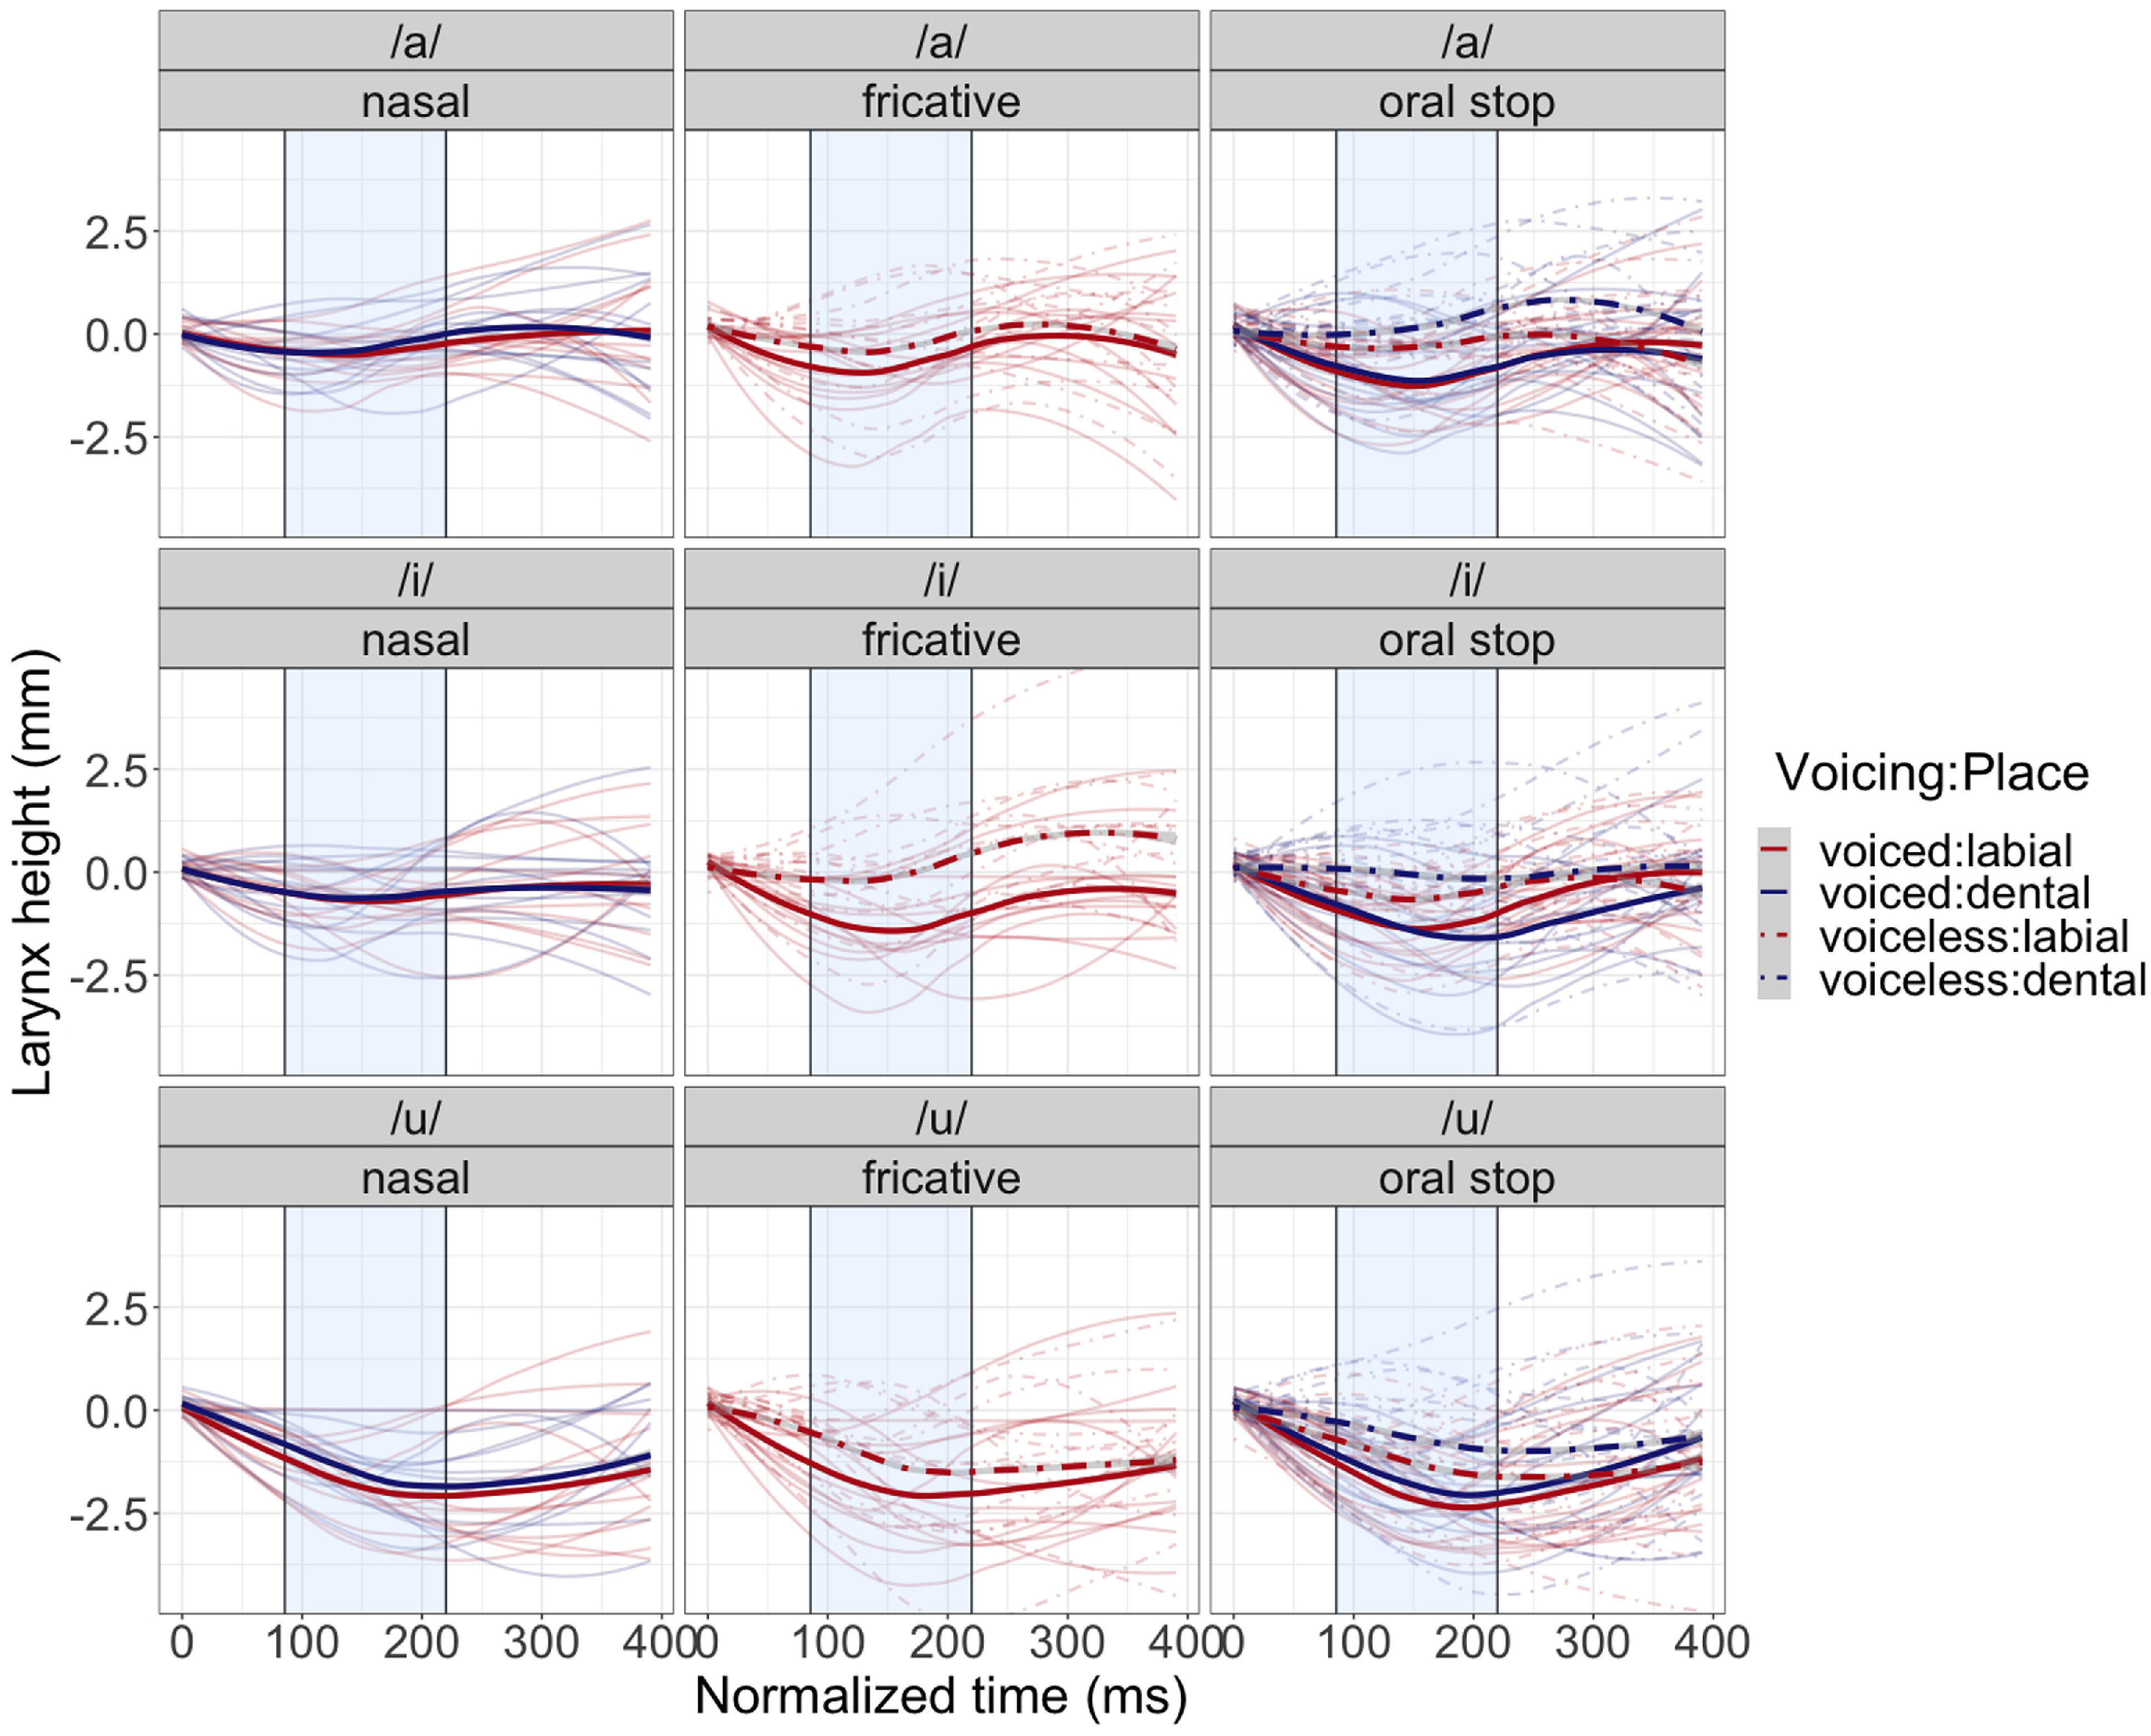
Overall, significantly more larynx lowering was observed in both voiced stops and fricatives than in their voiceless counterparts. The magnitude of this effect depends on the following vowel and both the place and manner of articulation of the obstruent. In Figure 8, relative larynx height is represented on the Y-axis in millimeters. A value of zero corresponds to the base position of the larynx taken at the start of the preceding vowel (always /a/). The X-axis shows normalized time in milliseconds (see section 2.3.2 for further explanation). The light blue rectangle indicates the mean length of the obstruent constriction phase, excluding subsequent aspiration or affrication, and the remaining portion (beginning at approximately 228ms) is the following vowel.
Mean (dark lines) larynx movement of all speakers by following vowel, manner, place and voicing. Voiced segments are solid lines while voiceless segments are dot-dashed. Place of articulation is indicated by color. The light blue rectangle, denoting the constriction phase of the consonant, is flanked by the preceding vowel /a/ on the left and the following vowel on the right as labeled above each plot. Pale lines are individual speakers’ trajectories.

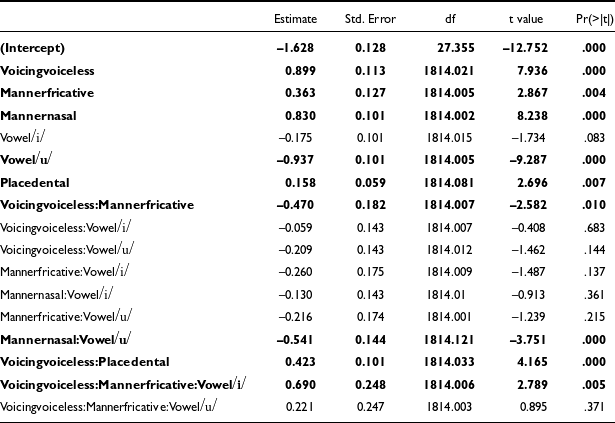
The way in which various factors affect the point of maximum larynx lowering in consonants will be elucidated first (full statistical results are reported in Table A1 in the appendix). There is a significant lowering of the larynx during the closure phase of all consonants (Intercept /ba/: β = –1.6 mm, t = –12.75, p < .001) and a generally lower larynx before /u/ than other vowels (Vowel /u/: β = –0.9mm, t = –9.29, p < .001). As expected, voiceless stops do not exhibit as much lowering as voiced stops (with /b/ as the intercept, Voicingvoiceless: β = 0.9 mm, t = 7.94, p < .001), an effect that is even greater in /t/ than in /p/ (Voicingvoiceless:Placedental: β = 0.4 mm, t = 4.17, p < .001). Overall, fricatives show much weaker effects than stops: the larynx is not lowered as much in /v/ as in /b/ (Mannerfricative: β = 0.4 mm, t = 2.87, p = .004), probably because there is less need to expand the supraglottal cavity in fricatives than in stops, and it tends to be higher in /p/ than /f/ (Voicingvoiceless:Mannerfricative: β = –0.5 mm, t = –2.58, p = .010). Moreover, the word fille [fɪj] ‘girl’ appears to have a slightly higher larynx than would be expected from its vowel and onset possibly as an anticipatory gesture due to the coda [j] (Voicingvoiceless:Mannerfricative:Vowel/i/: β = 0.7 mm, t = 2.79, p = .005). There is less larynx lowering in nasals than in obstruents (Mannernasal: β = 0.8, t = 8.24, p < .001) but the fact that there is marginal lowering even in sonorants suggests that it is more than a strategy to circumvent the AVC. Both nasals /m/ and /n/ tend to exhibit a lower larynx when the following vowel is /u/ (Mannernasal:Vowel/u/: β = –0.5 mm, t = –3.75, p < .001).
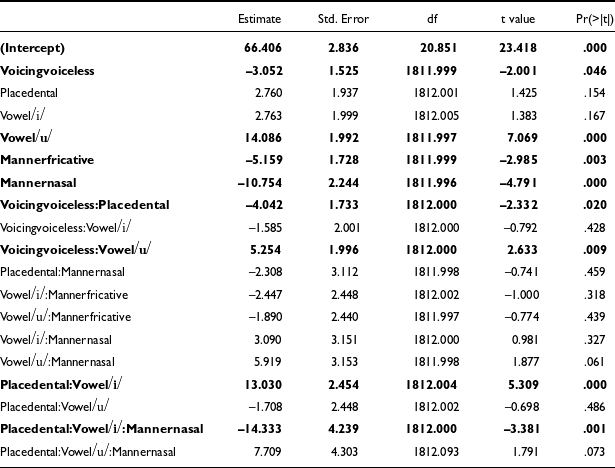
The time at which the larynx reaches its minimum height also varies across onsets (Table A2 in the appendix). It is reached earlier in sonorants and fricatives than in stops, which simply reflects the fact that the larynx does not drop as low in these manners (Intercept /ba/: β = 66.4% of the closure, t = 23.42, p < .001; Mannernasal: β = –10.8%, t = –4.79, p < .001; Mannerfricative: β = –5.2 %, t = –2.99, p = .003). It is also reached earlier in voiceless than voiced obstruents, likely for the same reason (Voicingvoiceless: β = –3.1%, t = –2.00, p = .046). In general, the minimum larynx height is reached later for /u/ than for /a/ (Vowel/u/: β = 14.1%, t = 7.07, p < .001), and the effect of the vowel interacts to some extent with Voicing, Manner and Place in certain words (cf. Table A2 in the appendix).
3.2 Tongue movement
In the following figures, the initial coordinate for the tongue root position (Figure 9) and tongue height (Figure 10) of each token, corresponding to the first ultrasound frame of the vowel preceding the target consonant, was subtracted from all subsequent coordinates of this token, yielding their relative position over time. This was done to facilitate visualization of the precise tongue root and tongue body movement in millimeters. Due to poor image resolution, one female participant’s lingual ultrasound data was excluded.
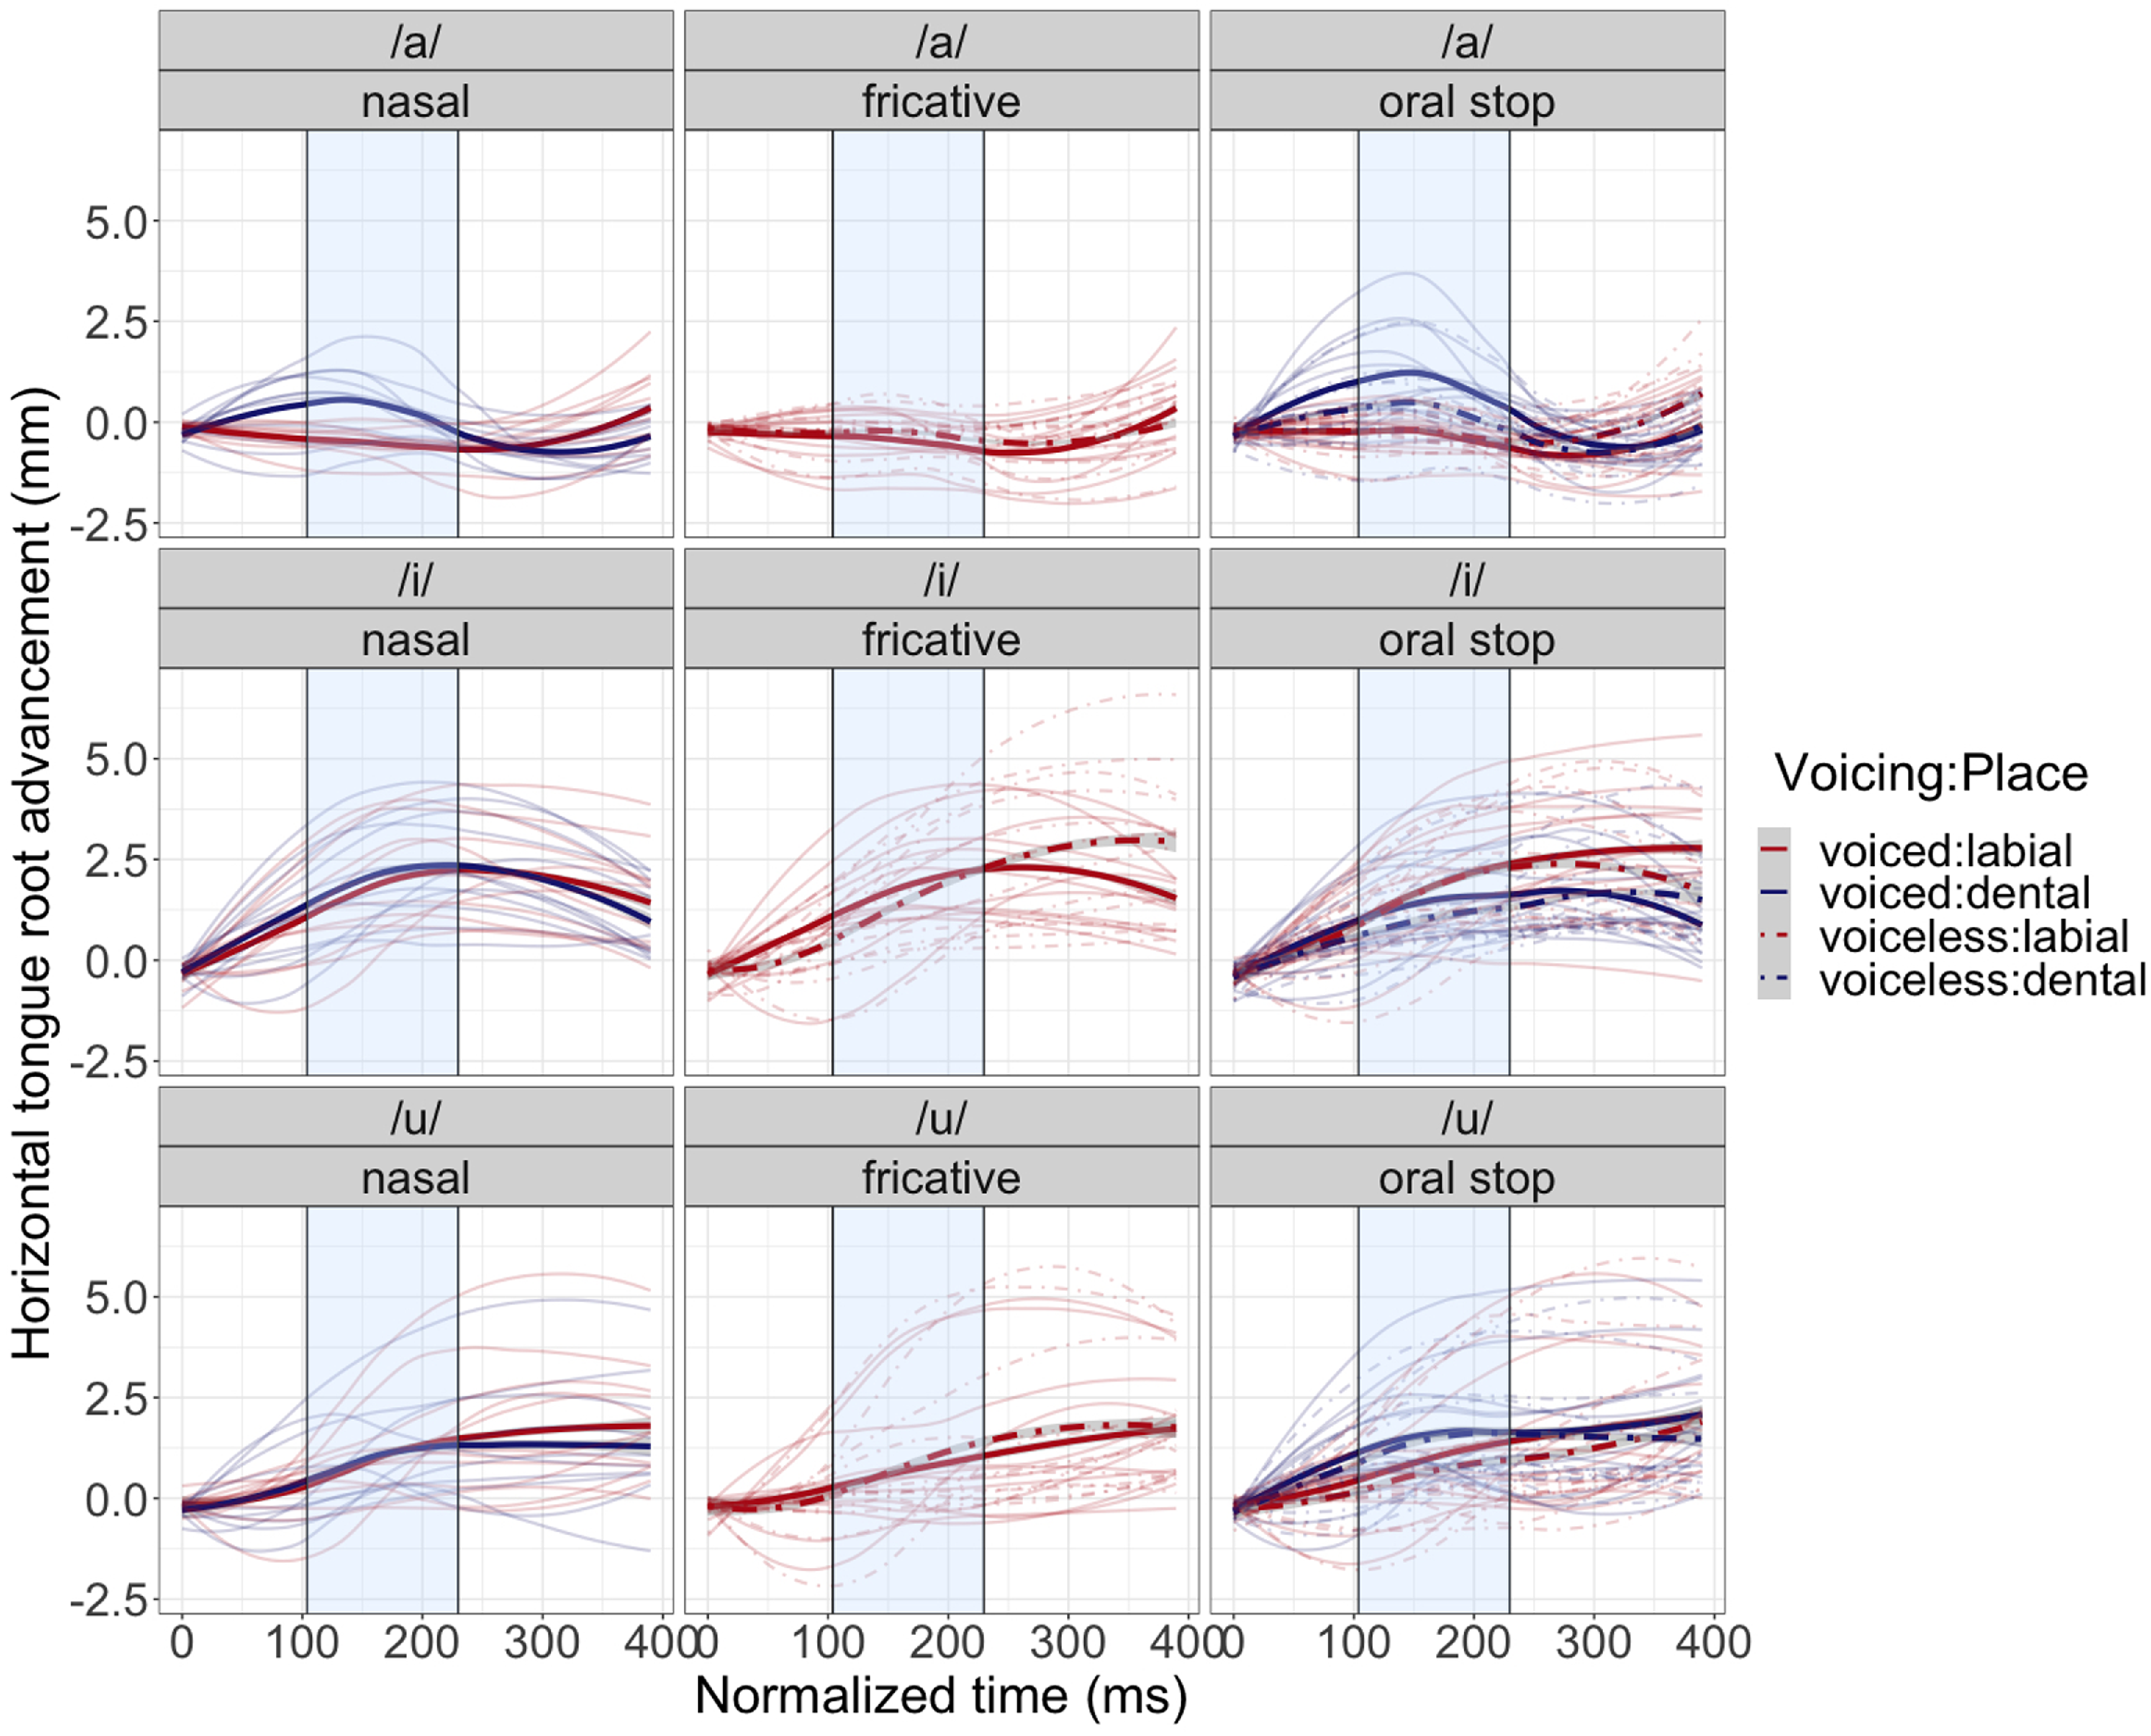
Mean (dark lines) horizontal tongue root advancement for all speakers by following vowel, manner, place and voicing. Voiced segments are solid lines while voiceless segments are dot-dashed. Place of articulation is indicated by color. The light blue rectangle, denoting the constriction phase of the consonant, is flanked by the preceding vowel /a/ on the left and the following vowel on the right as labeled above each plot. Pale lines are individual speakers’ trajectories. Positive values indicate tongue root advancement.

3.2.1 Tongue root
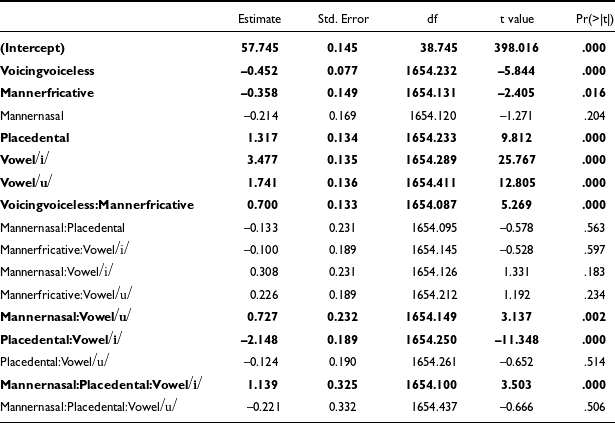
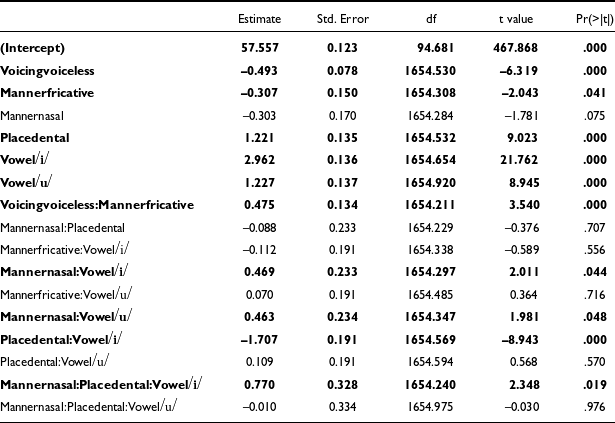
Figure 9 presents the average tongue root position over time. Again, the light blue rectangle corresponds to the constriction phase. A higher value indicates a more advanced tongue root. The statistical models fitted for the maximum tongue root fronting and fronting at the midpoint of the closure are very similar. As the maximum tongue root fronting model is better correlated with the observed data (r = .78 vs. r = .73), estimates and t-values for that model are reported here (the full results are in Table A3 in the appendix), but the detailed results for the other model can be found in the appendix (Table A4).
The largest effect visible in Figure 9 is the greater tongue root fronting in high vowels than in /a/, a low vowel produced with a pharyngeal constriction (Vowel/i/: β = 3.5 mm, t = 25.77, p < .001, Vowel/u/: β = 1.7 mm, t = 12.81, p < .001). Other effects include a more fronted tongue root in dentals, during which the tongue is protruded to produce a dental constriction, than in labials (Placedental: β = 1.3 mm, t = 9.81, p < .001).
More relevant here are the effects of voicing on tongue root position. While voiceless stops are produced with a less fronted tongue root than voiced ones (Voicingvoiceless: β = –0.5 mm, t = –5.84, p < .000), this effect is neutralized in fricatives (Voicingvoiceless:Mannerfricatives: β = 0.7 mm, t = 5.27, p < .001). No significant interaction between Place and Voicing was observed. This seem to support the idea that pharyngeal expansion is only consistently needed as an anti-AVC strategy when there is a full closure.
3.2.2 Tongue body
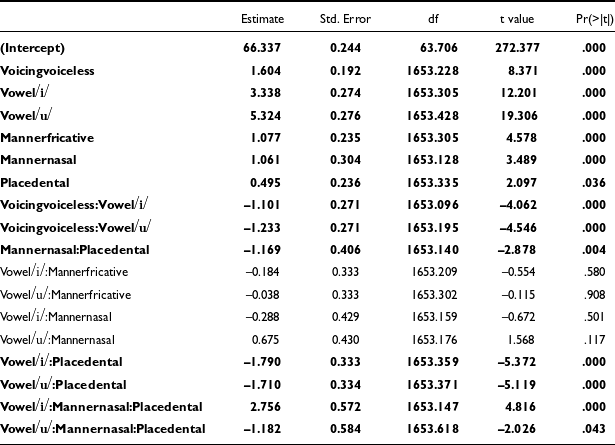
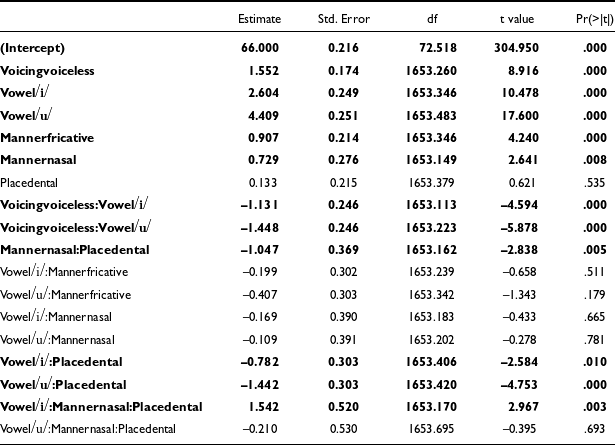
The average tongue body position is shown in Figure 10, in which a lower value on the Y-axis corresponds to a lower tongue body. The models fitted for the minimum tongue height and the tongue height at the middle of the closure were again very similar. Although the model for the middle of the closure (Table A6 in the appendix) is slightly better correlated with observed values (r = .73 vs. .67), the coefficients and t-values of the model for minimum tongue height (Table A5 in the appendix) will be reported. The minimum value better captures the tongue lowering movement that increases the volume of the oral cavity to counter the AVC.
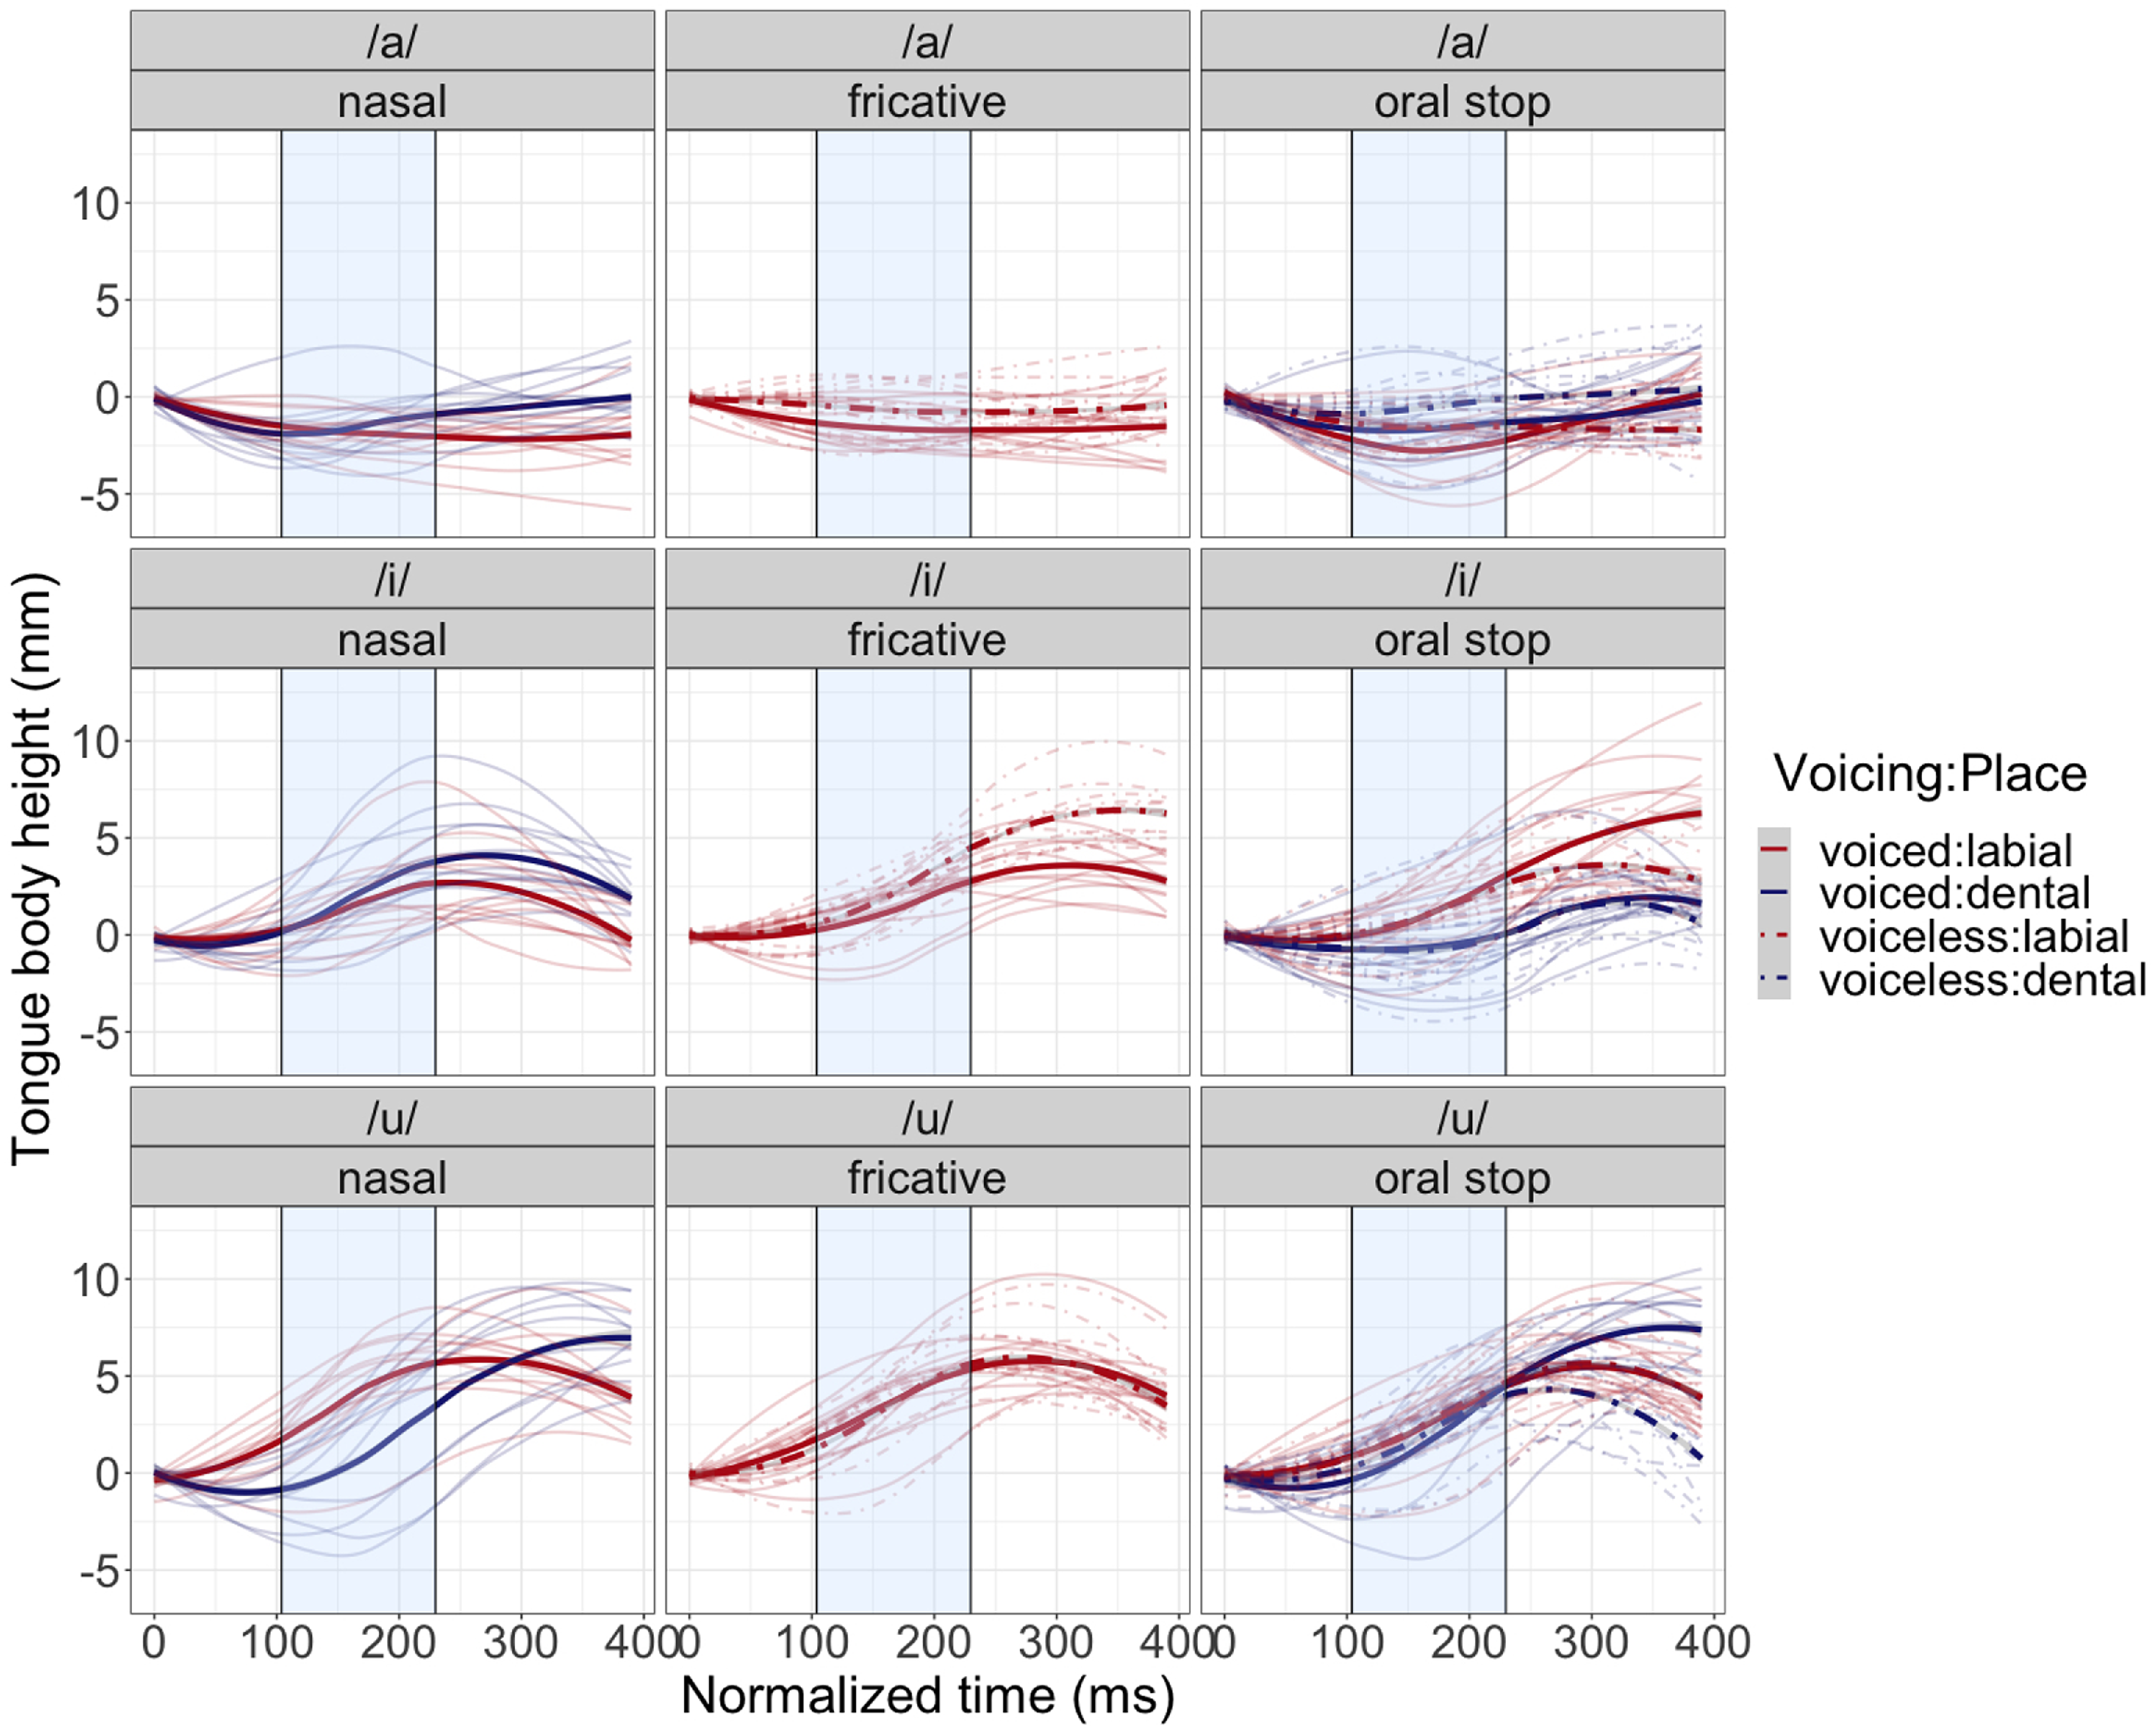
Mean (dark lines) tongue body height for all speakers by following vowel, manner, place and voicing. Voiced segments are solid lines while voiceless segments are dot-dashed. Place of articulation is indicated by color. The light blue rectangle, denoting the constriction phase of the consonant, is flanked by the preceding vowel /a/ on the left and the following vowel on the right as labeled above each plot. Pale lines are individual speakers’ trajectories. Lower values indicate tongue body lowering.

The factor that affects tongue height the most dramatically is the height of the following vowel, with high vowels exhibiting a higher tongue height than /a/ (Vowel/i/: β = 3.3 mm, t = 12.20, p < .000, Vowel/u/: β = 5.3 mm, t = 19.31, p < .000). However, this effect is weaker for high vowels following dental stops (Vowel/i/:Placedental β = –1.8 mm, t = –5.37, p < .000, Vowel/u/:Placedental β = –1.7 mm, t = –5.11, p < .000). Fricatives and nasals generally also have a slightly greater minimum tongue height than stops, which for fricatives can likely be attributed to a less-pronounced need to overcome the AVC (Mannerfricative: β = 1.1 mm, t = 4.58, p < .000, Mannernasal: β = 1.1 mm, t = 3.49, p < .000). The minimum tongue body position is slightly higher during dental stops than bilabial stops when preceding /a/ (β = 0.5 mm, t = 2.1, p = .04), but the opposite effect is found before high vowels (Vowel/i/:Placedental β=–1.8 mm, t = –5.8, p < .001; Vowel/u/:Placedental β = –1.7, t = –5.1, p = 0.001).
Turning to voicing, it appears that voiceless obstruents have a greater minimum tongue height than voiced ones, irrespective of manner and place (Voicingvoiceless: β = 1.6 mm, t = 8.37, p < .000) but this effect is weaker in high vowels than in /a/ (VoicingvoicelessVowel/i/: β = –1.1 mm, t = –4.06, p < .000; VoicingvoicelessVowel/u/: β = –1.2 mm, t = –4.55, p < .000). The interaction between Voicing and Place was not significant and thus not included in the simplified model.
3.3 Individual use of anti-AVC strategies
Now that general strategies to circumvent the AVC have been established across speakers, individual variation in the use of these strategies will be examined. It is, however, important to note that although tongue root and tongue body data come from the same ultrasound recordings, laryngeal data come from a separate recording. This section should therefore not be considered as a direct illustration of changes in larynx height in conjunction with tongue movement. In order to assess the relative weight of each of the three anti-AVC maneuvers, Cohen’s ds were calculated separately for tongue root advancement, tongue body lowering and larynx lowering for each speaker (Cohen Reference Cohen1998). Cohen’s ds assess the separation between the distribution of two populations (here voiced and voiceless obstruents) by looking at the means and standard deviations of their samples. In general, a Cohen’s d of 0.8 or higher indicates a sizeable effect.
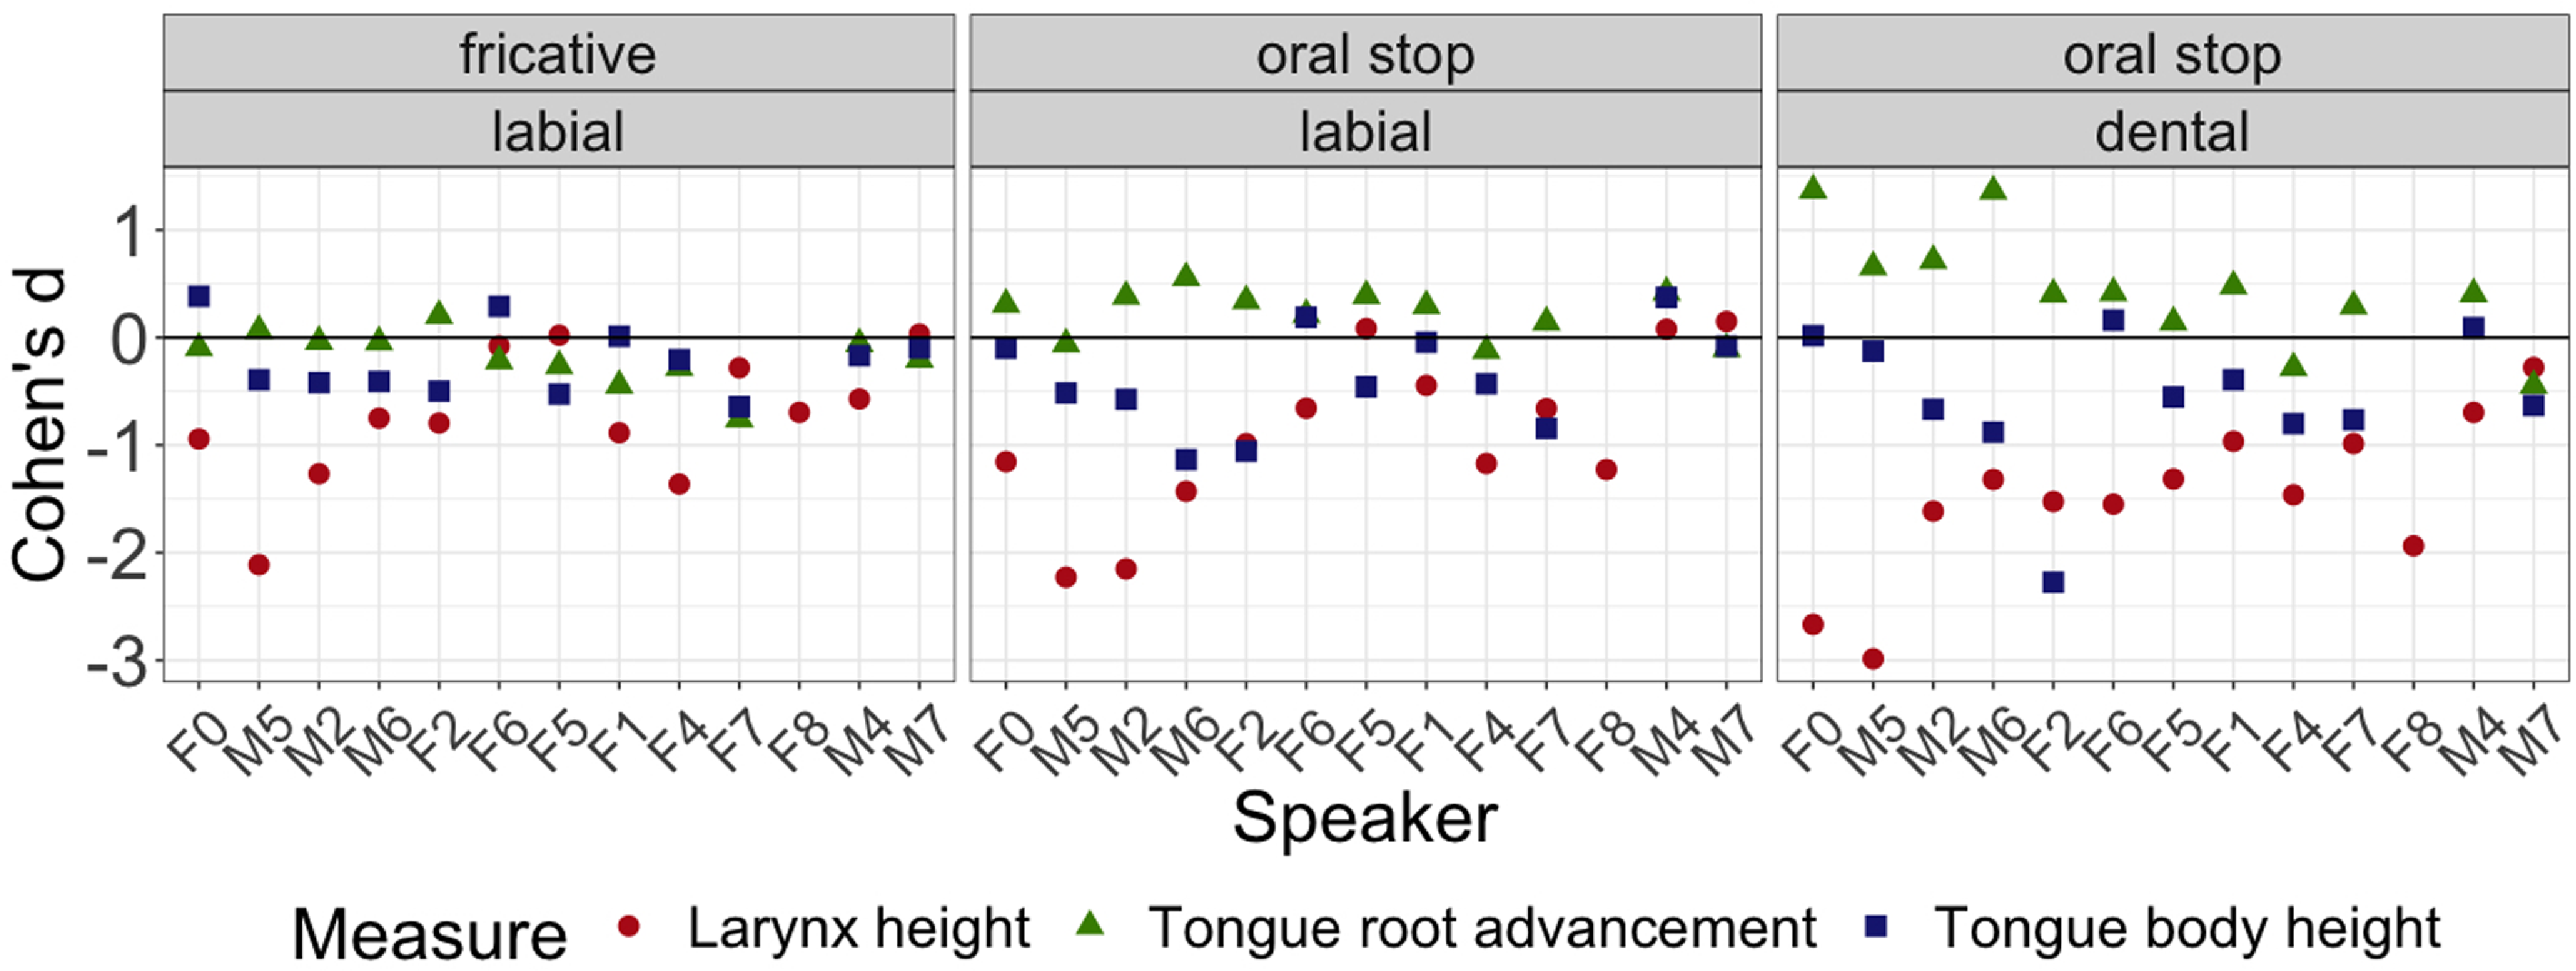
Absolute maximum tongue root advancement and absolute minimum tongue body height were used to calculate the Cohen’s ds of the tongue measures. Minimum larynx height was used for laryngeal measures. Cohen’s ds were calculated for individual places and manners, averaging across the following vowel. The results are reported in Figure 11. The speakers on the X-axis are ordered according to the largest (leftmost) or smallest (rightmost) difference between positive and negative Cohen’s d values.
Cohen’s ds by speaker, ordered from the largest to the smallest overall dispersion (across manners and places) in Cohen’s d values. A positive value for tongue root advancement indicates more advancement in the voiced than in the voiceless variant. A negative value for tongue body height indicates a lower tongue body in the voiced than in the voiceless variant. A negative value for larynx height indicates a lower larynx position in the voiced than in the voiceless variant. A greater distance from the zero baseline indicates a greater separation between distributions. Only the larynx height measure is plotted for F8 as the tongue data of this speaker was excluded due to poor image resolution.

Overall, larynx lowering appears to be the most distinct way of differentiating the production of voiced and voiceless obstruents across speakers, regardless of place or manner. There is some individual variation in its effect size but its prevalence is seen across the board, though it plays a larger role in dental stops than in other categories. Regarding tongue maneuvers, there is a large degree of variation not only across speakers but also depending on place and manner: dental stops seem to resort to more distinct tongue shapes in voiced and voiceless contexts than labial obstruents, and labial stops appear more distinct than labial fricatives. What remains relatively constant, however, is the use of at least one of the two lingual maneuvers for each segment. In other words, if a speaker tends to produce a less fronted tongue root in a voiced segment, they often compensate for this by a more pronounced lowering of the tongue body, and vice versa. The exact relationship between these maneuvers appears highly idiosyncratic and variable even within the speech of a single individual.
3.4 Synchronization of gestures
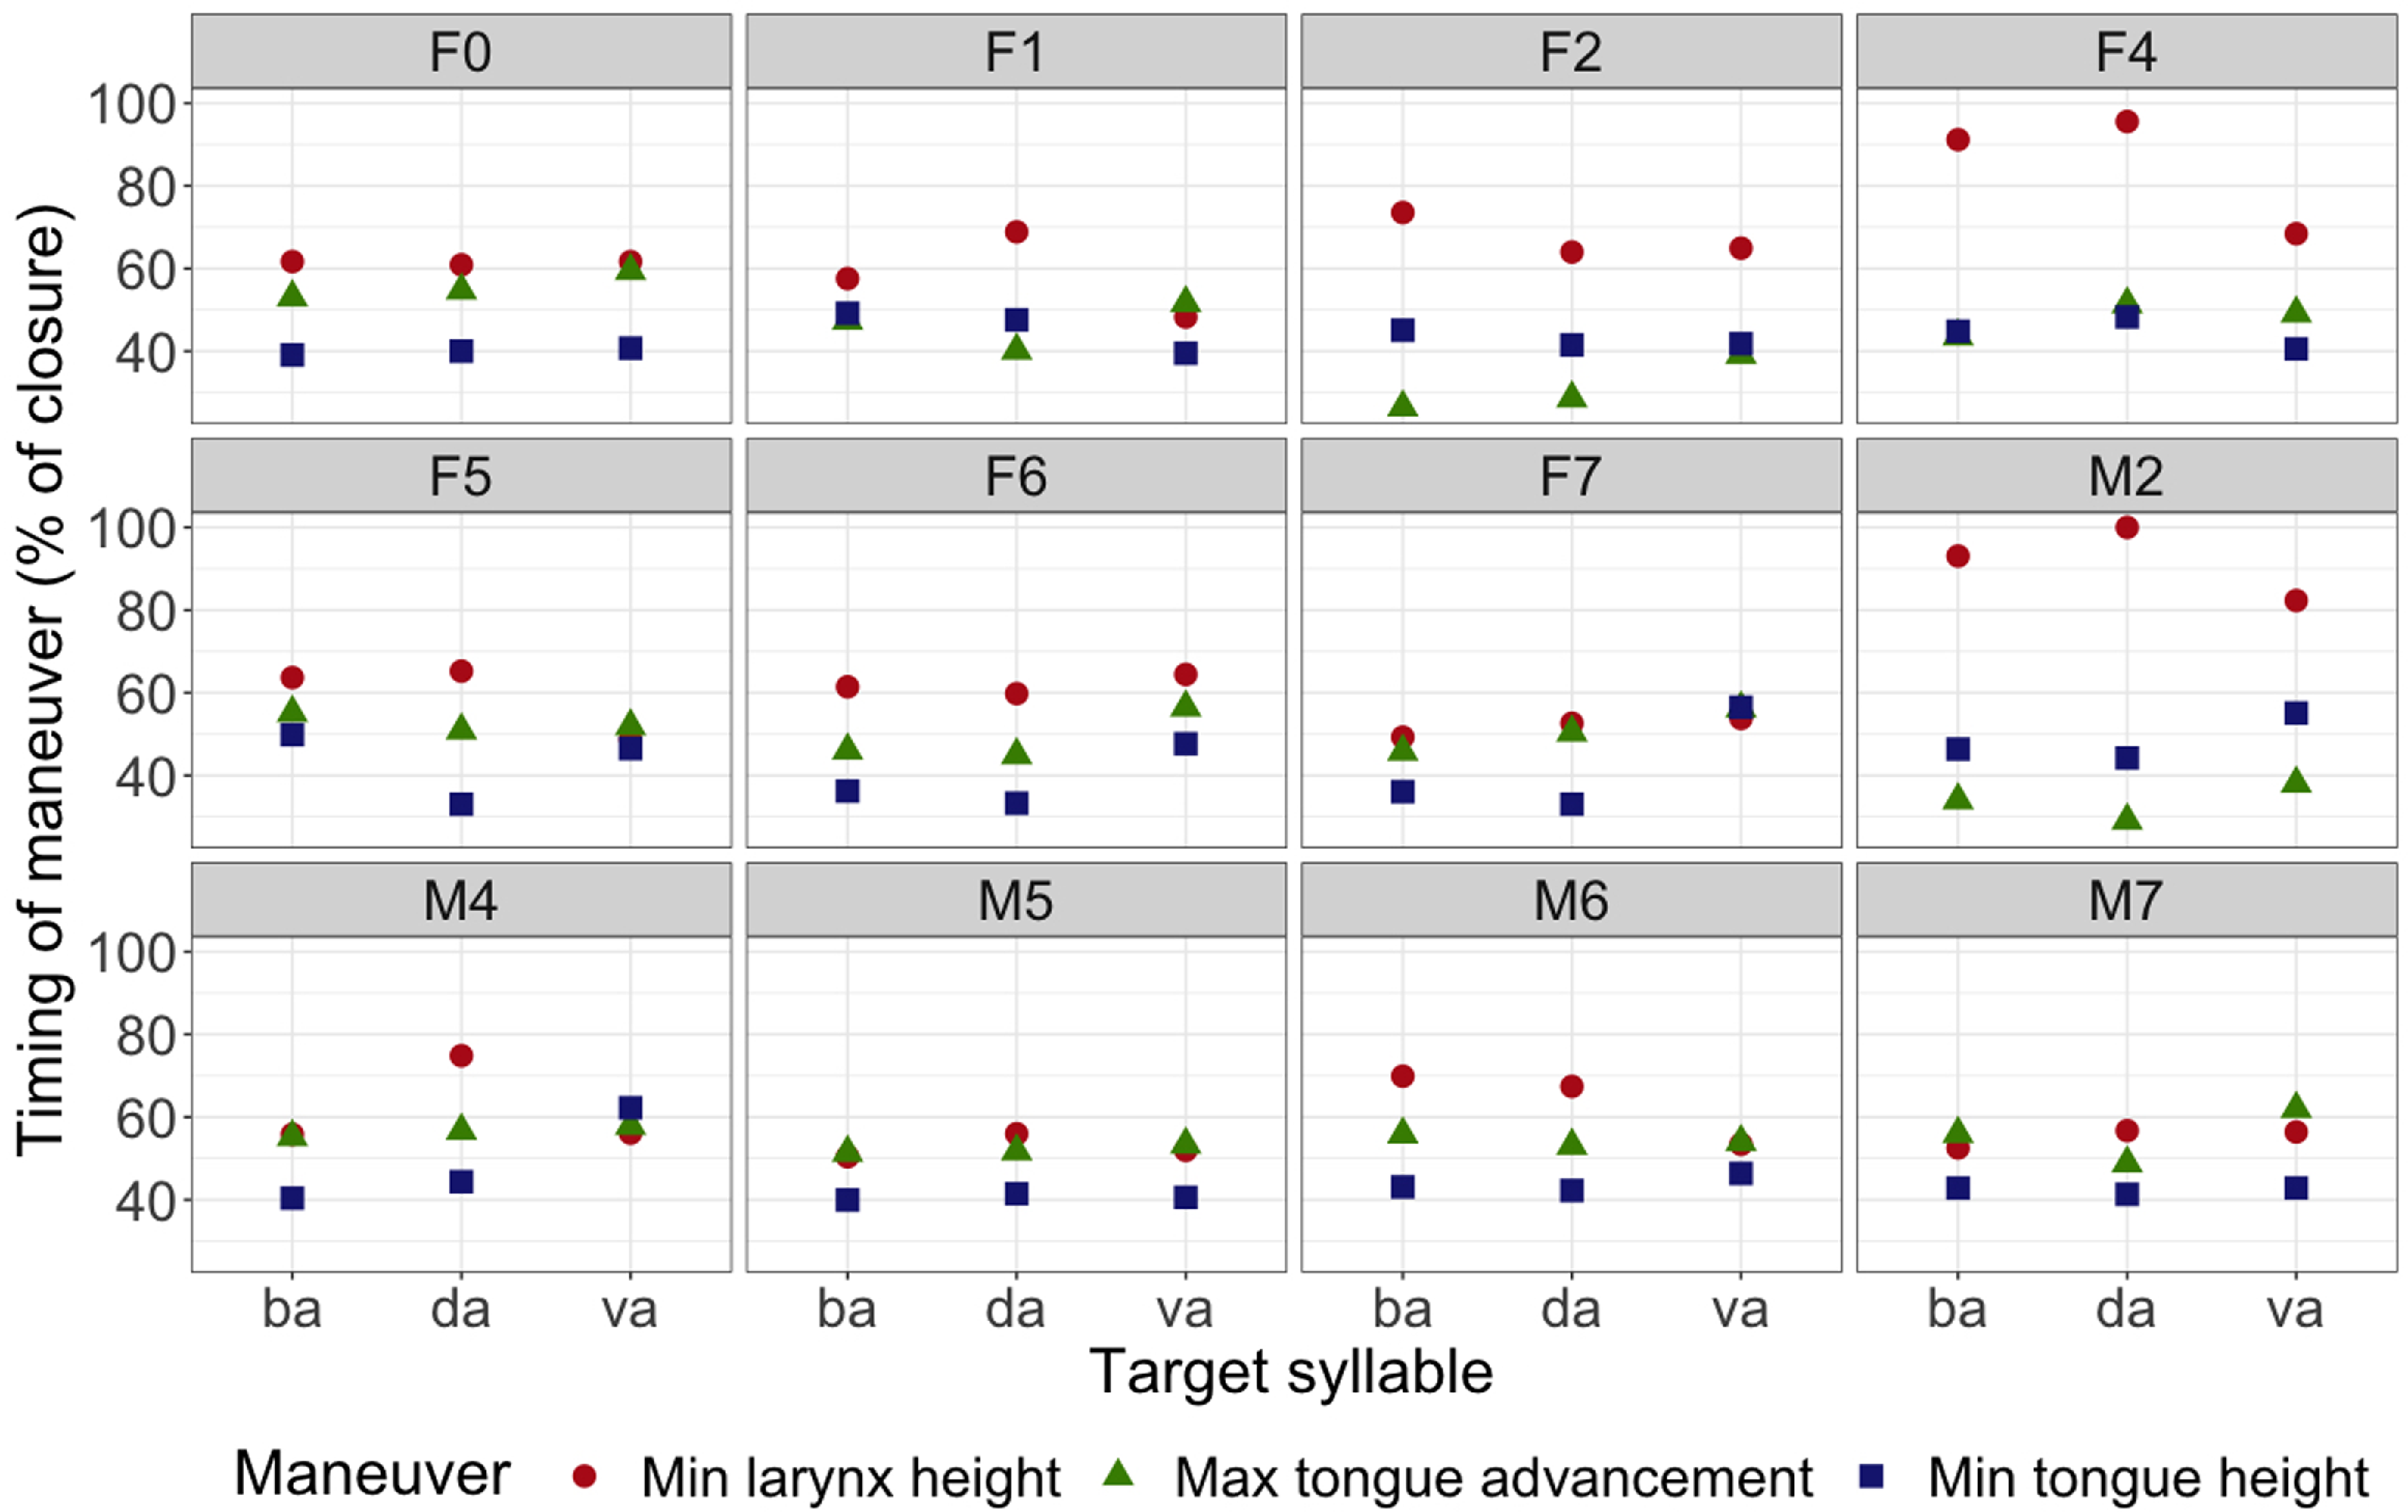
As Figure 11 makes evident, a large amount of interspeaker variation is observed in individuals’ use of different articulatory maneuvers to overcome the AVC. It would also be pertinent to determine if these gestures are coordinated or executed separately. Unfortunately, as the larynx and tongue data were collected separately, a one-to-one correspondence between the lingual and laryngeal gestures is impossible but it can cautiously be assumed that although speakers will naturally produce each repetition differently, it is unlikely for their articulatory strategies to vary greatly between the two recording sessions which were carried out less than fifteen minutes apart. The timepoints of maximal tongue root advancement, minimal tongue body height and minimal larynx height are compared for voiced oral obstruents preceding the vowel /a/ in Figure 12. The reason for excluding high vowels is that maximal lingual articulations in consonants preceding these vowels is systematically reached at vowel onset.
The timepoint during obstruent closure (represented as a percentage) at which the most extreme point of each anti-AVC maneuver is achieved. Only voiced obstruents preceding /a/ were considered.

The most consistent result in Figure 12 is that speakers tend to reach their minimum larynx height later than their tongue articulation extrema. This is possible because larynx height should not directly interfere with vowel articulation and the larynx is therefore relatively free to continue downward movement throughout the closure. There is again a large amount of interspeaker variation, although interestingly speakers seem fairly coherent across place and manner. F2, for example, consistently reaches maximum tongue root advancement much earlier than minimum larynx height. For M5, on the other hand, maximum tongue advancement and minimum larynx height are achieved nearly simultaneously. F4 seems to synchronize both tongue gestures but is more variable with the exact timing of minimum larynx height. This variation either suggests that no precise gestural synchronization strategy has a radical advantage over others or that speakers learn different synchronization patterns because of independent anatomical differences that were not measured here.
3.5 Effectiveness of articulatory strategies on voicing duration
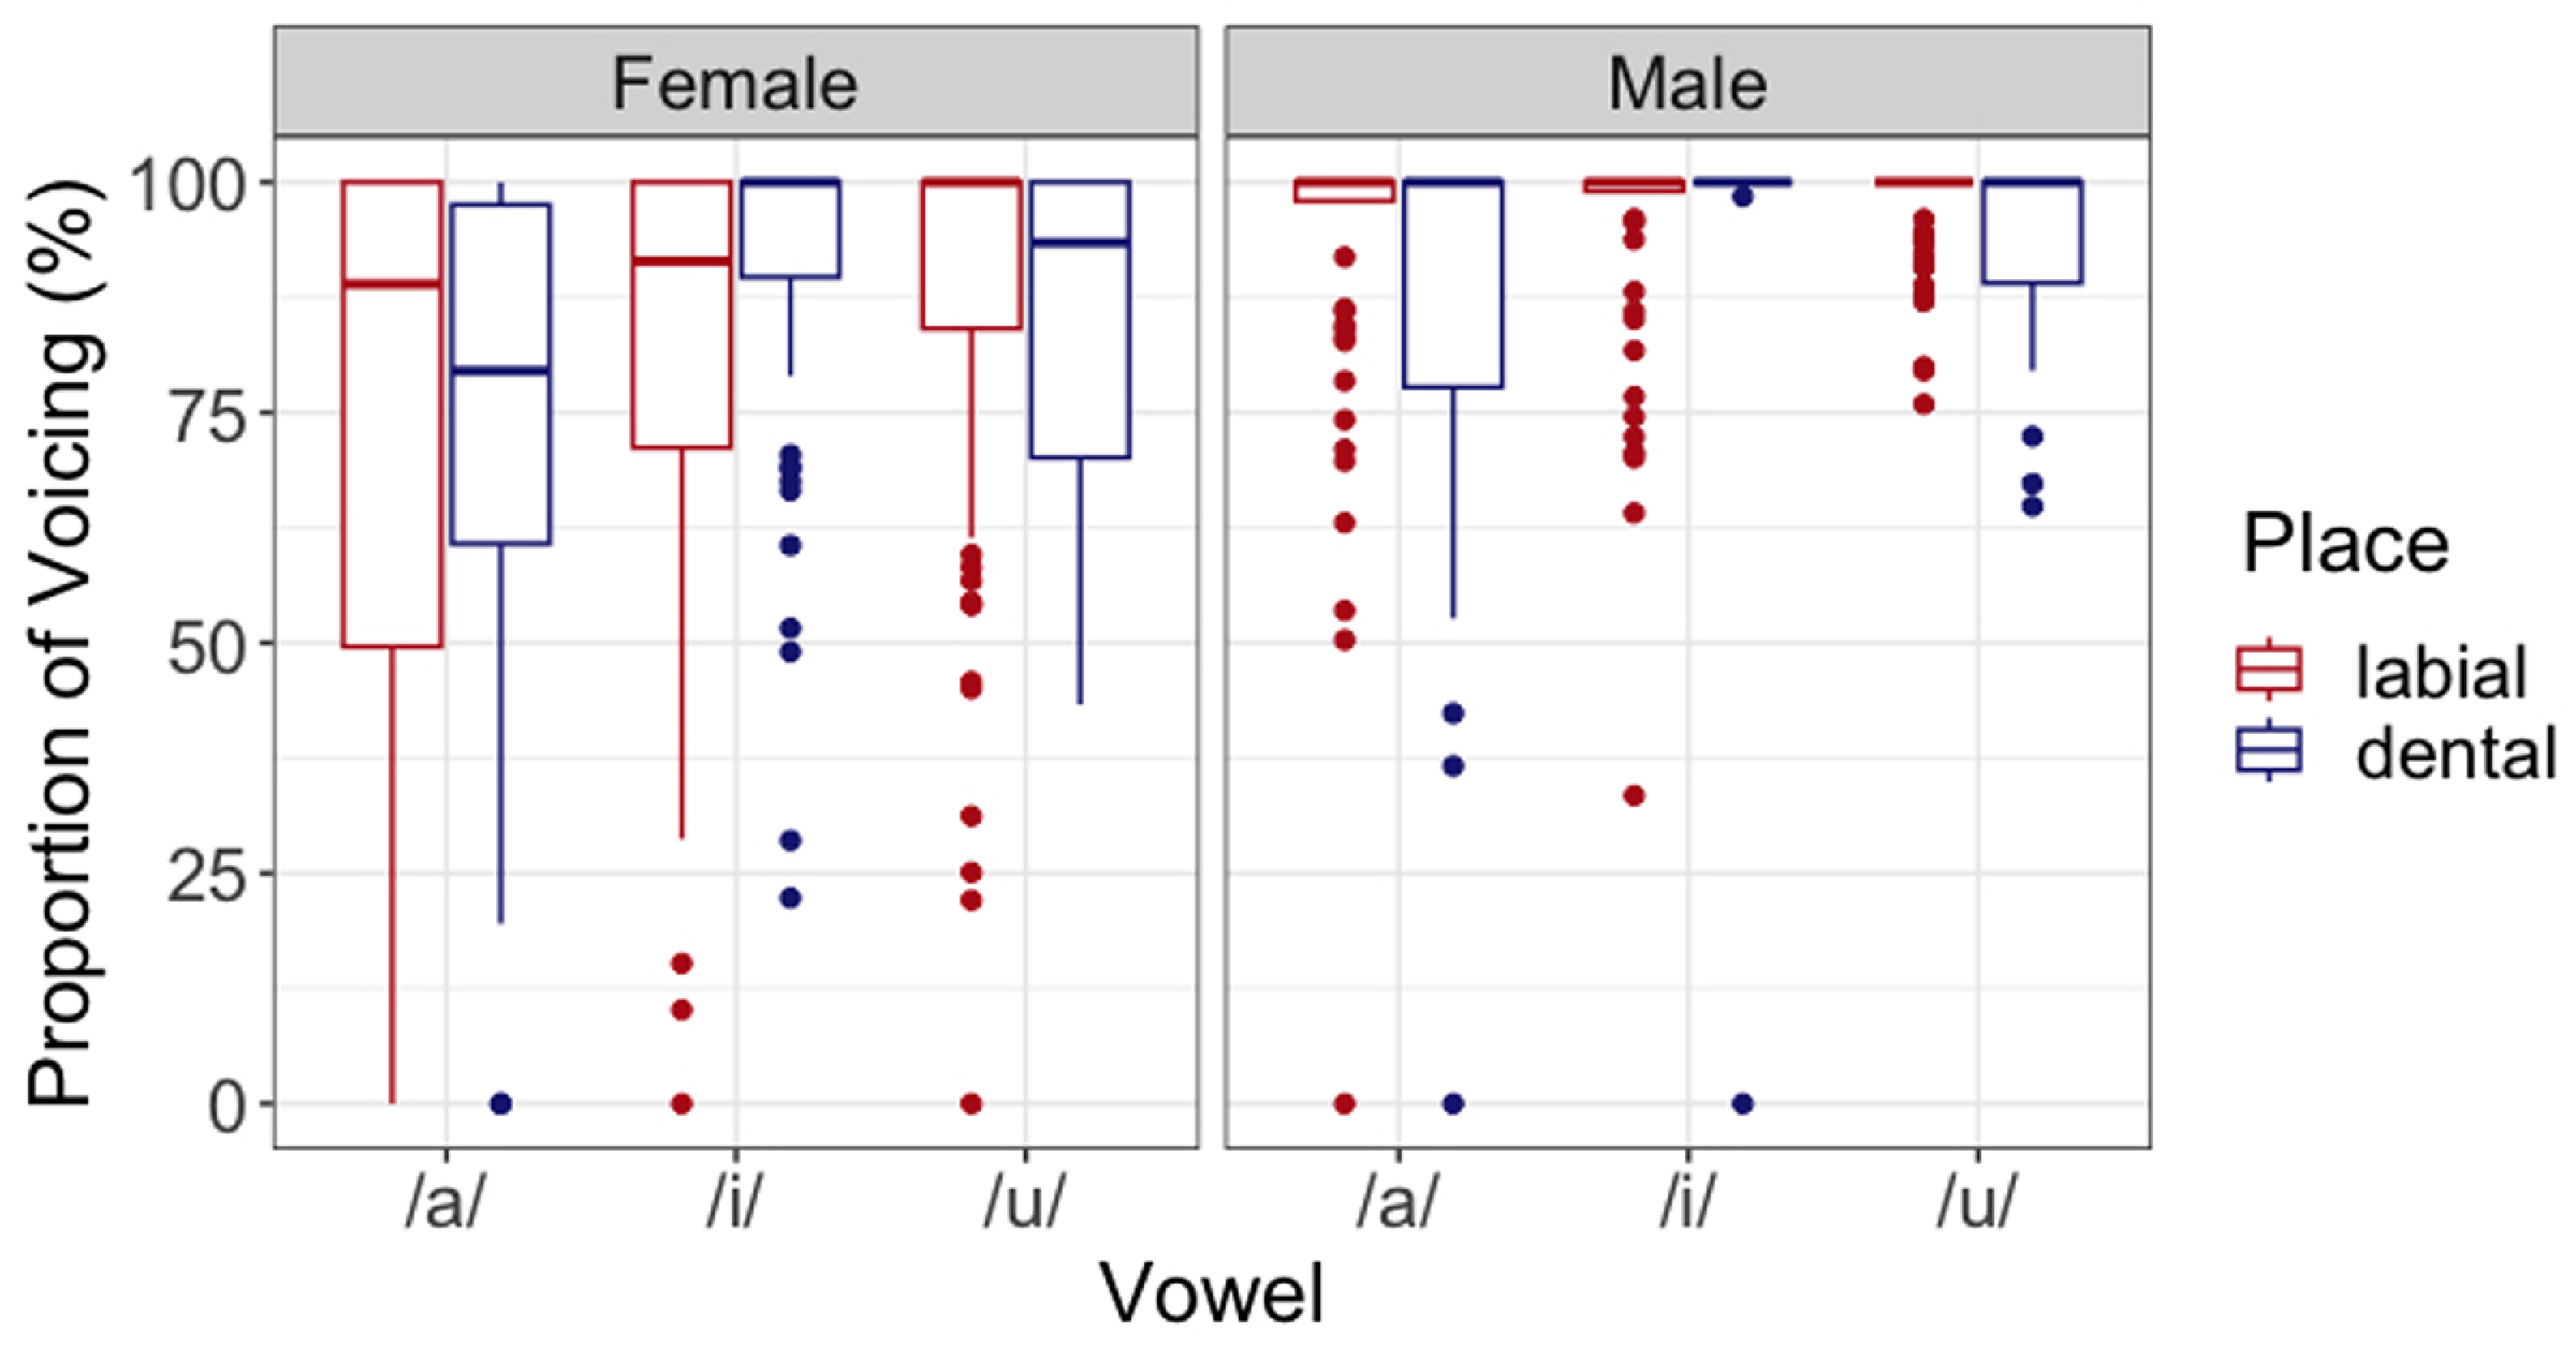
Analyses of the presence and duration of closure voicing reveal that a large proportion of voiced stops were realized with partial voicing. Out of the 850 tokens of voiced stops from both the laryngeal and lingual data, voicing dies out before the release in 362 of them. The prevalence of partial devoicing is more common in female (54%) than in male participants (27%), as shown in Figure 13. Some fricatives are also produced with partial voicing, but they will not be presented in detail as they only constitute 14% (58 tokens) of the sample.
Distribution of proportion of voiced closure in voiced stops in both laryngeal and lingual datasets.

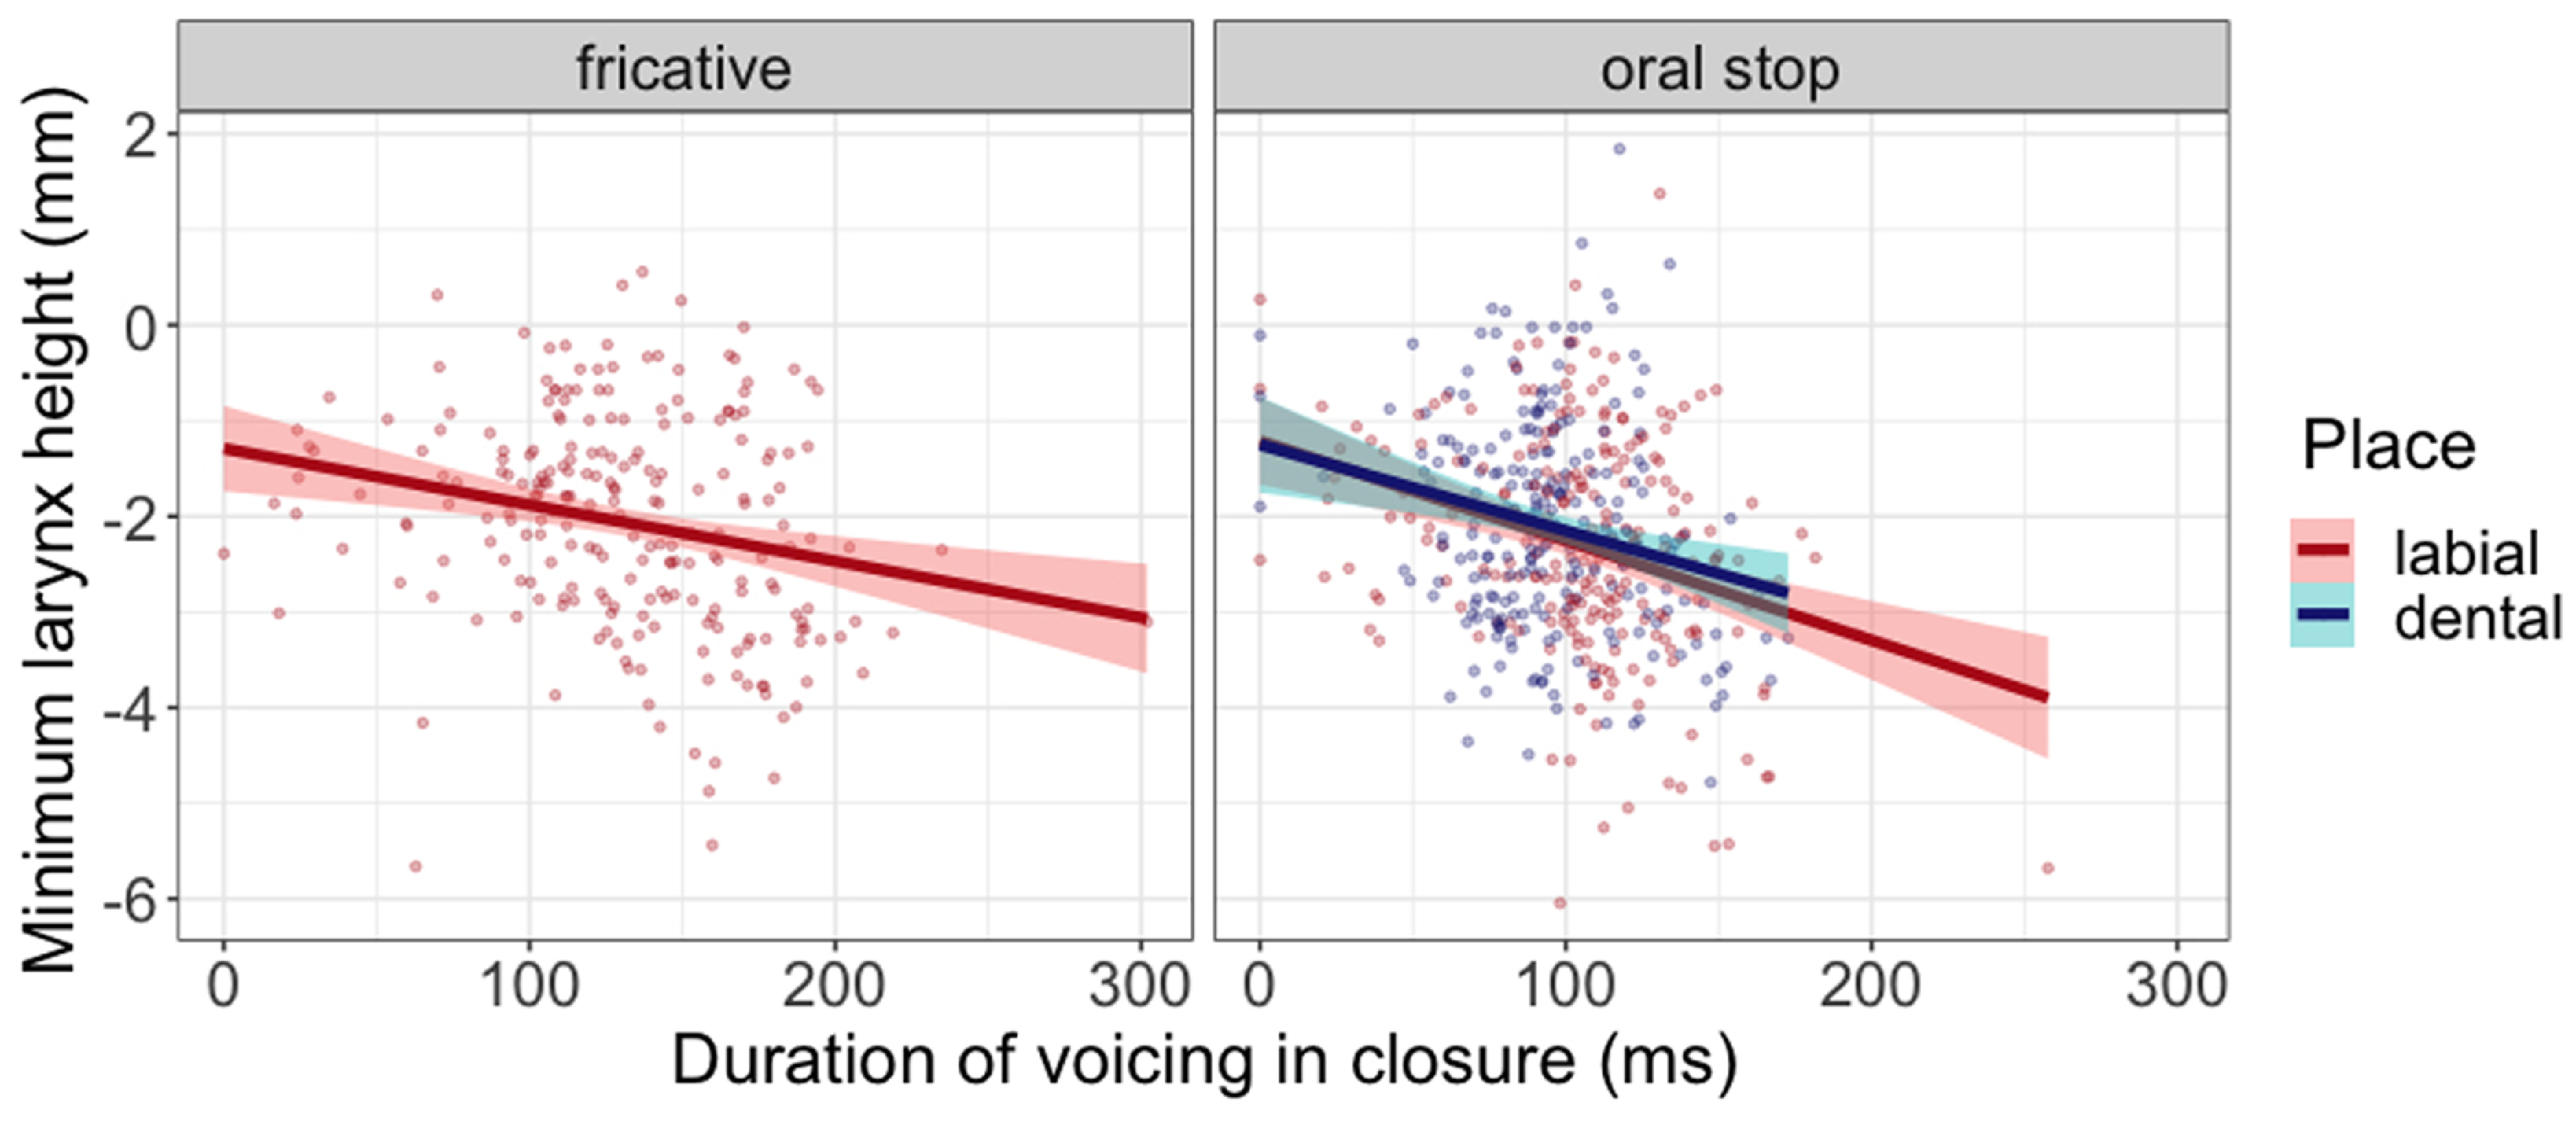
Given the many tokens for which full closure voicing was not achieved, it is pertinent to consider the effectiveness of the articulatory maneuvers considered in this study at circumventing the AVC. To this end, correlation tests between the amplitude of the anti-AVC maneuvers and the duration of voicing were carried out. A longer voicing duration naturally indicates a greater buildup of pressure and therefore a more pronounced need for anti-AVC strategies. Proportion of voicing, on the other hand, is dependent on closure duration which is not directly related to the implementation of anti-AVC maneuvers. Given this, a possible causal relation can only be analyzed if the raw duration of closure voicing is considered. The articulatory variable considered for the larynx was the maximal downward movement between the start of the previous /a/ to the end of closure. For tongue root advancement and tongue body lowering, the absolute maximum position and absolute minimum position, respectively, were considered.
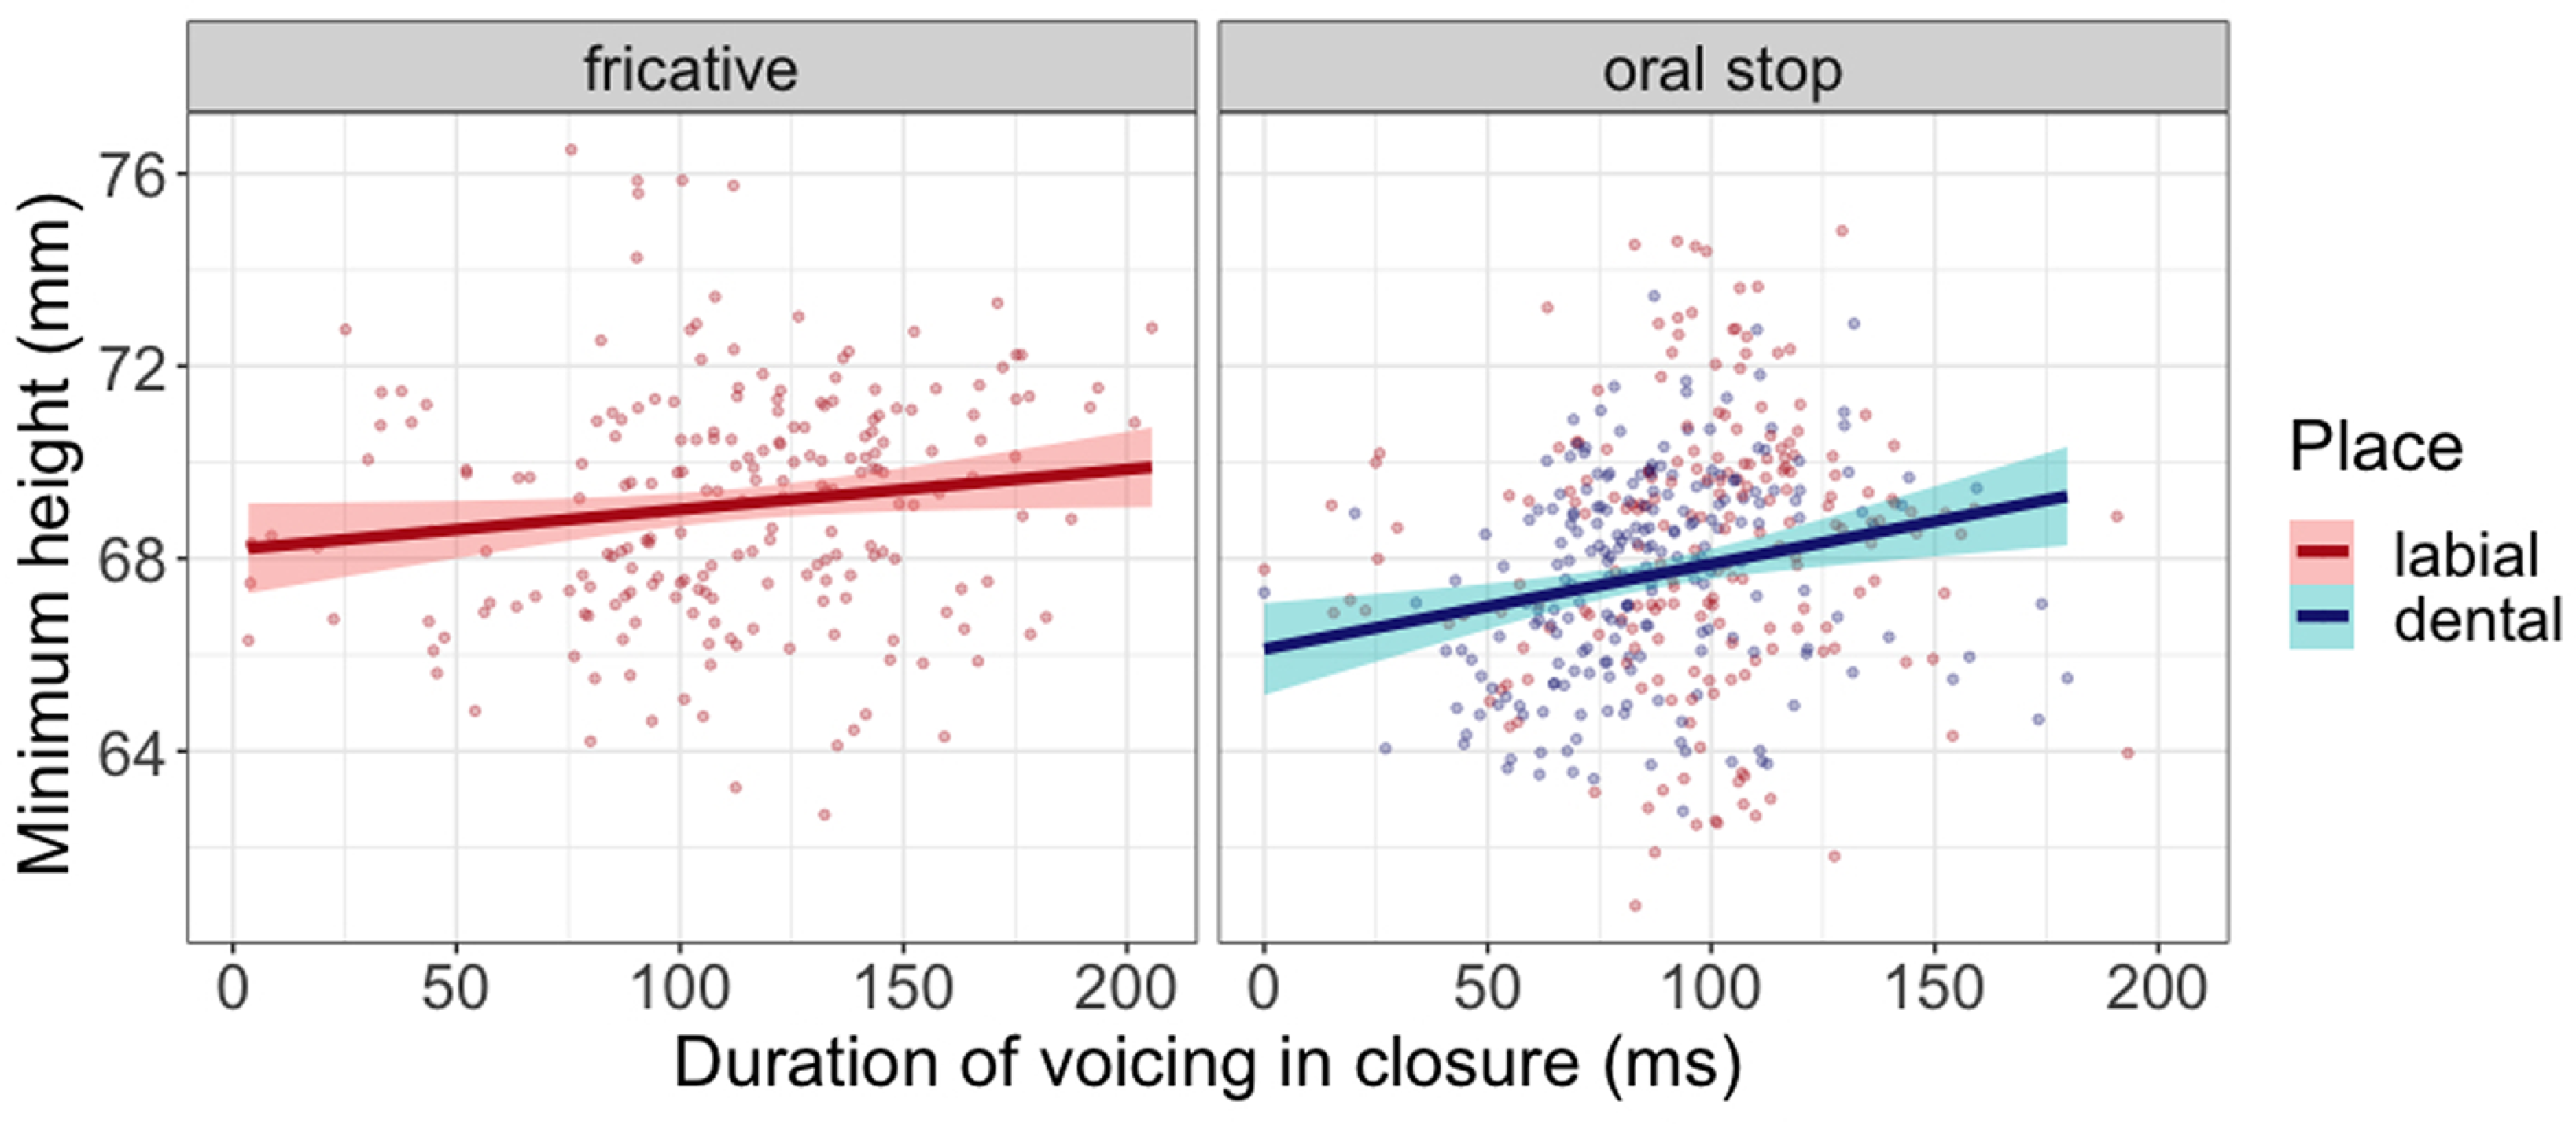
As shown in Figure 14, there is a strong correlation between minimum larynx height and duration of closure voicing. This is slightly more significant for /b/ (r = –.31, p < .001) than for /d/ (r = –.23, p < .001) and /v/ (r = –.21, p < .001).
Scatterplots and regression lines showing significant correlations between duration of vocal fold vibrations and maximum larynx lowering between the start of the previous vowel /a/ and the end of the closure or frication for voiced oral stops and fricatives. Each dot represents one token.

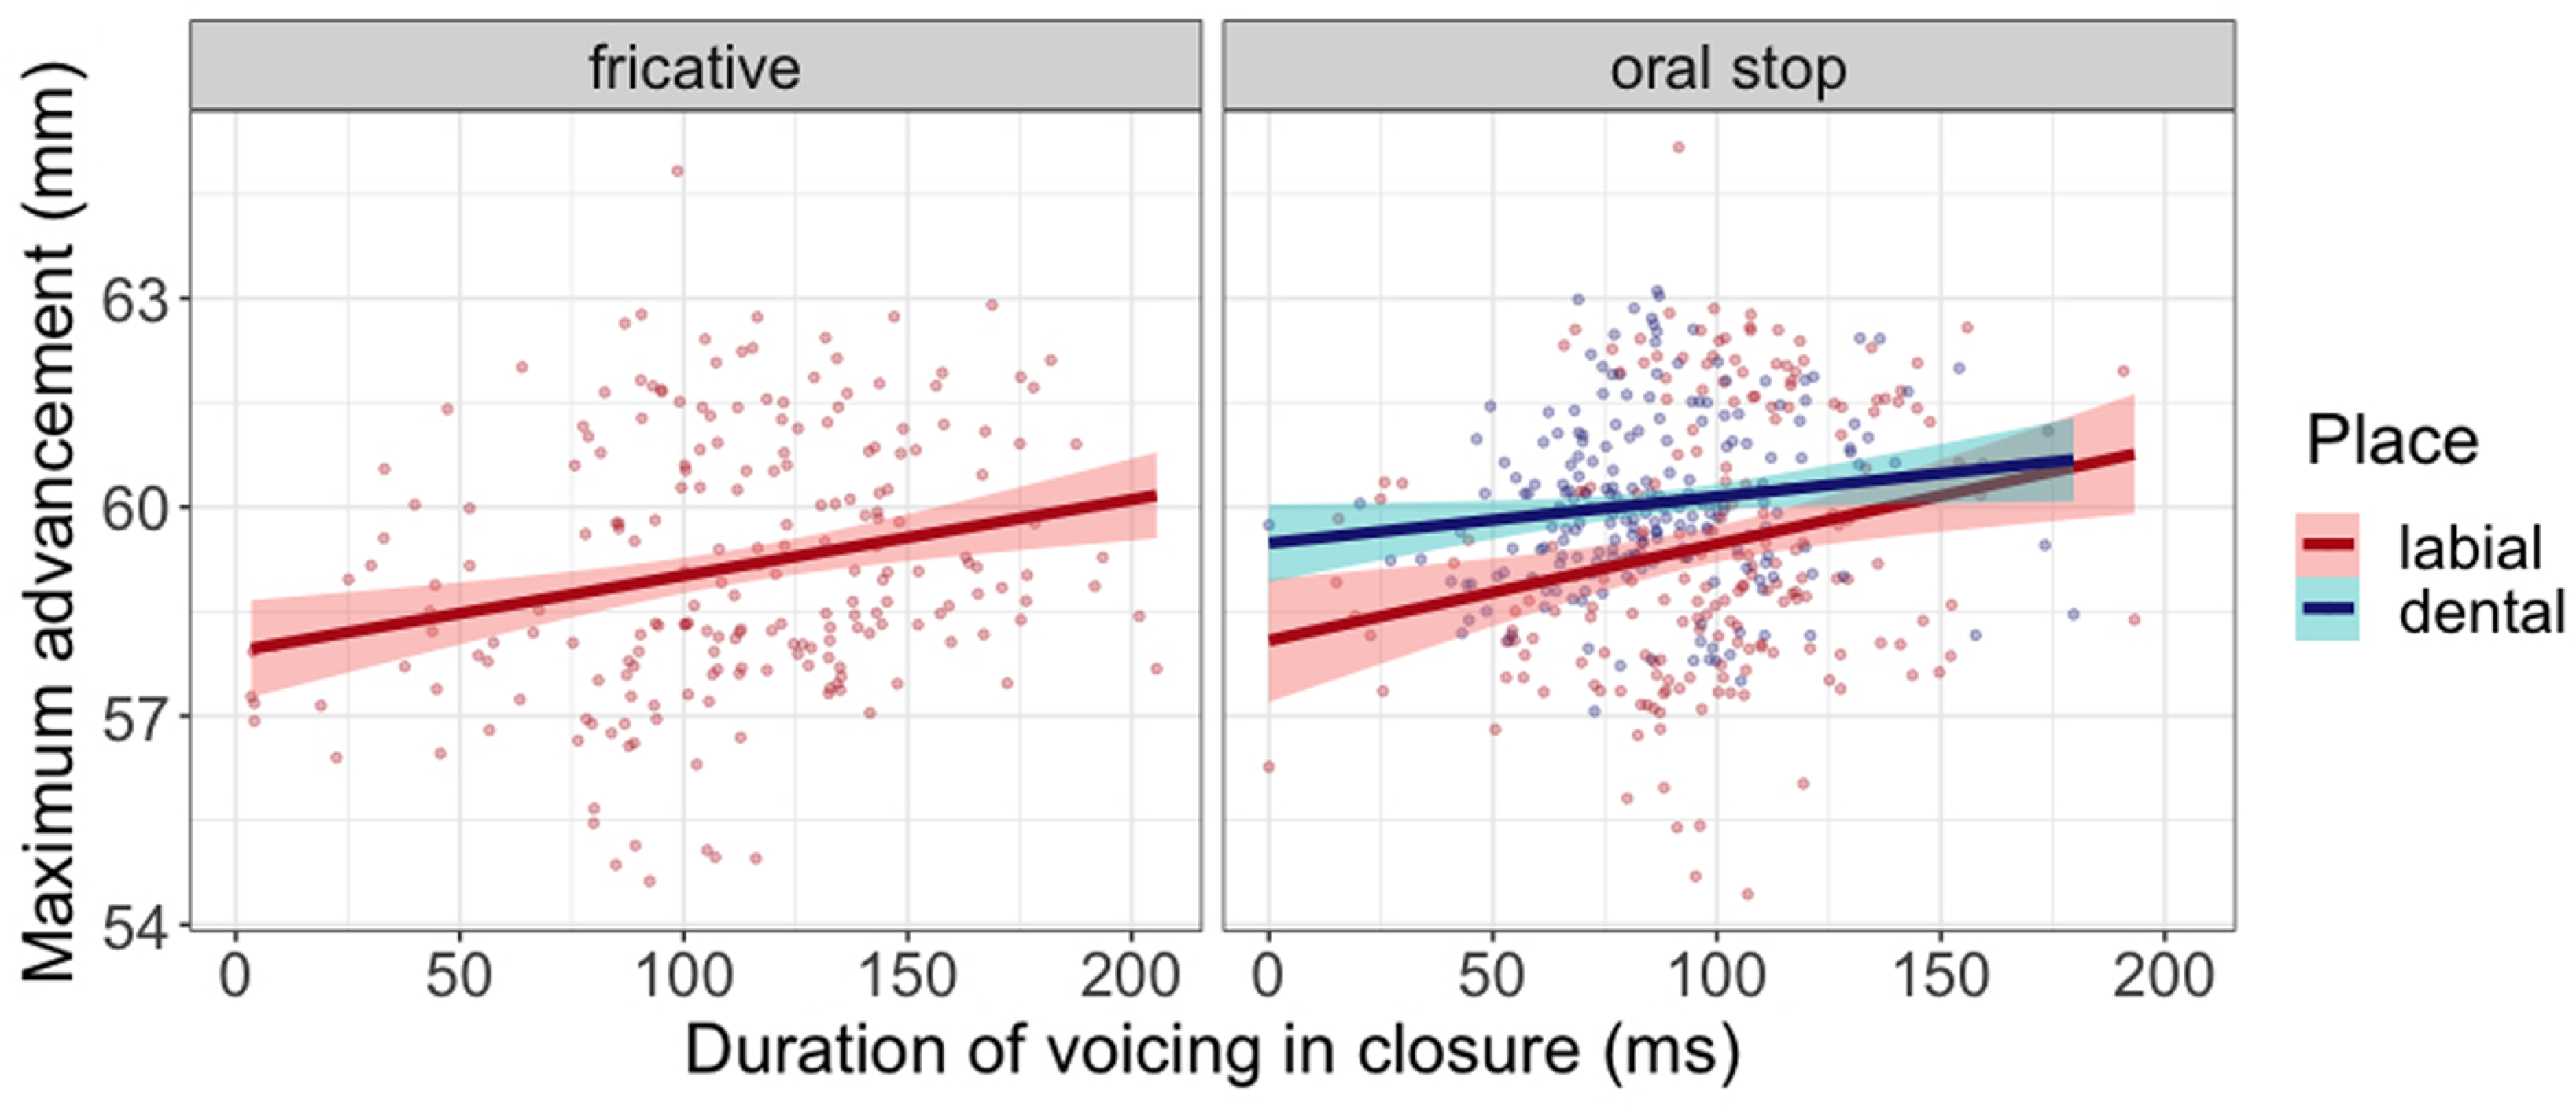
The effectiveness of tongue root advancement on the maintenance of voicing is less evident but remains significant for all three segments, as seen in Figure 15. It is most significant for /v/ (r = .24, p < .001), followed by /b/ (r = .21, p = .002) and finally /d/ (r = .14, p = .03).
Scatterplots and regression lines showing significant correlations between duration of vocal fold vibrations and maximum tongue root advancement during closure or frication of voiced oral stops and fricatives. Each dot represents one token.

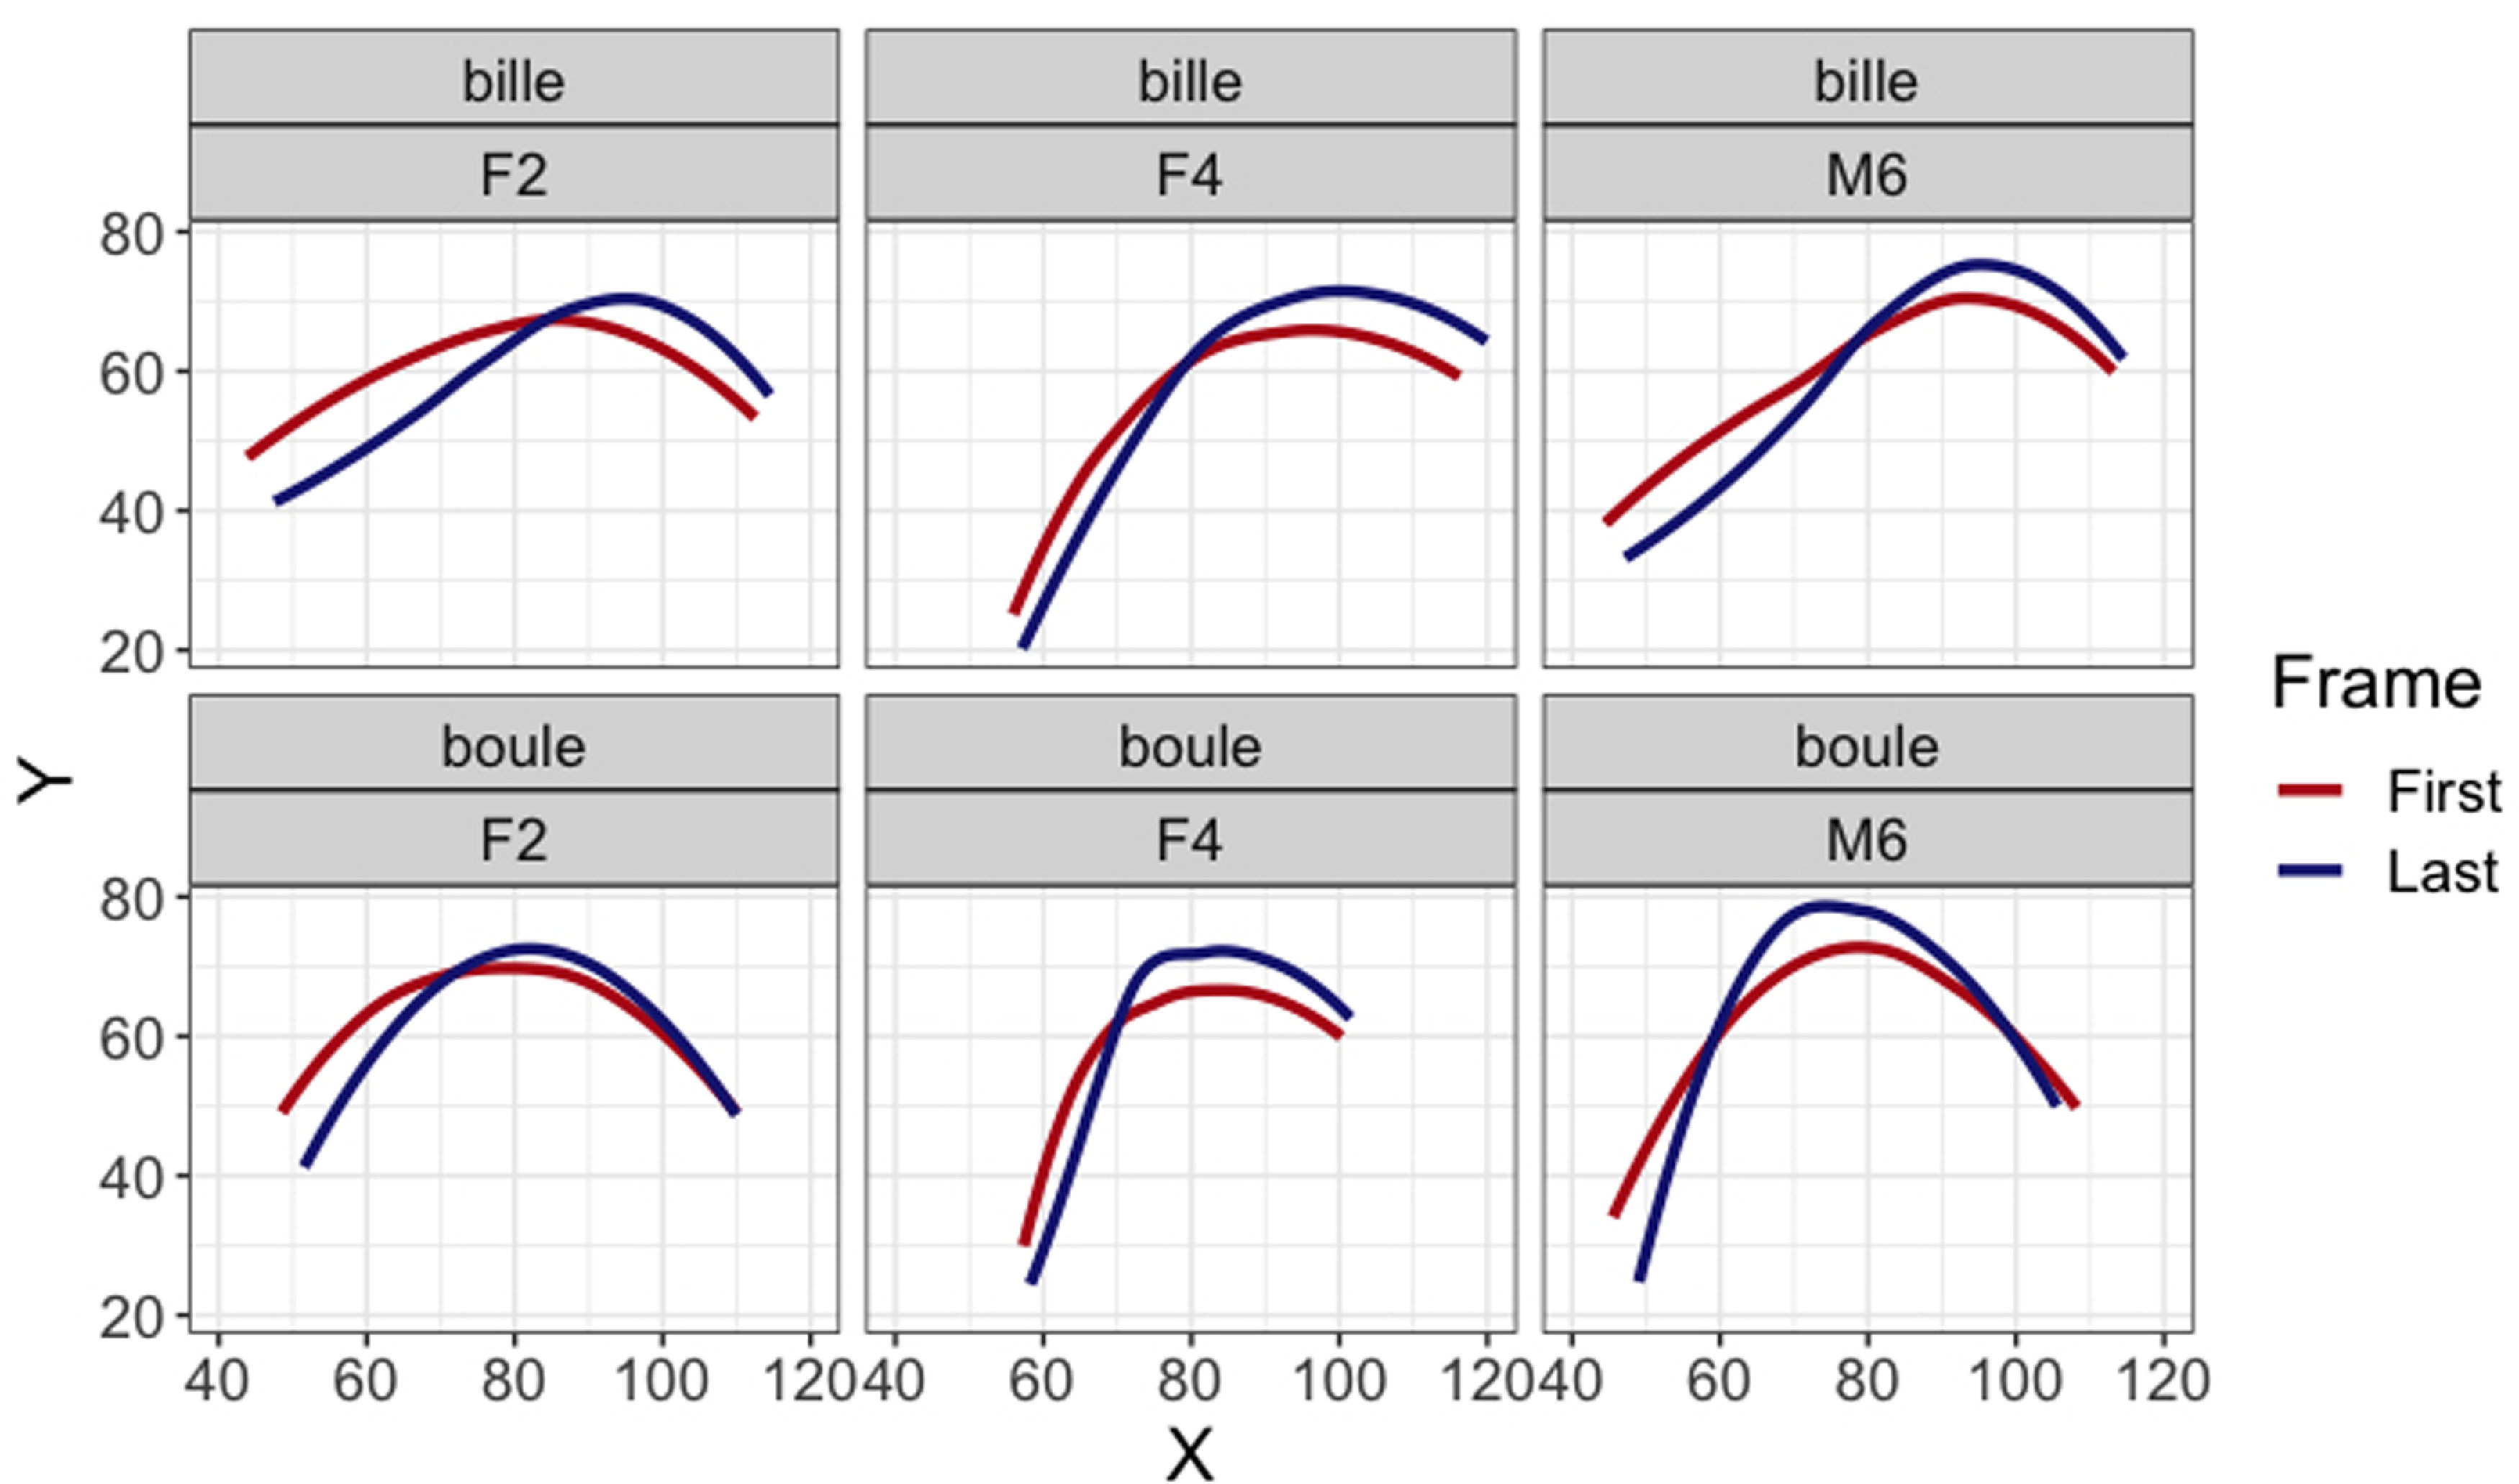
A correlation between tongue body lowering and voicing duration was observed although in the opposite direction than what would be expected (see Figure 16). In other words, a longer duration of voicing coincided with a higher tongue body. This effect, however, was only significant for /d/ (r = .22, p = .001) and /v/ (r = .14, p = .04), and no significant correlation was observed for /b/ (p = .3). The unexpected direction of the correlation is likely caused by a natural elevation of the tongue body when the tongue root is advanced (Perkell Reference Perkell1969; Kingston et al. Reference Kingston, Macmillan, Dickey, Thorburn and Bartels1997), especially in high vowel /i/ and /u/ as illustrated in Figure 17. This explanation is supported by the fact that the tongue is a muscular hydrostat. In other words, given that the tongue is uncompressible and maintains a constant volume, if, for example, its length increases, there will automatically be a compensatory decrease in height (Kier & Smith Reference Kier and Smith1985). This natural property of the tongue likely renders the simultaneous use of both tongue root advancement and tongue body lowering quite challenging – an observation that is borne out by the results presented throughout this section.
Scatterplots and regression lines showing significant correlations between duration of vocal fold vibrations and maximum tongue body lowering during closure or frication of voiced oral stops and fricatives. Each dot represents one token.

Example first and last frames of the closure in utterances of bille [bɪj] ‘marble’ and boule [bʊl] ‘ball’ for three representative speakers. The advancement of the tongue root naturally raises the tongue body.

4. Discussion
Overall, all three anti-AVC maneuvers, namely larynx lowering, tongue root advancement and tongue body lowering were observed in this study. These maneuvers were applied to both voiced stops and fricatives, although, as expected, their magnitude was more limited in fricatives. Some of these maneuvers were also observed in nasals, even though these sounds are not expected to require an anti-AVC strategy.
In the current study, some larynx lowering was observed in all target consonants, regardless of voicing status, indicating that its use cannot exclusively be ascribed to the need to maintain voicing. A certain amount of larynx lowering in nasals and even voiceless stops was already noted in Westbury (Reference Westbury1983). However, the present study revealed significantly more larynx lowering in voiced obstruents than in their voiceless counterparts, and this effect was greater in /b/ and /d/ than in /v/, confirming that this movement is probably meant to circumvent the AVC by increasing the size of the oral cavity. This coincides with Solé (Reference Solé2018)’s observation that there is implosivization in /b/, a gesture that was not, however, observed by Zhang & Goldstein (Reference Zhang and Goldstein2023).
Larynx movement followed a similar pattern for all segments: the larynx began descending immediately at the start of the vowel preceding the voiced obstruent and reached its minimum height near the middle of the closure. The larynx then slowly raised and returned to a position indistinguishable from that of the corresponding voiceless obstruent by the end of the following vowel. More lowering was observed consistently for all obstruents, both voiced and voiceless, when preceding the vowel /u/. The average degree of larynx lowering observed in the current study was 2.5 mm for /b/, 1.5 mm for /d/, 1.3 mm for /v/, and 0.7 mm for both voiceless consonants and nasals. This coincides well with Shosted et al. (Reference Shosted, Carignan and Rong2011)’s study, in which EMA data for one male American English speaker revealed that his /b/ was produced with a larynx 2–4 mm lower than his /p/. Westbury (Reference Westbury1983) also observed the highest degree of larynx lowering in the American English /b/.
Overall, tongue maneuvers exhibited less consistent patterns than larynx lowering, showed more interspeaker variation and were more restricted by the phonetic context. Nevertheless, the presence of tongue-related pharyngeal expansion confirms observations by Solé (Reference Solé2018) and Zhang & Goldstein (Reference Zhang and Goldstein2023). In the present study, the tongue root was significantly more fronted in voiced stops compared to voiceless stops, coinciding with previous research on similar stops in American English, Brazilian Portuguese and German (Ahn Reference Ahn2018a, Reference Ahn2018b). However, this effect of voicing on tongue root position did not extend to labial fricatives. This suggests that tongue root advancement may be a useful anti-AVC maneuver in stops but is less necessary in fricatives given their partial constriction that prevents the dramatic oral air pressure buildup found in stops. That tongue root advancement was observed for labial stops is surprising given previous research on labial stops in English and German primarily found tongue body lowering to be the most salient articulatory maneuver (Svirsky et al. Reference Svirsky, Stevens, Matthies, Manzella, Perkell and Wilhelms-Tricarico1997; Ahn Reference Ahn2018a). Compared to their voiceless counterparts, the tongue root was, on average, fronted by 0.5 mm for /b/ and /d/ and 0.1 mm for /v/. This is slightly less than what Westbury (Reference Westbury1983) observed in the speech of one American English male speaker.
All voiced obstruents had a significantly lower tongue body than their voiceless counterparts before the low vowel /a/, but this difference was dramatically reduced before high vowels, consistent with results in other languages such as American English and German (Ahn Reference Ahn2018a, Reference Ahn2018b). The necessity to raise the tongue in preparation for the following high vowel likely greatly limits the flexibility of tongue body position. Changes in tongue body height can be employed to circumvent the AVC, but their use is very restricted and most often observed with labials. As the oral constriction for labials is produced at the lips, the tongue body has more freedom to move and thus tongue body lowering is a more available maneuver. Compared to their voiceless counterparts, the tongue body was lowered approximately 1.5 mm for /b/, 0.8 mm for /d/ and 0.6 mm for /v/. Again, this is slightly less than what Westbury (Reference Westbury1983) and Svirsky et al. (Reference Svirsky, Stevens, Matthies, Manzella, Perkell and Wilhelms-Tricarico1997) observed in American English and Ewe.
The three maneuvers investigated here are associated with specific environments and are often employed simultaneously (although they do not have rigid synchronization patterns). The importance of larynx lowering is confirmed by its large cue weight and the strong correlation observed between degree of larynx lowering and duration of closure voicing. Lingual maneuvers are also employed but they are more speaker- and token-specific and are largely conditioned by vowel, place and manner of articulation.
Based on estimations carried out by Rothenberg (Reference Rothenberg1966) and Westbury (Reference Westbury1983), 2–3 mm of larynx lowering, as observed in the current study, would equate to a volume increase of approximately 0.6–0.9 mL. Given an average glottal airflow rate of 0.1 mL/ms (Rothenberg Reference Rothenberg1966; Holmberg, Hillman & Perkell Reference Holmberg, Hillman and Perkell1988; Patel et al. Reference Patel, Sundberg, Gill and Lã2022), this would result in approximately 6–9 ms of additional sustained transglottal airflow. Rothenberg (Reference Rothenberg1966) calculated that pharyngeal expansion due to tongue root advancement would result in an additional 1.2 mL per mm of forward movement. Tongue body lowering can be assumed to have an effect of similar magnitude, although as there is likely a complex relationship between the tongue root and tongue body, neither maneuver can be implemented completely independently (Westbury Reference Westbury1983). Given the observations in the current study of 0.5 mm of tongue root advancement and 1.5 mm of tongue body lowering in the voiced bilabial stop, the 2 mm expansion resulting from tongue maneuvers could increase the pharynx volume by 2.4 mL (2 x 1.2), resulting in about 24 additional milliseconds of vocal fold vibrations. Anti-AVC maneuvers based on lingual articulations should therefore be more efficient than larynx lowering, contrary to the findings of this study. The greater prevalence of larynx lowering is likely due to the limitations imposed by phonetic factors (place of articulation, preceding/following vowel) on the freedom of tongue position, rendering lingual anti-AVC maneuvers less readily available across contexts.
Overall, voiceless stops were produced with a slightly higher larynx than nasals, contrary to what would be expected if larynx lowering were just a gesture meant to facilitate obstruent voicing. English nasals, for instance, have been shown to be produced with a lower larynx than both voiced and voiceless stops (Riordan Reference Riordan1980; Westbury Reference Westbury1983; Zhang & Goldstein Reference Zhang and Goldstein2023). Such results could indicate that an active raising of the larynx is employed to inhibit voicing in voiceless obstruents (as proposed by Riordan Reference Riordan1980 and Zhang & Goldstein Reference Zhang and Goldstein2023). However, in the absence of oral pressure measurements, this question will be left for further studies.
Various additional anti-AVC strategies have been observed in French voiced obstruents, such as nasal leakage (Solé Reference Solé2018) and velum raising (Zhang & Goldstein Reference Zhang and Goldstein2023), but these were not measured in the current study. Moreover, strategies such as oral leakage, laxing of the vocal tract walls or cheek puffing (Westbury Reference Westbury1983) were also not measured. Therefore, it cannot be claimed that the three maneuvers reported here are the only mechanisms implemented to circumvent the AVC. Nevertheless, the consistent use of these maneuvers, particularly larynx lowering, offers convincing evidence that such gestures are indeed linked to voiced obstruents.
5 Conclusion
In the current study, ultrasound was employed to investigate articulatory maneuvers during the production of voiced and voiceless obstruents in Laurentian French. Results clearly showed active larynx lowering, tongue root advancement and tongue body lowering in voiced obstruents. Distinctions between voiced and voiceless counterparts were greater for stops than fricatives. The significant correlation between closure voicing duration and larynx height offers strong evidence that downward larynx movement is the most important maneuver to circumvent the AVC and prolong voicing. A more fronted tongue was also correlated with longer closure voicing duration, although to a lesser degree. Finally, tongue body lowering was the least-employed maneuver overall and no correlation between tongue height and closure voicing duration in the expected direction was observed. A more thorough investigation of additional obstruents and sonorants in Laurentian French would help paint a more complete picture of the roles of these strategies.
Acknowledgements
We would like to thank Tạ Thành Tấn for his help during the early stages of data collection, Yuxin Fan for his participation in experimental discussions and all our participants for their patience and willingness to engage in our study. We would also like to thank the audience of LSRL 2023 and LabPhon 19 for their feedback and questions on early versions of this work. Finally, we would like to thank two anonymous reviewers and Sonya Bird for their detailed and thoughtful comments and suggestions. This project was funded by a research grant from the Social Sciences and Humanities Research Council of Canada (435-2022-0047).
Appendix
Mixed linear regressions
Mixed linear regression on minimal normalized larynx height reached during the closure (Intercept: /ba/). Estimates are provided in normalized millimeters

Mixed linear regression on normalized time at which minimal larynx height was reached during the closure (Intercept /ba/). Estimates are provided in percentage of closure (beginning 0; end 100)

Mixed linear regression on maximal normalized horizontal tongue root position reached during the closure (Intercept: /ba/). Estimates are provided in normalized millimeters

Mixed linear regression on normalized horizontal tongue root position at midpoint of the closure (Intercept: /ba/). Estimates are provided in normalized millimeters

Mixed linear regression on minimal normalized tongue body height reached during the closure (Intercept: /ba/). Estimates are provided in normalized millimeters

Mixed linear regression on normalized tongue body height at midpoint of the closure (Intercept: /ba/). Estimates are provided in normalized millimeters


 Open access