


Collection of accurate dietary intake data is necessary to inform health and nutrition policies nationally and globally(Reference Scagliusi, Ferriolli and Lancha1,Reference Black, Victora and Walker2) . The weighed food record, in which an observer weighs all foods and beverages consumed by a specific individual for a certain period of time, is considered the gold standard for dietary data collection at the individual level in low-income countries(Reference Fontana, Higgins and Schuckers3,Reference Hamer, McNaughton and Bates4) . However, this method is expensive and impractical on a large scale, and the presence of an observer in the household may result in reactivity bias. The 24 h dietary recall method is a commonly used alternative, whereby the participant is asked to recall the types and quantities of foods and beverages consumed during the previous day(Reference Ferguson, Gadowsky and Huddle5). One of the main sources of error in 24 h recalls is inaccurate estimation of portion sizes consumed(Reference Cypel, Guenther and Petot6,Reference Lazarte, Encinas and Alegre7) because participants must remember and visualize the quantity of food they ate the previous day(Reference Nelson, Atkinson and Darbyshire8–Reference Nelson and Haraldsdottir10).
To help participants recall portion sizes, researchers have developed portion-size estimation aids (PSEA). In low-income countries, non-photographic PSEA include actual salted foods and proxies, such as dry rice, water or play dough, that the participant or research assistant uses to estimate portion size by measuring out the recalled quantity of food consumed, preferably into their own dish or using a standard set of household utensils (bowls, plates, cups and spoons), so that the amount can be weighed and, when necessary, subsequently converted to the gram equivalent of the portion consumed(Reference Gibson and Ferguson11). Pictorial PSEA include drawings or photographs of different quantities of the same foods and can be printed or digitally displayed. Foods in the images are often shown next to a standard-size object or on gridlines to help the participant visualize the scale of the portions if they are not shown life size(Reference Nelson and Haraldsdottir10).
Most published validation studies of PSEA to date have been carried out in high-income countries with high literacy rates(12). Only eight validation studies have been conducted with adults in low- and middle-income countries (LMIC)(Reference Lazarte, Encinas and Alegre7,Reference Huybregts, Roberfroid and Lachat13–Reference Nichelle, Almeida and Camey19) . Two of these used life-size printed photographs as PSEA(Reference Harris-Fry, Paudel and Karn14,Reference Venter, MacIntyre and Vorster18) , four used smaller-than-life-size printed photographs(Reference Huybregts, Roberfroid and Lachat13,Reference Amougou, Cohen and Mbala15–Reference Tueni, Mounayar and Birlouez-Aragon17) , and one used smaller-than-life-size printed photographs and digital photographs taken by the participants themselves as a memory aid(Reference Lazarte, Encinas and Alegre7). A recent study in Brazil, a middle-income country, compared digitally displayed and printed photographic PSEA in a small sample of adults(Reference Nichelle, Almeida and Camey19). To date, there are no studies with adults in low-income countries that assessed the validity of a digitally displayed photographic PSEA or that included more than one type of PSEA for comparison.
The primary aim of the present study was to validate a digitally displayed photographic PSEA (referred to henceforth as ‘digital PSEA’) against a weighed record of foods eaten during lunch and a snack offered ad libitum to women of reproductive age in Malawi. We included printed photographic and actual-food PSEA as other methods for comparison. Actual-food and proxy PSEA are commonly used methods in low-income settings(Reference Ferguson, Gadowsky and Huddle5,Reference Gibson and Ferguson11) . The secondary aims of the research were to compare the validity of the digital PSEA according to the geographic location (i.e. urban/rural) and level of education of the participants and to measure participants’ perceptions of the acceptability and ease of use of the different types of PSEA.
Methods
Study setting and participants
The present study was conducted in Chikwawa and Blantyre Districts in the southern region of Malawi. We recruited a total of 300 women, aged 18–45 years, from two rural subsistence farming villages in Chikwawa (n 150) and two neighbourhoods in Blantyre city (n 150). We chose this target group because women of reproductive age are typically the participants in studies and surveys assessing dietary intake in low-income countries. Level of education could have an impact on participants’ ability to use PSEA(Reference Huybregts, Roberfroid and Lachat13); therefore, we recruited women using quota sampling such that half in each location had 4 or fewer years (low or no literacy) and half had 5 or more years (moderate to high literacy) of formal education.
Development of portion-size estimation aids
We developed PSEA for five foods commonly consumed in Malawi and water. The foods were chosen to represent types of food that present different challenges for estimating portion sizes: amorphous foods (e.g. stew made of kidney beans, stew made of green leafy vegetables), single-unit foods (e.g. bananas), small pieces (e.g. roasted groundnuts) and shaped foods (e.g. patties of nsima or stiff maize porridge). Nsima is the staple food of Malawi and accounts for a large part of nutrient intakes. Foods like green leafy vegetables and beans also play an important role in dietary intakes in this setting. We created the images used in the present study based on a formative research phase, which has been described elsewhere(Reference Schnefke, Thakwalakwa and Muth20), and published guidance on the development of PSEA(Reference Nelson, Atkinson and Darbyshire8–Reference Nelson and Haraldsdottir10). Briefly, we tested feasibility, acceptability and accuracy of several visual characteristics of PSEA in print and digital format, including number of portion-size options, portion shapes v. photographs, 45° v. 90° photographic angle and simultaneous v. sequential presentation of images in relation to a weighed meal record. Based on the findings from the formative phase, we prepared PSEA for the present study’s validation phase comprising three portion sizes using photographic images taken at a 45° angle and presented simultaneously. The portions were based on the 25th, 50th and 75th percentiles of the weighed meal record of each food consumed during the formative phase of the study (n 96). We used these data because no other study or population-level intake data from non-pregnant women in Malawi were available.
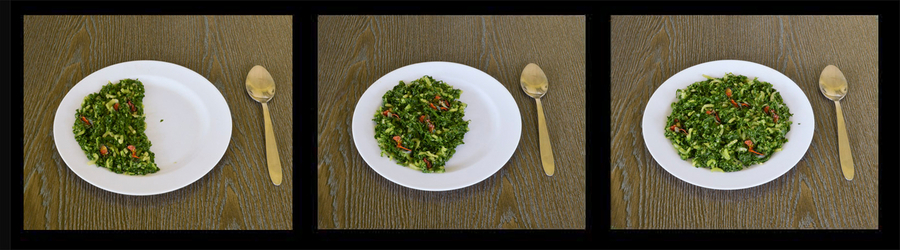
A photographer in Malawi took photographs of the foods, prepared using typical local preparation methods, on a standard-size white plate using a Nikon D5100 camera. A spoon was included in the photographs as a fiducial marker. The focal length of the camera lens was set at 29 mm, shutter speed to 0·10 s and aperture to f/20. The photographs were taken at a 45° angle using a tripod. The photographs were edited using Photoshop (version 16) to ensure that the plate was uniform in scale in all photographs and the colour balance was consistent. The photographs were cropped to 62 mm × 50 mm so they could fit in a single row on a Samsung Galaxy Tab A with a 10·1-inch display. We chose this size tablet because it is commonly used for field-based survey data collection, which would allow digital PSEA to be integrated easily into other data collection tools. We used the same images in the digital and print formats. The digital images were incorporated into the tablet-based data collection tool locked to the horizontal orientation (Fig. 1). The print images were printed on card stock, laminated and bound together into a food atlas the same size and orientation as the tablet screen.
Example of photos used in digital and print portion-size estimation aids
Data collection
Community leaders invited potentially eligible women to report to a central location in each community where research assistants described the study and screened them. Women were eligible if they were 18–45 years of age, had not participated in the formative phase of the study and lived within 2 km of the data collection site. Women who were interested and eligible participated in an informed consent procedure. Trained research assistants then invited the women to serve themselves groundnuts and eat them as a snack while research assistants collected data on their self-reported age, socio-economic status, household food insecurity and media exposure. The women then served themselves a lunch of nsima, kidney bean stew and green leafy vegetable stew, with each food item on a separate, standard-size plate, and water in a standard-size cup. Bananas were served after the meal as a dessert. The research assistants used a Salter Aquatronic digital kitchen scale (model 1020BKSS; accurate to ±0·1 g) to weigh each food and water before consumption and the leftovers afterward.
Research assistants asked the women to return on the following day to complete a meal recall and estimate quantities consumed using each of the PSEA – digitally displayed photographs, printed photographs and actual foods – in a balanced randomized order. Testing the actual-food PSEA involved asking the women to use the standard-size study plates and actual prepared foods to measure out the portions of the foods they had consumed the previous day. Research assistants then weighed each food item separately.
Data collection tools were developed in English and translated into Chichewa. Socio-economic questions were taken from the Malawi Demographic and Health Survey(21) and household hunger was measured using the Household Food Insecurity Access Scale(Reference Dietchler, Ballard and Swindale22). The questionnaire used during the recall included closed- and open-ended questions on portion-size selection and participant preferences and perceptions of ease of use of the three PSEA methods. The socio-economic and recall questionnaires were administered by trained research assistants, who entered responses on digital tablets and uploaded the data daily to a secure server.
Sample size
A sample size of 300 for the study was estimated using a two-tailed t test, a significance level of 0·0167 for carrying out multiple comparisons using Bonferroni adjustment, a power of 80 %, a Cohen’s effect size of 0·2 and assuming a 15 % dropout rate.
Interviews were recorded for forty participants, including ten per study site equally divided by education level. Participants were randomly selected within those categories. The purpose of recording a sub-sample was to obtain a more detailed record of the participants’ responses to open-ended questions than could be obtained from the interviewers’ typed tablet entries and to use the data for qualitative analysis. The qualitative sample size was chosen based on the assumption that twenty interviews per rural/urban and education subgroups would be sufficient to achieve data saturation(Reference Gibbs23). Previous research indicates that a minimum of six to twelve interviews are needed to attain saturation in qualitative research(Reference Guest, Bunce and Johnson24,Reference Baker and Edwards25) .
Data analysis
Descriptive statistics were calculated for participant characteristics and participants’ perceptions of the different PSEA. Average portion-size estimates were calculated in grams for each of the foods as recalled using each of the PSEA. Mean gram differences between the weighed meal record and estimated grams from each PSEA were compared using Wilcoxon matched-pair signed-rank tests. We calculated the percentage of participants whose portion-size estimations using each PSEA were within 20 % of the grams recorded from the weighed meal record(Reference Godwin, Chambers and Cleveland26) and compared these results between urban and rural locations, as well as low and high education levels, using McNemar’s χ 2 test. For the digital PSEA, we calculated the percentage of participants who selected the ‘correct’ photograph, defined as the photograph with the gram weight closest to the gram weight consumed. We used weighted Cohen’s kappa statistic (κ w) to assess the correlation between portion-size selections made by participants using digital and printed PSEA. κ w values from 0·61 to 0·80 indicate substantial agreement and values from 0·81 to 1 indicate almost perfect agreement(Reference Landis and Koch27). We used Bland–Altman and limits of agreement plots to assess agreement between each PSEA and the weighed meal record. When using the Bland–Altman method, measures are considered comparable if >95 % of data points fall within the 95 % limits of agreement. Differences between each pair of methods (e.g. digital PSEA and weighed meal record or actual-food PSEA and weighed meal record) were plotted against the mean of the two methods to examine the spread of differences between the methods and the presence of systematic bias(Reference Bland and Altman28). For each PSEA, we performed these calculations on all foods combined and on each food item separately. Outliers below the 1st and above the 99th percentiles for each individual food estimate were excluded (n 18).
We calculated mean energy and nutrient (protein, fat, carbohydrate, vitamin A, folate, iron and zinc) content based on the consumed and estimated portion sizes using a Malawi food composition table and compared mean energy and selected nutrient intakes with those estimated with different PSEA using Wilcoxon rank-sum tests. We chose to include these particular micronutrients because women often have insufficient intakes of them in Malawi and other low-income countries. All quantitative analyses were conducted using the statistical software package Stata version 15.0.
For qualitative data, the recorded interviews were transcribed verbatim in Chichewa and translated into English. The open-ended questions in the questionnaire were used to develop a set of deductive codes, and the data were coded in Dedoose 7.0.23 (SocioCultural Research Consultants LLC, Los Angeles, CA, USA) using thematic content analysis methods(Reference Gibbs23). We double-coded 10 % of the data and discussed and recoded discrepancies to ensure intercoder reliability. To facilitate analysis, we entered illustrative quotations from the coded data into a matrix with key themes in the columns and participant ID in the rows(Reference Miles and Huberman29). The matrix also included columns for urban/rural location and the participant’s education level to facilitate subgroup analysis.
Results
Participant characteristics
On average, women in the study were 29 years of age and had three children, and approximately 70 % were married (Table 1). Women in the low education group had a mean of 2·9 (sd 1·5) years of education and those in the high education group had 8·6 (sd 2·0) years. Participants’ socio-economic status was low. They owned, on average, two out of twelve household items and 40 % had moderate or severe household hunger. They had limited media access, including little access to or use of smartphones, televisions, computers, tablets and the Internet.
Participants’ characteristics and media access†: women (n 300) aged 18–45 years from two urban and two rural communities in southern Malawi, January–April 2018
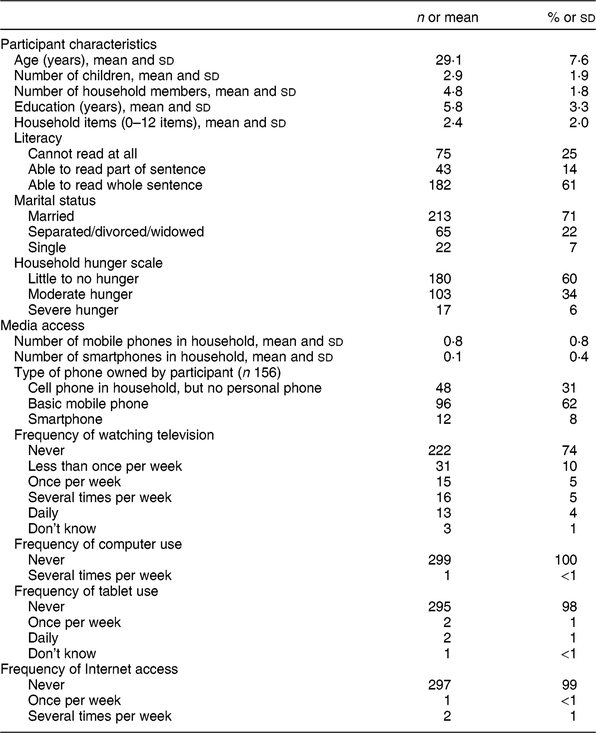
† Data are presented as n and % unless indicated otherwise.
Validation: accuracy
We obtained a total of 5349 responses out of 5400 possible portion-size estimations, because some participants chose not to eat certain foods. We found a high level of agreement (>91 % for all foods and water) in portion-size estimations using the digital and print PSEA. Values of κ w ranged from 0·78 to 0·93 for comparison of the portion sizes selected using digital and print PSEA for the different foods/water tested. Given the similarity in the findings for digital and print PSEA and our focus on the validity of the digitally displayed PSEA, we present only the digital and actual-food PSEA results henceforth.
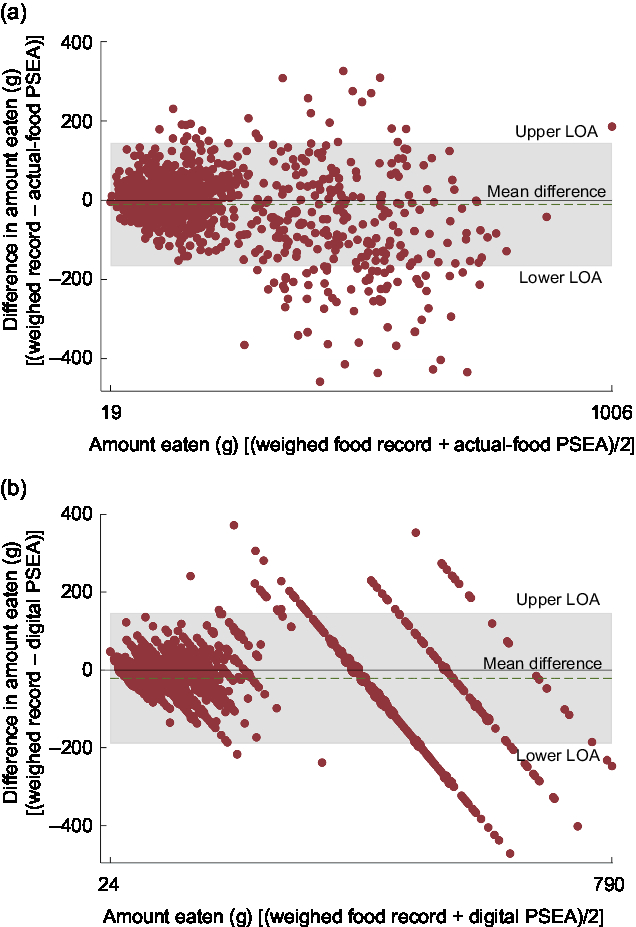
The fraction of observations for all foods combined that fell within the 95 % limits of agreement was 94 % for the actual-food PSEA (Fig. 2(a)) and 93 % for the digital PSEA (Fig. 2(b)). In Fig. 2(b), the three diagonal rows of data points on the right side of the plot represent nsima portion-size selections and indicate that most of the points outside the 95 % limits of agreement for digital PSEA were for nsima, while the clustered data points on the left side of the plot represent all other foods. Overall, the 95 % limits of agreement were wide for both methods: actual-food PSEA (−167 g, 145 g) and digital PSEA (−189 g, 147 g). For all foods combined, Bland–Altman analysis showed that both the actual-food and digital PSEA resulted in underestimates in relation to the weighed meal record. The mean difference between the weighed record and estimated portion sizes was −11 g for the actual-food PSEA and −21 g for the digital PSEA.
Bland–Altman plots assessing the performance of the portion-size estimation aids (PSEA) against a weighed meal record in women (n 300) aged 18–45 years from two urban and two rural communities in southern Malawi, January–April 2018. The difference between the weight estimated by the PSEA and the actual weight is plotted v. the mean of the weight obtained by the two methods for (a) actual-food PSEA and (b) digital PSEA, for all foods.  represents the mean difference and
  represents the limits of agreement (LOA) (actual-food PSEA, using prepared foods to estimate the quantity consumed on the previous day; digital PSEA, using digital photos displayed on a tablet to select a portion closest to the portion consumed on the previous day)
The mean difference in grams between the weighed meal record and actual-food and digital PSEA indicated that most foods, except for bananas (both methods) and groundnuts (actual-food PSEA), were significantly incorrectly estimated at the group level (Table 2). The largest incorrect estimations in grams were for nsima (−68·9 g actual-food PSEA and −59·1 g digital PSEA) and water (−68·2 g digital PSEA). On average, digital PSEA underestimated groundnuts, beans and water, while actual-food PSEA slightly overestimated these foods. The largest difference in estimated grams between PSEA methods was for water (difference of 79·6 g), which was underestimated with digital PSEA and overestimated using actual water to estimate the portion. The largest percentage differences between grams consumed and estimated (data not shown) were for groundnuts (−25 %) and water (−22 %) using digital PSEA.
Mean grams consumed by weighed meal record, and reported differences between portion-size estimation aids (PSEA) and weighed meal record, among women (n 300) aged 18–45 years from two urban and two rural communities in southern Malawi, January–April 2018
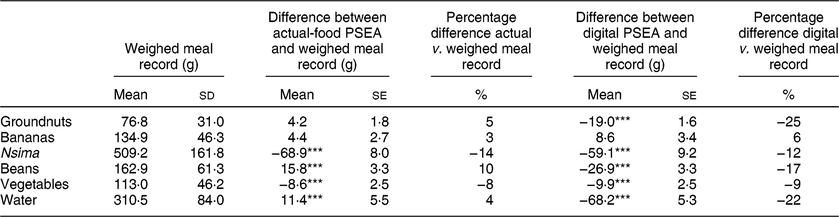
Actual-food PSEA, using prepared foods to estimate the quantity consumed on the previous day; digital PSEA, using digital photos displayed on a tablet to select a portion closest to the portion consumed on the previous day.
*** P < 0·001.
An assessment of portion-size estimation at the group level is shown in Table 3. The proportion of participants who estimated their portion sizes within 20 % of the measured gram weight using actual-food or digital PSEA varied by type of food and ranged from 30 to 56 %. Participants had a higher percentage of correct portion-size estimations (i.e. within 20 % of gram weight of the weighed portion of food consumed) using actual-food PSEA than digital PSEA for groundnuts (50 v. 30 %, P < 0·001), bananas (56 v. 42 %, P = 0·001) and water (56 v. 42 %, P < 0·001), but we found no differences for other foods. We also found no significant differences in the percentage of portion-size estimations correct (i.e. within 20 % of the gram weight of the weighed portion of food consumed) by level of education using actual-food or digital PSEA or by urban/rural location for digital PSEA; although for actual-food PSEA, fewer urban compared with rural participants estimated their portions of beans within 20 % of the measured gram weight (35 % urban v. 53 % rural, P = 0·001). In addition, we assessed the percentage of participants who selected the digital photographic portion size closest to the gram weight of the food consumed (see online supplementary material, Supplemental Table S1). We found that a higher percentage of portion-size selections for groundnuts, nsima, beans and vegetables were ‘correct’ using this definition compared with the percentage within 20 % of the measured gram weight.
Percentage of reported portion sizes of foods and beverages correct, underestimated and overestimated by actual-food and digital portion-size estimation aids (PSEA) compared with the weighed meal record among women (n 300) aged 18–45 years from two urban and two rural communities in southern Malawi, January–April 2018
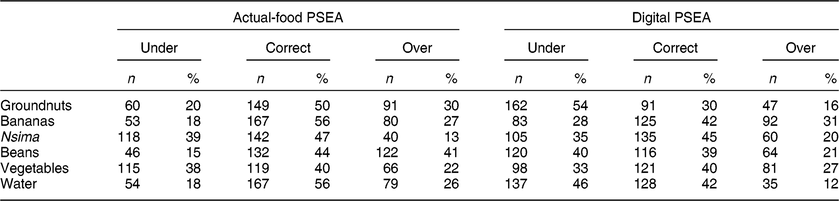
Actual-food PSEA, using prepared foods to estimate the quantity consumed on the previous day; digital PSEA, using digital photos displayed on a tablet to select a portion closest to the portion consumed on the previous day.
Under (underestimated), more than 20 % under the gram weight of the weighed food portion consumed; correct, within 20 % of the gram weight of the weighed portion of food consumed; over (overestimated), more than 20 % over the gram weight of the weighed food portion consumed(Reference Godwin, Chambers and Cleveland26).
When participants used actual-food PSEA to estimate their portion sizes, mean estimated nutrient intakes for the group were not significantly different from the weighed meal record for energy, protein, fat, carbohydrates, iron and zinc, but they did differ for vitamin A (−3·8 retinol activity equivalents, P < 0·001) and folate (+30·5 µg, P < 0·001; Table 4). For portion sizes estimated using digital PSEA, mean intakes for the group for all nutrients were significantly underestimated when compared with the weighed meal record.
Mean nutrient content of meals and snacks consumed, and differences between nutrients consumed and estimated using portion-size estimation aids (PSEA), among women (n 300) aged 18–45 years from two urban and two rural communities in southern Malawi, January–April 2018
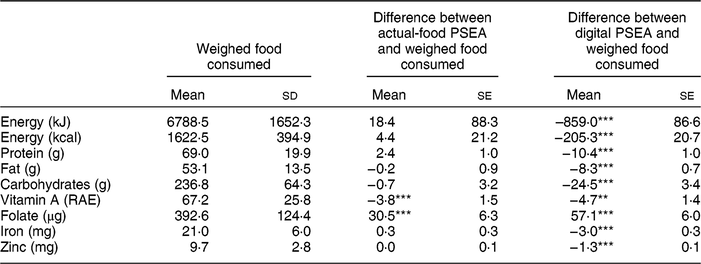
RAE, retinol activity equivalents.
Actual-food PSEA, using prepared foods to estimate the quantity consumed on the previous day; digital PSEA, using digital photos displayed on a tablet to select a portion closest to the portion consumed on the previous day.
**P < 0·01; ***P < 0·001.
Participants’ preferences and experiences using portion-size estimation aids
In our analysis of responses related to participants’ preferences and experiences using PSEA, we found no differences in responses by urban/rural location or level of education. Therefore, we present the results overall with quotations selected regardless of these factors.
Seventy-three per cent of participants preferred using actual food as a PSEA to estimate their portion sizes because they felt it captured the true amount of food they ate better than the digital and print photographic PSEA, and using actual foods was easy:
‘[I prefer measuring] because the ones on the paper and the phone [digital] do not show the exact amount the way the weighed one does.’ (Participant with lower education in urban area)
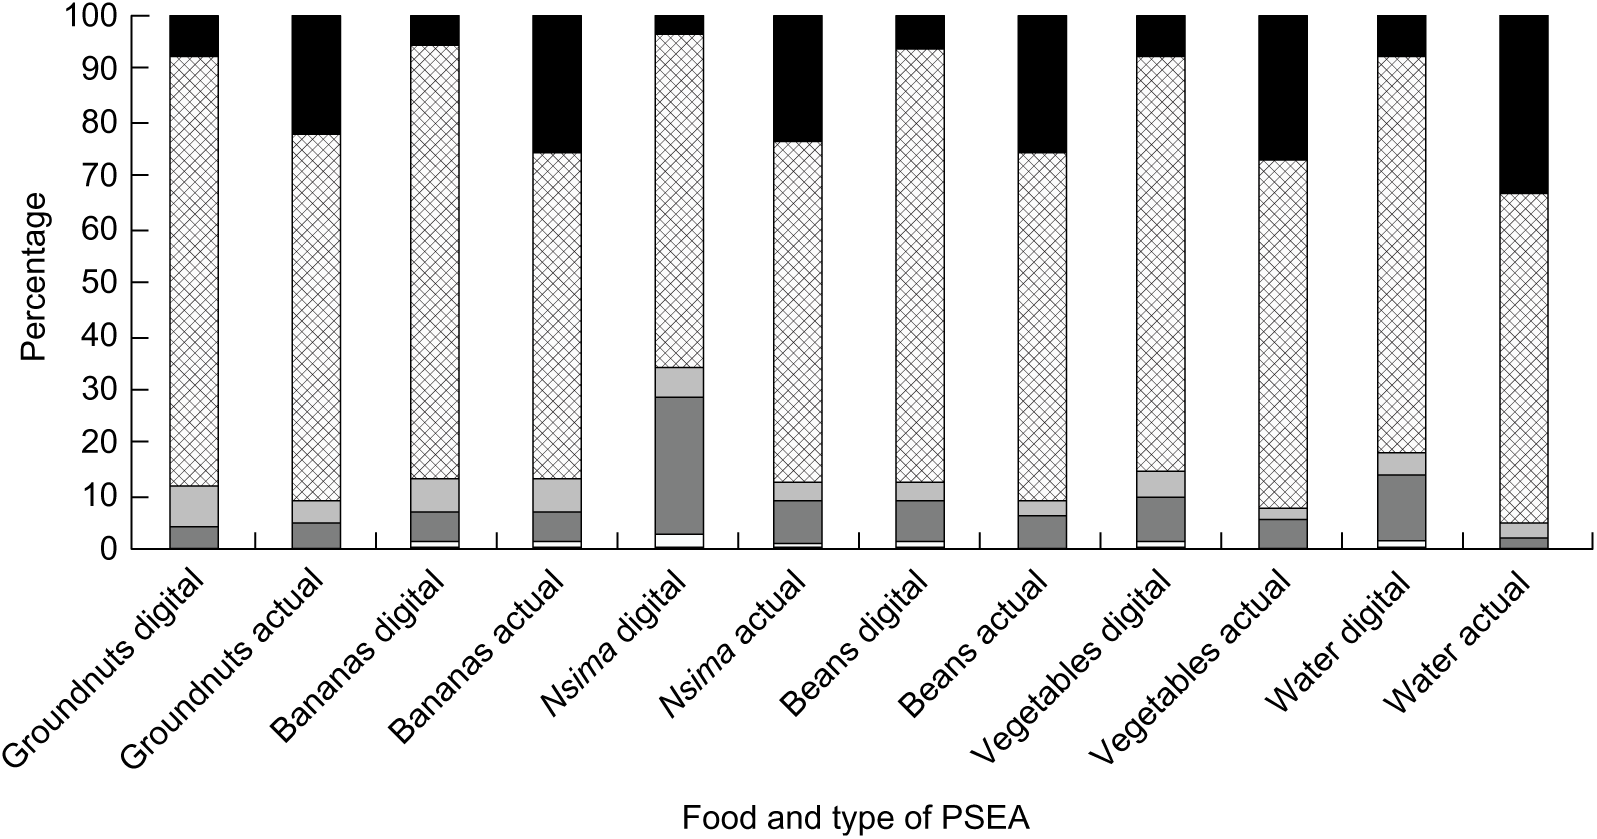
However, more than 80 % of participants said that both digital PSEA and actual foods were easy or very easy to use for most foods except nsima, for which 66 % of the participants said digital PSEA were easy or very easy (Fig. 3). Participants explained that they were the ones to serve themselves the food the previous day, so they knew how much they had served and eaten and thus could remember and put the same amount on the plate during the recall if they were using actual foods or could select the appropriate portion-size photograph:
‘I had no problem [using actual foods] because yesterday I measured a spoon [of groundnuts] and today I measured a spoon, the way I measured yesterday.’ (Participant with higher education in rural area)
‘It was very simple [to use the digital PSEA] because I remembered what and how much I ate yesterday. So, when I saw this, I could easily remember that this was the amount [of groundnuts] I ate yesterday.’ (Participant with lower education in rural area)
Perceptions of the ease of use ( , very difficult;
  , difficult;
  , neither difficult nor easy;
  , easy;
  , very easy) of digital and actual-food portion-size estimation aids (PSEA), by type of food, among women (n 300) aged 18–45 years from two urban and two rural communities in southern Malawi, January–April 2018 (actual-food PSEA, using prepared foods to estimate the quantity consumed on the previous day; digital PSEA, using digital photos displayed on a tablet to select a portion closest to the portion consumed on the previous day)
Some participants noted the digital images were not clear or were hard to see, particularly for water. Many participants also indicated during their meal recall that they conceptualized the amount of nsima they ate in terms of number of patties and that the patties in the images were not the same size they had eaten:
‘The [digital and printed PSEA] are almost the same, but I would say the tablet pictures [are] least [easy to use] because the tablet is delicate, and the pictures are not as clear, especially the pictures of water.’ (Participant with lower education in rural area)
Participant: ‘It was hard [to select a portion size of nsima from the photographs], because yesterday I had two nsima patties. One was big and the other small.’
Interviewer: ‘So, are you saying the amount of the one you ate cannot be seen here?’
Participant: ‘No, I can’t see the correct sizes.’ (Participant with lower education in urban area)
Across the different types of foods in the study, approximately 60 to 70 % of participants said that the portions in the pictures represented the amount of food they normally eat. The remainder tended to think that the portions in the pictures were too large for groundnuts (33 %), nsima (27 %), beans (25 %) and vegetables (22 %), and too small for water (25 %) and bananas (16 %). In the qualitative data, many participants said that the digital PSEA were easy to use because the portion sizes they consumed of different foods and water were represented in the portion-size image options:
‘It was easiest [to use the digital PSEA] because the portion of beans I ate yesterday, it’s the same as on the image.’ (Participant with lower education in rural area)
However, some participants had the opposite feeling. They said it was difficult to use the digital PSEA because they did not feel like the portion size they ate was represented among the options:
‘It was also difficult [to use the digital PSEA] because none of the pictures [of vegetables] represented the amount I ate yesterday. I ate less than what is on the pictures.’ (Participant with higher education in rural area)
Discussion
The present study was designed to assess the validity of digitally displayed photographic PSEA against a weighed meal record and compare findings with actual-food PSEA and printed photographic PSEA. Overall, Bland–Altman plots indicated similar levels of agreement between digital PSEA and actual-food PSEA in relation to the weighed meal record. However, analysis by type of food showed that participants consistently underestimated the measured grams consumed for all foods and consequently energy and selected nutrient intakes when using digital PSEA. Findings from digital and printed PSEA were highly correlated, indicating that the print PSEA also resulted in underestimated intakes. Use of actual-food PSEA led to a mix of under- and overestimates depending on the type of food, which balanced each other out so that mean energy and intakes of selected nutrients, except for folate and vitamin A, were similar to those from the weighed meal record. Like our findings for digital PSEA, underestimates of energy and nutrient intakes at the group level are common in LMIC when using recall methods with actual food, food drawings or food photographs as PSEA(Reference Alemayehu, Abebe and Gibson30–Reference Orcholski, Luke and Plange-Rhule34). Only two studies in LMIC have demonstrated that actual-food or photographic PSEA are accurate for estimating energy and nutrient intakes at the group level among adults(Reference Ferguson, Gadowsky and Huddle5,Reference Bouchoucha, Akrout and Bellali16) .
Although the goal of dietary recall is often an overall estimate of energy and nutrient intakes, it is important to understand where mistakes are made in portion-size estimation for specific foods and how that influences estimates of energy and nutrient intakes at both the group and individual levels. Several studies have reported variations in the accuracy of estimation of portion size by type of food(Reference Nelson, Atkinson and Darbyshire8,Reference Amougou, Cohen and Mbala15,Reference Venter, MacIntyre and Vorster18,Reference Subar, Crafts and Zimmerman35,Reference Hernandez, Wilder and Kuehn36) , as reported here. In the present study, however, we found that accuracy of portion-size estimation varied not only by type of food, but also by PSEA, with grams of nsima being underestimated using both digital and actual-food PSEA. This finding is important because nsima is the staple food in Malawi and often the main source of energy and nutrients in the diet(Reference Ferguson, Gadowsky and Huddle5,Reference Thakwalakwa, Kuusipalo and Maleta37) . Underestimation of nsima could be related to the flat slope phenomenon, whereby larger portions are underestimated and smaller portions are overestimated(Reference Nelson, Atkinson and Darbyshire8,Reference Nelson, Atkinson and Darbyshire9,Reference Huybregts, Roberfroid and Lachat13) . In the present study, the size of the nsima portions consumed was the largest among all foods offered. Inaccurate estimation of nsima portions using digital PSEA might be reduced by using photographs of individual nsima patties in different sizes (e.g. small, medium, large) and asking participants to report how many whole and partial patties they consumed, rather than showing whole and partial nsima patties representing the gram weight of specific centiles, as practised here. Other researchers have described difficulties with estimating solid foods if the shape or geometry in the photographs differs from what was habitually served(Reference Lillegaard, Overby and Andersen38,Reference Lucas, Niravong and Villeminot39) .
As reported by other researchers, in our study, single-unit foods, like bananas, were accurately estimated using both digital and actual-food PSEA. Across settings, amorphous foods tend to be difficult for participants to estimate correctly(Reference Huybregts, Roberfroid and Lachat13,Reference Amougou, Cohen and Mbala15,Reference Venter, MacIntyre and Vorster18,Reference Subar, Crafts and Zimmerman35) , as noted here where estimates were inconsistent. Participants tended to underestimate vegetable stew consumption using both digital and actual-food PSEA, whereas actual-food PSEA yielded overestimates and digital PSEA yielded underestimates for bean stew. We also found a difference in estimation of water using the two PSEA methods. Participants struggled to select an appropriate photograph among the digital PSEA options for water. We noted in the formative phase of the study that participants had trouble seeing the water in the digital and print PSEA(Reference Schnefke, Thakwalakwa and Muth20), so before the validation phase, we changed the photographs to make it easier to see the amount of water in the glass. However, measuring out the quantity of water consumed remained more accurate than selecting from a few photographic options.
We examined accuracy of portion-size estimation by urban/rural residence and level of education of participants and found almost no differences for any of the selected foods based on these characteristics. Given that our participants had very little exposure to media, regardless of urban/rural location, and equal numbers of participants were enrolled by high/low levels of education, it is not surprising that geographic location did not influence their ability to estimate portion sizes. Two other studies in sub-Saharan Africa assessed the influence of education on portion-size estimation; one found that a higher level of education was associated with more accurate estimation(Reference Huybregts, Roberfroid and Lachat13), while the other did not(Reference Venter, MacIntyre and Vorster18).
A large proportion of participants said they preferred using actual foods to estimate portion sizes because it was easy for them to measure out what they remembered putting on their plates. This finding suggests that the cognitive burden is lowest for the use of actual-food PSEA to estimate the size of portions eaten. Participants also said that all PSEA methods – digitally displayed photographs, printed photographs and actual foods – were easy to use. This finding is encouraging because, at times, researchers may need to use research methods that are more cognitively challenging (e.g. food photographs or proxies) because they are more practical logistically. Some participants felt that the photographs included images similar to the portion size they consumed, but most others perceived the portions in the photographs as larger than what they habitually ate, which may explain, in part, why participants underestimated portions when they used digital PSEA. This limitation of the photographs used here potentially could be addressed through further calibration of the portion sizes depicted in future photographic PSEA.
Our study had several other limitations. Our main goal was to validate digitally displayed photographic PSEA and determine if they differed in accuracy, participant preferences and ease of use compared with printed photographic PSEA and actual-food PSEA. To simplify this process, we tested only a small number of foods, selected to represent different food types: pieces, single item, solid and amorphous. A wider range of foods and liquids should be tested in future studies of digital PSEA in LMIC. We offered food to participants ad libitum, which seemed to lead to larger-than-usual portions and more leftovers, especially of nsima, beans and green leafy vegetables. This may explain, in part, why participants inaccurately estimated these foods because during the portion-size estimation process participants thought about the amount of food they served themselves rather than the amount they consumed. Social desirability bias has been cited as a factor in underestimation of energy intake in some settings for specific types of food(Reference Scagliusi, Ferriolli and Pfrimer33,Reference Orcholski, Luke and Plange-Rhule34,Reference Gibson, Charrondiere and Bell40) . In our study, portion sizes were underestimated across all foods, suggesting that it was not related to social desirability.
In the present study, use of digital PSEA resulted in underestimates of grams consumed and hence mean intakes of energy and nutrients, which might be explained by incorrect sizes of portions in the images, insufficient number of portion-size options or the size of the images. We calibrated the quantities of food in the portion-size photographs using data from the formative phase of the study, and portions consumed during the validation phase were in the same range. We offered only three portion-size options in our photographic PSEA because this number of portion sizes was preferred and slightly more accurate than five portion sizes or three with four virtual portion-size options in the formative part of the study(Reference Schnefke, Thakwalakwa and Muth20). There is little consistency in the literature for the optimal number of food photograph portion sizes(Reference Nelson, Atkinson and Darbyshire8), which ranges from one to eight and varies by type of food in some studies(Reference Nelson, Atkinson and Darbyshire9,Reference Nelson and Haraldsdottir10,Reference Huybregts, Roberfroid and Lachat13–Reference Venter, MacIntyre and Vorster18,Reference Orcholski, Luke and Plange-Rhule34,Reference Subar, Crafts and Zimmerman35,Reference Al Marzooqi, Burke and Al Ghazali41–Reference Robson and Livingstone43) . Photographic PSEA force participants to fit the quantity they ate into categories, even though the quantity consumed varies on a continuous scale. Presenting a specific number of portion-size options in digital PSEA could be circumvented by allowing the portion of food to be resized by the participant using her fingers to increase or decrease the portion size on a photograph of a standard-size plate. This would make portion sizes continuous and enable a better match with the quantity consumed. In terms of photograph size, we used relatively small photographs so that three portion sizes could be viewed simultaneously on a digital tablet. Although life-size photographs could reduce the mental effort involved in translating the size of the portion, it is not clear from existing research whether the size of the images is important in portion-size estimation. One study that compared smaller-than-life-size and life-size photographic PSEA found that life-size photographs were more accurate(Reference Thoradeniya, de Silva and Arambepola44), but several other studies in LMIC validated smaller-than-life-size photographic PSEA and also found them to yield accurate estimates of portion size(Reference Huybregts, Roberfroid and Lachat13,Reference Amougou, Cohen and Mbala15–Reference Tueni, Mounayar and Birlouez-Aragon17) .
Although our study had some limitations, digitally displayed photographic PSEA could be improved with further testing and the advantages and disadvantages of using different types of PSEA should be considered. Our findings showed that digitally displayed and print photographic PSEA were comparable, which is consistent with findings from two studies in the USA(Reference Subar, Crafts and Zimmerman35,Reference Hernandez, Wilder and Kuehn36) and one from Brazil(Reference Nichelle, Almeida and Camey19). This indicates that even in a setting with low media exposure, digitally displayed PSEA can be used interchangeably with printed food atlases of the same dimensions, provided the accuracy of the PSEA is adequate. Digital PSEA would simplify data collection as part of a tablet- or phone-based digital dietary intake data collection application and eliminate the need for enumerators to carry large, heavy photographic atlases in the field. It is possible, however, that a tablet loaded with thousands of photographs needed for 24 h recalls may compromise the speed of data collection and performance of the tablet. If digital PSEA are used for 24 h recalls, it would be necessary to ask participants about the thickness or density of some foods, especially porridges or gruels which vary substantially in thickness, to ensure appropriate conversion to gram amounts and nutrient intakes. Actual-food PSEA are more challenging logistically than photographic PSEA because only a limited number can be prepared and carried by enumerators along with measuring utensils and scales. Proxies, such as dry rice, water or play dough, may be good alternatives to actual-food PSEA because they are easy to visualize and are more practical than actual foods for large-scale surveys.
Conclusions
PSEA in dietary data collection remain essential because collecting weighed food records on a large scale is not feasible. We found that our digitally displayed PSEA did not have sufficient accuracy to be scaled up in Malawi in their current form. This finding is consistent with recent results from Brazil showing that digital PSEA displayed on a tablet led to more underestimation than other methods(Reference Nichelle, Almeida and Camey19). However, given that these are the first studies in LMIC to validate digitally displayed photographic PSEA, we expect that future studies could refine digital PSEA to improve accuracy for estimating usual individual intakes or intake of specific nutrients and for measuring differences in intakes between groups. We recommend that future research in LMIC: (i) validates digital PSEA using food prepared and eaten by participants in their homes to simulate real portions; (ii) tests photographs of a wider variety of foods; (iii) assesses the optimal number of portion-size photographs to use or uses resizable portions to improve accuracy of portion-size estimation; and (iv) compares different size images. Improved methods for portion-size estimation in LMIC are needed to help facilitate large-scale surveys of dietary intake and diet quality and to evaluate the effectiveness of interventions to improve dietary intake.
Acknowledgements
Acknowledgements: The authors would like to thank Fletcher Gong’a, John Theilgard and Tayo Jolaoso for their assistance with taking and editing the food and water photographs and Steve Litavecz for programming the images/tablets. They appreciate assistance with qualitative coding and analysis from Denview Magalasi and Austrida Gondwe. Cathleen Prata and Zachary Gersten of the International Dietary Data Expansion (INDDEX) Project gave input on the initial design. Rosalind Gibson provided advice on the design and comments on a draft of the manuscript. This work could not have been completed without the excellent Malawian data collectors and community members who prepared the food. Financial support: This work was supported by RTI International. RTI International funders had no role in the design, analysis or writing of this article. Conflict of interest: The authors have no conflicts of interest to declare. Authorship: V.L.F., M.K.M., J.C. and B.R. designed the study. C.H.S., B.C., W.B., C.T. and J.C.P. also contributed to the study design. C.T. oversaw data collection. H.S. and V.L.F. conducted quantitative data analysis, and C.H.S. conducted qualitative data analysis. V.L.F. prepared the first draft of the manuscript. All authors read and approved the final manuscript. Ethics of human subject participation: This study was conducted according to the guidelines laid down in the Declaration of Helsinki and all procedures involving human subjects were approved by the College of Medicine Research Ethics Committee at the University of Malawi and RTI International’s Institutional Review Board. Written informed consent was obtained from all participants.
Supplementary material
To view supplementary material for this article, please visit https://doi.org/10.1017/S1368980019002428.



