


1. Introduction
The viscous fingering (VF) instability is a fundamental transport phenomenon manifested by a high mobile fluid penetration in a porous medium saturated with less mobile fluid, and this unfavourable viscosity contrast results in the emergence of complex fingering patterns at the fluid–fluid interface. While, for favourable viscosity contrast, the flow remains stable. The VF instability has immense applications ranging from hydrology (Dentz et al. Reference Dentz, Le Borgne, Englert and Bijeljic2011), oil recovery (Muggeridge et al. Reference Muggeridge, Cockin, Webb, Frampton, Collins, Moulds and Salino2014; Jiménez-Martínez et al. Reference Jiménez-Martínez, Porter, Hyman, Carey and Viswanathan2016), diagnosis of cancer (Streitberger et al. Reference Streitberger, Lilaj, Schrank, Braun, Hoffmann, Reiss-Zimmermann, Käs and Sack2020), chromatography separation (Catchpoole et al. Reference Catchpoole, Shalliker, Dennis and Guiochon2006; Shalliker et al. Reference Shalliker, Catchpoole, Dennis and Guiochon2007; Rana et al. Reference Rana, Pramanik, Martin, De Wit and Mishra2019), CO $_2$ sequestration (Huppert & Neufeld Reference Huppert and Neufeld2014; Chen et al. Reference Chen, Fang, Wu and Hu2017; Babaei & Islam Reference Babaei and Islam2018; Fakhari et al. Reference Fakhari, Li, Bolster and Christensen2018), biology (Mainster Reference Mainster1990; Matsushita & Fujikawa Reference Matsushita and Fujikawa1990; Dong et al. Reference Dong, Wheeler, Ma and Su2020; Delannoy et al. Reference Delannoy, Tellier, Cholet, Leroy, Treizebré and Soncin2022), polymer flooding (Corredor, Maini & Husein Reference Corredor, Maini and Husein2018) and lubrication in microfluidics (Cubaud & Mason Reference Cubaud and Mason2012).
In past decades, several experiments have been conducted to understand the instability. These experiments are performed in the Hele-Shaw cell by injecting less viscous fluid while the cell is filled with a higher viscosity fluid. The Hele-Shaw cell consists of two transparent glass plates separated by a minuscule gap. The flow through it is mathematically analogous to a porous medium (Paterson Reference Paterson1985; Chen Reference Chen1987). To mimic this instability numerically, we model the miscible flow in porous media by utilizing mass conservation and momentum conservation through the convection–diffusion equation and Darcy's law, respectively. In such flows, the velocity profile plays a pivotal role in determining the stability of the system. Depending on the velocity profile, mainly two types of displacements are studied in the literature: radial and rectilinear in porous media flows. In the rectilinear flow, the interface between fluids remains flat, and fluids displace each other with uniform velocity. In the case of radial flow, the interfacial area increases, and velocity decreases with the radial distance from the source. On account of the spatially dependent velocity profile, the perturbation at the fluid–fluid interface evolves algebraically with time (Tan & Homsy Reference Tan and Homsy1987). The algebraic growth of perturbations is significantly slower than the exponential growth of perturbations that takes place in the case of rectilinear flow. It attributes a minimum viscosity ratio between fluids to trigger the instability of radial flow. The transition in the stability of flow has been demonstrated numerically and empirically by Sharma et al. (Reference Sharma, Nand, Pramanik, Chen and Mishra2020). They determine a phase plane between Péclet number and viscosity ratio classified into stable and unstable zones and present the initial radius of the circular region as a control parameter. For decreasing initial radius, the stable region in the phase plane between Péclet number and viscosity ratio is contracted but never vanishes. It persists even when the point source is considered (Tan & Homsy Reference Tan and Homsy1987; Bischofberger, Ramachandran & Nagel Reference Bischofberger, Ramachandran and Nagel2014; Videbæk & Nagel Reference Videbæk and Nagel2019).
A chemical reaction can induce an unfavourable disparity in viscosity, leading to the destabilization of flows within porous media by altering the viscosity distribution and impacting flow stability (Sharma et al. Reference Sharma, Pramanik, Chen and Mishra2019). For instance, it is observed that the chemical reaction  $A + B \rightarrow C$ can always destabilize the flow more by generating a product having viscosity contrast with the reactants while the viscosity profile depends on reactants and product concentration exponentially (Hejazi et al. Reference Hejazi, Trevelyan, Azaiez and De Wit2010; De Wit Reference De Wit2020). Such reactive displacements are modelled in several transport phenomena to optimize the efficiency of the process, such as alkaline flooding in enhanced oil recovery processes (Mayer et al. Reference Mayer, Berg, Carmichael and Weinbrandt1983), contamination degradation (Richardson & Nicklow Reference Richardson and Nicklow2002), CO $_2$ sequestration (Liu et al. Reference Liu, Lu, Zhu and Xiao2011) to cite a few. Depending on the application, chemical reactions in porous media flow may be beneficial. It reduces the interfacial tension and enhances the miscibility that leads to improved mixing and more recovery in transport processes such as chemical flooding in enhanced oil recovery (Mayer et al. Reference Mayer, Berg, Carmichael and Weinbrandt1983; Pei et al. Reference Pei, Zhang, Ge, Tang and Zheng2012), frontal polymerization (Pojman Reference Pojman2010) and chemical treatment of oil-bearing formations (De Wit & Homsy Reference De Wit and Homsy1999). In recent studies, it has been observed that the oil recovery by calcium hydroxide (Ca(OH) $_2$) flooding is more than that of water flooding for heterogeneous porous media (Mahardika et al. Reference Mahardika, She, Shori, Patmonoaji, Matsushita, Suekane and Nagatsu2021). Moreover, the chemical reaction can generate bubbles (Wang et al. Reference Wang, Zhang, Patmonoaji, Hu, Matsushita, Suekane and Nagatsu2021) that prevent the mixing in porous media (Wang et al. Reference Wang, Zhang, Patmonoaji, Hu, Matsushita, Suekane and Nagatsu2021). The VF produced by chemical reactions can be employed to improve mixing in a variety of fields at all scales, from macroscales to microscales, and the nonlinear interaction between a chemical reaction and VF instability leads to enhanced mixing between fluids. It has been analysed by several researchers in both ways, experimentally (Nagatsu & Ueda Reference Nagatsu and Ueda2001, Reference Nagatsu and Ueda2003; Nagatsu et al. Reference Nagatsu, Matsuda, Kato and Tada2007, Reference Nagatsu, Kondo, Kato and Tada2009; Riolfo et al. Reference Riolfo, Nagatsu, Iwata, Maes, Trevelyan and De Wit2012) and numerically (Gérard & De Wit Reference Gérard and De Wit2009; Hejazi et al. Reference Hejazi, Trevelyan, Azaiez and De Wit2010; Sharma et al. Reference Sharma, Pramanik, Chen and Mishra2019).
For radial flow, there exists a minimum viscosity contrast to trigger the instability in non-reactive displacements where both the flows are non-reactive in nature (Tan & Homsy Reference Tan and Homsy1987; Sharma et al. Reference Sharma, Nand, Pramanik, Chen and Mishra2020), the same holds for the reactive displacement (Sharma et al. Reference Sharma, Pramanik, Chen and Mishra2019). It is reported that when reactants are isoviscous, instability is induced when the product and reactants have sufficient viscosity contrast. This has been observed both through numerical investigations through nonlinear simulations (NLS) (Sharma et al. Reference Sharma, Pramanik, Chen and Mishra2019; Verma, Sharma & Mishra Reference Verma, Sharma and Mishra2022) and linear stability analysis (LSA) (Sharma, Chen & Mishra Reference Sharma, Chen and Mishra2023). However, they do not consider the reactive displacements with viscosity mismatched reactants. The critical viscosity contrast reduces when we increase the reaction rate. Further, Kim et al. (Reference Kim, Pramanik, Sharma and Mishra2021) have performed a LSA for radial flow utilizing spectral analysis restricted to the asymptotic limit of  $Dat \rightarrow \infty$, $Pe \rightarrow \infty$. Here $Da$,
$Da$,  $Pe$ and $t$ represent the reaction rate, Péclet number and time, respectively. They obtained critical viscosity ratios that trigger instability and establish a power law trend between $Pe$ and the critical viscosity ratios. Further, they show that the LSA results are supported by NLS. To the best of our knowledge, no theoretical analysis of the radial reactive displacement, when reactants have some viscosity contrast for a finite range of $Pe$ and $Da$, has been documented in the literature. However, the prevalent focus in most experimental studies is exploring reactive VF caused by reactants with mismatched viscosities (Nagatsu & Ueda Reference Nagatsu and Ueda2001; Nagatsu et al. Reference Nagatsu, Matsuda, Kato and Tada2007, Reference Nagatsu, Kondo, Kato and Tada2009; Riolfo et al. Reference Riolfo, Nagatsu, Iwata, Maes, Trevelyan and De Wit2012). In addition, instabilities often occur even in the absence of a reaction, leading to an analysis of how chemical reactions impact viscous fingering (Hejazi et al. Reference Hejazi, Trevelyan, Azaiez and De Wit2010; De Wit Reference De Wit2020; Verma, Sharma & Mishra Reference Verma, Sharma and Mishra2023). Moreover, it is observed that when the reactants have an unfavourable viscosity contrast, the reaction can promote or stabilize viscous fingering for rectilinear flow, indicating that the chemical control of local fingering dynamics can be precisely tuned by selecting the appropriate chemical species with a particular difference in concentrations (Hejazi et al. Reference Hejazi, Trevelyan, Azaiez and De Wit2010; De Wit Reference De Wit2020). However, for radial flow, the literature lacks the numerical investigation of reactive displacement with viscosity mismatched reactants. Thus, it would be intriguing to investigate how the reaction rate influences the transition in stability for radial flow when the reactants have viscosity contrast.
In this study, we fill the above-mentioned literature gap and present a thorough examination that considers the effects of viscosity mismatch between the reactants and product for a range of  $Da$ and $Pe$ by performing NLS and LSA. In this work, we introduce an LSA to understand the dynamics of the reactive displacements in transient time. However, we encounter an unsteady base state as a solution of advection–diffusion–reaction equations (Brau, Schuszter & De Wit Reference Brau, Schuszter and De Wit2017). The time-dependent nature of this base state renders the stability matrix non-orthogonal. However, it has been observed that if the stability matrix is not orthogonal, the early-time dynamics may not be captured (Trefethen et al. Reference Trefethen, Trefethen, Reddy and Driscoll1993; Schmid Reference Schmid2007). Thus, modal analysis is not applied and we opt for non-modal analysis. For optimal initial conditions, we give initial perturbation around the interface instead of the entire $r$ domain, as it is known as the fastest-growing perturbation (Ben, Demekhin & Chang Reference Ben, Demekhin and Chang2002; Hota, Pramanik & Mishra Reference Hota, Pramanik and Mishra2015b). Later, we validate all LSA predictions through NLS. Both LSA and NLS predict the critical parameters for instability decay with Péclet number and reaction rate. Our research is novel in the sense that we explore the stability of reactive displacement based on the viscosity profile for radial flow. We determine whether the modifications resulting from a chemical reaction impact the flow stability compared with the equivalent non-reactive situation. We determine a phase plane between the viscosity ratios between the reactants and product, divided by critical viscosity ratios for instability and find that the reactions can affect system stability up to a certain extent. For instance, there exists a stable region in the phase plane for even $Da \rightarrow \infty$. Moreover, we report the type of reactive displacement where the stability of the flow is unaffected by $Da$. For such types of reactions, the product viscosity is the same as the viscosity of the displacing reactant, and it is represented as a $Da$-independent region in the $(R_b,R_c)$ phase plane.
The organization of the paper is as follows. In § 2 we give the mathematical formulation. We present the base state equations and solve them numerically. Further, we derive the linearized perturbed equations and perform LSA in § 3. Lastly, we perform NLS and compare LSA results with NLS results in § 4 and address the applications of the work in § 5.
2. Mathematical formulation
A miscible displacement is considered in a homogeneous and isotropic porous medium where one fluid,  $A$, is injected from the source with flow rate $Q$ per unit depth, displacing the other fluid, $B$, radially. Both fluids are Newtonian, neutrally buoyant and reactive. A second-order irreversible chemical reaction
 \begin{equation} A+B\rightarrow C, \end{equation}
occurs in the system whenever both fluids come into contact (figure 1). The system of flow equations consists of the continuity equation and Darcy's law, describing mass conservation and momentum conservation. Further, we couple the flow equations with reaction–convection–diffusion equations that interpret the transport of fluid species. In experiments, the dye concentration is added in displacing fluid initially. The dye is non-reactive in nature with the other fluids and has no impact on the viscosity profile. Further, we consider a convection–diffusion equation describing the transport of dye concentration,  $z$. The equations can be represented in non-dimensionalized form as follows (Hejazi et al. Reference Hejazi, Trevelyan, Azaiez and De Wit2010; Sharma et al. Reference Sharma, Pramanik, Chen and Mishra2019):
 $$\begin{gather} \boldsymbol{\nabla} \boldsymbol{\cdot} \boldsymbol{u}=0, \end{gather}$$
 $$\begin{gather}\boldsymbol{\nabla} p={-}\mu \boldsymbol{u}, \end{gather}$$
 $$\begin{gather}\frac{\partial a}{\partial t}+\boldsymbol{u} \boldsymbol{\cdot} \boldsymbol{\nabla} a=\frac{1}{Pe}\nabla^2a - Da \, ab, \end{gather}$$
 $$\begin{gather}\frac{\partial b}{\partial t}+\boldsymbol{u} \boldsymbol{\cdot} \boldsymbol{\nabla} b=\frac{1}{Pe}\nabla^2b - Da \, ab , \end{gather}$$
 $$\begin{gather}\frac{\partial c}{\partial t}+\boldsymbol{u} \boldsymbol{\cdot} \boldsymbol{\nabla} c=\frac{1}{Pe}\nabla^2c + Da \, ab , \end{gather}$$
 $$\begin{gather}\frac{\partial z}{\partial t}+\boldsymbol{u} \boldsymbol{\cdot} \boldsymbol{\nabla} z=\frac{1}{Pe}\nabla^2z. \end{gather}$$
We employ  $t_f$ and $\sqrt {Qt_f}$ as the characteristic scales to non-dimensionalize time and length, respectively, where $t_f$ is the time up to which we inject fluid $A$. Further, we non-dimensionalize Darcy velocity $\boldsymbol {u}$, viscosity $\mu$, pressure $p$ and fluid concentrations $(a,b,c)$ by $\sqrt {Q/t_f}$, $\mu _A$, $Q \mu_A / \kappa$ and $a_0$, respectively. Here, the concentration and viscosity of reactant $A$ are represented by $a_0$ and $\mu _A$, respectively, while the porous medium's permeability is represented by $\kappa$. It is important to note that $t_f$ represents the duration up to which we want to conduct the study. We discuss the limitations of other choices of length scale in Appendix A. The viscosity profile depends on product and reactant concentrations exponentially as follows (Hejazi et al. Reference Hejazi, Trevelyan, Azaiez and De Wit2010):
 \begin{equation} \mu=\exp(R_bb+R_cc), \quad R_b=\ln(\mu_B / \mu_A ), \quad R_c=\ln(\mu_C / \mu_A ). \end{equation}
We categorize the reactions based on the viscosity of the reactants and product. Every  $(R_b, R_c)$ value characterizes the viscosity contrast between $B$ and $A$; and $C$ and $A$, respectively. Thus, on changing $(R_b, R_c)$, we change the reactants and product and hence explore a new reaction. The initial conditions associated with (2.2) are
 $$\begin{gather} (a, b, c, z)(\boldsymbol{x}, t=0)=\begin{cases} (1,0,0,1), & 0< \vert \boldsymbol{x}\vert < r_0,\\ (0,1,0,0), & \text{otherwise}, \end{cases} \end{gather}$$
 $$\begin{gather}\boldsymbol{u} (\boldsymbol{x},t=0)=\frac{\boldsymbol{x}}{2 {\rm \pi}\vert \boldsymbol{x}\vert^2}, \end{gather}$$
where  $\boldsymbol {x}=(x,y)$ and $r_0$ is the initial radius of the circular region filled with fluid $A$. Here we encounter four non-dimensionalized parameters $R_b$, $R_c$, Damköhler number $Da$ and Péclet number $Pe$. All the fluids are assumed to have the same diffusion coefficient, $D$, and $Pe=Q/D$, which shows a comparison of fluid transport due to convection and diffusion, while $Da$ is obtained as a ratio of convective time scale and reactive time scale, i.e. $Da=t_f/(1/k a_0)$. Here $k$ is the reaction rate constant.
Schematic of the  $A+B \rightarrow C$ chemical reaction in a radial source flow. The green-coloured shaded region, bounded by dashed lines, is where both the reactants come into contact and product $C$ is generated. We denote this region as a reaction zone. The outside and inside regions of the reaction zone are occupied by reactants $B$ and $A$, respectively.

3. Linear stability analysis
3.1. Linearized perturbed equations
In order to carry out a stability analysis, we need to formulate linearized perturbed equations for perturbed fluid concentrations and perturbed velocity around base state flow. We define  $(A_0,B_0,C_0, Z_0)$, base state concentrations of $A$,
$A$,  $B$,
$B$,  $C$ and dye as the solution of (2.2c)–(2.2f) in the absence of any viscosity contrast, i.e. $R_b=R_c=0$ (Sharma et al. Reference Sharma, Chen and Mishra2023). The base state solution is axisymmetric, and it is just a function of radius, $r$ only. However, the solutions cannot be attained analytically (Brau et al. Reference Brau, Schuszter and De Wit2017). Even, for (2.2f), provided the initial condition in (2.4), an analytical solution is unattainable (Sharma et al. Reference Sharma, Nand, Pramanik, Chen and Mishra2020). Thus, we compute the base state concentrations numerically using the method of lines discussed in § 3.2. The density plots of the obtained base state concentrations for $Da=100$, $Pe=3000$ are shown in figure 2. For stable displacement, the initial velocity provided by the source does not get perturbed and remains the same as in (2.4b). It is considered as the base state velocity, $\boldsymbol {u}_0$. Further, we notice that the base state velocity profile is characterized by a singularity at the origin. To address this singularity, we introduce a Gaussian source of core, $\sigma$ as proposed by Chen et al. (Reference Chen, Huang, Gadêlha and Miranda2008) and Sharma et al. (Reference Sharma, Pramanik, Chen and Mishra2019), resulting in the velocity profile as follows:
 \begin{equation} \boldsymbol{u}_b= \left(x\frac{1-{\rm e}^{-(x^2+y^2)/\sigma^2}}{2 {\rm \pi}(x^2+y^2)},y\frac{1-{\rm e}^{-(x^2+y^2)/\sigma^2}}{2 {\rm \pi}(x^2+y^2)}\right), \quad \sigma \leq r_0. \end{equation}
Base state profile of (a) reactant  $A$, (b) reactant $B$, (c) product $C$ and (d) dye concentrations for $Da=100$, $Pe=3000$ at final time $t=1$.

Introducing a Gaussian source term can better mimic physical phenomena that smooth out velocity profiles in real-world flows. However, if we were to consider  $r_0 \rightarrow 0$, we would be unable to utilize this modification due to the constraint $\sigma \leq r_0$. Therefore, we confine our analysis to cases where $r_0>0$ and refrain from investigating how the parameter $r_0$ influences the stability of the reactive flow. Nonetheless, the impact of $r_0$ on stability has previously been examined in the context of non-reactive flow by Sharma et al. (Reference Sharma, Nand, Pramanik, Chen and Mishra2020). The decrease in $r_0$ results in reducing the critical viscosity contrast for instability and this $r_0$ works as a control parameter for instability, which holds for reactive fluids.
After having the base state solution, we perturb the base state profile as follows:
 \begin{equation} (a,b,c,z,\boldsymbol{u})=(A_0,B_0,C_0,Z_0,\boldsymbol{u}_0) +(a',b',c',z',\boldsymbol{u}'). \end{equation}
For the ease of the calculations, we redefine the governing equation in stream function–vorticity formulations. We define the stream function as  $\psi = \psi _0+\psi '$, $\psi _0$ is base state stream function and $\psi '$ is the perturbed component of stream function that is defined as $\boldsymbol {u}'=(-{\partial \psi '}/{\partial y}, {\partial \psi ' }/{\partial x} )$. Thus, the linearized perturbed system of equations can be written in stream function–vorticity formulation as in Sharma et al. (Reference Sharma, Chen and Mishra2023):
 $$\begin{gather} \nabla^2 \psi'={-}\omega, \end{gather}$$
 $$\begin{gather}\omega=R_c ( \boldsymbol{u}_0 \times \boldsymbol{\nabla} c' + \boldsymbol{u}' \times \boldsymbol{\nabla} C_0 ) \boldsymbol{\cdot} \boldsymbol{\hat{k}}+ R_b ( \boldsymbol{u}_0 \times \boldsymbol{\nabla} b' + \boldsymbol{u}' \times \boldsymbol{\nabla} B_0 ) \boldsymbol{\cdot} \boldsymbol{\hat{k}}, \end{gather}$$
 $$\begin{gather}\frac{\partial a'}{\partial t}+ \boldsymbol{u}_0\boldsymbol{\cdot} \boldsymbol{\nabla} a'+\boldsymbol{u}'\boldsymbol{\cdot} \boldsymbol{\nabla} A_0= \frac{1}{Pe} \nabla^2 a' -Da (B_0a'+A_0b'), \end{gather}$$
 $$\begin{gather}\frac{\partial b'}{\partial t}+ \boldsymbol{u}_0\boldsymbol{\cdot} \boldsymbol{\nabla} b'+\boldsymbol{u}'\boldsymbol{\cdot} \boldsymbol{\nabla} B_0= \frac{1}{Pe} \nabla^2 b' -Da (B_0a'+A_0b'), \end{gather}$$
 $$\begin{gather}\frac{\partial c'}{\partial t}+ \boldsymbol{u}_0 \boldsymbol{\cdot} \boldsymbol{\nabla} c'+\boldsymbol{u}' \boldsymbol{\cdot} \boldsymbol{\nabla} C_0= \frac{1}{Pe} \nabla^2 c' +Da (B_0a'+A_0b'), \end{gather}$$
 $$\begin{gather}\frac{\partial z'}{\partial t}+ \boldsymbol{u}_0 \boldsymbol{\cdot} \boldsymbol{\nabla} z'+\boldsymbol{u}' \boldsymbol{\cdot} \boldsymbol{\nabla} Z_0= \frac{1}{Pe} \nabla^2 z'. \end{gather}$$
Here  $\omega$ is the $\hat {\boldsymbol {k}}$ component of vorticity. At the boundary, we apply a far-field boundary condition, i.e. $\psi '=0$, and
 \begin{equation} \left.\begin{array}{c@{}} \dfrac{\partial }{\partial x}(a',b',c',z')=\boldsymbol{0} \quad \text{at } x={\pm} L/2,\\ \dfrac{\partial }{\partial y}(a',b',c',z')=\boldsymbol{0} \quad \text{at } y={\pm} L/2 . \end{array}\right\} \end{equation}
Here  $\varOmega = [-L/2, L/2]\times [-L/2, L/2]$ is our computational domain that is discretized into $n_x \times n_y$ grid points.
3.2. Initial value calculations
The time-dependent base state results in a non-orthogonal stability matrix, thus modal analysis may not capture the early-time dynamics appropriately. Therefore, we have employed non-modal analysis, solving initial value problems for numerical LSA to study the transient behaviour of the reactive displacements. This LSA serves as an efficient method to explore time-dependent linear systems in miscible VF (Tan & Homsy Reference Tan and Homsy1986; Matar & Troian Reference Matar and Troian1999; Daniel, Tilton & Riaz Reference Daniel, Tilton and Riaz2013; Tilton, Daniel & Riaz Reference Tilton, Daniel and Riaz2013; Hota et al. Reference Hota, Pramanik and Mishra2015b; Pramanik, Hota & Mishra Reference Pramanik, Hota and Mishra2015). We solve the system of equations with the method of lines. We use the third-order Runge–Kutta method to solve the initial value problem for both base state and linearized perturbed equations (3.3c)–(3.3f), resulting from the discretization of spatial derivatives. Further, a highly efficient pseudospectral method hybridized by the compact finite difference method of sixth order is used to solve the Poisson equation (3.3a). In our study, we do not incorporate wavelength selection, while our LSA method does allow for wavelength selection (Hota et al. Reference Hota, Pramanik and Mishra2015b). Further, we perturb the base state around the interface where fastest growing perturbations are known to be localized (Ben et al. Reference Ben, Demekhin and Chang2002; Hota et al. Reference Hota, Pramanik and Mishra2015b). We perturb the base state using a consistent set of random initial conditions around the interface as follows:
 \begin{equation}
(a', b', c',z')(\boldsymbol{x}, t=0)=10^{{-}3}\begin{cases}
(\sin(2 {\rm \pi}m_1), \sin (2 {\rm \pi}m_2),0,\sin(2 {\rm \pi}m_1) ),
& \vert \boldsymbol{x} \vert =r_0,\\ (0,0,0,0), &
\text{otherwise}. \end{cases}
\end{equation}
\begin{equation}
(a', b', c',z')(\boldsymbol{x}, t=0)=10^{{-}3}\begin{cases}
(\sin(2 {\rm \pi}m_1), \sin (2 {\rm \pi}m_2),0,\sin(2 {\rm \pi}m_1) ),
& \vert \boldsymbol{x} \vert =r_0,\\ (0,0,0,0), &
\text{otherwise}. \end{cases}
\end{equation}
Here,  $m_1$ and $m_2$ are random functions generating numbers between 0 and 1 which are kept consistent across all simulations. The remaining parameters used in LSA are mentioned in table 1. The numerical method is explained in detail in Sharma et al. (Reference Sharma, Chen and Mishra2023) and the references therein.
Table showing the parameters used in the LSA.

Since the base state is unsteady, we seek to analyse the temporal evolution of perturbations in the comparison of the base state (Shen Reference Shen1961; Hota, Pramanik & Mishra Reference Hota, Pramanik and Mishra2015a). To do the same, we utilize the energy method approach and determine the normalized energy function with respect to the base state profile for both the perturbed concentration,  $\alpha '$ and $\boldsymbol {u}'$:
 \begin{equation} R(t)=\frac{\displaystyle \int_{\varOmega}\alpha'^2 +\boldsymbol{u}'^2 \, {\rm d} \varOmega}{\displaystyle \int_{\varOmega}\alpha_0^2 +\boldsymbol{u}_b^2 \, {\rm d} \varOmega}, \end{equation}
where  $\alpha '$ is the dummy variable for perturbed concentrations and $\alpha ' \in \{a', b',c',z'\}$.
Further, we compute energy amplification,  $E(t)$ by normalizing energy $R(t)$ with $R(t=0)$ (Matar & Troian Reference Matar and Troian1999) as
 \begin{equation} E(t)=\frac{R(t)}{R(t=0)}. \end{equation}
 Since we perturb the concentrations of the reactants initially, we use either  $a'$ or $b'$ in the energy calculation in (3.5). In addition, it is reported that the temporal evolution of $\ln (E(t))$ is similar; hence, it makes no difference whether we choose $a'$ or $b'$ for the analysis (Sharma et al. Reference Sharma, Chen and Mishra2023). We use $a'$ and $A_0$ for the further computation of energy amplification. For unstable displacement, when perturbations amplify with time, $\ln (E(t))$ increases with time, while a monotonically decreasing profile of $\ln (E(t))$ is obtained for stable displacements. The transition in stability from stable to unstable displacement is depicted by a minimum in the $\ln (E(t))$ curve. We denote that time as the onset time when perturbations start to grow (Hota et al. Reference Hota, Pramanik and Mishra2015a).
It is noteworthy that the time domain is confined to  $t=1$, representing the duration over which our investigation is conducted. Hence, we analyse the stability of reactive displacement in transient time regimes only, not for asymptotic times. It has been observed that there exists a diffusive regime at later times for radial flows (Chui, De Anna & Juanes Reference Chui, De Anna and Juanes2015; Verma et al. Reference Verma, Sharma and Mishra2023). For non-reactive fluids, experimental observations indicate that the interface growth decelerates, scaling as $\sim t^{1/2}$ at later times, showing the existence of a diffusive regime as anticipated in stable displacements (Chui et al. Reference Chui, De Anna and Juanes2015). It indicates the shutdown of overall flow instability. This phenomenon is reported as frozen fingers. Moreover, Verma et al. (Reference Verma, Sharma and Mishra2023) has reported the existence of frozen fingers for reactive fluids. Hence, the asymptotic analysis for reactive VF for radial flow is not required.
3.3. Transient energy growth
The system of (2.2) describes the reactive and non-reactive displacement both depending on the value of  $Da$. For $Da=0$, the system represents a non-reactive displacement where all the fluids are non-reactive in nature and follows the convection–diffusion equation. The viscosity profile is monotonic and is given by $\mu =\exp (R_bb)$ due to no product formation, i.e. $c=0$. Further, the monotonic viscosity profile may be modified in the presence of a chemical reaction when $Da \neq 0$. The viscosity profile for various $R_c$ is shown in figure 3(a).
(a) Viscosity profile for  $Da=100$, $Pe = 3000$, $R_b=0.5$ and various $R_c$. (b) Log energy amplification with time for $Da=100$, $R_b=0.5$ and various $R_c$ showing unstable displacement. Inset: $\ln (E(t))$ of $R_b=0.5,0.3$, $Da=0$.

In the present study, we aim to compare the reactive and non-reactive displacement when the viscosity contrast,  $R_b$, between displacing fluid $A$ and displaced fluid $B$ is the same. Further, for non-reactive fluids, it is reported that there exists a critical viscosity contrast for instability for radial flow (Sharma et al. Reference Sharma, Nand, Pramanik, Chen and Mishra2020). Hence, we divide the reactive displacement into two categories depending on whether the corresponding non-reactive displacement is stable or unstable. First, we consider the reactive displacement when the corresponding non-reactive situation, that is, $Da=0$, is stable and examine if the chemical reaction affects the flow stability. In the second category, we consider those types of reactions for which reactants already have an unfavourable viscosity contrast for instability. We examine how stability behaviour, such as the growth rate of perturbations and onset of instability, is affected by product formation. In order to evaluate the variation between reactive and non-reactive displacement, we must first review the stability of the non-reactive system before analysing the reactive displacement. We observe that $R_b =0.5$ represents unstable displacement, while $R_b=0.3$ corresponds to a stable displacement as explained below.
It can be verified that the flow is unstable for  $R_b=0.5, Da=0$ as the $\ln (E(t))$ increases with time after obtaining a minimum as shown in the inset of figure 3(b). In the case of unstable displacement, the initial decrements in energy show the initial diffusion in the system, and instability takes some time to manifest. The minimum denotes the onset time of instability when instability appears. From the onset time, the convection starts to dominate the flow dynamics and the perturbation growth begins. In contrast, if we decrease the viscosity ratio between reactants to $R_b=0.3$, the flow remains stable for the entire time domain as shown in the inset of figure 3(b) despite an unfavourable viscosity contrast. Thus, we have obtained two values of $R_b$ showing that an increase in viscosity contrast leads to the transition in stability for the non-reactive situation. Now we analyse how the stability of the monotonic viscosity profile is influenced by varying $R_c$.
3.3.1. Effect of  $R_c$
$R_c$

When we consider the non-reactive displacement, we have to deal only with a perturbed concentration that follows a linearized perturbed equation corresponding to one convection–diffusion equation. While in the reactive case, we have to handle three perturbed concentrations that follow (3.3c)–(3.3e), and the complexity of the system analysis escalates. Therefore, it is absurd to compare the evolution of perturbed reactive or non-reactive concentrations directly. Additionally, we want to compare VF dynamics as a result of the modified viscosity profile, hence we find a value of  $R_c$ for which the corresponding viscosity profile is not modified in the presence or absence of the reaction.
When the product viscosity differs from that of the displacing fluid reactant  $B$, i.e. $R_c \neq R_b$, the viscosity profile becomes either non-monotonic or remains monotonic but with steeper viscosity contrast as shown in figure 3(a) for $Da=100$, $R_b=0.5$ and various $R_c$. Due to the presence of all three fluids, Hejazi et al. (Reference Hejazi, Trevelyan, Azaiez and De Wit2010) has identified two mixed zones: the trailing and leading zones. The region occupied by the displacing reactant $A$ and product $C$ is defined as the trailing zone, while the region inhabited by displaced fluid, $B$ and $C$ is termed as the leading zone. The significance of defining these regions is that different viscosity contrast occurs in these two zones when $R_b \neq R_c$ and plays an individual role in determining the overall stability of the system. The viscosity contrast at the trailing zone is decided by the factor $R_c/2$ while $R_b-R_c/2$ determines the viscosity ratio at the leading zone (Hejazi et al. Reference Hejazi, Trevelyan, Azaiez and De Wit2010; Verma et al. Reference Verma, Sharma and Mishra2023). For $R_b=R_c=0.5$, it is evident that $R_c/2=R_b-R_c/2$, that is, the viscosity in both zones is the same. Thus, the viscosity contrast for $R_c=0.5$ is monotonic, similar to that of $R_b=0.5$ as shown in figure 3(a). Thus, when a chemical reaction alters the viscosity profile, this specific case of $R_c=0.5$ can be used as a reference viscosity profile. For instance, if we compare the viscosity profile in figure 3(a), it is evident that the viscosity profile remains monotonic for $R_c=0,1$ but the reaction results in a non-monotonic viscosity profile for $R_c=1.5, -0.5$. Even for the monotonic case, if we compare the profiles for $R_c=0,0.5,1$, we can see that the viscosity profile at the trailing zone is steepened for $R_c=1$, while it is steepened at the leading zone for $R_c=0$. We analyse how this affects the onset of instability.
We have plotted the log energy amplification curve for various  $R_c$ with $R_b=0.5$ in figure 3(b). For $R_c=1$, the viscosity profile steepens at the trailing zone particularly and becomes flat at the leading zone where $R_b-R_c/2=0$. Due to this, the onset occurs early and the system exhibits more energy amplification for $R_c=1$ than $R_c=0.5$ despite the same endpoint viscosity contrast. Now we analyse the energy amplification for $R_c=0$, where unfavourable viscosity contrast is shifted at the leading zone. The energy amplification for $R_c=0$ is more than that of $R_c=0.5$ at a later time only. However, at an early time, the energy amplification is less for $R_c=0$, and hence the system is less destabilized than $R_c=0.5$. It shows the significance of the location where the unfavourable viscosity contrast occurs and instability appears. Here, the viscously stable trailing zone stabilizes the system at early times. While the unstable, leading zone will be carried into effect late and the system destabilizes more when instability appears in the trailing zone. Thus, despite the same viscosity contrast in their unstable zone for $R_c=0, 0.5, 1$ and $R_b=0.5$, the system may attribute stability transition at a different time by varying unfavourable viscosity contrast locations.
Further, when  $R_c=1.5$ and
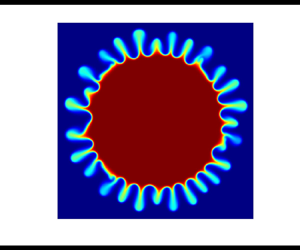
  $R_c=-0.5$, the viscosity profile becomes non-monotonic, resulting in unfavourable viscosity contrasts at the trailing and leading zones, respectively. Figure 4(a) shows the position of the r, at which the average reaction rate attains maximum, is the separator between the two zones. For $R_c=1.5$ ( $R_c=-0.5$), the leading (trailing) zone stabilizes and instability is expected to develop at the trailing (leading) zone. To illustrate this, we plot the perturbation profile for $c'$ in polar coordinates at $t=1$ for both $R_c=-0.5$ and $R_c=1.5$ in figures 4(b) and 4(d), respectively. For $R_c=0.5$, the viscosity profile is monotonic, and hence, the perturbation profiles are distributed symmetrically in both mixing zones, as depicted in figure 4(c). In contrast, the presence of localized unstable zones leads to a more concentrated distribution of perturbation at the trailing (leading) zone when $R_c=1.5$ ( $R_c=-0.5$). Moreover, we plot perturbation profiles for $a'$,
$a'$,  $b'$ and $z'$ in Appendix A.
(a) Averaged reaction rate profile,  $\langle \mathcal {R} \rangle (r,t)= ({1}/{2 {\rm \pi}}) \int _{r_0}^{R_0} \mathcal {R}(r,\theta,t) \,\textrm {d} \theta$ and $\mathcal {R}=Da A_b B_b$ for base state for $Da=100$ and $Pe = 3000$. Cropped plot of perturbed concentration profile $C$ (
$C$ ( $10^4 \times c'$) for $Pe = 3000$, $Da=100$, $R_b=0.5$, (b) $R_c=-0.5$, (c) $R_c=0.5$ and (d) $R_c=1.5$ at final time $t=1$ in polar coordinates. Here, the black-dashed line denotes the position where the reaction rate is maximum, as shown in (a).

In the energy amplification plots in figure 3(b),  $\ln (E(t))$ increases more for $R_c=1.5$ than $R_c=-0.5$ depicting more amplified perturbations for $R_c=1.5$ despite the same viscosity contrast at respective unstable zones. It can be concluded that the perturbations amplify more with enhanced energy amplification $\ln (E(t))$ with a higher growth rate of perturbations for an increased viscosity contrast, $\vert R_b -R_c \vert$ for any fixed $R_b$. This aligns with both the findings from the existing linear stability analysis (Hejazi et al. Reference Hejazi, Trevelyan, Azaiez and De Wit2010) and NLS (Sharma et al. Reference Sharma, Pramanik, Chen and Mishra2019; Verma et al. Reference Verma, Sharma and Mishra2023) qualitatively. The NLS indicate that as the viscosity ratio increases, the onset time of instability decreases, which leads to rigorous VF patterns (Sharma et al. Reference Sharma, Pramanik, Chen and Mishra2019; Verma et al. Reference Verma, Sharma and Mishra2022, Reference Verma, Sharma and Mishra2023). In addition, the mixing phenomena are enhanced (Verma et al. Reference Verma, Sharma and Mishra2023).
Further, it can be seen that for each pair  $\vert R_c-R_b \vert$, despite the identical viscosity contrasts, the system exhibits a greater energy amplification for the case $R_c-R_b>0$ than the corresponding case, $R_c-R_b<0$ as shown in figure 3(a). This raises the question of why the perturbations amplify more when the unstable zone is situated at the trailing zone in contrast to the leading zone despite the viscosity contrast being the same ( $\vert R_c- R_b \vert$). The velocity profile holds the responsibility for this property of radial flow. The velocity magnitude decreases with the radial distance, which provides more convection to the trailing zone than the leading zone (Sharma et al. Reference Sharma, Pramanik, Chen and Mishra2019; Verma et al. Reference Verma, Sharma and Mishra2022). Moreover, it hints at the asymmetry in the $(R_b,R_c)$ phase plane along the non-reactive region, $R_c=R_b$. We explore the asymmetry in the $(R_b,R_c)$ phase plane by taking corresponding stable non-reactive situations and finding the corresponding $R_c$ parameters that destabilize the flow. In the inset of figure 3(b), the flow is shown stable for $R_b=0.3$. If the reaction generates a product with enough high or less viscosity that makes the viscosity profile non-monotonic and one of the zones becomes viscously unstable, the flow may become unstable. We will next investigate these situations.
In figure 5(a), the flow is shown stable for some range of  $R_c$, including $R_c=0.3$ and on further increment of viscosity ratio, the system becomes unstable. For the viscosity contrast $\vert R_c-R_b \vert =1$ ( $R_c=1.3,-0.7$), the flow is unstable as $\ln (E(t))$ increases with time after attaining a minimum, while the flow is stable for $R_c=-0.4$. It is interesting to note that when $R_c=1$, the system behaves inconsistently. Following a minimum, $\ln (E(t))$ rises at first, then starts to fall as the energy amplification increases to saturation. For better visualization, we compute the growth rate as in Tan & Homsy (Reference Tan and Homsy1987):
 \begin{equation} \sigma=\frac{t}{2E}\frac{{\rm d} E}{{\rm d} t}. \end{equation}
(a) Log energy amplification and (b) growth rate with time for  $Da=100$, $Pe=3000$, $R_b=0.3$ and various $R_c$ showing unstable displacement. Inset: growth rate for $R_c=1.1,-0.5$ showing an unstable and stable displacement, respectively, despite the same viscosity contrast $\vert R_b-R_c \vert$.

Evidently, the growth rate of perturbations is negative for  $R_c=1$ at later times after onset; there is a decay in perturbation growth as shown in figure 5(b). The positive growth rate indicates that the perturbations grow after onset time. However, the unfavourable viscosity contrast at the trailing zone is not enough to sustain the growth of perturbations for a longer time and it starts to decrease again. A similar transition in stability is observed in the literature (Hota & Mishra Reference Hota and Mishra2018) for rectilinear flow. There, the secondary instability appears at late times after the first minima in $\ln (E(t))$. The uniform velocity in the rectilinear displacement constantly feeds the flow and is responsible for this transition. However, in our case, the flow velocity reduces with radial distance and at the unstable zone with time. As a result of this, once the flow is stabilized, convection is not able to induce instability again. Hence, the flow is considered stable for $R_c=1$. In conclusion, we have obtained a stable zone for a range of $R_c$ when the corresponding non-reactive displacement is stable. In addition, we obtain such values of $R_c$ where the flow is unstable when $R_c- R_b>0$ ( $R_c=1.1$) while stable for the corresponding case $R_c-R_b<0$ ( $R_c=-0.5$) showing asymmetry in the $(R_b,R_c)$ phase plane. We discuss this in detail in § 4. The growth rate of perturbations is negative for $R_c=-0.5$, while the system shows a positive growth rate after onset in perturbation evolution for $R_c=1.1$. Now, the question arises of how changing the reaction rate, $Da$, influences the stability of the reactive system, regardless of whether the system is initially stable or unstable.
3.4. Effect of $Da$

When reactants are isoviscous,  $R_b=0$, NLS have shown that the onset of instability gets delayed and the critical viscosity ratio for instability is exceeded with lowering $Da$ (Sharma et al. Reference Sharma, Pramanik, Chen and Mishra2019). Here, we explore the effect of $Da$ when $R_b \neq 0$. From the comparison of the figures 3 and figure 6(a), it can be observed that the $\ln (E(t))$ is less for $Da=10$ after onset time. It happens as a result of the reduced amount of product decreasing the viscosity and thus the viscosity gradient, resulting in slower growth of perturbations. Furthermore, if we compare energy amplification for $R_b=0.3$, $Da=100,10$ and various $R_c$ as in figures 5 and 6(b), the stable range of $R_c$ increases for decreased $Da$. Flow is unstable for both the parameters $R_c=1.3, -0.7$ when $Da=100$, but for $Da=10$, these parameters belong in the stable range of $R_c$ for $R_b=0.3$.
Log energy amplification with time for  $Da=10$, $Pe=3000$, (a) $R_b=0.5$, (b) $R_b=0.3$ and various $R_c$ showing unstable displacement.

We have now covered the cases when the viscosity profile is modified due to the formed product having viscosity contrast with reactants. However, there is another case when product viscosity is identical to displacing fluid reactant  $B$, i.e. $R_b=R_c$ regardless of $Da$, the viscosity profile remains the same as the corresponding non-reactive situation, $(R_b, Da=0)$ (Nagatsu & De Wit Reference Nagatsu and De Wit2011). For such cases, we claim that no change in the flow stability occurs when $R_b=R_c$ provided the flow is stable with or without the reaction, for instance, when $R_b=0.3$. No change in perturbation growth or energy amplification should be observed when the system is already unstable for corresponding non-reactive situations $R_b=0.5$ for changing $Da$. Instead of reactant $A$, we show energy amplification for dye concentration. Since dye concentration follows the convection–diffusion equation as followed by $A$ when $Da = 0$, considering $z$ allows us to examine the stability of the parameter $R_b = R_c$ for varied $Da$ ranging from $Da = 0$ to $Da = 100$.
From figure 7, it can be concluded that the stability is unaffected by a chemical reaction when  $R_b=R_c$ as energy amplification regardless of whether the system is stable or unstable before the reaction.
Log energy amplification with time for  $R_b=R_c=0.5, 0.3$ and various $Da$, and $Pe=3000$. Here, all the curves for different $Da$ and fixed viscosity contrast are merged.

4. Nonlinear simulations
To support the fact that the results of LSA are not a consequence of linearized equations, we perform NLS for the VF instability on the system of equations given in (2.2). We utilize a highly efficient pseudospectral method hybridized with the compact finite difference method to solve the coupled nonlinear system of partial differential equations. We decompose the velocity into two parts with rotational velocity ( $\boldsymbol {u}_{rot}$) and potential velocity, ( $\boldsymbol {u}_{pot}$) that defines the unperturbed flow as given in (2.4b). In addition, we define the rotational component to capture the instability by introducing the stream function as
 $$\begin{gather} \boldsymbol{u}=\boldsymbol{u}_{pot} +\boldsymbol{u}_{rot}, \quad \boldsymbol{u}_{rot}=\left(\frac{\partial \psi}{\partial y}, -\frac{\partial \psi}{\partial x}\right) , \end{gather}$$
 $$\begin{gather}\nabla^2 \psi ={-}\omega, \quad \omega=R_c\left(v \frac{\partial c}{\partial x}-u \frac{\partial c}{\partial y}\right)+R_b\left(v \frac{\partial b}{\partial x}-u \frac{\partial b}{\partial y}\right). \end{gather}$$
We solve Poisson equations (4.1b) by applying Fourier sine expansion to solve  $x-$ derivative and discretize the $y-$ derivative with the compact finite difference of sixth order. Further, the initial value problem in (2.2)(b–e) is solved by the third-order Runge–Kutta method with adaptive time steps satisfying the Courant–Friedrichs–Lewy condition. The remaining details are explained in Sharma et al. (Reference Sharma, Pramanik, Chen and Mishra2019) and Verma et al. (Reference Verma, Sharma and Mishra2022).
To track the instability, we plot the dye concentration profile for  $R_b=-1, 1$, $Da=100$, $Pe=3000$ and for various $R_c$ at the final time $t=1$ in figure 8. It is evident that the flow is unstable for $R_b=1$ irrespective of $R_c$. In contrast, the flow is stable for $R_b=-1$, and we obtain a range of $R_c$ where a transition can be observed in flow stability. For non-reactive flow, the flow is stable for $R_b=-1$ due to a monotonically decreasing viscosity profile. A chemical reaction generates a product having some viscosity contrast with reactants and the viscosity profile becomes non-monotonic with extremum. However, we obtain stable displacement when $R_c=5,-3$ and unstable when $R_c=-8,6$. Evidently, reaction can induce instability but it requires a critical viscosity contrast for instability. This supports the findings presented by LSA in figure 3(b), suggesting that instability persists in reactive flow if the equivalent non-reactive system is unstable. Furthermore, upon comparing figure 8(a i,b i) and figure 4(b) obtained from NLS and LSA, respectively, we note that instability predominantly develops in the leading zone when $R_c< R_b$. Similarly, instability appears in the trailing zone when $R_c>R_b$, as evidenced by LSA in figure 4(d) and NLS in figure 8(a v,b v). When $R_c=R_b$, the instability is not localized in any specific zone, as shown by LSA in figure 4(d) for $R_b=R_c=0.5$ and by NLS in figure 8(b iii) for $R_b=R_c=1$. Additionally, a comparison between figures 5(a) and 8(a) illustrates a stable range of $R_c$ in the $(R_b, R_c)$ phase plane for a constant $R_b$ in the corresponding stable non-reactive system.
Dye concentration profile for  $(Da,Pe)=(100,3000)$, (a) $R_b=-1$ and (b) $R_b=1$ and various $R_c$ at final time $t=1$.

The experimental findings of Riolfo et al. (Reference Riolfo, Nagatsu, Iwata, Maes, Trevelyan and De Wit2012) confirm our results. They have conducted experiments where a highly viscous fluid, polyacrylic acid (PAA), displaces a less viscous fluid, sodium hydroxide (NaOH), leading to a reaction PAA  $+$ NaOH $\rightarrow$ SPA $+$ H
$+$ H $_2$O, resulting in the formation of a highly viscous product, salt sodium polyacrylate (SPA). In this scenario, the viscosity ratios were characterized by $R_b =\ln (\mu _B/\mu _A)=-6.7685$ and $R_c =\ln (\mu _C/\mu _A)=1.495$, with viscosities of PAA, NaOH and SPA are 870 centipoise (cp), 1 cp and 3880 cp denoted as $\mu _A$, $\mu _B$ and $\mu _C$, respectively. This value of $R_b$ and $R_c$ lies in Zone III in $(R_b,R_c)$ phase plane. We have explained the zones in Appendix C. The non-monotonic viscosity profile, exhibiting maxima within the reaction zone, induces instability in the trailing zone as shown in figure 5(b) from Riolfo et al. (Reference Riolfo, Nagatsu, Iwata, Maes, Trevelyan and De Wit2012). Further, they present another experiment where a highly viscous fluid, SPA, displaces a less viscous fluid, an aqueous mixture of hydrogen chloride and glycerol (HCl), resulting in a reaction SPA $+$ HCl $\rightarrow$ PAA $+$ NaCl and generating a less viscous product (PAA). In this case, the viscosity ratios were $R_b =-4.3745$ and $R_c =-5.0676$, with viscosities of 794 cp, 10 cp and 5 cp for PAA, HCl and SPA, respectively. This value of $R_b$ and $R_c$ lies in Zone II in $(R_b,R_c)$ phase plane as explained in Appendix C. Again, the non-monotonic viscosity profile within the reaction zone led to instability and the formation of fingering patterns due to the increment in viscosity at the leading zone, as shown in figure 5(b) from Riolfo et al. (Reference Riolfo, Nagatsu, Iwata, Maes, Trevelyan and De Wit2012).
The viscosity gradient at the trailing and leading zone is decided by  $R_c/2$ and $R_b-R_c/2$, respectively. The instability is anticipated to occur at the trailing zone if $R_c>0$. Thus, we determine the critical viscosity ratio at the leading zone so that the diffusion can weaken the responsible forces due to convection in the trailing zone. In another way, we find a critical $R_b$ that can stabilize the flow. Similarly, if $R_c<0$, then the flow can be destabilized for increasing viscosity gradient, $R_b-R_c/2>0$ at the leading zone. Hence, finding a critical $R_b$ for a given $R_c$ for the computational study will be convenient. To determine instability, we measure the deformation of the interface by interfacial length in the dye concentration (Mishra, Martin & De Wit Reference Mishra, Martin and De Wit2008; Sharma et al. Reference Sharma, Pramanik, Chen and Mishra2019). It is calculated by $I(t)= \int _{\varOmega } \vert \boldsymbol {\nabla } z \vert \, \textrm {d} \varOmega$. For stable displacement, interfacial length follows the relation $I_0(t)=2 {\rm \pi}\sqrt { r_0^2+ t/ {\rm \pi}}$ (Sharma et al. Reference Sharma, Nand, Pramanik, Chen and Mishra2020). Evidently, for a deformed interface, the interfacial length increases, and if interfacial length, $I(t)$ coincides with $I_0(t)$ for the entire time domain, that parameter can be considered as stable displacement. We define the flow as unstable when the relative difference in interfacial length is greater than zero, that is, $\Delta I=(I-I_0)/I_0 >0$.
A phase plane  $(R_b,R_c)$ is presented in figure 9 where the solid curves show critical viscosity ratio $(R_b, R_c)$ for instability for each $Da$ and the region below the curve is stable and above the curve is the unstable region. It can be observed that if reactants have favourable viscosity contrast, i.e. $R_b<0.66$, then two critical $R_c$ can be determined that destabilize the flow for a given reaction rate. It happens when a chemical reaction introduces a non-monotonic viscosity profile and persuades convection and diffusion to compete, as suggested by LSA results. We obtain a range of $R_c$ when $R_b <0.66$ corresponds to the stable flow. This range contracts for increasing $R_b$ and vanishes when $R_b=R_c=0.66$. The viscosity contrast between reactants, $R_b=0.66$, is the maximum $R_b$ for which flow is stable before the reaction and the reaction may alter the stability. Moreover, if reactants have viscosity contrast, $R_b>0.66$ and the stability will not be changed by the reaction. It exhibits the limitations of the influence of reaction on the stability of the system. It is evident in figure 9 that the region around $R_c=0.66$ is stable for all values of $Da$. This is the $Da$-independent critical regime that we have reported for radial VF.
The  $(R_b,R_c)$ phase plane for $Pe = 3000$, various $Da$ along with $Da \rightarrow \infty$. Inset: dye concentration profile for $R_b=1$, (i) $R_c=-3$, (ii) $R_c=1$, (iii) $R_c=5$ showing unstable displacement and (iv) $R_b=R_c=0$ showing stable displacement in polar coordinates.

The value of viscosity ratio  $(R_b,R_c)=(0.66,0.66)$ is of special interest for us. For $(R_b,R_c)=(0.66,0.66)$, the viscosity profile is monotonic and identical to its inherent viscosity profile in corresponding non-reactive situations. Now, we claim that the viscosity ratio when $R_b=0.66$ is also the critical viscosity ratio for the non-reactive fluids. For non-reactive fluids, Sharma et al. (Reference Sharma, Nand, Pramanik, Chen and Mishra2020) have established a scaling relation between Péclet number $Pe$ and critical log-mobility ratio $R_b$ numerically:
 \begin{equation} R_b=\alpha (r_0) Pe^{-\beta}, \quad \alpha=30(1+10 r_0). \end{equation}
Here  $\beta$ lies under confidence bounds $(0.52,0.59)$ and critical parameters $(R_b,Pe)$ lies on the boundary that is given by $R_b=\alpha (r_0) P\textrm {e}^{-0.55}$. Since (4.2) is determined numerically and has theoretical and experimental support, it provides a fair opportunity to compare reactive displacement with the corresponding non-reactive displacement in the context of stability. In all the simulations, we have considered $Pe=3000$ and $r_0=0.075$, if we put the same value of $Pe$ and $r_0$ in (4.2), we obtain the critical $R_b=0.642$. In addition, if we find the range for this critical viscosity ratio in the $95\,\%$ confidence bound, we obtain $R_b \in (0.466,0.817)$. The obtained critical viscosity $R_b$ for the reactive case lies in the range $R_b \in (0.466,0.817)$ which also contains the calculated viscosity ratio, $R_b=0.642$ for the non-reactive displacement.
Though the viscosity profile is modified only when  $R_b \neq R_c$, thus the effect of product viscosity $R_c$ on stability can be compared along the line $R_b=R_c$ whether the reaction increases or decreases the viscosity of the system. The specific value $(R_b,R_c)=(0.66.0.66)$ distinguishes the stability behaviour of reactive and non-reactive displacement. Furthermore, during the LSA analysis, we noticed an asymmetry in the $(R_b, R_c)$ phase plane along the line $R_c=R_b$. Despite having the same viscosity contrast ( $\vert R_c-R_b \vert$), perturbations exhibit a higher growth rate when $R_c>R_b$ compared with the opposite case, $R_c< R_b$ as in figures 3(b) and 6(a). The critical viscosity contrast is greater when the reaction decreases viscosity, i.e. $R_c< R_b$, than in the opposite case, $R_c>R_b$, if a system is stable for the corresponding non-reactive case ( $R_c=R_b$) as shown in figures 5 and 6(b). Similarly, in the $(R_b, R_c)$ phase plane obtained from NLS, we observe asymmetry along the line $R_c=R_b$. The critical $R_b$ decreases more significantly when $R_c>0.66$ compared with when $R_c<0.66$. To visualize more about this asymmetry, we have plotted a phase plane between $R_c/2$ and $R_b -R_c/2$ that shows viscosity contrast at trailing and leading zone in figure 10(a). It can be observed that if the trailing front is stable, the critical viscosity contrast for instability, $R_b-R_c/2$ is more than $R_c/2$ if the leading front is stable. The asymmetry is a consequence of the spatially dependent base state velocity profile. When $R_c<0.66$, the instability appears at the leading zone due to steeper viscosity contrast while the trailing zone stabilizes the flow. On the other hand, when $R_c>0.66$, the instability appears at the trailing zone for the same viscosity contrast at the unstable zone. If we compare both $R_c$ values for the same $R_b$ maintaining the viscosity gradient $\vert R_c-R_b \vert$, the driving force provided by convection is more efficient at the trailing than at the leading zone. Consequently, the critical viscosity contrast to trigger instability at trailing zone $R_c /2$ is less than the critical viscosity ratio, $R_b -R_c/2$, to trigger the instability at the leading zone. Similar asymmetric behaviour is observed in Sharma et al. (Reference Sharma, Pramanik, Chen and Mishra2019). A higher viscosity ratio is required for instability when the reaction produces a less viscous product for $R_b=0$ compared with when the product is highly viscous.
(a) Phase plane between the viscosity ratio at trailing and leading zone,  $R_c/2$ and $R_b -R_c/2$ for $Pe=3000$ and various $Da$. (b) The $(R_b,R_c)$ phase plane for $Pe = 3000,1000$ for $Da \rightarrow \infty$. Here below the curve is a stable region, and above the curve is an unstable region. Here the dashed lines correspond to the non-reactive case $Da=0$ for $Pe=3000$ (blue) and $Pe=1000$ (red).

4.1. Effect of $Da$ and $Pe$ ($Da\rightarrow \infty$)


It is reported that the stable region exists for all moderate ranges of  $Da$, and the width of the interval of stable $R_c$ decreases with $Da$ when $R_b=0$ (Sharma et al. Reference Sharma, Pramanik, Chen and Mishra2019). Interestingly, the stable region even exists for $Da \rightarrow \infty$ when $R_b=0$ (Verma et al. Reference Verma, Sharma and Mishra2022). When we increase $Da$, more product is formed that enhances the viscosity of the system as in (2.3), leading to an enhanced viscosity contrast and a higher growth rate of perturbations in the system as predicted by LSA and illustrated in figures 3(b), 5 and 6. Hence, the critical viscosity ratio decreases for higher $Da$ as shown in figures 5, 6(b) and 9. However, the existence of the critical viscosity contrast is shown only for the particular case, $R_b=0$. It will be intriguing to examine whether that critical viscosity occurs or identify the range of $R_c$ that corresponds to stable displacements when $R_b \neq 0$. To investigate the same, we have performed simulations for a wide range of $Da$, including the limiting case $Da \rightarrow \infty$. For an instantaneous reaction, $Da \rightarrow \infty$, the reaction front occurs in an infinitesimally small region. This replicates an ideal situation where reactants are fully consumed at the reaction front as soon as the reactants meet, i.e. $a \rightarrow 0$, $b \rightarrow 0$ at the reaction front. The concept of the trailing zone and the leading zone is also based on this ideal situation $Da \rightarrow \infty$. As the trailing zone is only occupied by fluid $A$ and $C$, and the leading zone is occupied by fluid $B$ and $C$, in order to perform simulations for $Da \rightarrow \infty$, we rearrange our system of governing equations as in Verma et al. (Reference Verma, Sharma and Mishra2022), Nagatsu & De Wit (Reference Nagatsu and De Wit2011) and Michioka & Komori (Reference Michioka and Komori2004) as follows:
 $$\begin{gather} \frac{\partial h}{\partial t}+\boldsymbol{u} \boldsymbol{\cdot} \boldsymbol{\nabla} h=\frac{1}{Pe}\nabla^2 h, \end{gather}$$
 $$\begin{gather}(a, b, c)=\begin{cases} (0,1-2h,h), & h<0.5,\\ ({-}1+2h,0,1-h), & h \geq 0.5. \end{cases} \end{gather}$$
In figure 9, we have plotted the critical  $(R_b,R_c)$ curves for various $Da$. The stable zone in the $(R_b,R_c)$ phase plane contracts for increasing $Da$ but does not vanish even when $Da \rightarrow \infty$. It can be verified from a recent article (Kim et al. Reference Kim, Pramanik, Sharma and Mishra2021) for the asymptotic limit of $Pe$ and $Da$. For $R_b=0$, it is reported that the minimum viscosity contrast to induce the instability ( $|R_c|$) is more, if the reaction generates a less viscous product ( $R_c<0$) than a high viscous product ( $R_c>0$). Further, the stable region in the $Da$–
$Da$– $R_c$ phase plane along the line $R_c=0$ becomes less symmetric with $Da$ (Sharma et al. Reference Sharma, Pramanik, Chen and Mishra2019). We observe the same for the case when $R_b \neq 0$. The stable region in the $(R_b, R_c)$ phase plane becomes asymmetric for increasing $Da$ around the line $R_c=R_b$. In addition, if we consider $Da=0$, the stable region is obtained as $R_b<0.64$, and the remaining region in the $(R_b, R_c)$ phase plane is an unstable zone. Further, the viscosity profile is monotonic in the neighbourhood of $R_b=R_c$, and it is identical for each $Da$. Thus, the VF dynamics remain unchanged, and for this particular viscosity, all $(R_c, R_b)$ curves showing the critical viscosity contrast are merged for various $Da$ in the neighbourhood of $R_b=R_c$. This can be confirmed by both LSA and NLS as shown in figures 7 and 9, respectively. Thus, the reaction affects the stability of the flow, but the inherent non-reactive system equally contributes to the instability. There exists a region in the $(R_b, R_c)$ phase plane that is preserved and unaffected by the reaction. This illustrates that the reaction is able to influence the stability of the system and may destabilize the initially stable system, for some values of $R_c$ only.
Further, it can be observed that if we increase the value of  $r_0$, it leads to weaker convection even at the initial time (Sharma et al. Reference Sharma, Nand, Pramanik, Chen and Mishra2020). Consequently, the critical viscosity contrast required to trigger instability also increases for larger $r_0$ as stated in (4.2), and this holds for reactive fluids as well. In the phase plane $(R_b, R_c)$ illustrated in figure 9, the maximum critical value of $R_b$ required to induce instability increases with the increment of $r_0$, following the relationship (4.2). Below this maximum value of $R_b$, the stable range of $R_c$ expands with an increase in $r_0$ for each $R_b$.
Finally, we check the effect of  $Pe$ on the stability of the system for given other parameters $(Da, R_b, R_c)$. The $Pe$ number definition suggests a tuning between the flow rate and diffusion coefficient. In another way, it decides the competition between forces due to convection and diffusion, and flow gets stabilized for decrements in $Pe$ as diffusion works as a stabilizing factor. It is already reported that the stable region in the $R_c$– $Da$ plane widens for decreasing $Pe$. However, the qualitative behaviour shown by the critical $R_c$– $Da$ curves remains preserved for varying $Pe$ (Sharma et al. Reference Sharma, Pramanik, Chen and Mishra2019). To understand the effect of $Pe$ on the VF dynamics when $R_b \neq 0$, we have fixed $Da$ by $Da \rightarrow \infty$ and performed simulations for $Pe=3000, 1000$. For $Pe=1000$, the stable zone widens, and critical $(R_b, R_c)$ increases to trigger the instability as in figure 10(b). Also, we can examine the critical viscosity ratio obtained in the case $R_b=R_c$ for that VF dynamics gets unaffected by chemical reaction for $Pe=1000$. The critical viscosity ratio for non-reactive displacements is found around $R_b=R_c=1.17$ for $Pe=1000$, is the same value as computed from (4.2) for $Pe=1000$ and $r_0$.
5. Conclusion
Reactive displacements in a porous medium are encountered in several transport phenomena that affect the productivity of the process, as the chemical reaction can alter the physical properties at the fluid–fluid interface. The presented problem is motivated as the generated product modifies the viscosity profile that affects the overall stability of the system. In this manuscript, we address the stability of a reactive system  $A+B \rightarrow C$ in a porous medium subjected to VF instability, exploring a range of $(R_b, R_c)$ through LSA. We discuss how the product viscosity of the inherent system influences the temporal evolution of the perturbations.
The LSA predicts that the modified viscosity contrast, i.e.  $R_c \neq R_b$ stimulates the growth rate of perturbations. This leads to an earlier onset of instability and a higher growth rate of perturbations if the flow is already unstable without the reaction. These results agree with the experimental studies (Nagatsu et al. Reference Nagatsu, Matsuda, Kato and Tada2007, Reference Nagatsu, Kondo, Kato and Tada2009) as the reaction enhances the instability for radial flow. On the other hand, if the corresponding non-reactive displacement is stable, such chemical reactions can be categorized into two parts based on product viscosity, $R_c$. For a given reaction rate, $Da$, we can find a range of reaction types, $R_c$, including $R_c=R_b$, which correspond to the stable flow. In such reactive displacement, the altered viscosity profile is not enough to trigger instability. The system becomes unstable for the remaining reaction types $R_c$. Another conclusion that can be drawn from the LSA is that the system exhibits an early onset time and more amplified perturbations when induced by a high viscous product generation rather than a less viscous product. Moreover, such reactive displacements show a higher growth rate of perturbations if we increase $Da$. Meanwhile, the stable range of $R_c$ contracts if the corresponding non-reactive displacement is stable. Also, some reactions exist where product viscosity is the same as the reactant, $B$,
$B$,  $R_c =R_b$, and thus, the stability of the system remains unaltered after the reaction regardless of $Da$.
$Da$.
Further, we perform NLS to determine the critical viscosity ratio  $(R_b, R_c)$ exhibiting instability in reactive displacement for a given $Da$ and $Pe$. We provide sufficient data to determine the stability of the reactive displacement. We present a $(R_b, R_c)$ phase plane separated by critical viscosity ratio for instability into the stable and unstable regions for the entire range of $Da$ and various $Pe$ explored. The importance of each parameter in determining the stability of the system is explained by the phase plane. The stable region in the $(R_b, R_c)$ phase plane reduces for increasing $Da$ and $Pe$ but never completely disappears.
Our findings contribute to understanding the interaction between chemical reactions and VF dynamics. Further, the study has implications for various chemical-enhanced oil recovery mechanisms to reduce residual oil and increase oil production in reservoirs. Strategies such as controlling the mobility ratio (Green et al. Reference Green and Willhite1998; Weidong et al. Reference Weidong, Litao, Guangzhi, Luo, Yunyun and Jiang2017; Sun et al. Reference Sun, Wu, Kang, Lu, Li, Jiang and Zhang2019), reducing interfacial tension (Sedaghat et al. Reference Sedaghat, Mohammadzadeh, Kord and Chatzis2016) and enhancing miscibility between displaced and displacing fluids (Jiang, James & Mojarab Reference Jiang, James and Mojarab2020) are fundamental mechanisms in enhanced oil recovery processes (Fani et al. Reference Fani, Pourafshary, Mostaghimi and Mosavat2022). Moreover, the reactive VF can help improve the sweep efficiency of injected CO $_2$, ensuring that it contacts more of the reservoir rock and displaces more of the resident fluids (e.g. oil or brine) (Sainz-Garcia et al. Reference Sainz-Garcia, Abarca, Nardi, Grandia and Oelkers2017; Lei & Luo Reference Lei and Luo2021). This can lead to more effective CO $_2$ storage and reduced residual trapping of CO $_2$. In this regard, we establish a relation between critical viscosity ratios $R_b$ and $R_c$ to trigger the instability. Further, by adjusting the reaction rate $Da$ and flow rate $Pe$, it is possible to achieve an optimum mixing depending on whether the flow is stable. Moreover, if the flow is stable, a transition in stability can be obtained by varying $Da$ and $Pe$ as per the application. For instance, instability is a suitable choice to increase fluid miscibility in chemical flooding during enhanced oil recovery.
Funding
P.V. acknowledges UGC, the government of India, for the financial support through a Ph.D. fellowship. M.M. and P.V. acknowledge the Indo-Taiwan Joint Research Centre on Artificial Intelligence and Machine Learning. C.-Y.C. is thankful to ROC (Taiwan) Ministry of Science and Technology, for financial support through grant no. MOST 111-2221-E-A49-087-MY3. M.M. acknowledges financial support from SERB, Government of India, through project grant no. CRG/2020/000613.
Declaration of interest
The authors report no conflict of interest.
Appendix A. Choice of characteristic length scale
For the non-dimensionalization of the spatial vector,  $\boldsymbol {x}$, we can utilize either $\sqrt {\kappa }$, $\sqrt {Qt_f}$ or $r_0$. Despite several choices, determining an appropriate length scale has been a challenge. Previous works by Tan & Homsy (Reference Tan and Homsy1987) utilized $\sqrt {\kappa }$ as a length scale due to the absence of an explicit length scale for non-reactive fluids. Further, if we consider $r_0$, $a_0$ and $\mu _0$ as the characteristic scale for length, concentration and viscosity, the quantities can be non-dimensionalized as
 $$\begin{gather} \boldsymbol{x}=\frac{\tilde{\boldsymbol{x}}}{r_0}, \quad \boldsymbol{u}=\frac{\tilde{\boldsymbol{u}}}{Q/r_0},\quad t=\frac{\tilde{t}}{r_0^2/Q}, \end{gather}$$
 $$\begin{gather}(a , b, c)=\frac{(\tilde{a},\tilde{b},\tilde{c})}{a_0},\quad \mu=\frac{\tilde{\mu}}{\mu_0}, \quad p=\frac{\tilde{p}}{Q\mu_0/\kappa}, \end{gather}$$
where  $r_0$ is the initial radius of a circular region filled by fluid $A$. Following this non-dimensionalization, the definition of Péclet number ( $Pe$) remains the same as mentioned in the previous studies (Tan & Homsy Reference Tan and Homsy1987; Nagatsu et al. Reference Nagatsu, Matsuda, Kato and Tada2007; Sharma et al. Reference Sharma, Pramanik, Chen and Mishra2019), i.e. $Pe=Q/D$. While the $Da$ formulation will be altered as
 \begin{equation} Da =\frac{\text{hydrodynamic time scale}}{\text{reactive time scale}}=\frac{r_0^2/Q}{1/ka_0}. \end{equation}
 If we substitute the values from an experimental study performed by Nagatsu et al. (Reference Nagatsu, Kondo, Kato and Tada2009) and determine the range of  $Da$, it varies between 0.0003 to 3.675 (as given in table 2). However, Nagatsu et al. (Reference Nagatsu, Kondo, Kato and Tada2009) obtained an extensive range of $Da$, varied from 1.4 to 64. Clearly, the $Da$ range we obtain from this non-dimensionalization does not correspond with the findings of Nagatsu et al. (Reference Nagatsu, Kondo, Kato and Tada2009). Hence, It is apparent that $r_0$ may not be an appropriate selection for a characteristic length scale for such a reactive flow.
The parameters and corresponding values used in the experimental study from Nagatsu et al. (Reference Nagatsu, Kondo, Kato and Tada2009).

In our study, we define the length scale as  $\sqrt {Qt_f}$ (Sharma et al. Reference Sharma, Pramanik, Chen and Mishra2019). This choice offers practical advantages as it enables us to confine our temporal domain, given that the fingering pattern develops in the diffusive regime in later stages, contingent upon the Péclet number ( $Pe$) (Chui et al. Reference Chui, De Anna and Juanes2015; Verma et al. Reference Verma, Sharma and Mishra2023).
Appendix B. Perturbation profile for $a'$, $b'$ and $z'$


We have plotted the density plot of perturbation for all the perturbed concentrations,  $a'$,
$a'$,  $b'$ and $z'$ in figure 11. Given that the concentrations of base state reactants $A$ and $B$ are localized in the downstream and upstream mixing zones, respectively. In contrast, the perturbed $z'$ remains unlocalized in any mixing zone, resembling the base state profile. Additionally, we observe a quadruple structure for the perturbed concentration $c'$ in figure 4, influenced by the perturbed concentrations of reactants $b'$ and $a'$, as described in (3.3).
Cropped plots of perturbed concentration of  $A$,
$A$,  $B$ and dye for $Da=100$, $Pe=3000$, $R_b=0.5$ and $R_c=0.5$ at final time $t=1$ in polar coordinates. Here, (a) $10^4 \times a'$, (b) $10^4 \times b'$ and (c) $10^4 \times z'$.

Appendix C. Stable and unstable zones in $(R_b,R_c)$ phase plane

For a given  $Pe$ and $Da$, the $(R_b,R_c)$ phase plane can be divided into four zones as described below and shown in figure 12. The flow is stable below the solid curve and is denoted as Zone IV. While above the solid curve, the flow becomes unstable and can be divided into three parts as follows. Here, above the dashed lines (Zone I) is the zone where flow remains unstable with or without reaction. Further, the region confined between solid curve and dashed lines (Zones II and III) is also an unstable region. In Zone II, reactions induce instability by decreasing the viscosity, whereas in Zone III, instability is induced by reaction that increases viscosity.
The  $(R_b,R_c)$ phase plane for $Pe = 3000$ for $Da \rightarrow \infty$.


 Open access