

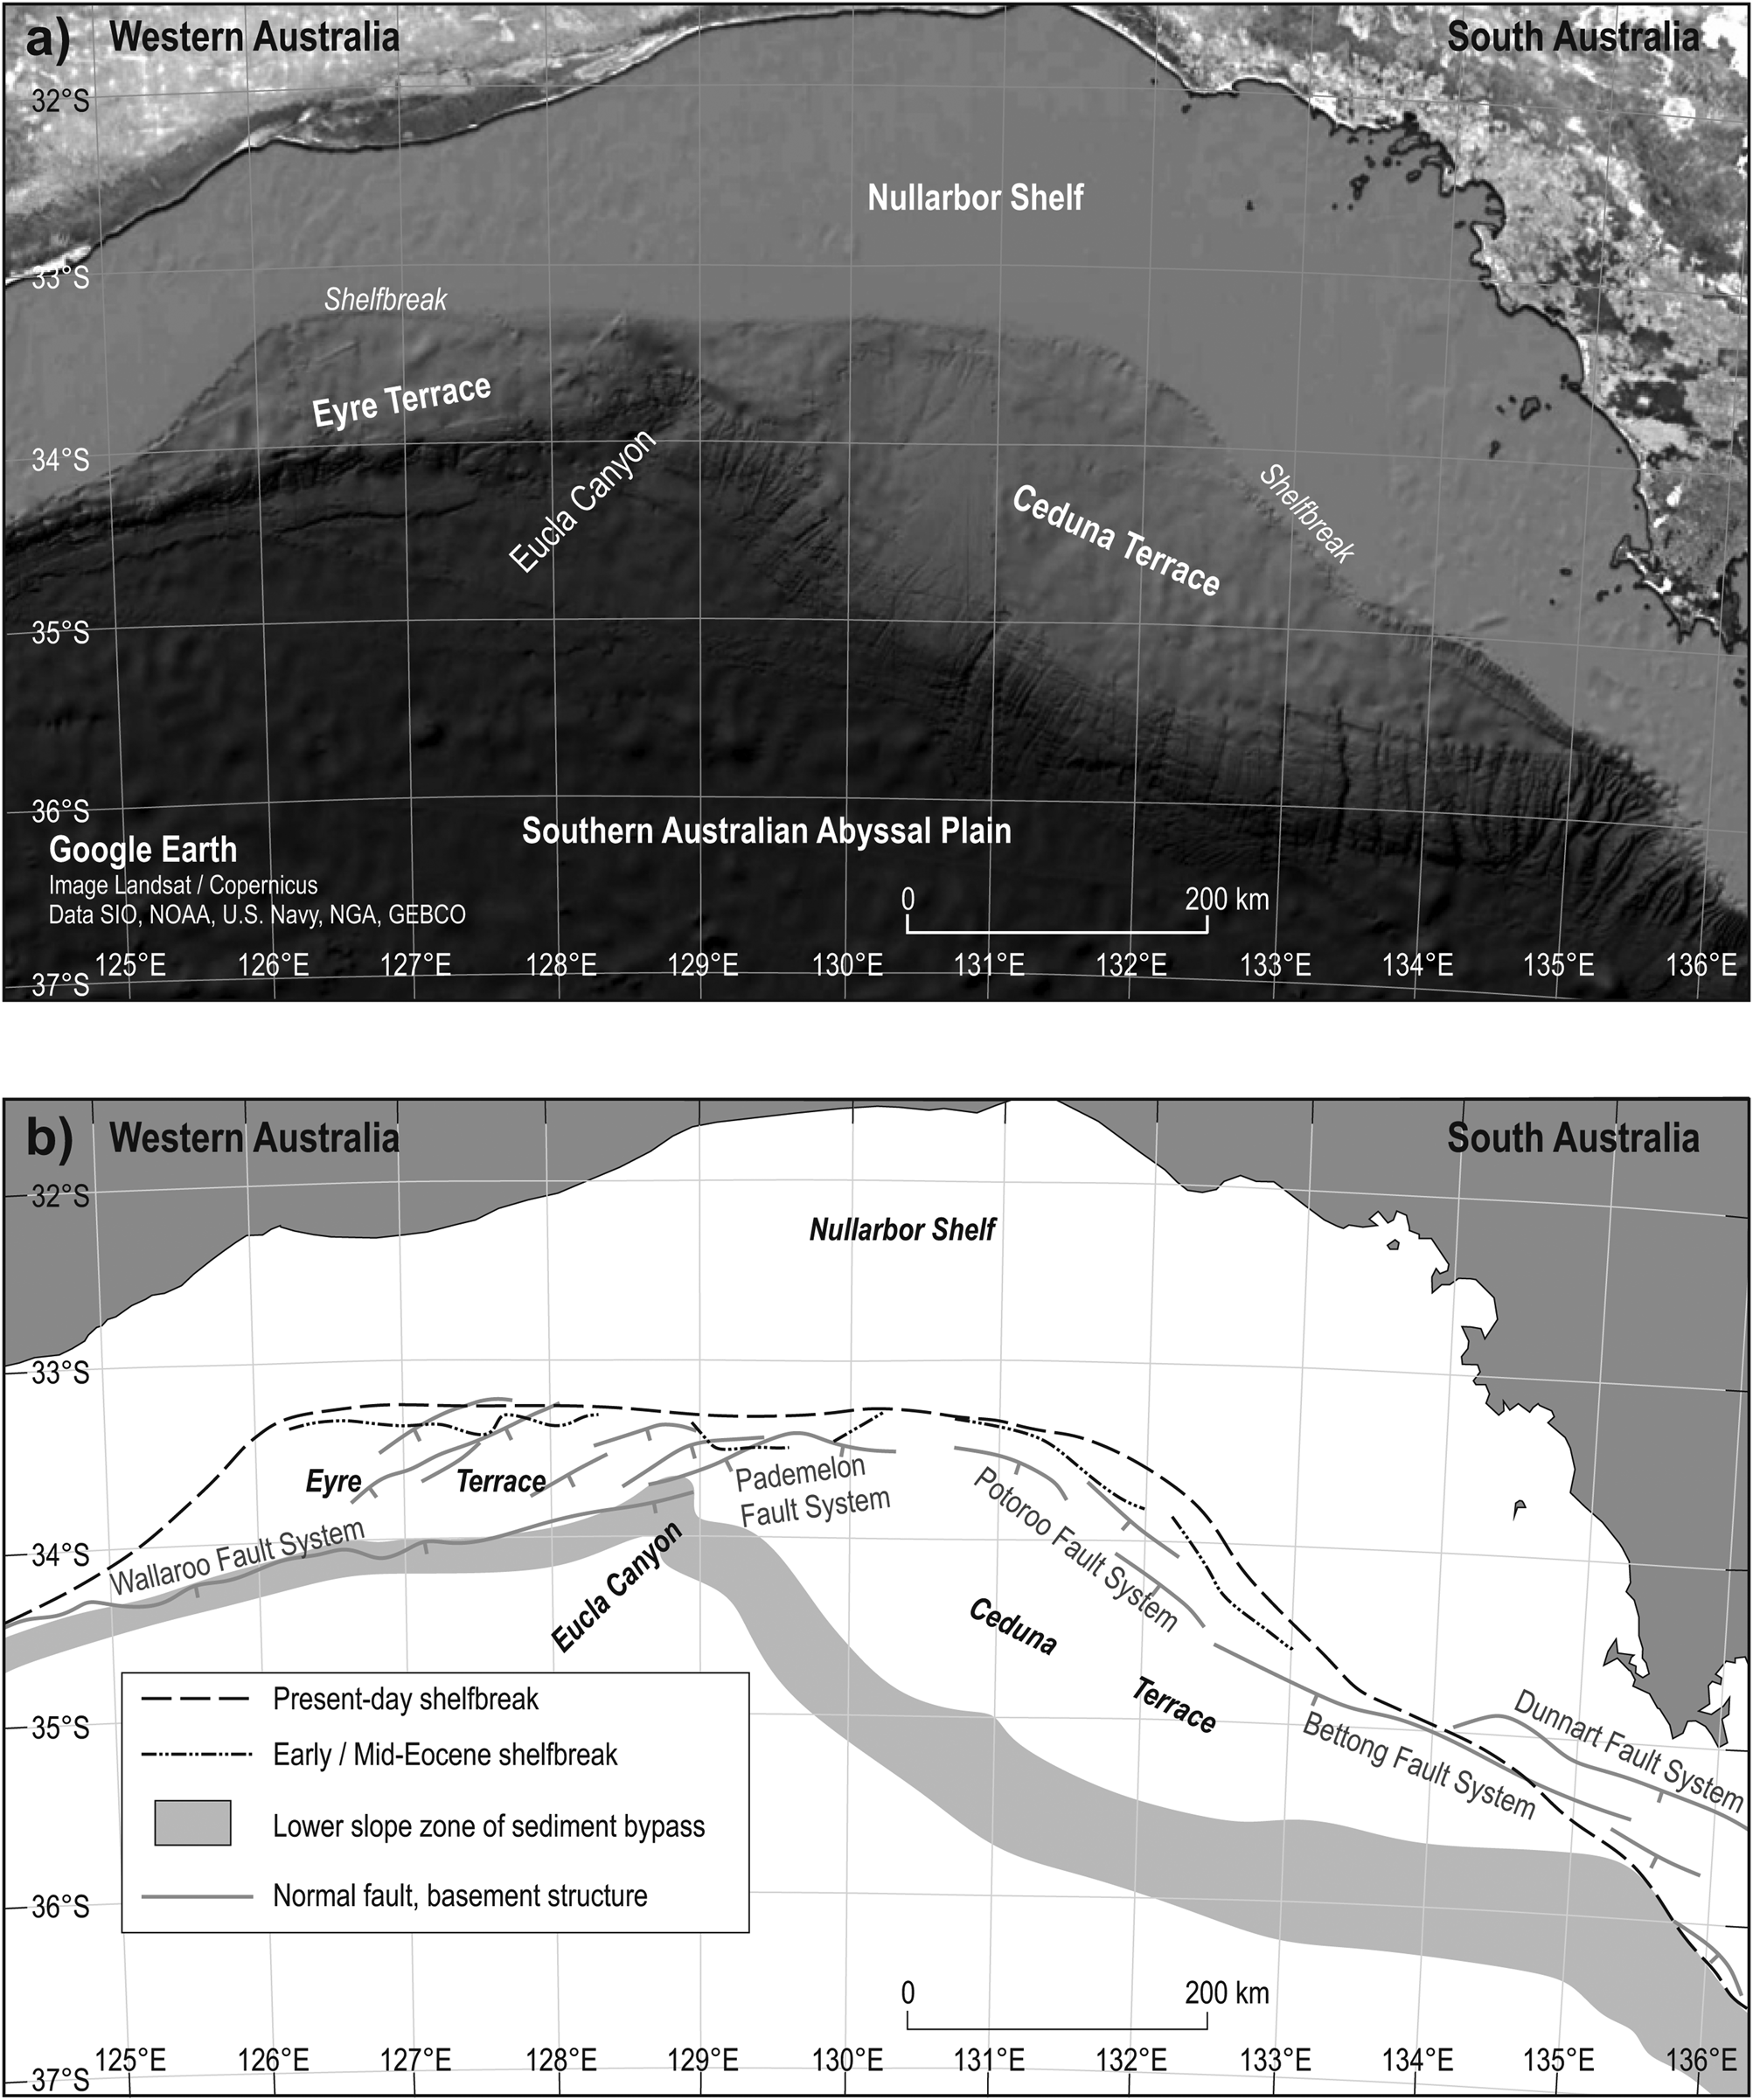
The Cenozoic Eucla Basin is a large onshore–offshore sedimentary basin located along the western and central parts of the southern Australian passive continental margin (Fig. 1). It extends approximately 2000 km E–W and up to 700 km N–S, reaching southwards from inland of the Nullarbor Plain onto and across the continental shelf, slope and rise, commonly referred to as the Great Australian Bight (GAB) (Bradshaw et al. Reference Bradshaw, Rollet, Totterdell and Borissova2003; Clarke et al. Reference Clarke, Gammon, Hou and Gallagher2003). The continental shelf offshore southern Australia is at its widest (up to 200 km) in the GAB where it is termed the Nullarbor Shelf (Bradshaw et al. Reference Bradshaw, Rollet, Totterdell and Borissova2003) (Fig. 1). The shelfbreak is generally located between 130 and 180 m water depth. The adjacent slope is divided into a gently dipping (up to 1°) upper slope, including the Eyre and Ceduna terraces, and a steeper dipping (up to 4°) lower slope (a zone of sediment bypass) that flattens onto the continental rise (the Yalata Sub-basin of Bradshaw et al. Reference Bradshaw, Rollet, Totterdell and Borissova2003). Submarine canyons are a common feature of much of the continental slope of the GAB and are especially prevalent on its eastern side, extending upslope from the continental rise across the Ceduna Terrace up to the present-day shelfbreak (Talukder et al. Reference Talukder, Ross, Trefry, Pickard and Tam2021) (Fig. 2a).
GAB location map showing geographic locations, bathymetry, wells (white circles), ODP boreholes (grey circles) and seismic lines used (solid black and red lines – JNOC 1990 survey) or referred to (dashed lines) in this study, as well as the main oceanographic elements that are potentially sedimentologically significant on the outer shelf and upper slope. Inset (a) shows regional setting of the Eucla Basin (oceanographic abbreviations (red text): ACC, Antarctic Circumpolar Current; EAC, East Australian Current; FC, Flinders Current; LC, Leeuwin Current; SAC, South Australian Current; SAF, Subantarctic Front; STF, Subtropical Front; TO, Tasman Outflow; ZC, Zeehan Current); inset (b) shows the onshore–offshore extent and structural sub-division of the Eucla Basin as defined by Bradshaw et al. (Reference Bradshaw, Rollet, Totterdell and Borissova2003). Oceanographic data based on James et al. (Reference James, Bone, Collins and Kyser2001), Ridgeway & Condie (Reference Ridgeway and Condie2004), Middleton & Bye (Reference Middleton and Bye2007), Anderskouv et al. (Reference Anderskouv, Surlyk, Huuse, Lykke-Andersen, Bjerager and Tang2010) and Richardson et al. (Reference Richardson, Middleton, Kyser, James and Opdyke2019). Bathymetric contours were generated from GeoMapApp (http://www.geomapapp.org) using the Global Multi-Resolution Topography (GMRT) Synthesis (Ryan et al. Reference Ryan, Carbotte, Coplan, O'Hara, Melkonian, Arko, Weissel, Ferrini, Goodwillie, Nitsche, Bonczkowski and Zemsky2009). Seismic data were supplied by PGS (as part of their Southern Australian Margin Digital Atlas), which we gratefully acknowledge. Bold red lines show location of profiles in Figure 6a–d. Blue box represents main area of study.

Maps showing (a) bathymetry of the GAB contrasting the gently shelving character of the upper slope (Eyre and Ceduna terraces) with the steeper lower slope where submarine canyons are clearly observed and facilitate the transport of sediment from the upper slope to the continental rise, bypassing the lower slope; (b) the Early/Mid-Eocene and present-day positions of the shelfbreak in relation to the margin-shaping network of basement lineaments (after Bradshaw et al. Reference Bradshaw, Rollet, Totterdell and Borissova2003).
The Middle Eocene–Pleistocene Dugong Supersequence represents the bulk of the fill of the Eucla Basin (Totterdell et al. Reference Totterdell, Blevin, Struckmeyer, Bradshaw, Colwell and Kennard2000; Totterdell & Krassay Reference Totterdell and Krassay2003). This includes a highly distinctive, aggrading, Middle Eocene–Middle Miocene cool-water carbonate platform succession that has been traced continuously from the Bunda Plateau and Nullarbor Plain onto the Nullarbor Shelf and includes a spectacular buried Mid-Miocene reef (the ‘Little Barrier Reef’) up to 300 m high (Feary & James Reference Feary and James1995, Reference Feary and James1998). Seaward of the buried reef, the Dugong Supersequence comprises several unconformity-bounded Neogene–Quaternary depositional sequences that are exclusive to the outer shelf and upper slope; these have been described, collectively, as a southward-prograding package of sigmoidal clinoforms that form a distally steepened carbonate ramp (James & von der Borch Reference James and von der Borch1991; James et al. Reference James, Boreen, Bone and Feary1994; Feary & James Reference Feary and James1995, Reference Feary and James1998; Feary et al. Reference Feary, Hine, James, Malone, Hine, Feary and Malone2004). The established view is that growth of this prograding package was controlled by the episodic delivery of sediment directly from the Nullarbor Shelf onto the upper slope, primarily in response to eustatic sea-level fluctuations, albeit complicated by local tectonics (James & von der Borch Reference James and von der Borch1991; Feary & James Reference Feary and James1995, Reference Feary and James1998; Li et al. Reference Li, Simo, McGowran and Holbourn2004).
By way of contrast, there is increasing evidence that the overall mounded geometry and internal characteristics of the predominantly Pleistocene upper-slope sedimentary wedge are more reminiscent of contourite sediment drifts (Huuse & Feary Reference Huuse and Feary2005). Characteristic features include shelfward-migrating sediment waves formerly and variably interpreted as slumps (James & von der Borch Reference James and von der Borch1991), biogenic (bryozoan) mounds (Feary & James Reference Feary and James1995, Reference Feary and James1998) and, more recently, sediment waves (Anderskouv et al. Reference Anderskouv, Surlyk, Huuse, Lykke-Andersen, Bjerager and Tang2010). Contourite drifts characteristically form by upslope (shelfward) accretion of sediment driven by contour-following oceanic bottom currents (Stow et al. Reference Stow, Faugères, Howe, Pudsey, Viana, Stow, Pudsey, Howe, Faugères and Viana2002). Eustatic sea-level fluctuations may influence the growth of contourite drifts to some degree, as they partly control the nature and volume of sediment supply, the nature and generation of different water masses (shallow and deep) and the oceanic circulation pattern; however, there are no unequivocal data that causally link sea level with rates of drift accumulation (Faugères & Stow Reference Faugères, Stow, Rebesco and Camerlenghi2008). Whereas Feary & James (Reference Feary and James1998) interpret the mounded Pleistocene upper slope deposits as a lowstand sequence resulting from repeated high-amplitude short-period sea-level fluctuations, a contourite-drift interpretation that involves upslope progradation does not neatly fit a highstand, lowstand or intermediate position in a eustasy-driven model (Faugères et al. Reference Faugères, Stow, Imbert and Viana1999; Faugères & Stow Reference Faugères, Stow, Rebesco and Camerlenghi2008). Based on biostratigraphic data, it has been suggested that ocean current activity in the GAB was initiated in the Mid-Eocene (e.g., McGowran et al. Reference McGowran, Li, Cann, Padley, McKirdy and Shafik1997) – a scenario supported by the recent discovery of probable Mid-Eocene contourites on seismic reflection data from the Ceduna Terrace, in the eastern GAB (Jackson et al. Reference Jackson, Magee and Hunt-Stewart2019). Thus, ocean currents might have played a greater role in shaping this margin than previously acknowledged.
These conflicting ideas on the development of the shelf-margin wedge suggest that a complete and convincing explanation of the stratigraphic architecture of the Dugong Supersequence remains to be established. To address this issue, this paper presents an appraisal of the stratigraphy of the Dugong Supersequence with a focus on its seismic-stratigraphic expression on the shelf and upper slope of the western GAB. We have concentrated on the identification and description of depositional sequences that are potentially ‘mappable’ across the entire GAB. Our revised stratigraphic framework is based on the reinterpretation of regional 2D seismic reflection profiles, and an appraisal of the rock record provided both by boreholes drilled on Leg 182 of the Ocean Drilling Programme (ODP) and petroleum exploration wells. Our analysis indicates that the development of the shelf-margin of the western GAB has been influenced by both downslope and alongslope processes since the Mid-Eocene, with alongslope processes being most pronounced during the Quaternary.
1. Regional setting of the Eucla Basin
1.1. Structure
The Eucla Basin developed as part of the Late Cretaceous–Cenozoic stepwise process of passive margin development offshore southern Australia, following the commencement of breakup of Australia and Antarctica at about 83 Ma (Totterdell et al. Reference Totterdell, Blevin, Struckmeyer, Bradshaw, Colwell and Kennard2000; Norvick & Smith Reference Norvick and Smith2001; Sayers et al. Reference Sayers, Bernardel and Parumes2003; Totterdell & Bradshaw Reference Totterdell, Bradshaw, Boult, Johns and Lang2004; Robson et al. Reference Robson, King and Holford2017). The Eucla Basin unconformably overlies the Bight Basin, one of the major rift basins of the ‘Southern Rift System’ that had controlled extension throughout the entire protracted process of Mesozoic breakup in eastern Gondwana (Stagg et al. Reference Stagg, Cockshell, Willcox, Hill, Needham, Thomas, O'Brien and Hough1990) The present-day terraced shelf-margin physiography (Figs 2, 3) is a consequence of the end-Cretaceous flexure, faulting and gravitational collapse of the early post-breakup, Campanian–Maastrichtian, passive margin – represented by the Hammerhead Supersequence of the Bight Basin – and formed the foundation upon which the unconformably overlying Palaeocene–Early Eocene Wobbegong Supersequence, the oldest part of the Eucla Basin succession, was deposited (Totterdell et al. Reference Totterdell, Blevin, Struckmeyer, Bradshaw, Colwell and Kennard2000, Reference Totterdell, Bradshaw, Willcox, O'Brien and Hibbert2005; Totterdell & Krassay Reference Totterdell and Krassay2003; Totterdell & Bradshaw Reference Totterdell, Bradshaw, Boult, Johns and Lang2004). A hiatus of 5–7 My is envisaged to separate these two phases of passive margin development (Totterdell et al. Reference Totterdell, Blevin, Struckmeyer, Bradshaw, Colwell and Kennard2000). Whereas the Campanian–Maastrichtian passive margin was strongly influenced by reactivation of structural elements formed during the pre-breakup phase of the Bight Basin (Hill Reference Hill, Drexel and Preiss1995; Totterdell et al. Reference Totterdell, Blevin, Struckmeyer, Bradshaw, Colwell and Kennard2000, Reference Totterdell, Bradshaw, Willcox, O'Brien and Hibbert2005; Totterdell & Bradshaw Reference Totterdell, Bradshaw, Boult, Johns and Lang2004) (Fig. 3), the Eucla Basin and its fill represents increased tectonic stability during the Cenozoic.
Geoseismic profiles showing the generalised structural and stratigraphic framework of the GAB, highlighting the distinction between the Cenozoic Eucla Basin and the Mesozoic Bight Basin rift system, as well as the separation between the pre-to-syn-breakup and post-breakup successions. Line drawings are modified after Bradshaw et al. (Reference Bradshaw, Rollet, Totterdell and Borissova2003). Inset map shows location of profiles (a–c), and the landward extent of both basins. Structural elements associated with the Bight Basin and adjacent contemporary shelf are shown in white text. Sequence-stratigraphic (Sseq, supersequence) terminology is after Totterdell et al. (Reference Totterdell, Blevin, Struckmeyer, Bradshaw, Colwell and Kennard2000). Positions of commercial wells used in this study are also indicated together with foot-of-slope ODP site 1128.

An increase in the rate of seafloor spreading in the Mid-Eocene (~44–40 Ma) (Tikku & Cande Reference Tikku and Cande1999; Norvick & Smith Reference Norvick and Smith2001; Sayers et al. Reference Sayers, Bernardel and Parumes2003; Li et al. Reference Li, Simo, McGowran and Holbourn2004), accompanied by volcanism associated with the Bight Basin Igneous Complex (BBIC) (Schofield & Totterdell Reference Schofield and Totterdell2008; Reynolds et al. Reference Reynolds, Holford, Schofield and Ross2017), instigated rapid and widespread subsidence of the GAB that resulted in a regional unconformity between the Wobbegong Supersequence and the overlying Mid-Eocene–Quaternary Dugong Supersequence (Totterdell et al. Reference Totterdell, Blevin, Struckmeyer, Bradshaw, Colwell and Kennard2000, Reference Totterdell, Struckmeyer, Boreham, Mitchell, Monteil, Bradshaw, Blevin, Bradshaw and Uruski2008). Since the Mid-Eocene, the location of the shelfbreak has remained relatively constant, controlled by a hinge-line that follows the well-established basement fault system associated with the Mesozoic Bight Basin (Figs 2b, 3). Whereas the southern Australian margin, in general, has been subject to compressional forces since the Mid-Eocene (Holford et al. Reference Holford, Hillis, Duddy, Green, Stoker, Tuitt, Backé, Tassone and MacDonald2011a, Reference Holford, Tuitt, Hillis, Green, Stoker, Duddy, Sandiford and Tassone2014), the Eucla Basin has remained largely tectonically stable with only minimal subsidence of the margin (Hegarty et al. Reference Hegarty, Weissel and Mutter1988; Brown et al. Reference Brown, Müller, Struckmeyer, Hill and Bernecker2001; Bradshaw et al. Reference Bradshaw, Rollet, Totterdell and Borissova2003; Totterdell et al. Reference Totterdell, Bradshaw, Willcox, O'Brien and Hibbert2005). Nevertheless, significant disparities in the elevations of correlative nearshore sequences across the basin suggest that it has been subject to differential vertical movements expressed as long-wavelength tilting (west-side-up, east-side-down tilting of ~100–200 m) since the Late Eocene (Hou et al. Reference Hou, Frakes, Sandiford, Worrall, Keeling and Alley2008 and references therein). Some of this relative vertical motion occurred after the Mid-Miocene causing exposure of the Nullarbor Plain and general seaward tilting of the Eucla Basin (Feary & James Reference Feary and James1998). Further mild tectonic deformation is manifest onshore by numerous Late Miocene–Early Pliocene faults that displace the Nullarbor surface between 10 and 30 m (Hillis et al. Reference Hillis, Sandiford, Reynolds, Quigley, Johnson, Doré, Gatliff, Holdsworth, Lundin and Ritchie2008; Hou et al. Reference Hou, Frakes, Sandiford, Worrall, Keeling and Alley2008; Mounsher Reference Mounsher2016).
1.2. Stratigraphy
A stacked succession of Middle Eocene to Pleistocene marine siliciclastic and carbonate rocks extends from the Bunda Plateau onto the Nullarbor Shelf (Lowry Reference Lowry1970; Cockshell et al. Reference Cockshell, Hill and McKirdy1990; Hocking Reference Hocking1990; Benbow et al. Reference Benbow, Lindsay, Alley, Drexel and Preiss1995; Smith & Donaldson Reference Smith and Donaldson1995; Messent et al. Reference Messent, Wilson and Flynn1996; Feary & James Reference Feary and James1998; Totterdell & Krassay Reference Totterdell and Krassay2003) (Fig. 3). On the Bunda Plateau, the stratigraphy of this succession is uniform across much of the basin and comprises a basal, transgressive, shallow-marine sandstone, the Middle Eocene Hampton Sandstone, up to 30 m thick, conformably overlain by the Middle to Upper Eocene Wilson Bluff Limestone; the latter forms part of an up-to-300-m-thick aggrading succession of carbonate-platform rocks that also includes the Upper Oligocene–Lower Miocene Abrakurrie Limestone, the Lower to Middle Miocene Nullarbor Limestone and the ?Upper Pliocene–Lower Pleistocene Roe Calcarenite (Lowry Reference Lowry1970; Hocking Reference Hocking1990; Benbow et al. Reference Benbow, Lindsay, Alley, Drexel and Preiss1995; Clarke et al. Reference Clarke, Gammon, Hou and Gallagher2003; Hou et al. Reference Hou, Alley, Frakes, Stoian and Cowley2006, Reference Hou, Frakes, Sandiford, Worrall, Keeling and Alley2008; James et al. Reference James, Bone, Carter and Murray-Wallace2006) (Fig. 4). Collectively, these units represent the preserved onshore assemblage of the Dugong Supersequence (Totterdell & Krassay Reference Totterdell and Krassay2003). On the eastern margin of the Eucla Basin, the carbonate succession partially interdigitates with marginal- and non-marine deposits of the Lower to Upper Eocene Pidinga Formation (Benbow et al. Reference Benbow, Lindsay, Alley, Drexel and Preiss1995; Alley et al. Reference Alley, Clarke, MacPhail and Truswell1999; Clarke & Hou Reference Clarke and Hou2000; Hou et al. Reference Hou, Alley, Frakes, Stoian and Cowley2006, Reference Hou, Frakes, Sandiford, Worrall, Keeling and Alley2008) (Fig. 4). The main characteristics of all these formations are summarised in Table 1.
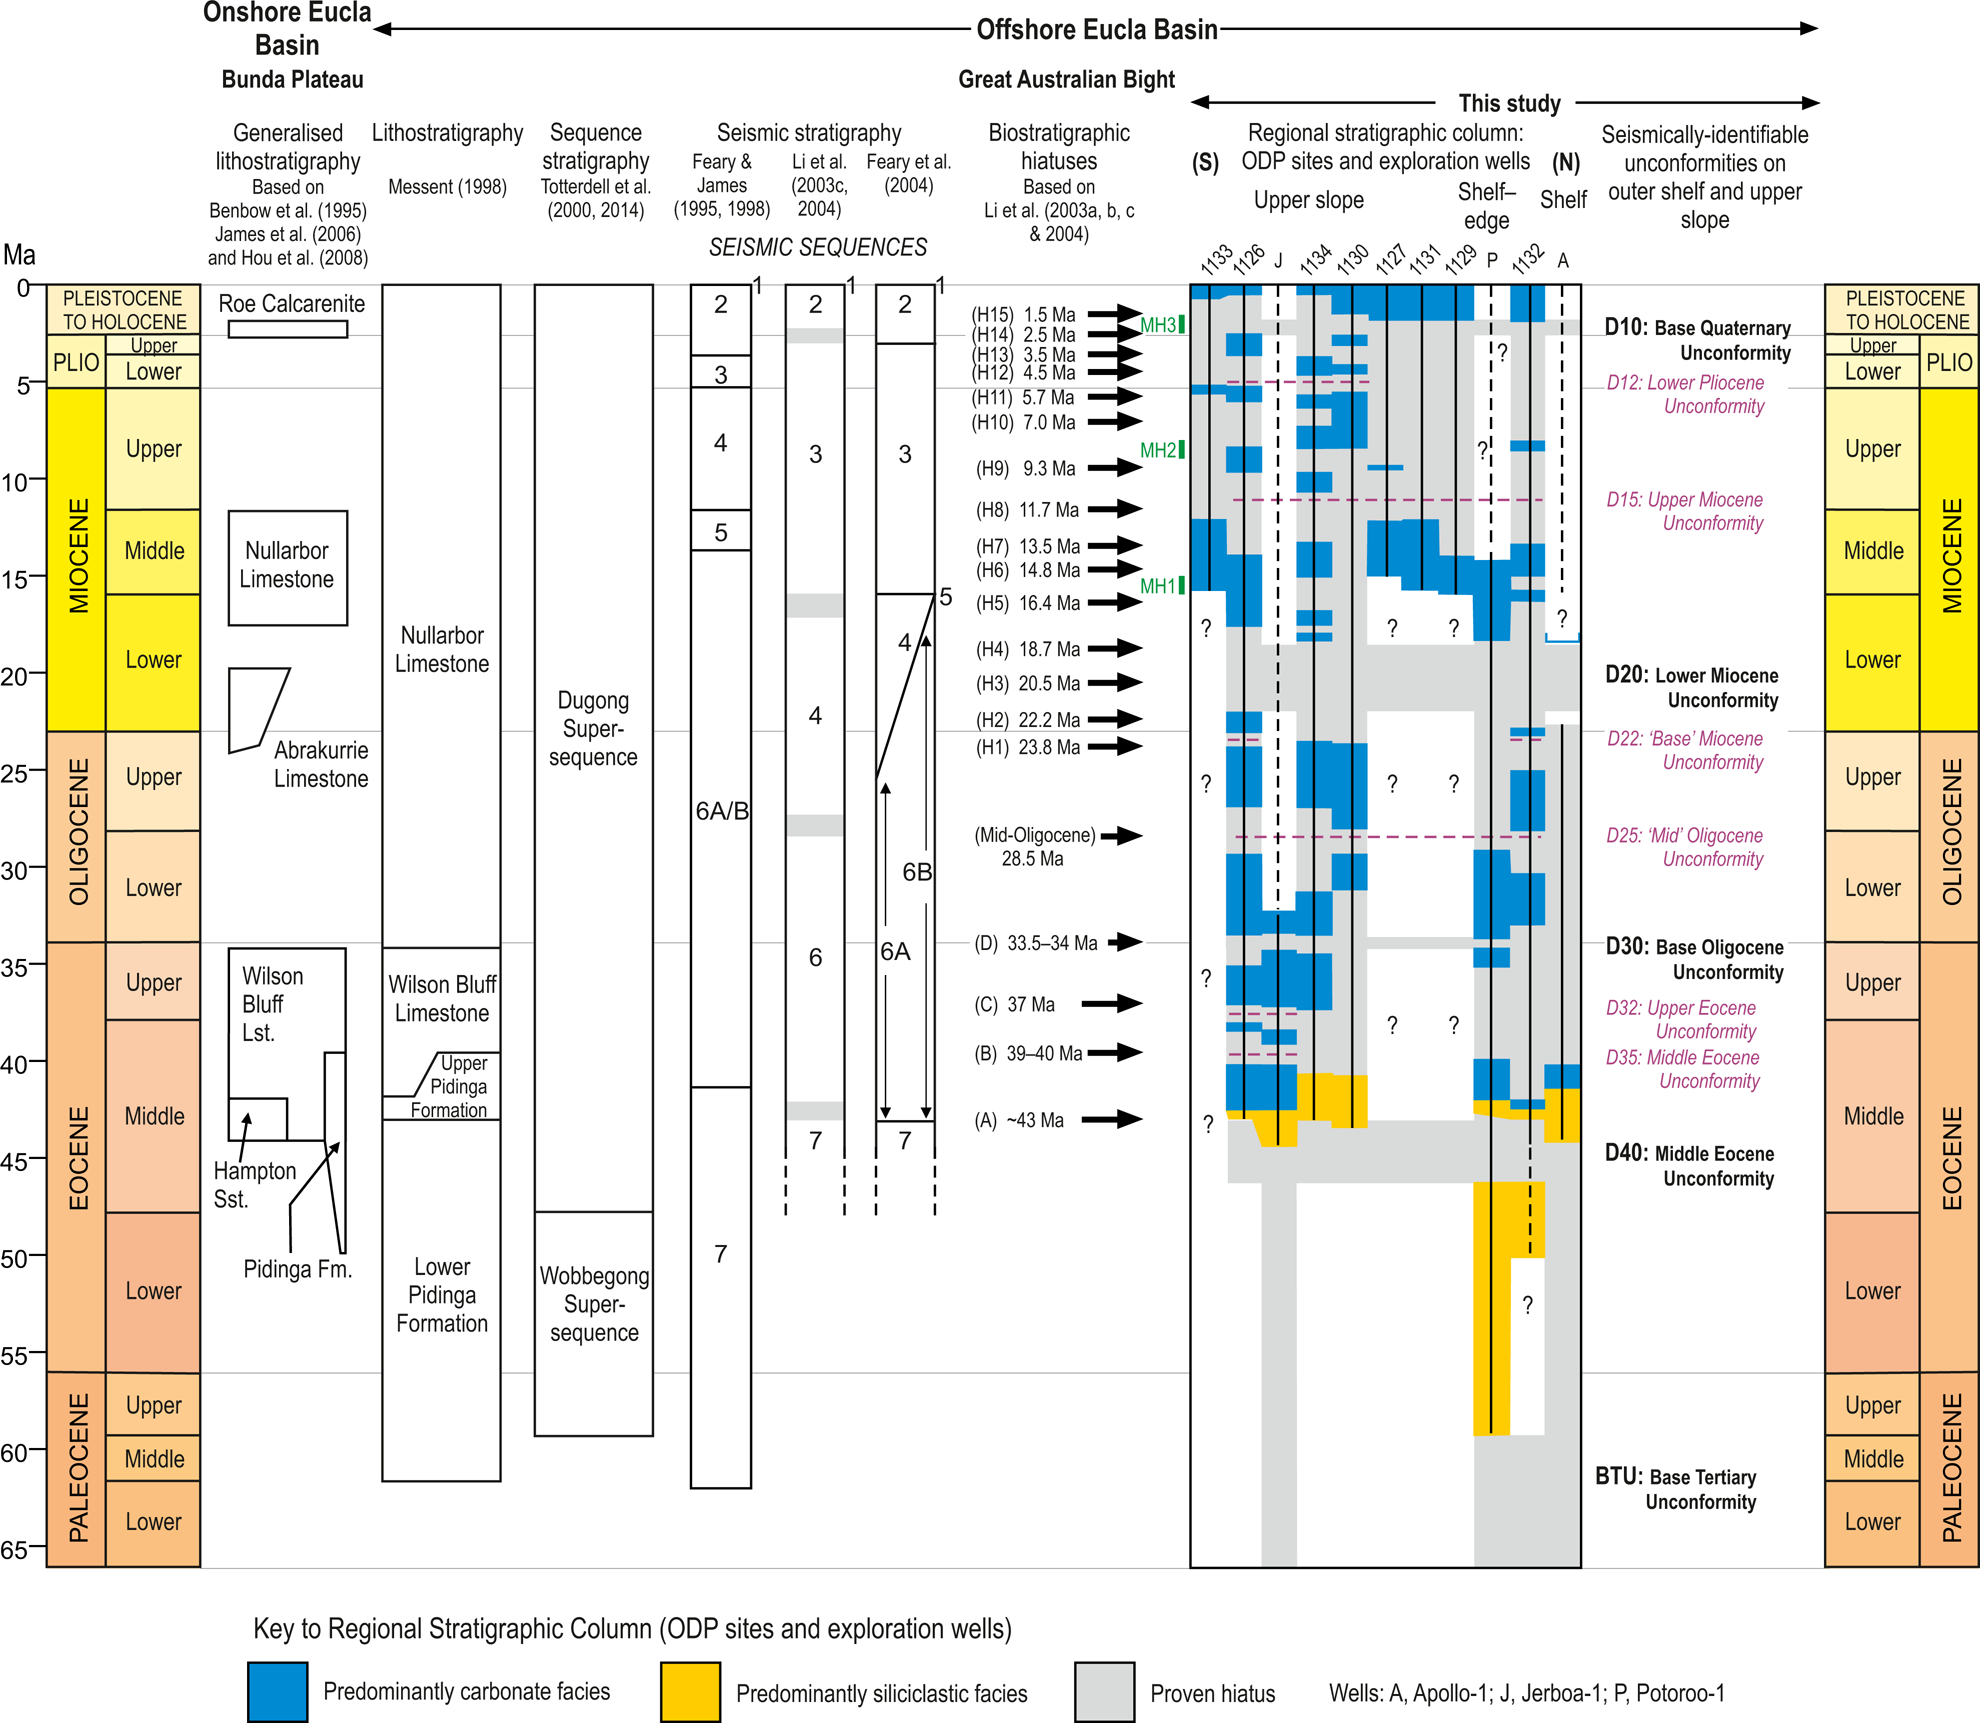
Comparison of stratigraphic schemes for Cenozoic siliciclastic and carbonate rocks for the Eucla Basin, from the Bunda Plateau–GAB region. Regional stratigraphic column summarised from stratigraphic-range chart in Figure 7, including major unconformities (black , bold) mappable from the shelf to the upper slope, and minor unconformities (purple, italics) that are largely restricted to the upper slope. Timescale is from Gradstein et al. (Reference Gradstein, Ogg, Schmitz and Ogg2012).
Summary of the lithology, thickness, depositional environment and age of the main marine–paralic/non-marine stratigraphic units of the Eucla Basin preserved onshore, beneath the Bunda Plateau. Information derived from Lowry (Reference Lowry1970), Hocking (Reference Hocking1990), James & Bone (Reference James and Bone1991), Benbow et al. (Reference Benbow, Lindsay, Alley, Drexel and Preiss1995), Li et al. (Reference Li, James, Bone and McGowran1996), Feary & James (Reference Feary and James1998), Clarke et al. (Reference Clarke, Gammon, Hou and Gallagher2003), Hou et al. (Reference Hou, Alley, Frakes, Stoian and Cowley2006, Reference Hou, Frakes, Sandiford, Worrall, Keeling and Alley2008), James et al. (Reference James, Bone, Carter and Murray-Wallace2006), Fairclough et al. (Reference Fairclough, Benbow and Rogers2007), O'Connell (Reference O'Connell2011), O'Connell et al. (Reference O'Connell, James and Bone2012), Mounsher (Reference Mounsher2016), Jagodzinski et al. (Reference Jagodzinski, Bodorkos, Crowley, Pawley and Wise2019).

On the Nullarbor Shelf, the Dugong Supersequence forms the bulk of a Cenozoic sedimentary wedge that gradually thickens up to 600 milliseconds (msecs) two-way travel time (TWTT) towards the shelf-edge, and locally exceeds 1000 msecs TWTT, beyond which it thins towards the edge of the Eyre and Ceduna terraces (Figs 3, 5). This is equivalent to a near-maximum estimated thickness of 1 km at the shelf-edge based on an interval velocity of 2 kms−1 (see section 2, Data and methods). On seismic profiles, the base of the Dugong Supersequence is a sharp, planar, angular unconformity that truncates the Wobbegong Supersequence and older Mesozoic and Upper Palaeozoic rocks (Totterdell et al. Reference Totterdell, Blevin, Struckmeyer, Bradshaw, Colwell and Kennard2000) (Figs 3, 6). Beneath the Ceduna Terrace, intrusions, volcanogenic edifices and lava flows of the BBIC locally overlie the unconformity and are themselves onlapped by the Dugong Supersequence (Reynolds et al. Reference Reynolds, Holford, Schofield and Ross2017). Despite its regional extent, the Dugong Supersequence represents a relatively sediment-starved continental margin succession. Its maximum drilled thickness occurs along the south-eastern shelf-margin (e.g., Cockshell et al. Reference Cockshell, Hill and McKirdy1990; Bein & Taylor Reference Bein and Taylor1991; Smith & Donaldson Reference Smith and Donaldson1995; Bradshaw et al. Reference Bradshaw, Rollet, Totterdell and Borissova2003; Totterdell & Bradshaw Reference Totterdell, Bradshaw, Boult, Johns and Lang2004) where it exceeds 1000 m in the Greenly-1, Platypus-1, Duntroon-1, Echidna-1 and Vivonne-1 wells and 2000 m in Borda-1 (Fig. 5; Table 2). Farther west, the drilled thickness of the shelf-margin wedge flanking the Eyre Terrace and NW Ceduna Terrace is commonly <1000 m thick as evidenced by the Potoroo-1 and Jerboa-1 wells and the ODP boreholes (Table 2).
Drilled thicknesses (in metres) of the Dugong Supersequence in ODP boreholes and exploration wells in the GAB. ODP data based on information derived from this study's appraisal of the individual site reports in Feary et al. (Reference Feary, Hine and Malone2000). Information for exploration wells derived from Messent (Reference Messent1998) combined with an appraisal of the well completion reports. All ODP sites, except 1126 and 1132, terminated (TD) within the Dugong Supersequence; sites 1126, 1132 and all wells penetrated the supersequence. The borehole and well sites are defined in Figure 1.

Isochron map showing the variation in difference (vertical thickness) of the TWTT between the seabed and basal Cenozoic reflections on the shelf and upper slope. Position of Mid–Miocene ‘Little Barrier Reef’ and distribution of Wobbegong shelf-edge delta, in western GAB, based on Feary & James (Reference Feary and James1995, Reference Feary and James1998). Well abbreviations: A, Apollo-1; B, Borda-1; C, Columbia-1; D, Duntroon-1; E, Echidna-1; Ge, Gemini-1A; Gn, Gnarlyknots-1/1A; Gr, Greenly-1; J, Jerboa-1; M, Mercury-1; Pl, Platypus-1; Po, Potoroo-1; V, Vivonne-1.

Interpreted seismic reflection profiles showing the generalised Cenozoic seismic-stratigraphical framework across the western GAB, the main seismically mappable unconformable boundaries (D10–D40 and the BTU, Base Tertiary Unconformity; D12, upper slope only), and the internal seismic reflection configuration of the Wobbegong and Dugong supersequences. Abbreviations: Mz, Mesozoic; sb, shelfbreak. Location of profiles shown in Figure 1. Inset boxes expanded in Figures 8 and 9 provide further details of the outer shelf–upper slope stratigraphy calibrated with ODP boreholes and the Jerboa-1 well. Vertical exaggeration (VE) at seabed ~×20.

Offshore, the basal transgressive sandstone was termed the Upper Pidinga Formation (Smith & Donaldson Reference Smith and Donaldson1995; Messent Reference Messent1998) whereas the overlying carbonate succession currently comprises the previously defined seismic-stratigraphic sequences 1–6 of Feary & James (Reference Feary and James1995, Reference Feary and James1998) and Feary et al. (Reference Feary, Hine, James, Malone, Hine, Feary and Malone2004) (Fig. 4). The current structural disposition of the Dugong Supersequence – a seaward-dipping homocline – has facilitated the exposure of rocks associated with the Middle Eocene–Middle Miocene carbonate platform (currently assigned as sequence 6B in the scheme of Feary & James Reference Feary and James1995, Reference Feary and James1998) on the inner part of the Nullarbor Shelf. Seabed sampling has recovered limestone fragments correlatable with the Eocene Wilson Bluff Limestone Formation to about 35 km from the coastline; however, the interpretation of ‘Miocene’ limestone fragments as belonging to the Abrakurrie Limestone and/or Nullarbor Limestone formations is ambiguous due to the lack of diagnostic biomarkers (Feary et al. Reference Feary, Birch and Boreen1993; James et al. Reference James, Boreen, Bone and Feary1994). This lack of stratigraphic resolution also prevails on seismic reflection profiles. Whereas the carbonate platform succession is generally well-imaged, the lower stratigraphic resolution of these data has resulted in a simplified two-fold lithostratigraphic subdivision generally being applied to this succession, particularly in the eastern GAB, where the Nullarbor Limestone is commonly represented as unconformably overlying the Wilson Bluff Limestone (Cockshell et al. Reference Cockshell, Hill and McKirdy1990; Smith & Donaldson Reference Smith and Donaldson1995; Messent et al. Reference Messent, Wilson and Flynn1996; Messent Reference Messent1998) (Fig. 4).
In the western GAB, a tentative subdivision of the carbonate platform succession beneath the inner shelf was proposed by Feary & James (Reference Feary and James1995, Reference Feary and James1998), who described the lower part of the platform as a carbonate ramp correlatable with the Middle–Upper Eocene Wilson Bluff Limestone Formation, whereas the upper section of the platform is interpreted as a carbonate rimmed shelf and assigned as equivalent to the upper Lower–Middle Miocene Nullarbor Limestone Formation (Fig. 6). They further speculated, initially, that the offshore equivalent of the Upper Oligocene–Lower Miocene Abrakurrie Limestone Formation correlated with the uppermost part of the ramp phase (Feary & James Reference Feary and James1995); subsequently, it was proposed that the basal unconformity of the Abrakurrie Limestone Formation corresponded to the transition from the ramp phase to the rim phase (Feary & James Reference Feary and James1998). However, given the relatively restricted occurrence of the Abrakurrie Limestone Formation onshore (Lowry Reference Lowry1970; Hou et al. Reference Hou, Frakes, Sandiford, Worrall, Keeling and Alley2008), its offshore extent – whilst generally assumed (Feary & James Reference Feary and James1995, Reference Feary and James1998) – might be equally limited and/or absent. For example, in the Apollo-1 well (Figs 1, 7), biostratigraphic data indicate that the limestone directly overlying the Middle–Upper Eocene Wilson Bluff Limestone Formation is no older than 18.7 Ma, and thus correlated with the Nullarbor Limestone Formation (Messent Reference Messent1998).
Cenozoic stratigraphy of the western GAB indicating stratigraphical range, thickness, generalised lithofacies of the preserved rocks, major (grey) and minor (purple) unconformities (D10–D40 and BTU) and age of the underlying strata. Timescale and temporal ranges of the standard calcareous nannoplankton and planktonic foraminiferal biozones are those of Gradstein et al. (Reference Gradstein, Ogg, Schmitz and Ogg2012); the South Australian Neogene planktonic foraminifer biozonation is from Li et al. (Reference Li, McGowran and Brunnur2003b, Reference Li, Simo, McGowran and Holbourn2004). The biostratigraphic information was sourced as follows: the ODP Leg 182 sites – Feary et al. (Reference Feary, Hine and Malone2000), Shipboard Scientific Party (2000a, b, c, e, f, g, h, i, j) and Li et al. (Reference Li, James and McGowran2003a, Reference Li, McGowran and Brunnurb, Reference Li, McGowran and Jamesc, Reference Li, Simo, McGowran and Holbourn2004); the Jerboa-1, Potoroo-1 and Apollo-1 wells – Well Completion Reports (NOPIMS), Messent (Reference Messent1998), Totterdell et al. (Reference Totterdell, Blevin, Struckmeyer, Bradshaw, Colwell and Kennard2000), Li et al. (Reference Li, James and McGowran2003a), Morgan et al. (Reference Morgan, Rowett, White, O'Brien, Paraschivoiu and Hibbert2005) and Hou et al. (Reference Hou, Alley, Frakes, Stoian and Cowley2006).

Seaward of the Mid-Miocene ‘Little Barrier Reef’, the Middle Eocene–Middle Miocene carbonate platform succession on the outer shelf and upper slope is described as a deep-water carbonate sediment apron (sequences 4–6A of Feary & James Reference Feary and James1995, Reference Feary and James1998), which is capped by a Neogene–Quaternary arrangement of aggradational to sigmoidal sequences (1–3 of Feary & James Reference Feary and James1995, Reference Feary and James1998) (Fig. 6). Based on ODP leg 182 boreholes, Li et al. (Reference Li, James and McGowran2003a, Reference Li, McGowran and Brunnurb, Reference Li, McGowran and Jamesc, Reference Li, Simo, McGowran and Holbourn2004) reported up to 20 biostratigraphic hiatuses from within this Middle Palaeogene (Eocene A–D, Mid Oligocene) to Neogene–Quaternary (H1–H15) shelf-margin succession (Fig. 4), each lasting ~0.5 Myr or more, and all interpreted to coincide with major third-order sequence boundaries. This series of unconformities was interpreted to reflect a eustasy-driven model of continental margin sedimentation (Li et al. Reference Li, James and McGowran2003a, Reference Li, Simo, McGowran and Holbourn2004). In addition, three ‘mega-hiatuses’ at about 15–16 Ma, 8–9 Ma and 1.5–2.5 Ma, each inferred to last >5 Myr (at selected sites), have been attributed to large-scale slope failure (Li et al. Reference Li, Simo, McGowran and Holbourn2004).
On the lower slope, the Cenozoic succession is commonly thin-to-absent; site U1512 of the International Ocean Discovery Program (IODP) (Fig. 5) proved a 10-m-thick section of Upper Pleistocene sediments unconformable on Upper Cretaceous rocks (Huber et al. Reference Huber, Hobbs, Bogus, Batenburg, Brumsack, do Monte Guerra, Edgar, Edvardsen, Garcia Tejada, Harry, Hasegawa, Haynes, Jiang, Jones, Kuroda, Lee, Li, MacLeod, Maritati, Martinez, O'Connor, Petrizzo, Quan, Richter, Riquier, Tagliaro, Wainman, Watkins, White, Wolfgring and Xu2019). By way of contrast, at the foot of the slope, an up-to-500–600-m-thick sequence is locally preserved (Bradshaw et al. Reference Bradshaw, Rollet, Totterdell and Borissova2003; Totterdell & Bradshaw Reference Totterdell, Bradshaw, Boult, Johns and Lang2004) (Fig. 3). ODP site 1128 proved at least 452 m of Middle Eocene–Quaternary sediments, including mass-flow deposits, in the upper part of the foot-of-slope succession (Shipboard Scientific Party 2000d). Whereas these deposits are correlatable with the Dugong Supersequence (Shipboard Scientific Party 2000d), regional studies (Bradshaw et al. Reference Bradshaw, Rollet, Totterdell and Borissova2003; Totterdell & Bradshaw Reference Totterdell, Bradshaw, Boult, Johns and Lang2004; Sauermilch et al. Reference Sauermilch, Whittaker, Bijl, Totterdell and Jokat2019) suggest that slope sediments attributable to both Wobbegong and Dugong supersequences are probably preserved along the foot of the slope, albeit largely undivided.
1.3. Modern oceanographic setting
The present-day shelf and slope of the GAB are influenced by two northern boundary currents: (1) an eastward-flowing shelfbreak surface-current system including the Leeuwin and South Australian currents; and (2) the wider and deeper-reaching counter-flowing westward Flinders Current (Richardson et al. Reference Richardson, Middleton, Kyser, James and Opdyke2019; Duran et al. Reference Duran, Phillips, Furue, Spence and Bindoff2020) (Fig. 1). The main characteristics of these currents are presented in Table 3. The Leeuwin Current originates off NW Australia and flows southward, transporting subtropical surface water to Cape Leeuwin and then eastward along the shelfbreak and uppermost slope into the western GAB (124°E), beyond which the South Australian Current runs in extension of the Leeuwin Current from the central GAB to Kangaroo Island (Fig. 1). The Leeuwin Current exhibits a seasonal behaviour, being strongest in winter but effectively disappearing from the GAB in the summer, retarded by westward summer winds (Middleton & Bye Reference Middleton and Bye2007; Duran et al. Reference Duran, Phillips, Furue, Spence and Bindoff2020).
Summary of the characteristics of the main modern-day southern Australian currents that bathe the shelf and slope of the GAB. Information derived from Cresswell & Petersen (Reference Cresswell and Petersen1993), James et al. (Reference James, Bone, Collins and Kyser2001), Middleton & Cirano (Reference Middleton and Cirano2002), Cirano & Middleton (Reference Cirano and Middleton2004), Cresswell & Griffin (Reference Cresswell and Griffin2004), Ridgeway & Condie (Reference Ridgeway and Condie2004), McCartney & Donohue (Reference McCartney and Donohue2007), Middleton & Bye (Reference Middleton and Bye2007), Cresswell & Dominguez (Reference Cresswell and Dominguez2009), Feng et al. (Reference Feng, Waite and Thompson2009), Petrusevics et al. (Reference Petrusevics, Bye, Fahlbusch, Hammat, Tippins and van Wijk2009), Yao & Shi (Reference Yao and Shi2017), Wijeratne et al. (Reference Wijeratne, Pattiaratchi and Proctor2018), Richardson et al. (Reference Richardson, Middleton, Kyser, James and Opdyke2019) and Duran et al. (Reference Duran, Phillips, Furue, Spence and Bindoff2020).

The Flinders Current is forced by the general anticyclonic circulation in the South Australia Basin, with the eastward-flowing Antarctic Circumpolar Current (ACC) forming the southern limb and the westward-flowing Flinders Current forming the northern limb (Middleton & Cirano Reference Middleton and Cirano2002; McCartney & Donohue Reference McCartney and Donohue2007; Wijeratne et al. Reference Wijeratne, Pattiaratchi and Proctor2018) (Fig. 1a). The Flinders Current emerges southwest of Tasmania and entrains and transports cold shallow-to-intermediate Subantarctic water masses equatorward from within the Subantarctic Zone, as well as via the Tasman Outflow (Richardson et al. Reference Richardson, Middleton, Kyser, James and Opdyke2019) (Fig. 1a). Adjacent to the southern Australian continental margin, the Flinders Current flows along the upper slope, including the Eyre Terrace, and is strongest and most continuous in summer, increasing in magnitude from E to W (Cresswell & Petersen Reference Cresswell and Petersen1993; Middleton & Bye Reference Middleton and Bye2007; Richardson et al. Reference Richardson, Middleton, Kyser, James and Opdyke2019) (Table 3). This cold and nutrient-rich water can move upwards onto the shelf when the Leeuwin Current weakens during summer months (James et al. Reference James, Bone, Collins and Kyser2001; Richardson et al. Reference Richardson, Middleton, Kyser, James and Opdyke2019).
1.4. Palaeoceanography
Reconstruction of the palaeocirculation during the Cenozoic is still a matter of considerable discussion. A warm-water microfauna in Middle–Upper Eocene rocks in the Eucla Basin led McGowran et al. (Reference McGowran, Li, Cann, Padley, McKirdy and Shafik1997) to speculate the early presence (35–42 Ma) of a ‘proto-Leeuwin Current’ that transported this fauna from warm low latitudes to the southern Australian margin, then situated at about 60°S (Norvick & Smith Reference Norvick and Smith2001; Bijl et al. Reference Bijl, Bendle, Bohaty, Pross, Schouten, Tauxe, Stickley, McKay, Röhl, Olney, Sluijs, Escutia and Brinkhuis2013). However, a pre-Oligocene initiation of a Leeuwin Current-type ‘current’ is disputed given that a circum-circular oceanic circulation that facilitated eastward flow of warm ocean waters probably did not occur until the Early Oligocene following the deepening of the Tasmanian Gateway (Stickley et al. Reference Stickley, Brinkhuis, Schellenberg, Sluijs, Röhl, Fuller, Grauert, Huber, Warnaar and Williams2004; Wyrwoll et al. Reference Wyrwoll, Greenstein, Kendrick and Chen2009; Scher et al. Reference Scher, Whittaker, Williams, Latimer, Kordesch and Delaney2015). Further incursions of anomalously warm water into the GAB, as revealed by the later Paleogene–Neogene biostratigraphic record at third-order scale, have also been attributed to a proto-Leeuwin Current (McGowran et al. Reference McGowran, Li, Cann, Padley, McKirdy and Shafik1997; Stickley et al. Reference Stickley, Brinkhuis, Schellenberg, Sluijs, Röhl, Fuller, Grauert, Huber, Warnaar and Williams2004). In contrast, Wyrwoll et al. (Reference Wyrwoll, Greenstein, Kendrick and Chen2009) have suggested that the Leeuwin Current sensu stricto was only established around 3–4 Ma when the Indonesian Gateway took on its present form and provided a passageway for Indonesian Throughflow – a major contributor to the source region of the Leeuwin Current.
The association of the Flinders Current with the ACC as part of the general anticyclonic circulation in the South Australia Basin suggests that it is no older than Early Oligocene following the deepening of the Tasmanian Gateway and the establishment of the circum-Antarctic currents (Exon et al. Reference Exon, Kennett and Malone1999; Norvick & Smith Reference Norvick and Smith2001). Sangiorgi et al. (Reference Sangiorgi, Bijl, Passchier, Salzmann, Schouten and McKay2018) state that the modern Southern Ocean circulation possibly developed during the Mid-Miocene Climatic Optimum (17–14.8 Ma). However, in common with the ACC, the Flinders Current may not have attained its present-day strength until after the Mid-Miocene (~11 Ma) (Bijl et al. Reference Bijl, Houben, Hartman, Pross, Salabarnada, Escutia and Sangiorgi2018; Sangiorgi et al. Reference Sangiorgi, Bijl, Passchier, Salzmann, Schouten and McKay2018). During the Quaternary, the history of the Leeuwin Current in the GAB reflects climatically induced changes linked to the glacial–interglacial cyclicity, whereby activity was strongest during interglacial stages (McGowran et al. Reference McGowran, Li, Cann, Padley, McKirdy and Shafik1997; Wyrwoll et al. Reference Wyrwoll, Greenstein, Kendrick and Chen2009; Anderskouv et al. Reference Anderskouv, Surlyk, Huuse, Lykke-Andersen, Bjerager and Tang2010). In contrast, the Flinders Current was probably strengthened during glacial stages because of an intensification and/or northward shift of the glacial atmospheric system in the Southern Ocean (Middleton & Cirano Reference Middleton and Cirano2002; Hesse et al. Reference Hesse, Magee and van der Kaars2004). At the same time, colder and drier winds might also have augmented the formation of dense water in the inner GAB, including the formation of the South Australian Current which, in the absence of the Leeuwin Current, would probably remain focused at the shelfbreak (Anderskouv et al. Reference Anderskouv, Surlyk, Huuse, Lykke-Andersen, Bjerager and Tang2010).
2. Data and methods
The stratigraphic interpretation presented in this study is based primarily on a re-examination of regional 2D seismic reflection data and 11 sample stations (eight ODP boreholes and three commercial wells) from the western GAB (Fig. 1). The seismic-reflection lines used in this study were acquired and processed by the Japan National Oil Corporation (JNOC) in 1990 and 1991, and provide a series of N–S transects extending from the Nullarbor Shelf onto the Eyre Terrace (upper continental slope). An additional set of lines covering the central and eastern GAB (Fig. 1) were also referred to and utilised to enable the compilation of the Cenozoic isochron map (Fig. 5). These seismic datasets were loaded into Kingdom seismic and geological interpretation software and can be obtained from the National Offshore Petroleum Information Management System (NOPIMS, https://www.ga.gov.au/nopims).
The sample data comprise ODP sites 1126, 1127, 1129–1134 and the Jerboa-1, Potoroo-1 and Apollo-1 wells (Fig. 1). In Figure 7, the information derived from these sample sites is presented as a stratigraphic-range chart with the sites arranged as a N–S shelf-to-upper-slope transect and displaying generalised lithofacies, thickness and chronostratigraphic range; the latter is based on biostratigraphic correlation of the sample sites with the planktonic foraminifera and calcareous nannofossil biozonal schemes of Gradstein et al. (Reference Gradstein, Ogg, Schmitz and Ogg2012), and the South Australian Neogene (SAN) planktonic foraminifer biozonation of Li et al. (Reference Li, McGowran and Brunnur2003b, Reference Li, Simo, McGowran and Holbourn2004). Whereas Figure 7 represents a revision of previous charts that include the SAN zones, their calibration to the standard zonation of planktonic foraminifers (N zones) is herein maintained. In this study, information on lithology, planktonic foraminifera and calcareous nannofossils for all investigated ODP sites was sourced primarily from the Initial Results Volume 182 (Feary et al. Reference Feary, Hine and Malone2000; Shipboard Scientific Party 2000a, b, c, e, f, g, h, i, j), with additional analysis of the planktonic foraminifera of sites 1126, 1130, 1132 and 1134 provided by the Scientific Results Volume 182 (Li et al. Reference Li, McGowran and Brunnur2003b, c; Hine et al. Reference Hine, Feary and Malone2004) and resulting published papers (Li et al. Reference Li, James and McGowran2003a, Reference Li, Simo, McGowran and Holbourn2004). Lithologic and biostratigraphic information for the Jerboa-1, Potoroo-1 and Apollo-1 wells was gathered from the various well completion reports, accessed from NOPIMS, and published information (Messent Reference Messent1998; Totterdell et al. Reference Totterdell, Blevin, Struckmeyer, Bradshaw, Colwell and Kennard2000; Li et al. Reference Li, James and McGowran2003a; Morgan et al. Reference Morgan, Rowett, White, O'Brien, Paraschivoiu and Hibbert2005; Hou et al. Reference Hou, Alley, Frakes, Stoian and Cowley2006). Whereas biostratigraphic resolution and correlation is variable across the dataset, Figure 7 depicts stratigraphic calibration that represents high-confidence biozone placements – essentially, proven stratigraphic range – based on the identification of ‘common overlap zones’ between calcareous nannofossil and planktonic foraminifera.
The integration of the stratigraphic-range chart with regional 2D seismic reflection lines provided the basis for the appraisal of the seismic stratigraphy of the Nullarbor Shelf and Eyre Terrace (upper slope) described in this paper. Four key seismic reflection lines – Ja90-19, −23, −27 and −31 – were re-interpreted and calibrated with the ODP sites (Figs 6, 8, 9). In the construction of the regional stratigraphic framework, emphasis was placed on the identification of depositional packages bounded by seismically mappable surfaces of discontinuity according to the criteria established by Mitchum et al. (Reference Mitchum, Vail, Sangree and Payton1977). Based on this process, a common set of five major seismic reflectors – representing regional (shelf-to-slope) unconformities – have been identified: D10 (Base Quaternary Unconformity); D20 (Lower Miocene Unconformity); D30 (Base Oligocene Unconformity); D40 (Middle Eocene Unconformity; and BTU (Base Tertiary Unconformity) (Figs 4, 6–9). The prefix ‘D’ denotes those reflectors specific to the Dugong Supersequence, whereas the BTU represents the overall base of the Cenozoic succession and is commonly a composite unconformity surface. In addition, a further ten minor reflectors are identified and calibrated within the Dugong Supersequence (Figs 7–9). These are largely restricted to the upper slope, though the Upper Miocene D15 boundary is locally identifiable on the outer shelf (Figs 8b, c). The four major boundaries, D10–D40, divide the supersequence at Series level into, respectively, Quaternary, upper Lower–Upper Miocene, Oligocene–lowest Miocene and Middle–Upper Eocene sequences (Fig. 7). The exception is the Pliocene sequence on the upper slope, which can be identified as a distinct, albeit localised, unit bounded by the D10 and D12 reflectors (Fig. 8b). Summary descriptions of all these unconformities and the stratigraphic sequences are presented in Tables 4 and 5.
Seismic reflection profiles and accompanying interpretations from the western GAB showing the seismic-stratigraphic architecture of the Dugong Supersequence beneath the outermost shelf–upper slope (a, b) and the mid-shelf region (c), highlighting the main mappable outer shelf-upper slope unconformities (bold) and the more localised minor unconformities (italics) largely restricted to the upper slope. (a) Interpreted and uninterpreted seismic profile Ja90-19 calibrated with ODP borehole 1134. (b, c) Interpreted and uninterpreted seismic profile Ja90-23 calibrated in (b) with ODP boreholes 1130 and 1132, and the Jerboa-1 well. Locations of profiles shown in Figure 6. Abbreviations: Mz, Mesozoic; sb, shelfbreak; sw sediment waves. VE at seabed ~×15.
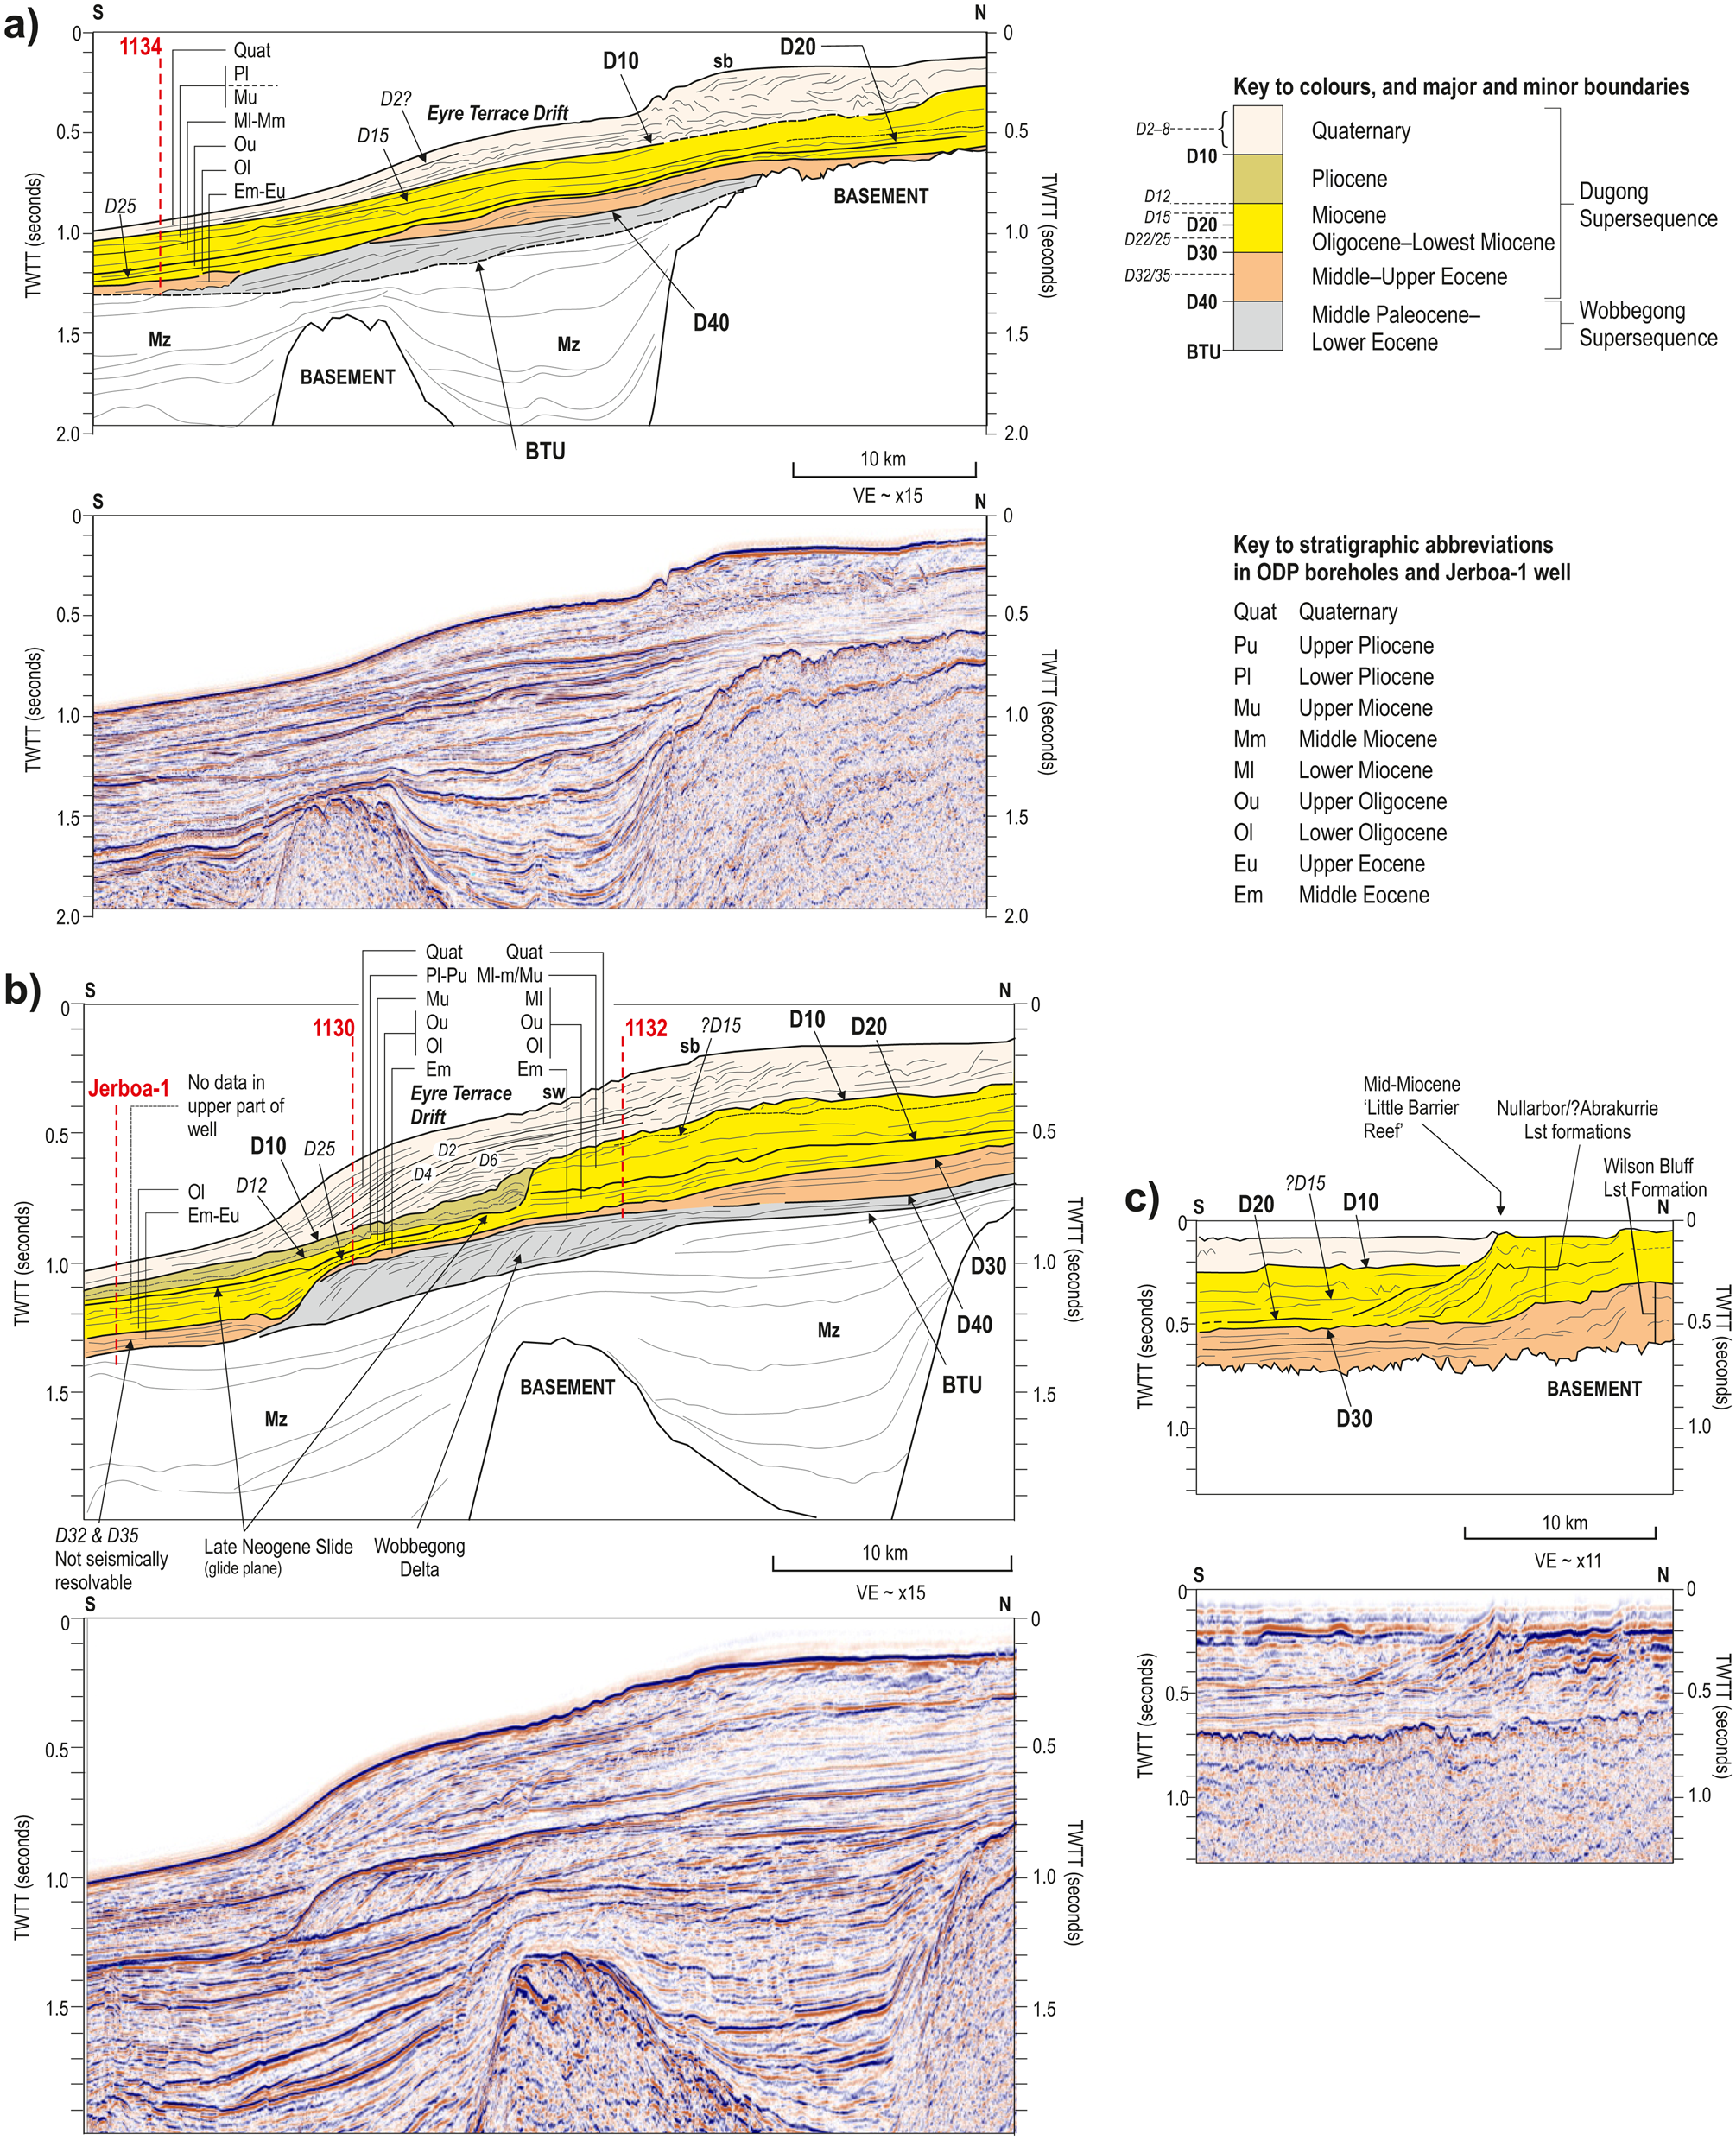
Seismic reflection profiles and accompanying interpretations from the western GAB showing the seismic-stratigraphic architecture of the Dugong Supersequence beneath the outermost shelf–upper slope, highlighting the main mappable outer shelf-upper slope unconformities (bold) and the more localised minor unconformities (italics) largely restricted to the upper slope. (a) Interpreted and uninterpreted seismic profile Ja90-27 calibrated with ODP borehole 1126. (b) Interpreted and uninterpreted seismic profile Ja90-31 calibrated with ODP boreholes 1127, 1129 and 1131. Locations of profiles shown in Figure 6. Abbreviations: Mz, Mesozoic; sb, shelfbreak; sw sediment waves. VE at seabed ~×15.

Summary characteristics of the main seismically mappable unconformities (bold notation) and the localised minor unconformities (italicised notation) in the western GAB. Tentative age of the Pliocene to Palaeocene unconformities is derived from the biostratigraphic data presented in Figure 7, with the approximate stratigraphic range of the hiatus, both chronological and biostratigraphic (calcareous nannofossil and planktonic foraminifera), based on the age of the oldest overlying, and youngest underlying sediments. The dating of the various Quaternary unconformities is based on a combination of biostratigraphic, marine oxygen isotopic and magnetostratigraphic data derived from Brunnur et al. (Reference Brunnur, Andres, Holbourn, Siedlecki, Brooks, Molina-Garza, Fuller, Ladner, Hine, Li, Hine, Feary and Malone2002), Holbourn et al. (Reference Holbourn, Kuhnt and James2002), Ladner (Reference Ladner2002) and Fuller et al. (Reference Fuller, Molina-Garza, Antretter and Lichowski2003).

Summary of the seismic reflection configuration patterns and lithologies that characterise the Middle Eocene–Quaternary stratigraphic sequences in the western GAB. Seismic reflection patterns based primarily on this study, with additional information derived from Feary & James (Reference Feary and James1995, Reference Feary and James1998) and Sharples et al. (Reference Sharples, Huuse, Hollis, Totterdell and Taylor2014). Lithological information for ODP sites derived from Shipboard Scientific Party (2000a, b, c, e, f, g, h, i, j) and Well Completion Reports for Apollo-1, Jerboa-1 and Potoroo-1 wells.

Figure 4 shows the relationship between our revised and integrated stratigraphic framework of the Dugong Supersequence compared to the existing and separate seismic stratigraphic and biostratigraphic schemes. Whereas we can broadly recognise the sequence 1–6 stratigraphic subdivision presented by Feary & James (Reference Feary and James1995, fig. 2; Reference Feary and James1998, fig. 5) and Feary et al. (Reference Feary, Hine, James, Malone, Hine, Feary and Malone2004, fig. F2) our seismic interpretation is perceptibly different in terms of the configuration and extent of depositional units, their chronostratigraphic assignment and their correlation from shelf to slope (cf. Fig. 10). Regarding the Middle Palaeogene to Neogene–Quaternary biostratigraphic hiatuses of Li et al. (Reference Li, James and McGowran2003a, Reference Li, McGowran and Brunnurb, Reference Li, McGowran and Jamesc, Reference Li, Simo, McGowran and Holbourn2004) (Fig. 4), we remain cautious of the status and significance assigned to the bulk of the 20 unconformities and three mega-hiatuses proposed by these workers, based on ODP sites 1126, 1130, 1132 and 1134, as nowhere have they presented a correlation of these boundaries with seismic reflection data. Consequently, the existing scheme of unconformities lacks stratigraphic context beyond the limit of the borehole(s) in which they have been identified. Based on our integrated interpretation, we demonstrate that most of their hiatuses have limited expression on the upper slope and argue against the basic premise of Li et al. (Reference Li, James and McGowran2003a, Reference Li, Simo, McGowran and Holbourn2004) that the hiatuses are all globally correlatable. For purposes of clarification, a tentative correlation between the two schemes is indicated in Table 6, and this issue is further considered in section 5.2 (Discussion).
Schematic section summarising the main characteristics of the Cenozoic stratigraphic framework on the western Nullarbor Shelf and adjacent upper slope (see text for details.) VE ~×30.

Tentative correlation of Mid-Palaeogene–Quaternary unconformities utilised in this study with those previously proposed by Li et al. (Reference Li, James and McGowran2003a, Reference Li, McGowran and Brunnurb, Reference Li, McGowran and Jamesc, Reference Li, Simo, McGowran and Holbourn2004). Name of hiatus highlighted in bold represents confident correlation between studies; italic notation represents hiatuses in existing scheme uncorroborated by present study (see text for further details). Global sequence boundaries are those of Hardenbol et al. (Reference Hardenbol, Thierry, Farley, Jacquin, De Graciansky, Vail, De Graciansky, Hardenbol, Jacquin and Vail1998).

Vertical thicknesses based on seismic reflection data are presented in msecs TWTT. P-wave velocities measured across the Cenozoic succession on the outer shelf/upper slope of the western GAB are generally in the range of 1.5–2.2 kms−1 (Feary et al. Reference Feary, Hine and Malone2000; Shipboard Scientific Party 2000a). For ease of calibration, a general interval velocity of 2 kms−1 has been applied to the Cenozoic succession on the outer margin, so that thicknesses given here in msecs TWTT can be taken as near-maximum estimates in metres (e.g., 500 msecs TWTT is ≈500 m). In Figure 5, the distribution of the isochrons is consistent with drilled thicknesses proved by the ODP and IODP boreholes and petroleum exploration wells.
3. Stratigraphical framework of the Dugong Supersequence
The distribution, configuration and stratigraphical range of the Dugong Supersequence in the western GAB are depicted in Figures 5–7. Whereas Figure 5 illustrates the generalised distribution and thickness of the entire Cenozoic succession on the Nullarbor Shelf and adjacent upper slope, we interpret this pattern to largely reflect the configuration of the Dugong Supersequence for several reasons: the underlying Wobbegong Supersequence is discontinuous across the shelf (Smith & Donaldson Reference Smith and Donaldson1995); it is largely confined to the outer shelf as a relatively narrow and buried shelf-edge delta (Feary & James Reference Feary and James1998; Sharples et al. Reference Sharples, Huuse, Hollis, Totterdell and Taylor2014); and it forms only a patchy veneer on the Eyre and Ceduna terraces (cf. Totterdell et al. Reference Totterdell, Blevin, Struckmeyer, Bradshaw, Colwell and Kennard2000; Bradshaw et al. Reference Bradshaw, Rollet, Totterdell and Borissova2003; Totterdell & Krassay Reference Totterdell and Krassay2003; Totterdell & Bradshaw Reference Totterdell, Bradshaw, Boult, Johns and Lang2004) (Figs 3, 6). Although the shelf-edge delta is locally up to 400 msecs TWTT in thickness (Sharples et al. Reference Sharples, Huuse, Hollis, Totterdell and Taylor2014), this coincides with the thickest (>1000 msecs TWTT) part of the shelf-margin succession (Fig. 5). Thus, the mounded and locally wavy pattern of accumulation depicted by the outer shelf–upper slope contours largely reflects margin-shaping processes linked to the Dugong Supersequence, especially the Quaternary sequence (Fig. 6).
On seismic profiles, the base of the Dugong Supersequence is marked by a moderate-to-high-amplitude reflection that represents a regional hiatus (Totterdell et al. Reference Totterdell, Blevin, Struckmeyer, Bradshaw, Colwell and Kennard2000; Bradshaw et al. Reference Bradshaw, Rollet, Totterdell and Borissova2003; Totterdell & Krassay Reference Totterdell and Krassay2003; Totterdell & Bradshaw Reference Totterdell, Bradshaw, Boult, Johns and Lang2004) (Figs 8, 9). This basal reflection marks a composite unconformity incorporating the merged D40 and BTU unconformities (Table 4). The overlying Middle–Upper Eocene rocks rest on a range of older rocks, including Palaeocene–Lower Eocene (Wobbegong Supersequence), Cretaceous, Permian(?) and Precambrian basement (Totterdell et al. Reference Totterdell, Blevin, Struckmeyer, Bradshaw, Colwell and Kennard2000; Totterdell & Krassay Reference Totterdell and Krassay2003) (Figs 3, 6). Totterdell et al. (Reference Totterdell, Blevin, Struckmeyer, Bradshaw, Colwell and Kennard2000, Reference Totterdell, Struckmeyer, Bernecker and Kelman2014) placed the Dugong/Wobbegong supersequence boundary – our D40 reflection – at the Ypresian/Lutetian boundary, whereas Li et al. (Reference Li, James and McGowran2003a) suggested an intra-Lutetian age (~43 Ma) for the base of the carbonate succession. Reappraisal of spore pollen and dinoflagellate cyst data from the Potoroo-1 well (cf. Morgan et al. Reference Morgan, Rowett, White, O'Brien, Paraschivoiu and Hibbert2005) indicates that the clastic section equivalent to the Wobbegong Supersequence is no younger than the top of the Proteacidites asperopolus spore pollen zone. The top of this zone corresponds to the base of the NP15 calcareous nannofossil zone (Morgan et al. Reference Morgan, Rowett, White, O'Brien, Paraschivoiu and Hibbert2005, fig. 5.5) which is at ~46.2 Ma (Fig. 7). In consideration of all these data, we have tentatively assigned D40 as an early Lutetian hiatus of up to 3 My duration (43–46.2 Ma) (Table 4).
As noted in section 1.2, the limitations of stratigraphic resolution within the offshore succession continue to present a challenge, especially regarding the Oligocene–Miocene carbonate platform deposits and their deeper-water outer-shelf correlatives. Inspection of the profiles in Figures 6, 8, 9 highlights the inherent complexity within the Oligocene–Miocene succession (the D30–D10 interval), even at Series level. Using the criteria of Feary & James (Reference Feary and James1998), we have tentatively traced the D30 Base Oligocene Unconformity from the outer shelf into the platform succession (Fig. 6); however, recognition of the D20 Lower Miocene Unconformity, which correlates with the hiatus between the Abrakurrie and Nullarbor limestones (Fig. 4), within the carbonate platform succession remains ambiguous (Figs 6, 8c). The absence of Oligocene rocks in the Apollo-1 well (Figs 4, 7) suggests that, at least locally, the boundary separating the upper Lower–Middle Miocene Nullarbor Limestone Formation and the Middle–Upper Eocene Wilson Bluff Limestone Formation is a composite D30/D20 unconformity surface. Notwithstanding this problem of stratigraphic resolution, the key aspects (seismic stratigraphy and lithology) of the stratigraphical framework of the Dugong Supersequence as observed on the western Nullarbor Shelf and Eyre Terrace are presented below, in ascending stratigraphical order. Additional details on seismic reflection configuration patterns and lithological characteristics are summarised in Tables 5 and 7, whereas thicknesses of all drilled sections are indicated in Figure 7.
Summary of the stratigraphic setting and lithology of the Middle Eocene siliciclastic facies at the base of the Dugong Supersequence. Lithological and thickness data for ODP sites derived from Shipboard Scientific Party (2000a, b, f, b, h, b, f, b, j) and Li et al. (Reference Li, James and McGowran2003a), and Well Completion Reports for Apollo-1, Jerboa-1 and Potoroo-1 wells.

3.1. Middle–Upper Eocene sequence
3.1.1. Seismic stratigraphy.
The Middle–Upper Eocene sequence is bounded at its base by the D40 unconformity and at its top by the D30 unconformity, though it locally crops out at seabed on the inner shelf (Feary et al. Reference Feary, Birch and Boreen1993; James et al. Reference James, Boreen, Bone and Feary1994) (Fig. 6; Table 4). The D40 unconformity commonly forms a composite surface with the BTU where the sequence directly overlies Mesozoic and older rocks. This sequence displays an irregular sheetform geometry of variable thickness (100–200 msecs TWTT) across the shelf and upper slope, including the Wilson Bluff Limestone Formation within the lower carbonate platform succession. However, it thins (<100 msecs TWTT), largely due to erosion, towards the Early/Mid-Eocene palaeo-shelf-edge where it overlies the Wobbegong Delta, though localised complexes of Middle Eocene bryozoan reef mounds up to 200 m thick are developed atop the delta (Sharples et al. Reference Sharples, Huuse, Hollis, Totterdell and Taylor2014) (Figs 6, 8, 9). The sequence is locally absent on the upper slope because of primary depositional pinch-out as well as later erosion where the slope has been incised by canyons (Fig. 6).
Beneath the inner Nullarbor Shelf, the internal seismic reflection configuration of the Wilson Bluff Limestone Formation depicts mounded accumulations separated by sub-horizontal reflections traceable for over 20 km (Feary & James Reference Feary and James1995, Reference Feary and James1998) (Fig. 6; Table 5). The transition into the acoustically layered outer-shelf Middle–Upper Eocene succession (Table 5) is marked by gently inclined (<0.7°) seaward-dipping surfaces (Figs 6, 8c). The bryozoan mound complexes developed at the Early/Mid-Eocene palaeo-shelf-edge are onlapped by later Mid-Eocene and younger strata (Fig. 9a).
On the upper slope, the Middle–Upper Eocene sequence commonly exhibits a seismically layered character (Table 5) with planar to wavy reflections onlapping onto the Wobbegong delta front and downlapping onto Mesozoic strata downslope (Figs 6a–c, 8, 9). An erosional moat is locally preserved separating the mounded deposits from the delta slope (Fig. 8b). Whereas the sediment record at ODP site 1126 and in the Jerboa-1 well (Fig. 7) indicates the presence of intra-Mid and Mid/Late Eocene unconformities, herein designated as D35 and D32 (Table 4), respectively, their specific resolution on the seismic data remains poorly resolved despite internal discordances being observed (Figs 8b, 9a). A variably disrupted reflection pattern characterises the fill in the Eucla Canyon (Table 5; Fig. 9b).
3.1.2. Lithology.
The base of the Middle–Upper Eocene sequence is characterised by a thin but widespread siliciclastic facies that varies from less than 1 m to several tens of metres thick (Fig. 7; Tables 5, 7). On the Nullarbor Shelf, green glauconitic sandstones were drilled in the Apollo-1 and Potoroo-1 wells, whereas two pebbles of calcareous sandstone were recovered from the base of the carbonate succession at ODP site 1132 (Shipboard Scientific Party 2000h), and site 1130 cored a mixed assemblage of siliciclastic and carbonate rocks (Shipboard Scientific Party 2000f; Li et al. Reference Li, James and McGowran2003a). On the upper slope, bioclastic and glauconitic sandstone was recovered at ODP sites 1126 and 1134 (Shipboard Scientific Party 2000b, j) and in the Jerboa-1 well, though ambiguity remains over its stratigraphic setting (cf. Table 7).
The overlying carbonate succession on the inner Nullarbor Shelf is characterised by bryozoal limestone in the lower part of the carbonate platform whereas bioclastic wackestone, packstone and grainstone have been recovered on the outer shelf (Table 5). In addition, Sharples et al. (Reference Sharples, Huuse, Hollis, Totterdell and Taylor2014) report that the Middle Eocene section in the Potoroo-1 well includes a bryozoan mound complex at the base of the carbonate. At ODP site 1132, several firmgrounds were identified near the top of the sequence, including at the level of the D30 unconformity, which also displays brecciation and the presence of possible Neptunean dykes (Shipboard Scientific Party 2000h). Abundant bioturbation includes Thalassinoides burrows.
On the upper slope, Middle and Upper Eocene nannofossil chalk/ooze and mudstone is predominant at ODP sites 1126 and 1134 (Shipboard Scientific Party 2000b, j) and in the Jerboa-1 well (Table 5). Intensive bioturbation includes Zoophycos and Chondrites traces. No obvious lithological change is reported across the intra-Eocene D35 and D32 unconformities at ODP site 1126.
3.2. Oligocene–lowest Miocene sequence
3.2.1. Seismic stratigraphy.
The Oligocene–lowest Miocene sequence is bounded at its base and top by the D30 and D20 unconformities, respectively (Fig. 6; Table 4). It displays a variably eroded sheetform geometry across the outer shelf, up to 100 msecs thick at the palaeo-shelf-edge but commonly ≤50 msecs TWTT thick landward. Correlation with the carbonate platform succession beneath the inner shelf, specifically the Abrakurrie Limestone Formation (Fig. 4), remains ambiguous. Indeed, the Oligocene–lowest Miocene sequence might be locally absent on the inner shelf due to erosion associated with the formation of the D20 unconformity (Fig. 6d). By way of contrast, the sequence is locally up to 200 msecs TWTT thick on the upper slope in the vicinity of ODP site 1126. Lower Oligocene, Upper Oligocene and lowest Miocene sediments are all preserved at this site, separated by the D25 and D22 unconformities (Figs 7, 9a; Table 4). Farther west, lowest Miocene sediments are absent on the upper slope at ODP sites 1130 and 1134; their occurrence beyond site 1132 on the outermost shelf is terminated by the escarpment that marks the Late Neogene palaeo-shelf-edge (Fig. 8b).
On the outer Nullarbor Shelf, the Oligocene–lowest Miocene sequence displays an acoustically layered pattern (Table 5) with a hint of low-angle downlap onto the D30 unconformity near ODP site 1132 (Fig. 8b). The Middle Eocene bryozoan mound complexes were progressively onlapped and buried (Fig. 9). Whereas ODP site 1132 proved Lower Oligocene, Upper Oligocene and lowest Miocene sediments (Fig. 7), there is no obvious seismic expression of the D22 or D25 unconformities on the outer shelf where these boundaries might converge within a highly reflective zone. On the upper slope, seaward of the Wobbegong Delta, this sequence mostly comprises acoustically layered Oligocene sediments whose reflection configuration reveals evidence of onlap, downlap and sporadic channel incision, which highlight the angular and locally erosive nature of the D22 and D25 unconformities (cf. Table 5; Figs 8a, 9b). Lowest Miocene sediments at ODP site 1126 are not seismically distinguishable from the overlying upper Lower–Middle Miocene sediments, all of which seem to be part of a disturbed Miocene section (Fig. 9a). Farther downslope, the entire Oligocene–lowest Miocene sequence displays a chaotic signature towards the seaward edge of the upper slope, where the sequence appears to infill a former canyon as well as the Eucla Canyon (Figs 6c, 9b).
3.2.2. Lithology.
On the outer Nullarbor Shelf, the Oligocene–lowest Miocene sequence comprises predominantly bioclastic grainstone and packstone (Table 5). At ODP site 1132, the brecciated D30 unconformity is overlain by a basal Oligocene grainstone bed, which contains delicate branching bryozoans and serpulids (Shipboard Scientific Party 2000h). Despite the occurrence of the D25 and D22 biostratigraphic breaks at this site, no obvious lithological changes were observed across these unconformities; however, a sharp change to chert-rich deposits of the overlying Middle–Upper Miocene sequence marks the D20 unconformity. A mixed assemblage of Lower Oligocene marl, wackestone, packstone and grainstone is reported from the Potoroo-1 well.
Calcareous nannofossil ooze/chalk predominates on the upper slope at ODP sites 1126, 1130 and 1134 where Lower and Upper Oligocene rocks were proved at all sites, though lowest Miocene deposits were only present at ODP site 1126 (Shipboard Scientific Party 2000b, f, j) (Fig. 7; Table 5). At all sites, the sediments are pervasively bioturbated with Zoophycos and Chondrites burrows in abundance. Sporadic firmgrounds are present in the lowest Miocene and Upper Oligocene sections at ODP site 1126. Whereas the D25 and D22 unconformities are recognised biostratigraphically and on seismic reflection profiles from the slope succession, no obvious lithological change is recorded across these boundaries.
3.3. Upper Lower–Upper Miocene sequence
3.3.1. Seismic stratigraphy.
On the outer shelf and upper slope, the upper Lower–Upper Miocene sequence is generally bounded at its base by the D20 unconformity, and its top is marked by the D10 unconformity, except where the base Pliocene D12 unconformity is locally recognised (see below) (Figs 6, 8b; Table 4). The sequence is commonly between 140 and 200 msecs TWTT in thickness on the outer shelf, whereas, on the upper slope, it is generally thinner due to erosion, ranging from 15 to 140 msecs thick (Fig. 6). In the mid to inner shelf region, Upper Miocene sediments are absent, and the upper Lower–Middle Miocene Nullarbor Limestone Formation marks the top of the sequence, which is locally exposed at seabed (James et al. Reference James, Boreen, Bone and Feary1994). The basal D20 unconformity remains poorly resolved. The intra-Miocene D15 unconformity separates upper Lower–Middle Miocene and Upper Miocene units on the outer shelf and upper slope, though this boundary is not everywhere distinguishable on seismic reflection data (Figs 8, 9). On the mid shelf, this interface is marked by a steeply dipping reef-front escarpment that has been traced for at least 475 km, is up to 300 m high and forms the rimmed edge to the Mid-Miocene carbonate platform (Feary & James Reference Feary and James1995), which thins landward and is absent from the innermost shelf (Feary et al. Reference Feary, Birch and Boreen1993; James et al. Reference James, Boreen, Bone and Feary1994) (Figs 5, 6).
The internal seismic character of the upper Lower–Upper Miocene sequence is highly variable (Table 5). On the inner Nullarbor Shelf, the Nullarbor Limestone Formation contains an abundance of flat-lying-to-hummocky reflections, which display a stacked aggrading configuration that changes to a sigmoid-oblique pattern at the rimmed edge of the carbonate platform (Feary & James Reference Feary and James1995, Reference Feary and James1998) (Figs 6, 8c). Downslope of the escarpment, progradational stacking of planar to hummocky and lensoid packages appear to terminate by downlap at the level of the D20 boundary (Figs 6, 8c). The correlative outer-shelf section, bounded by the D15 and D20 unconformities, extends towards the shelf-edge as a predominantly layered sheetform unit ranging from about 20 to 140 msecs TWTT thick, with a hint of low-angle downlap onto the D20 unconformity (Fig. 8b). The overlying Upper Miocene unit (above D15) has been described as a ‘coalesced mound complex’ (Table 5), which extends for up to 30 km away from the reef-front escarpment across the outer shelf (Feary & James Reference Feary and James1998). The mound complex terminates landward by onlap onto the rimmed escarpment (Fig. 8c); towards the shelf-edge, the reflection pattern becomes more flat-lying (Fig. 6).
All or part of the upper Lower–Upper Miocene sequence on the outer shelf is truncated by a distinct buried erosional escarpment, up to 200 m high, which probably marks the late Neogene palaeo-shelf-edge (Fig. 6). This buried escarpment is most pronounced on seismic profile Ja90-23 where observational evidence for a major slide – herein informally termed the ‘Late Neogene Slide’ – is preserved (see below) (Fig. 8b). Downslope, the upper slope succession preserves elements of the lower and upper outer shelf units. In some areas, these units are traceable across the shelf-edge, in others they are detached; always, the stratigraphy and the internal reflection configuration is generally less coherent on the slope than the shelf.
On seismic profile Ja90-19, a layered upper Lower–Middle Miocene section is locally incised by an erosional channel, up to 6 km wide, whose fill was subsequently truncated by the D15 unconformity; the overlying Upper Miocene unit contains numerous acoustically structureless packages (Fig. 8a). To the east, only the Upper Miocene unit is preserved on the upper slope in the vicinity of ODP site 1130, where it is preserved as a thin (20–60 msecs TWTT) irregular deposit with a structureless to chaotic acoustic signature. This deposit directly overlies, and terminates upslope against, Oligocene strata at the base of the buried escarpment at a lower projected stratigraphic level than the upper Lower–Middle Miocene unit on the adjacent shelf. Thus, this boundary might represent the glide plane of the Late Neogene Slide, which can be traced downslope for 15–20 km, and that the escarpment represents the slide scar (Fig. 8b).
A more complete record of upper Lower–Upper Miocene sedimentation on the upper slope is indicated by ODP site 1126 (Fig. 9a). However, whilst the drilled stratigraphic section indicates a degree of continuity with the outer shelf, interpretation of seismic profile Ja90-27 suggests that the Upper Miocene section (above D15), which displays a lensoid form, might be detached from its outer-shelf equivalent. Upslope extrapolation of the D15 unconformity away from ODP site 1126 suggests that it might be cut out at the level of the D10 unconformity. Thus, the bulk of this upper slope succession is probably the upper Lower–Middle Miocene unit, albeit its generally contorted internal reflection pattern differs from its signature on the adjacent shelf. The removal of the Upper Miocene unit from parts of the upper slope is further enhanced on the eastern margin of the study area where ODP sites 1127, 1129, 1131 and 1133 prove a predominantly Middle Miocene record, with thin Upper Miocene deposits only intersected at the deepest-water sites (1127 and 1133) (Figs 7, 9b). Whereas the lower part of the upper Lower–Upper Miocene sequence on the outer shelf can be traced onto the upper slope, the internal seismic character changes from acoustically layered on the shelf to chaotic and hummocky on the lower part of the upper slope and flanks of the Eucla Canyon (Fig. 9b).
3.3.2. Lithology.
On the outer Nullarbor Shelf, an upper Lower–Middle Miocene bioclastic wackestone, packstone and grainstone succession unconformably overlain by Upper Miocene calcareous ooze/chalk was intersected by ODP site 1132 (Shipboard Scientific Party 2000h) and the Potoroo-1 well (Table 5). ODP site 1132 penetrated the D15 unconformity (Fig. 8b); although the contact was not cored, the lithological change is sharp.
On the upper slope, a more mixed assemblage of chalk/ooze and bioclastic carbonate rocks prevails throughout the entire sequence (Table 5). ODP site 1130 proved Upper Miocene sediments unconformable on Upper Oligocene deposits; the contact probably represents the base (glide plane) of the Late Neogene slide (Fig. 8b). The Upper Miocene deposits predominantly comprise bioturbated nannofossil ooze/chalk. The basal 30 m is more varied and includes beds of bioclastic grainstone with sharp bases and sharp-to-gradational tops, inclined and folded bedding in the chalk and the presence of a firmground (Shipboard Scientific Party 2000f). ODP sites 1126 and 1134 cored the entire preserved upper Lower–Upper Miocene sequence, including the D15 unconformity (Figs 8a, 9a). The upper Lower–Middle Miocene section includes calcareous ooze/chalk interbedded with bioclastic wackestone and packstone (Shipboard Scientific Party 2000b, j) (Table 5). Some beds have sharp bases and are normally graded, though much of the section is intensely bioturbated, commonly Zoophycos and Chondrites burrows, and most bed contacts are transitional. At both sites, the Upper Miocene section comprises nannofossil ooze; however, the section at ODP site 1126 is punctuated by several slumped beds that display inclined and folded bedding, silicified layers comprising irregular to nodular porcellanite and a firmground. This section is also intensely bioturbated, including Zoophycos, Chondrites, Planolites, Terrabelina and Thallasinoides burrows. At ODP site 1126, the D15 unconformity coincides with the base of the slumped beds; at ODP site 1134, the unconformity broadly coincides with an upward change from partially lithified to unlithified sediment. A further series of local, unassigned biostratigraphic breaks have been identified at both sites (Fig. 7; Shipboard Scientific Party 2000b, j).
Farther east, ODP sites 1127, 1129, 1131 and 1133 all terminated within Middle Miocene rocks that predominantly comprised bioturbated, bioclastic wackestone, packstone and grainstone interbedded with chert/porcellanite (Shipboard Scientific Party 2000c, e, g, e, i) (Figs 7, 9b; Table 5). Upper Miocene rocks were recovered only at ODP sites 1127 and 1133. At site 1127, the Upper Miocene section comprises bioclastic packstone and minor grainstone beds with rotated intraclasts overlain by strongly bioturbated calcareous ooze/chalk, including Zoophycos and Planolites burrows (Shipboard Scientific Party 2000c). There is no obvious lithological or textural change in the bioclastic packstone above and below the Middle/Upper Miocene biostratigraphic break, though the Upper Miocene section appears disturbed. ODP site 1133 proved bioturbated Upper Miocene nannofossil ooze with sporadic firmground development, including at the boundary with the underlying Middle Miocene section (Shipboard Scientific Party 2000i). Both these sites display significant amounts of reworking of benthic and planktonic foraminifers and calcareous nannofossils (Shipboard Scientific Party 2000c, i).
3.4. Pliocene sequence
3.4.1. Seismic stratigraphy.
Pliocene sediments are restricted to the upper slope of the Eyre Terrace (Fig. 6). They are best preserved where they form part of the infill of the Late Neogene Slide scar (Fig. 6b); elsewhere on the slope (e.g., ODP sites 1126 and 1134), they are largely seismically unresolvable from the underlying Miocene deposits (Figs 6a, c). The top of the sequence is marked by the D10 unconformity, whereas the base is marked by the D12 unconformity; the latter is locally composite with the glide plane of the Late Neogene Slide (Fig. 8b). The Pliocene sequence is thickest (up to 120 msecs TWTT) immediately adjacent to the slide scar where well-developed upslope-migrating clinoforms are identified (Table 5); however, it thins downslope to less than 50 msecs TWTT (40 m thick) at ODP site 1130, and might pinch out at the seaward edge of the Eyre Terrace (Figs 6b, 8b). Lower and Upper Pliocene units are proved at ODP site 1130 (Shipboard Scientific Party 2000f) (Fig. 7), separated by a moderate reflection; however, Pliocene reflection patterns are generally weaker and less coherent downslope (Table 5).
3.4.2. Lithology.
The Pliocene sequence comprises a mixed, commonly disturbed, upper slope assemblage of calcareous nannofossil ooze/chalk and bioclastic wackestone, packstone, floatstone and rudstone (Shipboard Scientific Party 2000b, f, j) (Table 5). The sediments are strongly bioturbated and include Chondrites burrows. At ODP site 1130, Lower Pliocene calcareous nannofossil chalk is unconformably overlain by Upper Pliocene bioclastic packstone (Shipboard Scientific Party 2000f). The top of the Pliocene sequence (D10 unconformity) is marked by a hardground, whereas the base of the Upper Pliocene section is characterised by syn-sedimentary deformation depicted by inclined and disturbed alternating layers of glauconitic bioclastic packstone and white nannofossil bioclastic packstone. The basal D12 unconformity is marked by a sharp textural change from a uniform wackestone texture in Upper Miocene nannofossil chalk to an interbedded mudstone to packstone texture in the overlying Lower Pliocene chalk (Shipboard Scientific Party 2000f). Elsewhere, Lower Pliocene wackestone-to-rudstone and Upper Pliocene calcareous ooze were recovered at ODP sites 1134 and 1126, respectively; both sections contain a wide variety of coarse-grained bioclasts and lithic clasts (Shipboard Scientific Party 2000b, j) (Table 5)
3.5. Quaternary sequence
3.5.1. Seismic stratigraphy.
The Quaternary sequence is preserved as a wedge-shaped deposit on the outer shelf and upper slope. Its base is marked by the D10 unconformity; its top is the present-day seabed (Fig. 6). The sequence locally exceeds 550 msec TWTT in thickness (557 m at ODP site 1129) at the shelf-edge, but is more generally between 220 and 300 msecs TWTT thick. On the outer Nullarbor Shelf, the thickness generally ranges from 100 to 200 msecs TWTT but terminates landward, abruptly, by onlap onto the seaward edge of the rimmed Middle Miocene carbonate platform (Figs 6, 8c). On the carbonate platform, the Quaternary sediments occur as a patchy veneer, below seismic resolution (Feary et al. Reference Feary, Birch and Boreen1993; James et al. Reference James, Boreen, Bone and Feary1994, Reference James, Bone, Collins and Kyser2001, Reference James, Bone, Carter and Murray-Wallace2006). On the upper slope, the Quaternary sequence gradually thins downslope onto the main part of the Eyre Terrace and on the flanks of the Eucla canyon, and might pinch-out, locally.
The internal seismic character of the Quaternary sequence is variable and can be described as three distinct zones: outer shelf, shelf-edge and upper slope (Table 5). On the outer shelf, the sequence displays a predominantly aggrading, layered internal reflection configuration as well as areas characterised by hummocky reflections (Fig. 6). Towards the shelf-edge, the outer-shelf reflections transition into a more complex configuration that displays a disrupted pattern, which includes hummocky-to-mounded and prograding reflection configurations (Figs 6, 8, 9). Complex reflector-truncation patterns within the shelf-edge section produce a locally hummocky–contorted configuration (e.g., Fig. 9b).
By way of contrast, the slope section displays a convex-up mounded external form and a strongly layered internal reflection configuration that exhibits two-way closure in the core of the mound (Figs 6, 8, 9; Table 5). The axis of the mounded section can be traced for over 200 km along the length of the Eyre Terrace (Figs 5, 6). Four internal boundaries have been identified – D2 (youngest), D4, D6 and D8 – and provisionally correlated along strike of the Eyre Terrace (Figs 8, 9). Reflections D2, D6 and D8 essentially correlate with reflections A, B and C previously described by the Shipboard Scientific Party (2000c, e, g), whereas D4 is introduced in this study. These reflections represent intra-Pleistocene unconformities, including erosional truncation surfaces, which delineate up-to-five subsequences that locally and individually exceed 100 m thick (Fig. 9b; Table 4). Upslope, the relationship of the mounded deposit with the shelf-edge section appears to be complex and marked by erosional truncation patterns as well as interdigitation, especially with the younger part of the prograding shelf-edge where onlap of seaward-prograding clinoforms by upslope-migrating wavy clinoforms is locally observed (e.g., Fig. 9b). The latter are observed throughout the Quaternary sequence on the Eyre Terrace, buried and at seabed, and have been previously described as sediment waves (Huuse & Feary Reference Huuse and Feary2005; Anderskouv et al. Reference Anderskouv, Surlyk, Huuse, Lykke-Andersen, Bjerager and Tang2010) (e.g., Figs 8b, 9b). Multibeam bathymetry data from the eastern part of the Terrace (Anderskouv et al. Reference Anderskouv, Surlyk, Huuse, Lykke-Andersen, Bjerager and Tang2010, fig. 4) shows a sediment wave field oriented subparallel to slightly oblique to the bathymetric contours, and migrating upslope to the NW. Downslope, only the uppermost part of the Quaternary sequence (above D2) extends as a sheetform deposit to the edge of the Eyre Terrace (Figs 6, 8, 9).
3.5.2. Lithology.
On the Nullarbor Shelf, the Quaternary sequence remains largely untested, other than in dredge and grab samples, and short cores (<2 m), which proved a surface veneer of mixed uppermost Pleistocene bioclastic and lithic sand, and Holocene gravel lag deposits and patches of quartzose-bioclastic palimpsest sand (Feary et al. Reference Feary, Birch and Boreen1993; James et al. Reference James, Boreen, Bone and Feary1994, Reference James, Bone, Collins and Kyser2001). On the upper slope, the Quaternary sequence has been tested at all ODP sites (Figs 6–9): sites 1127, 1129, 1130, 1131 and 1132 cored the main part of the convex-up mounded deposit, with sites 1129 and 1132 close to the interface with the shelf-edge succession; sites 1126 and 1134 cored the slope veneer seaward of the core of the mound; site 1133 cored the eastern flank of the Eucla Canyon (Fig. 1). In general, the mounded deposit comprises bioclastic packstone with subordinate bioclastic wackestone, grainstone, floatstone and rudstone (Table 5). Calcareous nannofossil ooze predominates in the slope veneer and on the flank of the Eucla Canyon.
The upper slope mounded deposit has been tested at ODP sites 1127, 1129, 1130, 1131 and 1132 (Figs 6, 8b, 9b). The lithology at all five sites is dominated by bioclastic packstone in association with subordinate wackestone, grainstone and sporadic interbeds of calcareous ooze/chalk (Shipboard Scientific Party 2000c, e, f, g, h) (Table 5). By way of contrast, an association of floatstone and rudstone occurs in the uppermost part (above the D2 unconformity) of the mound at ODP sites 1129, 1131 and 1132 (Anderskouv et al. Reference Anderskouv, Surlyk, Huuse, Lykke-Andersen, Bjerager and Tang2010). The entire sequence is thoroughly bioturbated, predominantly by a Zoophycos ichnofauna (Zoophycos, Chondrites, Planolites) and Thalassinoides burrows. Bed contacts are commonly gradational. An upwards-coarsening cyclicity over tens of metres in the uppermost part of the mound (above the D2 unconformity) has been reported from sites ODP 1127 and 1129, with beds at these sites grading from ooze to grainstone, and packstone to floatstone/rudstone, respectively (Shipboard Scientific Party 2000c, e). At ODP site 1130, normal- to inversely graded turbidite beds are sporadically recorded throughout the Quaternary sequence (Shipboard Scientific Party 2000f; Simo & Slatter Reference Simo and Slatter2002).
Lithological indicators for unconformable contacts across the D2–D8 boundaries are provided by evidence of lithological change, firmgrounds and increased down-core lithification associated with these boundaries at all sites (Shipboard Scientific Party 2000c, e, f, g, h). The D8 boundary at ODP sites 1127 and 1131 forms a concave, eroded top to the oldest part of the mound; downslope of this erosion surface there is lithological evidence of slumping. At ODP site 1127, this includes rotated blocks of mudstone, deformed bedding and a chaotic mix of fine-grained packstone, coarse-grained grainstone and mudstone (Shipboard Scientific Party 2000c). At ODP site 1131, the section below the D8 unconformity includes a thin layer of deformed chalk and a few thin celestite-filled cracks (Shipboard Scientific Party 2000g). Lithological changes and firmgrounds across the D2–D6 boundaries are also reported from ODP sites 1130 and 1132 (Shipboard Scientific Party 2000f, h).
ODP sites 1126 and 1134 lie seaward of the axis of the mounded deposit, towards the outer part of the Eyre Terrace, where the preserved Quaternary sequence correlates wholly with the sequence above the D2 unconformity (Figs 8a, 9a). Both sites proved calcareous nannofossil ooze (Shipboard Scientific Party 2000b, j) (Table 5). Bioturbation is strong and includes Thalassinoides burrows. Some variation is noted at site 1134, in the lower part of the section, which contains sporadic grainstone-rudstone interbeds that comprise a variety of coarse components, including bryozoan fragments, as well as indications of soft sediment deformation. The latter include pebble-sized lumps of calcareous nannofossil ooze interpreted as clasts reworked by slump activity (Shipboard Scientific Party 2000j). On the eastern flank of the Eucla Canyon, ODP site 1133 recovered deformed calcareous ooze overlying a grainstone turbidite (Shipboard Scientific Party 2000i) (Table 5).
4. Interpretation
The Middle Eocene siliciclastic rocks are broadly correlatable with the Hampton Sandstone and Upper Pidinga formations (Fig. 4), which represent established transgressive facies at the base of the carbonate succession (Benbow et al. Reference Benbow, Lindsay, Alley, Drexel and Preiss1995; Smith & Donaldson Reference Smith and Donaldson1995; Totterdell et al. Reference Totterdell, Blevin, Struckmeyer, Bradshaw, Colwell and Kennard2000). Collectively, the poorly sorted, bioclastic and glauconitic nature of the sandstones, together with a benthonic fauna that includes Cibicides spp. and worn and abraded bryozoan fragments, are consistent with a mid to inner neritic high-energy setting. This lag deposit is represented in varying degrees in all ODP boreholes and wells that penetrated the base of the Dugong Supersequence (Fig. 7; Table 6) and implies a basin-wide transgressive phase of sedimentation.
The overlying carbonate succession has been widely promoted as an aggradational–progradational, predominantly cool-water carbonate platform with a distally steepened carbonate ramp that downlaps onto the Eyre Terrace (upper slope) (James & von der Borch Reference James and von der Borch1991; Feary & James Reference Feary and James1995, Reference Feary and James1998; Feary et al. Reference Feary, Hine, James, Malone, Hine, Feary and Malone2004). It is well established that the Middle Eocene–Middle Miocene carbonate platform succession beneath the inner shelf represents the aggradational accumulation of inner ramp (Middle–Upper Eocene Wilson Bluff Limestone Formation) and rimmed shelf (upper Lower–Middle Miocene Nullarbor Limestone Formation) sediments (Feary & James Reference Feary and James1995, Reference Feary and James1998; Feary et al. Reference Feary, Hine, James, Malone, Hine, Feary and Malone2004); as such, these are not considered further in this section. However, our study reveals significant seismic and sedimentary evidence for separate, albeit overlapping, sedimentary systems operating on the outer shelf (seaward of the carbonate platform) and upper slope. Whereas the outer shelf deposits largely display characteristics common to a mid to outer ramp/shelf setting, the upper slope succession includes indicators of both downslope and alongslope processes. The main seismic-stratigraphic characteristics of the outer shelf and upper slope successions are highlighted in Figure 10, whereas a summary of key indicators of sedimentary transport processes on the upper slope is presented in Table 8. The contrast between these successions is demonstrated below through reference to their bounding surfaces, sediment body geometry, seismic facies, sedimentary characteristics and other paleoenvironmental indicators. The interface between the outer shelf and upper slope systems varies from sharp (absent through erosion and/or non-deposition) to transitional (including through interdigitation). Although the general location of the shelfbreak has remained relatively constant since the Mid-Eocene (Figs 2b, 3), minor fluctuations in its position demarcate the contemporary interface between the two domains (Fig. 10; Table 8). The combination of the primary depositional processes to erode, rework and shape the morphology of the shelf-margin will be considered further in the Discussion (section 5).
Summary of indicators of sedimentary transport processes responsible for shaping the upper slope (Eyre Terrace), and the nature of the interface between the outer shelf and upper slope successions, including the approximate position of the contemporary shelfbreak.

Abbreviations: EC, Eucla Canyon; ET, Eyre Terrace.
4.1. Outer shelf
Middle Eocene–Middle Miocene sediment packages (D40–D15 interval) – coeval with the carbonate platform succession – extend seaward from the escarpment and reef complex of the inner shelf as a series of regionally extensive, unconformity-bounded, sheetform deposits with an acoustically bedded internal reflection pattern (Fig. 10; Tables 4, 5). The reflections are generally sub-horizontal and sub-parallel, but with indications of seaward low-angle downlap in the Oligocene–lowest Miocene sequence (Figs 6, 8, 9). These packages comprise a variably interbedded succession of bioclastic wackestone to grainstone (Table 5) that preserves a predominantly neritic to upper bathyal benthic foraminiferal assemblage, and is extensively burrowed, including Thalassinoides (Shipboard Scientific Party 2000a, h). As might be expected from the stratigraphic setting, these sedimentary and microfaunal characteristics are generally consistent with a shelf environment that encompasses the mid-to-outer ramp/shelf setting – that is, below fair-weather/storm wave base (Wetzel Reference Wetzel, Stow and Piper1984; Bosence & Wilson Reference Bosence, Wilson and Coe2003). The predominance of grainstone on the outermost shelf (cf. Table 5) might be indicative of the removal of finer-grained material from the shelf by current activity at the seabed and spillover onto the upper slope. The gradual onlap and burial of the Middle Eocene bryozoan mound complexes by Upper Eocene and Oligocene sediments (Fig. 9) indicates the activity of traction currents; however, the general preservation of delicate branching bryozoans and serpulids suggests that current reworking was probably intermittent – for example, storm-induced currents.
The Upper Miocene unit on the outer shelf, above the D15 unconformity, displays an aggradational parallel-to-mounded seismic reflection configuration, comprises calcareous ooze and chalk with minor packstone (Table 5) and onlaps the escarpment marking the edge of the rimmed carbonate platform (Figs 6, 8c, 10). The latter implies a lowstand deposit that developed following a relative fall in sea level, which exposed the upper Lower–Middle Miocene rimmed carbonate platform – the Mid-Miocene ‘Little Barrier Reef’. The seaward transition from mounded to parallel and flat-lying reflections might represent a much narrower and more confined carbonate ramp on the outer shelf, incorporating an inner coalesced carbonate mound complex (Feary & James Reference Feary and James1998) and flat-lying outer ramp deposits.
The Quaternary sequence similarly represents a lowstand deposit that is largely confined to the outer shelf, unconformable on the D10 unconformity and terminates landward by onlap onto the upper part of the Mid-Miocene ‘Little Barrier Reef’ escarpment. Towards the shelf-edge, the Quaternary sequence displays a laterally prograding reflection configuration, which includes sigmoid and oblique progradational clinoforms, and complex reflector-truncation patterns that produce a locally mounded-to-chaotic acoustic signature at seabed and buried (Figs 8–10). The ‘mounded’ signature was originally interpreted by Feary & James (Reference Feary and James1995, Reference Feary and James1998) to be indicative of autochthonous biogenic mound growth, and subsequently labelled as a shelf-edge bryozoan reef mound complex (Shipboard Scientific Party 2000a; Feary et al. Reference Feary, Hine, James, Malone, Hine, Feary and Malone2004), though Huuse & Feary (Reference Huuse and Feary2005) and Anderskouv et al. (Reference Anderskouv, Surlyk, Huuse, Lykke-Andersen, Bjerager and Tang2010) rejected this interpretation in favour of sediment waves, with which we concur (see below). Our appraisal of the complex internal reflection terminations within the entire shelf-edge section leads us to suggest that this reflection configuration resembles a large-scale interference pattern between a shelf-edge cut-and-fill complex and a sediment wave field (Fig. 9b). The formation of these features might thus be attributed to a combination of coeval scour and deposition; the expression of some type of high-energy system (see Discussion: section 5.1).
4.2. Upper slope
The identification of downslope mass-movement deposits in the sediment record is generally clear cut as they are single event deposits with well-defined characteristics. Identifying alongslope contourite deposits, however, is more complex as bottom currents affect to a greater or lesser extent the longer-term accumulation of sediment by other processes (pelagic, hemipelagic, turbiditic) so that a blend of characteristics is necessary for their recognition.
4.2.1. Indicators of alongslope processes.
The Quaternary sequence on the upper slope is preserved as a large-scale elongate sediment mound that exceeds 500 m in thickness and can be traced for over 200 km along the length of the Eyre Terrace (Figs 5, 6). Certain specific seismic and sedimentary features of this mound are characteristic of contourite drifts (cf. Faugeres et al. Reference Faugères, Stow, Imbert and Viana1999; Stow et al. Reference Stow, Faugères, Howe, Pudsey, Viana, Stow, Pudsey, Howe, Faugères and Viana2002; Faugères & Stow Reference Faugères, Stow, Rebesco and Camerlenghi2008). These include: the basin-scale convex-upward geometry and margin-parallel elongation of the sediment mound; erosional discontinuities at the base and within the mound (D2–D10 unconformities) that extend across the accumulation as a whole; an internal reflection configuration that varies from sub-parallel and continuous to wavy and irregular, including upslope-migrating clinoforms that resemble sediment waves (Huuse & Feary Reference Huuse and Feary2005; Anderskouv et al. Reference Anderskouv, Surlyk, Huuse, Lykke-Andersen, Bjerager and Tang2010); reflector terminations that include downlap, onlap and two-way closure; sediment that is predominantly fine-grained (silt to very fine sand) but with sporadic interbeds of coarser bioclastic deposits in the upper part of the mound; gradational bed contacts, and textural variation on several scales (tens of centimetres to tens of metres), including inversely-to-normally graded units; and pervasive bioturbation, characterised by a Zoophycos ichnofauna.
The sedimentary characteristics of the Quaternary sequence imply that a relatively stable environmental setting where burrowing activity was able to keep pace with sedimentation predominated throughout the deposition of the sediment mound. However, fluctuations in bottom current strength are indicated by several features on different scales, which arguably reflect increasing energy levels, ranging from small, centimetre-scale graded beds, through the development of medium-scale sediment wave fields, to the deposition of up to five large-scale (locally >100 m thick) unconformity-bounded subsequences (separated by the D2–D8 boundaries) (Figs 8, 9) that comprise the large-scale drift. Whereas some authors (e.g., Simo & Slatter Reference Simo and Slatter2002; Brooks et al. Reference Brooks, Hine, Mallinson and Drexler2003; Feary et al. Reference Feary, Hine, James, Malone, Hine, Feary and Malone2004) have suggested that the observed textural and grain-size cyclicity in the graded beds is a function of a varying relative sea level, the influence of alongslope currents offers an alternative mechanism whereby such variation reflects fluctuation in bottom-current strength; coarser-grained sediments are associated with strong currents, finer-grained material with low current strength. Thus, the coarsening-upward couplets assigned by Simo & Slatter (Reference Simo and Slatter2002) to a fluctuating sea level might equally be assigned to the C1–C3 division, which represents the negatively graded part of the composite contourite facies model of Stow et al. (Reference Stow, Faugères, Howe, Pudsey, Viana, Stow, Pudsey, Howe, Faugères and Viana2002); the C3 division representing the coarser fraction related to bottom-current velocity increase. The occurrence of erosive basal and internal hiatuses (D10–D2) is most probably related to episodes of particularly vigorous bottom currents (Stow et al. Reference Stow, Faugères, Howe, Pudsey, Viana, Stow, Pudsey, Howe, Faugères and Viana2002). Based on all this evidence, we suggest that the Eyre Terrace sediment mound represents a contourite drift (Huuse & Feary Reference Huuse and Feary2005), which we have termed the Eyre Terrace Drift. Its overall geometry and association with sediment waves is comparable with elongate mounded drifts observed elsewhere in the world, including the Rockall Trough in the NE Atlantic (Stoker et al. Reference Stoker, Akhurst, Howe and Stow1998; Masson et al. Reference Masson, Howe and Stoker2002). Such drifts may occur anywhere from the outer shelf/upper slope to the abyssal plains depending on the depth at which the bottom current flows (Stow et al. Reference Stow, Faugères, Howe, Pudsey, Viana, Stow, Pudsey, Howe, Faugères and Viana2002). Given that the main development of the drift lies between 200 and 700 m water depth , the Quaternary upper slope succession can be further classed as a shallow water contourite drift (sensu Stow et al. Reference Stow, Faugères, Howe, Pudsey, Viana, Stow, Pudsey, Howe, Faugères and Viana2002). Its complex relationship with the outer-shelf Quaternary section is considered elsewhere (see Discussion: section 5.1).
Sediment mounds in the Pliocene, Oligocene and Middle–Upper Eocene deposits also display seismic features diagnostic of contourite drifts. The large-scale seismic geometry of the Pliocene sequence is one that has clearly moulded to onlap the headwall scarp of the Late Neogene Slide (see below) and to fill progressively the topographic depression of its evacuation hollow (Figs 8b, 10). The setting and relative confinement of this deposit is characteristic of an infill drift (Stow et al. Reference Stow, Faugères, Howe, Pudsey, Viana, Stow, Pudsey, Howe, Faugères and Viana2002), examples of which have been recognised in association with several major slides on the NW European margin (Evans et al. Reference Evans, Harrison, Shannon, Laberg, Nielsen, Ayers, Holmes, Hoult, Lindberg, Haflidason, Long, Kuijpers, Andersen and Bryn2005). In the Middle Eocene–Oligocene section, sub-parallel to wavy and mounded sediments display a progressive, upslope onlap of the front of the Wobbegong Delta (Figs 8, 9b, 10). The erosional moat associated with the mounded Middle–Upper Eocene sequence (Fig. 8b) is characteristic of a separated drift, whereas the sheet-like Oligocene accumulation is more typical of a plastered drift (Faugères et al. Reference Faugères, Stow, Imbert and Viana1999; Stow et al. Reference Stow, Faugères, Howe, Pudsey, Viana, Stow, Pudsey, Howe, Faugères and Viana2002; Faugères & Stow Reference Faugères, Stow, Rebesco and Camerlenghi2008). This interpretation contrasts with that of Feary & James (Reference Feary and James1995, Reference Feary and James1998) who described the Middle Eocene–Oligocene section as an ‘aggrading’ and ‘multi-lobed, deep-water slope sediment apron’ comprising sediment derived directly downslope from the adjacent shelf and deposited as ‘a series of gently seaward-dipping reflectors’. However, the sedimentary characteristics throughout this section are consistent with a contourite origin, being predominantly fine-grained, strongly bioturbated and containing a benthic and planktonic foraminiferal association characteristic of an upper to middle bathyal (200–800 m) environment (Shipboard Scientific Party 2000b, f, j). The abundance of Zoophycos and Chondrites biogenic traces is commonly associated with stable environmental conditions, and the slow, continuous accumulation of sediment (Wetzel Reference Wetzel, Stow and Piper1984).
Although the intra-Middle and Upper Eocene D32 and D35 unconformities are not readily identifiable on the seismic data, their identification solely within the Middle–Upper Eocene separated drift (Figs 8b, 9a) suggests that they formed as an integral part of drift accumulation and might reflect fluctuations in the strength of the bottom currents during its deposition. In contrast, the ‘Mid’ Oligocene D25 and Base Miocene D22 unconformities are identified from the shelf-edge on to the upper slope; thus, their formation might be indicative of a more widespread erosive regime (see Discussion: section 5.2).
The origin of several unassigned biostratigraphic breaks in the upper Lower–Upper Miocene sequence specific to ODP sites 1126 and 1134, on the outer edge of the Eyre Terrace, remains uncertain due to their localisation and lack of obvious correlation between the two sites (Fig. 7). Local scouring of the strongly bioturbated sediments by bottom currents cannot be discounted, though there is also evidence for the activity of sporadic mass flow processes (see below).
4.2.2. Indicators of downslope processes.
On the Eyre Terrace, the Neogene succession preserves most evidence for downslope processes ranging from large-scale sliding and channel incision to small-scale interbeds of sediment gravity flow deposits (Table 8). The largest and most prominent indicator of downslope processes is the Late Neogene Slide recognised by the major erosional scour that truncates the entire outer shelf succession of upper Lower–Upper Miocene sediments. The preserved Upper Miocene section on the upper slope is detached from the outer shelf succession, displays a structureless to chaotic acoustic character and rests unconformably – via the base of the slide – on Upper Oligocene deposits (Fig. 8b). At site 1130, the basal ~15 m of the 53-m-thick Upper Miocene section is a mixed assemblage of undisturbed nannofossil chalk, slumped nannofossil chalk and thin-to-medium-bedded turbidites (Shipboard Scientific Party 2000f). The timing of the slide event is inferred as late Tortonian based on the comparison between the biostratigraphic range of the displaced Upper Miocene sediments at site 1130 (SAN17–19/NN10–12) and the undisturbed, slightly older, outer shelf section at site 1132 (SAN17/NN10) (Figs 6, 7).
Farther downslope, the upper Lower–Upper Miocene sequence is punctuated by several biostratigraphic breaks (Fig. 7) which, together with seismic-stratigraphic evidence for channel incision (e.g., Fig. 8a) and generally contorted internal reflection pattern (Fig. 9a), might be indicative of intermittent downslope traction-currents, though the action of alongslope bottom currents cannot be discounted (see above). A background sedimentary record dominated by strongly bioturbated calcareous ooze punctuated by discrete slumped beds that display inclined and folded bedding, turbidites, thin silty layers with rotated intraclasts and much reworked biogenic material implies sporadic mass flow activity on the upper slope throughout the Miocene (Shipboard Scientific Party 2000c, i, j). Whereas the gross external form of the overlying Pliocene sequence is of an infill drift (see above), indications of chaotic to lensoid seismic unit's downslope from the Late Neogene Slide combined with lithological evidence for sporadic syn-sedimentary deformation, including inclined bedding and rip-up clasts, implies episodic reworking and/or instability. At ODP site 1134, the Lower Pliocene bioclastic deposits (Table 5) are described as ‘neritically influenced’ (Shipboard Scientific Party 2000j), which suggests derivation of material from the outer shelf.
The remainder of the upper slope succession preserves only sporadic indicators of downslope processes. In the Quaternary sequence, downslope of the concave erosional top of the oldest part of the Eyre Terrace Drift marked by the D8 unconformity (Fig. 9b), ODP sites 1127 and 1131 contain evidence of slumping, including deformed bedding and rotated intraclasts. This might represent localised failure and redeposition of the drift deposits (e.g., Stoker et al. Reference Stoker, van Weering, Svaerdborg, Shannon, Haughton and Corcoran2001). Similar intermittent syn-sedimentary deformation characteristics are also seen in the upper part of the Quaternary sequence (above D2 at site 1134) seaward of the main axis of the Eyre Terrace Drift. In the Palaeogene succession, the possibility has already been raised that the basal Middle Eocene siliciclastic section at ODP site 1134 might be linked to a localised mass flow deposit at the foot of the Wobbegong Delta (Table 7; Fig. 8a). The borehole record for the remainder of the Palaeogene succession suggests a relatively stable upper-to-middle bathyal setting on the Eyre Terrace (see above); however, towards the seaward edge of the Terrace, the entire Oligocene–lowest Miocene sequence locally displays a chaotic seismic reflection signature where the sequence appears to infill a former canyon (Fig. 6c). Moreover, localised channel incision and erosion associated with the D22 (Base Miocene) unconformity (Fig. 9a) might be further indicative of sporadic downslope processes.
By way of contrast, on the eastern side of the study area, seismic and sedimentary observations indicate that the Eucla Canyon has been an active downslope sediment transport route since at least the Mid-Eocene (Tables 5, 8). On seismic profiles, the fill of the canyon is characterised by a lenticular to hummocky and chaotic seismic reflection pattern, including stacked accumulations of lensoid packages, characteristic of mass flow deposits (Mitchum et al. Reference Mitchum, Vail, Sangree and Payton1977; Nardin et al. Reference Nardin, Hein, Gorsline, Edwards, Doyle and Pilkey1979). Although lithological data are restricted to the Neogene–Quaternary section, the occurrence of scoured bedding surfaces, turbidites, soft sediment deformation structures (rotated intraclasts, slumped and folded bedding) and much reworked biogenic material within this section are consistent with mass flow processes.
5. Discussion
The revised stratigraphic framework of the Dugong Supersequence presented in Figure 10 provides an observational basis upon which to appraise the post-breakup development of the Eucla Basin in the western GAB since the Mid-Eocene. Whereas we recognise some compatibility with the established stratigraphic model of Feary & James (Reference Feary and James1995, Reference Feary and James1998) and Feary et al. (Reference Feary, Hine, James, Malone, Hine, Feary and Malone2004) – specifically, the architecture of the carbonate platform succession on the inner Nullarbor Shelf – the large-scale sediment-body geometry of the upper slope succession indicates a predominance of contourite deposits beneath the Eyre Terrace; this represents a significant departure from the established model, which proposed a shelf-margin succession dominated by downslope processes. Our revised framework also distinguishes between major unconformities, which are mappable from the shelf to the upper slope, and minor unconformities that are largely restricted to the upper slope. The major unconformities delineate second- to third-order (2–13 My) frequencies of change in relation to sedimentary cycles across the margin, whereas the minor slope hiatuses locally punctuate these depositional packages giving rise to higher frequency third- to fourth-order (<1–2.5 My) cycles (periodicities based on Fulthorpe Reference Fulthorpe1991). The major unconformities are all characteristically angular and erosional (Table 4) and mark abrupt changes in the stratigraphic architecture of the outer margin. On the upper slope, we attribute the increased complexity of the Dugong Supersequence – manifested by the minor hiatuses and other unassigned discordances identified herein (Fig. 7) – largely to bottom-current erosional processes and sporadic mass wasting. Our results conflict with existing models of Mid-Palaeogene to Neogene–Quaternary unconformity formation on the Eyre Terrace (cf. Li et al. Reference Li, James and McGowran2003a, Reference Li, McGowran and Brunnurb, Reference Li, McGowran and Jamesc, Reference Li, Simo, McGowran and Holbourn2004), which predict that they all represent ‘local manifestations of major third-order boundaries’ (as defined by Hardenbol et al. Reference Hardenbol, Thierry, Farley, Jacquin, De Graciansky, Vail, De Graciansky, Hardenbol, Jacquin and Vail1998) and that global eustasy was ‘a dominant control’ on Cenozoic sedimentation in the Eucla Basin. Whilst we recognise some correlation between the different schemes (cf. Table 6), our stratigraphic interpretation challenges the status and significance of many of the hiatuses – especially within the Neogene succession – described by Li et al. (Reference Li, James and McGowran2003a, Reference Li, McGowran and Brunnur2003b, Reference Li, McGowran and James2003c, Reference Li, Simo, McGowran and Holbourn2004). Thus, in the following text, we focus on the shelf-margin and assess the likely processes that are responsible for these observations and interpretations and consider the implications in terms of the main geologic and oceanographic controls on the development of the Dugong Supersequence and concomitant shaping of the western GAB shelf-margin since the Mid-Eocene.
5.1. A revised shelf-margin stratigraphic model: implications for sedimentary and oceanographic processes shaping the western GAB
Over the last three to four decades, the notion that the shelf-edge in the western part of the GAB extended onto the Eyre Terrace as a series of extensive prograding clinoforms, especially during the Quaternary, has been widely promoted (Bein & Taylor Reference Bein and Taylor1991; James & von der Borch Reference James and von der Borch1991; James et al. Reference James, Boreen, Bone and Feary1994, Reference James, Bone, Carter and Murray-Wallace2006; Feary & James Reference Feary and James1995, Reference Feary and James1998; Shipboard Scientific Party 2000a; Saxena & Betzler Reference Saxena and Betzler2002; Feary et al. Reference Feary, Hine, James, Malone, Hine, Feary and Malone2004; Anderskouv et al. Reference Anderskouv, Surlyk, Huuse, Lykke-Andersen, Bjerager and Tang2010). It is the interpretation of the Quaternary sequence that has guided the currently accepted model whereby progradation is envisaged to have resulted from episodic off-shelf sediment transport by wave action combined with in situ deep-water carbonate production (James & von der Borch Reference James and von der Borch1991; James et al. Reference James, Boreen, Bone and Feary1994). The term ‘shaved shelf’ has been applied to this style of continental shelf (cf. James et al. Reference James, Boreen, Bone and Feary1994), whilst the relatively passive process of ‘autogenic progradation’ (cf. Boreen & James Reference Boreen and James1993) has been applied to the formation of the ‘stacked, shelf-margin system tracts’ (James et al. Reference James, Boreen, Bone and Feary1994). However, the schematic depiction of this process does not represent the seismic-stratigraphic expression of the Quaternary shelf-margin succession as presented in this study (Fig. 10). In the original model depiction of a shaved shelf presented by James et al. (Reference James, Boreen, Bone and Feary1994), and in a subsequent paper by Saxena & Betzler (Reference Saxena and Betzler2002), all the prograding clinoform packages are shown to terminate by toplap at a single horizontal surface. Inspection of the seismic profiles in Figures 6, 8, 9 shows that this is not the case; nor do we recognise the geometrical continuity of clinoforms from the shelf to the slope as depicted by previous authors (e.g., James & von der Borch 1992; James et al. Reference James, Boreen, Bone and Feary1994; Feary & James Reference Feary and James1995, Reference Feary and James1998; Feary et al. Reference Feary, Hine, James, Malone, Hine, Feary and Malone2004). In our view, the established seismic stratigraphic model does not adequately address the internal complexity of the Quaternary sequence and older shelf-margin succession of the Dugong Supersequence. In particular, the potential significance of alongslope currents in shaping the upper slope succession has been largely ignored.
Instead, our observations suggest that the Quaternary sequence on the upper slope provides a spectacular example of a current-controlled sediment body – the Eyre Terrace Drift. The scale (>500 m thick) and continuity (200 km long) of this elongate sediment drift suggests that relatively stable conditions prevailed in the bottom current regime and/or oceanographic setting during the last 2 My, notwithstanding episodic fluctuations in bottom-current strength and direction expressed in terms of grain-size variation, development of upslope-migrating sediment waves and erosional discontinuities (D2–D8 unconformities). The variability in current activity is generally a function of the complexity of the hydrodynamic regime, which in the GAB is well documented and includes: the presence of eastward- and westward-flowing boundary currents; large-scale eddies that distort the E–W flow patterns (Cresswell & Griffin Reference Cresswell and Griffin2004); and the periodic upflow of cold, nutrient-rich waters of the westward-flowing Flinders Current onto the Nullarbor Shelf, via the Eyre Terrace (cf. James et al. Reference James, Bone, Collins and Kyser2001 and references therein) (Figs 1, 11). Anderskouv et al. (Reference Anderskouv, Surlyk, Huuse, Lykke-Andersen, Bjerager and Tang2010) proposed that the sediment waves were driven by downslope density currents and dense water cascades originating on the shelf; however, their association with a contourite sediment drift and their subparallel-to-oblique orientation to the regional slope (Fig. 11; cf. Anderskouv et al. Reference Anderskouv, Surlyk, Huuse, Lykke-Andersen, Bjerager and Tang2010, fig. 4) suggest that an alongslope bottom-current origin cannot be discounted (Faugères et al. Reference Faugères, Stow, Imbert and Viana1999; Masson et al. Reference Masson, Howe and Stoker2002). In a comparable upper-slope setting on the SE Brazilian margin, the Brazil Current – a southward-flowing boundary current – locally generates eddies on an upper slope terrace whose activity interferes with shelf currents; the sedimentary consequences include the formation of clinoform patterns imprinted with sediment waves migrating along the trend of the current (Viana et al. Reference Viana, De Almeda, De Almeida, Stow, Pudsey, Howe, Faugères and Viana2002a; Schattner et al. Reference Schattner, Lobo, López-Quirós, dos Passos Nascimento and de Mahiques2019). Huuse & Feary (Reference Huuse and Feary2005) attributed the formation of both the drift and the sediment waves on the Eyre Terrace to activity of the Leeuwin Current; however, we would suggest that the bulk of the drift lies within the core of the zone of influence of the Flinders Current (Fig. 11; Table 3).
Schematic perspective model of Quaternary shelf-margin setting under the potential influence of a variety of bottom current and downslope gravity processes, as well as vertical (hemipelagic) flux (see text for details). Sediment wave pattern based on Anderskouv et al. (Reference Anderskouv, Surlyk, Huuse, Lykke-Andersen, Bjerager and Tang2010, fig. 4). Abbreviations: DWC, dense water cascades; FC, Flinders Current; LC/SAC, Leeuwin Current/South Australian Current; Sb, shelfbreak; Sw, sediment waves; WD, water depth.

The complexity of the hydrographic regime is also likely responsible for the variable internal reflection configuration that marks the interface between the upper slope drift and the equivalent aggrading-to-prograding outer-shelf section of the Quaternary sequence. The outer-shelf succession is interpreted to represent a pattern of alternating sedimentation and erosion driven by the high-amplitude, short-period sea-level fluctuations during the Quaternary (Boreen & James Reference Boreen and James1993; Feary & James Reference Feary and James1998; Feary et al. Reference Feary, Hine, James, Malone, Hine, Feary and Malone2004): the laterally prograding deposits on the outer shelf represent a lowstand system, when much of the shelf was exposed and contained large hypersaline lagoons with the coastline near the shelf-edge; in contrast, the present highstand system represents a flooded shelf with wave abrasion largely restricted to the inner shelf. Whereas during glacial periods the Leeuwin Current might have been much weaker, the South Australian Current probably remained active, and the Flinders Current may have intensified leading to conditions more favourable to upwelling; dense water cascades might also have persisted (Anderskouv et al. Reference Anderskouv, Surlyk, Huuse, Lykke-Andersen, Bjerager and Tang2010 and references therein). Nevertheless, uncertainty remains regarding the likely ‘downward shifting’ of the core of the boundary currents, in response to sea-level fall. Offshore SE Brazil, the core of the upper slope Brazil Current and its ‘depth of action’ both shifted downwards by several hundred metres during the Last Glacial Maximum; however, during sea-level rise, the boundary-current core shifted landward, bedforms developed on the uppermost slope and a shelf/slope front was (re-)established at the shelf-edge (Viana & Faugères Reference Viana, Faugères, Stoker, Evans and Cramp1998; Viana et al. Reference Viana, Hercos, De Almeida, Magalhães, De Andrade, Stow, Pudsey, Howe, Faugères and Viana2002b). The distinction and significance of any such temporal and spatial variation in boundary current activity on the southern Australian slope remains unclear. Our interpretation of the shelf-edge interface as depicted in Figures 8–10 shows that the deposits of the Eyre Terrace Drift aggraded upslope to the contemporary shelf-edge throughout its development. For the most part, the contact with the outer shelf prograding system remains unclear, albeit resembling a large-scale coeval interference pattern between a prograding shelf-edge cut-and-fill complex and an aggrading sediment drift/wave field, though the low resolution of the seismic data precludes certainty. Although the details of the shelf-edge interface need to be better clarified, this reflection pattern might suggest that sedimentation mechanisms related to retreating-shore dynamics and outer shelf bottom-current reworking – essentially reflecting a shelf/slope hydrodynamic interface – are responsible for its complexity. In the Canterbury Basin, offshore New Zealand, a comparable, disturbed seismic-stratigraphic architecture on the outer shelf has been attributed to the effect of alongslope current activity by creating mounded morphologies and disrupting reflection terminations (Lu & Fulthorpe Reference Lu and Fulthorpe2004). Much further detailed work in the GAB is required to address this issue.
Although the predominance of alongslope processes in the construction of the Quaternary upper slope succession conflicts with the established model of shelf-margin progradation via downslope processes of resedimentation, it does not necessarily negate the contribution of shelf-derived material to the build-up of the contourite drift. Whereas in abyssal drifts along many continental margins the provenance of sediment can often be traced to areas thousands of kilometres upstream of the drift (e.g., the Greater Antilles Outer Ridge: Tucholke Reference Tucholke, Stow, Pudsey, Howe, Faugères and Viana2002), the Eyre Terrace Drift is a relatively shallow water deposit, and the occurrence of neritically derived benthic foraminifers and well-preserved bryozoan fragments, together with sporadically interbedded turbidite and slump deposits, suggests that at least some of its sediment was derived from the adjacent shelf (Feary et al. Reference Feary, Hine and Malone2000; James et al. Reference James, Feary, Surlyk, Simo, Betzler, Holburn, Li, Matsuda, Machiyama, Brooks, Andres and Malone2000, Reference James, Feary, Betzler, Bone, Holburn, Li, Machiyama, Simo and Surlyk2004). Eddies and storm- and tide-driven currents commonly induce off-shelf spillover of material onto the slope, which might induce the generation of mass transport processes (Fig. 11). Farther to the SE, it has been demonstrated that regularly occurring dense water cascades throughout the Quaternary contributed to the formation of the Bass Canyon of the Gippsland Basin, offshore SE Australia (Mitchell et al. Reference Mitchell, Holgate, Wallace and Gallagher2007). By analogy, a similar process may have been important in the development of canyons in the GAB. However, based on the generally subordinate presence of sediment gravity flow deposits proved within the Quaternary upper slope succession, it is probable that any muddy and fine-sand grade material (at least) derived from the adjacent shelf and/or more distant sources (located either E or W), including off-shelf spillover or vertical (hemipelagic) flux, was prone to current-controlled redistribution along the slope (Fig. 11). Velocities associated with the eastward- and westward-flowing boundary currents commonly range between 0.2 and 0.5 ms−1, and are strong enough to winnow and entrain the sediment and shape the clinoform geometry of the Eyre Terrace Drift (Black et al. Reference Black, Peppe and Gust2003; Masson et al. Reference Masson, Wynn and Bett2004).
In assessing the longer-term importance of alongslope and downslope processes on the upper slope, our observations are considered together with data from the wider southern Australian margin (Fig. 12). The abundant seismic-stratigraphic evidence for sediment drift development during the Mid–Late Eocene, Oligocene and Pliocene, as well as the overall fine-grained and strongly bioturbated background sedimentary character to the entire Middle Eocene–Pliocene succession, demonstrates a longevity to alongslope processes extending back into the Palaeogene. These observations are consistent with the discovery of an upper Middle Eocene–Recent succession of contourite deposits and bottom current erosional features on the deep-water Ceduna Terrace, located to the SE of the study area (Jackson et al. Reference Jackson, Magee and Hunt-Stewart2019) (Fig. 1). Collectively, these data add to the growing belief that an oceanic circulation pattern has existed offshore southern Australia since the mid-Palaeogene, which has led some workers to speculate the presence of an eastward-flowing proto-Leeuwin Current (e.g., McGowran et al. Reference McGowran, Li, Cann, Padley, McKirdy and Shafik1997; Stickley et al. Reference Stickley, Brinkhuis, Schellenberg, Sluijs, Röhl, Fuller, Grauert, Huber, Warnaar and Williams2004; Sauermilch et al. Reference Sauermilch, Whittaker, Bijl, Totterdell and Jokat2019) (Fig. 12). It remains unclear as to what role, if any, the westward-flowing Flinders Current might have played during the development of the Palaeogene oceanic circulation. Its link to the Tasman Outflow (Wijeratne et al. Reference Wijeratne, Pattiaratchi and Proctor2018) and its association with the ACC suggest that it might have been instigated in the Early Oligocene (Exon et al. Reference Exon, Kennett and Malone1999; Norvick & Smith Reference Norvick and Smith2001). Although the detail remains to be worked out, this general scenario supports our interpretation that the development of the Middle Eocene–Oligocene sequences on the Eyre Terrace were, at least in part, influenced by bottom currents.
Middle Eocene–Pleistocene tectonostratigraphy for the Dugong Supersequence in the western GAB. The compilation of the unconformities (red, main seismically mappable surfaces on shelf; purple, minor, mostly localised to upper slope; grey bands, approximate range of hiatus), upper slope margin-shaping processes and depositional geometry of the shelf from the GAB is from this study, except ‘Ceduna Terrace bottom currents' from Jackson et al. (Reference Jackson, Magee and Hunt-Stewart2019); the representation of the shelf succession is based on ODP site 1132 and the Apollo-1 well, as presented in Figure 7. Additional information is derived from the following sources: under the ‘South Australian Margin’ column, tectonic events and seafloor spreading rates are adapted from Totterdell et al. (Reference Totterdell, Blevin, Struckmeyer, Bradshaw, Colwell and Kennard2000), Norvick & Smith (Reference Norvick and Smith2001), Sayers et al. (Reference Sayers, Bernardel and Parumes2003), Li et al. (Reference Li, Simo, McGowran and Holbourn2004), Hou et al. (Reference Hou, Frakes, Sandiford, Worrall, Keeling and Alley2008), Holford et al. (Reference Holford, Hillis, Duddy, Green, Stoker, Tuitt, Backé, Tassone and MacDonald2011a, Reference Holford, Tuitt, Hillis, Green, Stoker, Duddy, Sandiford and Tassone2014), Mahon & Wallace (Reference Mahon and Wallace2020) and Reynolds et al. (Reference Reynolds, Holford, Schofield and Ross2017), and palaeoceanographic data are from McGowran et al. (Reference McGowran, Li, Cann, Padley, McKirdy and Shafik1997), Stickley et al. (Reference Stickley, Brinkhuis, Schellenberg, Sluijs, Röhl, Fuller, Grauert, Huber, Warnaar and Williams2004), Wyrwoll et al. (Reference Wyrwoll, Greenstein, Kendrick and Chen2009); Bijl et al. (Reference Bijl, Bendle, Bohaty, Pross, Schouten, Tauxe, Stickley, McKay, Röhl, Olney, Sluijs, Escutia and Brinkhuis2013, Reference Bijl, Houben, Hartman, Pross, Salabarnada, Escutia and Sangiorgi2018), Scher et al. (Reference Scher, Whittaker, Williams, Latimer, Kordesch and Delaney2015), Sangiorgi et al. (Reference Sangiorgi, Bijl, Passchier, Salzmann, Schouten and McKay2018) and Sauermilch et al. (Reference Sauermilch, Whittaker, Bijl, Totterdell and Jokat2019); under the ‘Global Stratigraphic & Sea Level Scenarios’ column, sequence boundaries are from Gradstein et al. (Reference Gradstein, Ogg, Schmitz and Ogg2012), T/R facies cycles are from Hardenbol et al. (Reference Hardenbol, Thierry, Farley, Jacquin, De Graciansky, Vail, De Graciansky, Hardenbol, Jacquin and Vail1998), and the short-term sea level curve is derived from Haq & Al-Qahtani (Reference Haq and Al-Qahtani2005) and Totterdell et al. (Reference Totterdell, Struckmeyer, Bernecker and Kelman2014). Abbreviations: ACC, Antarctic Circumpolar Current; AL, Abrakurrie Limestone Formation; AS, aggrading shelf; BBIC, Bight Basin Igneous Complex; ETD, Eyre Terrace Drift; HS, Hampton Sandstone; NL, Nullarbor Limestone Formation; PS, prograding shelf; TL, transgressive lag; UP, Upper Pidinga Formation; WBL, Wilson Bluff Limestone Formation. (See Table 4 for key to unconformities.) Timescale is based on Gradstein et al. (Reference Gradstein, Ogg, Schmitz and Ogg2012).

An increased prevalence of mass movement processes characterises the Neogene succession on the upper slope. Whereas the Eucla Canyon has been a conduit for mass-flow deposits since the Mid-Eocene, the Miocene–Pliocene appears to have witnessed an increased general instability on the shelf-margin. The most significant expression of this instability is the Late Neogene slide that resulted in a major slump deposit (of Upper Miocene sediment) on the central part of the Eyre Terrace (Figs 8b, 10). An increase in tectonic activity on the SE Australian margin is apparent from the Late Miocene onwards (Fig. 12), manifested by widespread fault reactivation, uplift and folding, accelerated uplift of highlands (including the Mt. Lofty Range of South Australia) and the development of a regional Late Miocene–Early Pliocene unconformity observed in basins such as the Otway, Torquay and Gippsland basins (Dickinson et al. Reference Dickinson, Wallace, Holdgate, Gallagher and Thomas2002; Holford et al. Reference Holford, Hillis, Duddy, Green, Stoker, Tuitt, Backé, Tassone and MacDonald2011a, and references therein). Although the Eucla Basin is largely undeformed, regional west-up tilting of the basin occurred in the late Mid-Miocene (Benbow et al. Reference Benbow, Lindsay, Alley, Drexel and Preiss1995; Feary & James Reference Feary and James1998) after the deposition of the Nullarbor Limestone Formation (Sandiford Reference Sandiford2007). Moreover, the Late Neogene slide, tentatively dated as late Tortonian (this study), fits within the 10–5 Ma best estimate for the age of the regional unconformity (Holford et al. Reference Holford, Hillis, Duddy, Green, Tassone and Stoker2011b). It should be noted that vigorous contour currents can erosively undercut submarine slopes, which might result in or enhance the inherent gravitational instability of the margin, thereby generating slides and slumps. It is interesting to note that the present-day vigour of the ACC was established since ~11 Ma (Fig. 12), which might have implications for a strengthening of the Flinders Current during the Late Neogene and Quaternary and its impact on the southern Australian margin. Any potential link between tectonics, gravitational instability and contour currents in this area remains to be established.
The Late Neogene Slide scar was subsequently buried beneath a Pliocene ‘infill drift’ (Figs 8b, 10). The scale of this accumulation combined with the thick Quaternary Eyre Terrace Drift suggest a significant increase in the influence of bottom currents since about 5 Ma offshore southern Australia, and especially since 2 Ma when, following a major phase of erosion on the shelf and slope (the D10 unconformity), the Eyre Terrace Drift accumulated rapidly (as described above). Factors influencing a general change in ocean dynamics (including the Leeuwin, South Australian and Flinders currents) since the late Neogene also remain to be assessed.
5.2. Appraising the significance of unconformities on the outer margin: implications for their causal mechanism
Li et al. (Reference Li, James and McGowran2003a, Reference Li, Simo, McGowran and Holbourn2004) interpreted their series of Middle Palaeogene to Neogene–Quaternary hiatuses (Fig. 4; Table 6) as an indicator that global eustasy was ‘a dominant control’ on the Cenozoic sedimentary development of the southern Australian continental margin, especially during the Neogene. This hypothesis was predicated on the assumption that all their hiatuses coincided with third-order global sequence boundaries as delineated by Hardenbol et al. (Reference Hardenbol, Thierry, Farley, Jacquin, De Graciansky, Vail, De Graciansky, Hardenbol, Jacquin and Vail1998) (Table 6). The Palaeogene hiatuses (A–D) were interpreted to record regional sea-level changes driven by a series of rapid changes in Southern Ocean seafloor spreading rates (Li et al. Reference Li, James and McGowran2003a), whereas the Neogene–Quaternary unconformities (H1–H15) were attributed primarily to a glacio-eustatic control, and the three ‘mega-hiatuses’ (MH1–MH3) that more likely represented sediment removal rather than non-deposition were interpreted as being caused by large-scale slope failure driven by differential uplift and subsidence (Li et al. Reference Li, Simo, McGowran and Holbourn2004). Notwithstanding the general uncertainty surrounding putative schemes that purport to the existence of a globally correlatable suite of eustatic cycles (cf. Miall Reference Miall1997), we find their hypothesis to be inconsistent with the stratigraphic results presented here. Our reasons are summarised below.
As previously noted, the existing scheme of unconformities lacks stratigraphic context beyond the limit of the boreholes (ODP sites 1126, 1130, 1132 and 1134) in which they have been identified. The correlation chart and resultant schematic fence diagram presented both for the Palaeogene (Li et al. Reference Li, James and McGowran2003a, fig. 5) and Neogene–Quaternary (Li et al. Reference Li, Simo, McGowran and Holbourn2004, fig. 3) successions in these boreholes bear no resemblance to the actual geology of their shelf-margin setting as determined in this study by seismic interpretation. In particular, the existing scheme does not recognise the Late Neogene Slide between sites 1132 and 1130; nor the physical separation of the Eocene sequence on the outer shelf (site 1132) and upper slope (sites 1130, 1126 and 1134); nor the seismic expression of surfaces of discontinuity common throughout the upper-slope succession. Based on these observations, an appraisal of the existing scheme shows that MH2 of Li et al. (Reference Li, Simo, McGowran and Holbourn2004) correlates with our Late Neogene Slide surface at site 1130, and with the Upper Miocene D15 unconformity at sites 1126, 1132 and 1134 – that is, MH2 as previously defined does not represent a single surface of slope failure. We note also that MH3 of Li et al. (Reference Li, Simo, McGowran and Holbourn2004) correlates with our regional Base Quaternary D10 unconformity, whilst MH1 correlates with our Lower Miocene D20 unconformity (probably a composite D20/D15 hiatus at site 1130) (Table 6); again, neither of these hiatuses are the result of large-scale slope failure. Moreover, the discontinuous nature of many of the unconformities in the existing scheme is exemplified by the intra-Eocene hiatuses B and C (Li et al. Reference Li, James and McGowran2003a), and the bulk of the Neogene–Quaternary hiatuses (H2–H7, H9–H11, H14–15) (Li et al. Reference Li, Simo, McGowran and Holbourn2004). Our preferred interpretation of the former is that they represent erosional hiatuses associated with the development of the Eocene elongate mounded sediment drift on the upper slope; the latter discontinuities are mostly associated with discrete slump deposits and current-scoured erosion surfaces that commonly vary stratigraphically between sites (Table 6; Fig. 7). In our view, these results are consistent with highly localised discontinuities of restricted extent on the upper slope.
Logically, eustatic sea-level changes should leave their impact on the sedimentary architecture of strata, especially on continental shelves. However, we find no expression of these hiatuses (B, C, H2–H7, H9–H11, H14–15) on the adjacent shelf. According to Lu & Fulthorpe (Reference Lu and Fulthorpe2004), the limited areal distribution of unconformities is generally an indicator that such unconformities are not sequence boundaries. Thus, we would urge caution when considering the consequences of global correlations made by Li et al. (Reference Li, James and McGowran2003a, Reference Li, Simo, McGowran and Holbourn2004) to these specific sets of hiatuses on the upper slope. The abundant evidence presented in this study, and from Jackson et al. (Reference Jackson, Magee and Hunt-Stewart2019), for oceanographic current activity in the GAB since the Mid-Eocene (Fig. 12) presents a new variable, previously not considered in the established model of southern margin development, that the formation of some of the hiatuses on the upper slope is simply a result of intermittent erosion and/or non-deposition in response to fluctuations in alongslope bottom-current strength.
There is no doubt that the unconformity-bounded stratigraphic architecture of the Dugong Supersequence beneath the Nullarbor Shelf reflects significant changes in relative sea level across the Eucla Basin. However, the angular, erosional character of the major margin-wide unconformities together with the abrupt changes in sequence architecture are not consistent with generation by passive sea-level changes (Galloway Reference Galloway1989; Embry Reference Embry and Cross1990). Inspection of Figure 12 shows no clear correlation of our major sequence-bounding unconformities to the global cycle charts. Instead, they appear to be most closely related to tectonic events, which are summarised below:
• The Middle Eocene D40 unconformity (≡A of Li et al. Reference Li, James and McGowran2003a) is generally attributed to subsidence of the southern Australian margin in response to an acceleration of the seafloor spreading rate at ~43 Ma (Totterdell et al. Reference Totterdell, Blevin, Struckmeyer, Bradshaw, Colwell and Kennard2000). This reflects a margin-wide event that elsewhere included a strong phase of Mid-Eocene inversion, uplift and exhumation in SE Australian basins (McGowran et al. Reference McGowran, Holdgate, Li and Gallagher2004; Holford et al. Reference Holford, Hillis, Duddy, Green, Stoker, Tuitt, Backé, Tassone and MacDonald2011a).
• A further acceleration in spreading rate at ~34 Ma coincides with the Base Oligocene D30 unconformity (≡D of Li et al. Reference Li, James and McGowran2003a). The onset of west-up–east-down uplift and tilting – ‘dynamic topographic tilting’ – of the Eucla Basin is also recorded from the onshore sedimentary succession around this time (~37–35 Ma) (Sandiford Reference Sandiford2007; Hou et al. Reference Hou, Frakes, Sandiford, Worrall, Keeling and Alley2008).
• A combination of further changes in spreading rate (Li et al. Reference Li, Simo, McGowran and Holbourn2004), continued intermittent compressional deformation offshore SE Australia (Holford et al. Reference Holford, Hillis, Duddy, Green, Stoker, Tuitt, Backé, Tassone and MacDonald2011a) and dynamic tilting of the Eucla Basin following the deposition of the Abrakurrie Limestone Formation (Hou et al. Reference Hou, Frakes, Sandiford, Worrall, Keeling and Alley2008) span the Mid-Oligocene D25 (≡Mid-Oligocene of Li et al. Reference Li, McGowran and James2003c), Base Miocene D22 (≡H1 of Li et al. Reference Li, Simo, McGowran and Holbourn2004) and Early Miocene D20 unconformities.
• As noted above (section 5.1), a significant increase in tectonic activity is recorded from the Late Miocene onwards. The onshore Eucla Basin succession preserves a record of several hundred metres of differential vertical movement after the deposition of the Nullarbor Limestone Formation, which resulted in seaward tilting and localised faulting of the basin (Feary & James Reference Feary and James1998; Sandiford Reference Sandiford2007; Hou et al. Reference Hou, Frakes, Sandiford, Worrall, Keeling and Alley2008). On the Nullarbor Shelf, the Upper Miocene D15 (≡H8 of Li et al. Reference Li, Simo, McGowran and Holbourn2004) unconformity marks the base of an Upper Miocene–Quaternary offlapping succession that is restricted to the outer shelf and upper slope (Fig. 10). A general instability along the shelf-margin is indicated by the formation of the Late Neogene Slide and associated mass-flow deposits. That this area of instability is part of a larger region of late Neogene deformation is supported by evidence of widespread uplift, folding and unconformity development in many SE Australian basins (Dickinson et al. Reference Dickinson, Wallace, Holdgate, Gallagher and Thomas2002; Holford et al. Reference Holford, Hillis, Duddy, Green, Stoker, Tuitt, Backé, Tassone and MacDonald2011a, Reference Holford, Tuitt, Hillis, Green, Stoker, Duddy, Sandiford and Tassone2014).
• The Base Quaternary D10 (≡MH1 of Li et al. Reference Li, Simo, McGowran and Holbourn2004) unconformity represents the most dramatic angular unconformity on the outer margin, characterised by significant erosion of the underlying Middle–Upper Miocene and Pliocene rocks on the outer shelf and upper slope (Figs 6, 8, 9). Onshore, the preservation of the Upper Pliocene–Lower Pleistocene Roe Calcarenite (Fig. 4) has been attributed by James et al. (Reference James, Bone, Carter and Murray-Wallace2006) to uplift immediately after deposition; they further suggested that the uplift correlated with the MH1 hiatus of Li et al. (Reference Li, Simo, McGowran and Holbourn2004), our D10 unconformity, and inferred a widespread Pliocene/Pleistocene boundary uplift event. The intense erosional scouring associated with D10 on the upper slope followed by the deposition of the Eyre Terrace Drift suggests that the formation of this unconformity was, at least in part, generated by vigorous bottom-current activity.
Arguably, the availability of tectonic mechanisms to explain our major (second- to third-order) stratigraphic cyclicity negates the requirement for global eustasy as a primary mechanism in the generation of the stratigraphic architecture in the Eucla Basin. Whereas we note the close comparison between our D25 and D15 unconformities with significant ‘global’ drops of sea level as presented on the short-term sea level curve of Haq & Al-Qahtani (Reference Haq and Al-Qahtani2005) (Fig. 12), it cannot be ignored that these unconformities also correspond with regional tectonic events. Nevertheless, the restricted preservation of the post-D15 Upper Miocene succession to the outer margin might be a function of the generally low global sea level throughout the Late Miocene exposing the bulk of the Eucla Basin (to the north). Although Li et al. (Reference Li, James and McGowran2003a, Reference Li, Simo, McGowran and Holbourn2004) acknowledged the contribution of tectonic activity in the formation of their Palaeogene and Late Neogene hiatuses, their primary emphasis was on eustatic control ‘complicated by local tectonics’. In our appraisal of their unconformities, we have demonstrated that the bulk of their hiatuses on the upper slope were most probably the result of localised sedimentary processes with no direct correlation to global cyclicity.
There is a strong temporal correspondence of our major unconformities (including also D25, D22 and D15) with periods of enhanced tectonic activity in SE Australian basins, which themselves correspond with major reconfigurations of the Indo-Australian Plate (Holford et al. Reference Holford, Hillis, Duddy, Green, Stoker, Tuitt, Backé, Tassone and MacDonald2011a). Compressional deformation is pervasive on the SE Australian margin whereas the Eucla Basin is characterised by differential vertical movements during these periods (Fig. 12). Despite this tectonic variability along the margin, the correlation of events suggests a coordinated geodynamic response to the late post-breakup transmission of plate boundary stresses into the plate interior. The absence of inversion structures from the Eucla Basin is commonly regarded as an indication that the overall geodynamic response was much less in this basin than farther east; however, the outer-margin succession of the Dugong Supersequence preserves a record of the sensitivity to plate boundary processes that cannot be ignored in consideration of the control of the late post-breakup vertical motions across the Eucla Basin.
By way of contrast, the intra-Quaternary D2–D8 unconformities reflect a fourth-order or higher frequency cyclicity (Table 4). These unconformities are inextricably linked to the development of the Eyre Terrace Drift, and most probably correspond to episodes of increased bottom current circulation linked to hydrological fluctuation. In the Quaternary, such fluctuations are probably linked to global climate fluctuations and glacio-eustatic sea-level changes, which can determine changes in ocean surface temperatures, the nature and generation of different water masses (surface and deep) and the oceanic circulation pattern (wind-driven and thermohaline) (Faugères et al. Reference Faugères, Stow, Imbert and Viana1999; Faugères & Stow Reference Faugères, Stow, Rebesco and Camerlenghi2008). However, at present, there is no clear link between the timing of formation of the D2–D8 unconformities and hydrological fluctuation at the scale of interglacial–glacial cycles. Anderskouv et al. (Reference Anderskouv, Surlyk, Huuse, Lykke-Andersen, Bjerager and Tang2010) have demonstrated that formation and accretion of sediment waves in the upper part of the Eyre Terrace Drift occurred during both glacial and interglacial phases. Such uncertainty in attempting to relate particular climatic conditions (and, hence, sea level) to particular intensities of bottom currents is further echoed by a number of studies in the northern and southwestern Atlantic Ocean (cf. Faugères et al. Reference Faugères, Stow, Imbert and Viana1999; Faugères & Stow Reference Faugères, Stow, Rebesco and Camerlenghi2008 and references therein) that show more or less random variation in drift development related to current intensity. Further speculation on this issue is beyond the scope of this paper.
6. Conclusions
This study has presented an appraisal of the stratigraphic framework of the Dugong Supersequence in the western GAB. By combining seismic reflection and sedimentary data, it has been possible to identify the large-scale pattern of sedimentation and basin development on the outer part of the Eucla Basin. The following key points should be noted:
• A revised seismic-stratigraphic framework for the Dugong Supersequence on the shelf-margin of the Eucla Basin is characterised by four main depositional packages – Middle–Upper Eocene, Oligocene–lowest Miocene, upper Lower–Upper Miocene and Quaternary – bounded by four regionally mappable unconformities, D10–D40. Pliocene deposits are restricted to the upper slope. These depositional packages are further divided on the outer shelf and upper slope by localised unconformities of more limited extent.
• Whereas the shelf succession comprises a predominantly aggrading-to-prograding succession of carbonate platform and ramp deposits, the sediments at the shelf-edge and on the upper slope are dominated by contourites. The Quaternary Eyre Terrace Drift is an elongate mounded drift and represents the most conspicuous seismic-stratigraphic expression of alongslope sedimentation, though smaller-scale manifestations of contourite drifts are preserved in the Eocene (separated drift), Oligocene (plastered drift) and Pliocene (infill drift) rocks.
• The Neogene succession on the upper slope displays evidence of instability on the margin, best expressed by the Late Neogene Slide (Late Miocene) and associated mass movement deposits. Nevertheless, the Miocene sequence is dominated by fine-grained and strongly bioturbated material comparable with the underlying and overlying sequences, suggesting that alongslope processes might have prevailed as background sedimentation.
• The tectonostratigraphic setting of the Dugong Supersequence indicates that the late post-breakup development of the Eucla Basin was characterised by long-term tectonic instability and differential vertical motions. This is expressed by a series of angular and erosive unconformities that mark abrupt changes in sequence architecture consistent with tectonic activity. Correlation with periods of enhanced tectonic activity in SE Australian basins suggests that this instability was an integral part of the regional geodynamic response of the southern Australian margin to late post-breakup transmission of intra-plate stresses.
Our results have profound implications for the Cenozoic sedimentary and tectonic development of the southern Australian margin. The influence of alongslope currents on sedimentary processes on the shelf-margin since the Mid-Eocene has not previously been considered for the western GAB, whilst the availability of tectonic mechanisms, combined with our critical appraisal of previously defined hiatuses on the upper slope as third-order global sequence boundaries, challenges putative models (e.g., Li et al. Reference Li, James and McGowran2003a, Reference Li, Simo, McGowran and Holbourn2004) that cite global eustasy as the primary control on the stratigraphic architecture of the Eucla Basin. Thus, there is much scope for the development of a new and more comprehensive model of late post-breakup continental margin development, offshore southern Australia, which considers how the stratigraphic and sedimentological information presented in this paper can contribute to a better understanding of the tectonic and oceanographic development of the wider Australian–Antarctic Basin. In particular, this study and others (e.g., Jackson et al. Reference Jackson, Magee and Hunt-Stewart2019) provide a geological record of erosional and depositional contourite bedforms that can be used to assess and constrain the long-term influence of alongslope currents that have shaped the southern Australian margin. Whereas the role of boundary currents that currently bathe this margin, such as the Leeuwin, South Australian and Flinders currents, is well known, their palaeoceanographic significance and interaction remains uncertain, as does the configuration of palaeo-circulation patterns. Establishing exactly what configuration of boundary currents and water masses would best explain the style, pattern and distribution of the preserved bedforms should be a key objective of future work.
7. Acknowledgements
The authors would like to thank Jane Blevin for her constructive review of this paper. Seismic reflection data were supplied by Petroleum Geo-Services (PGS) as part of their Southern Australian Margin Digital Atlas, which we gratefully acknowledge. We also thank IHS Markit for provision of Kingdom software. Martyn Stoker and Jennifer Totterdell gratefully acknowledge the award of Visiting Research Fellow titles in the Australian School of Petroleum and Energy Resources. Simon Holford gratefully acknowledges funding support from the South Australian Department for Energy and Mining.


