





1. Introduction
Unlike ordinary fluids, a granular packing can remain at rest even with an inclined free surface. This seemingly simple observation points to a key feature of granular matter: the intrinsic dissipative nature of interparticle interactions, which distinguishes granular materials from conventional solids, liquids and gases (Thompson & Huppert Reference Thompson and Huppert2007; Coppin et al. Reference Coppin, Henry, Cabrera, Azéma, Dubois, Legat and Lambrechts2023; Wang et al. Reference Wang, Zhou, Man and Huppert2026a , Reference Wang, Zhou, Man, Xie and Huppert2026b ). When the slope exceeds a critical threshold, a phase transition from a solid-like to a fluid-like state occurs (Bonamy, Daviaud & Laurent Reference Bonamy, Daviaud and Laurent2002; Marteau & Andrade Reference Marteau and Andrade2018), giving rise to a free-surface flow characterised by a thin granular flowing layer near the unconfined surface and a largely static bulk underneath (Dong et al. Reference Dong, Wang, Marks, Chen and Gan2023; Man, Huppert & Galindo-Torres Reference Man, Huppert and Galindo-Torres2025). The highly intricate and heterogeneous nature of such flows makes their dynamics challenging to characterise and predict. As a primary example, landslides exhibit this surface dynamics (Lucas, Mangeney & Ampuero Reference Lucas, Mangeney and Ampuero2014; Bouchut et al. Reference Bouchut, Fernández-Nieto, Mangeney and Narbona-Reina2016; Man et al. Reference Man, Huppert, Li and Galindo-Torres2021, Reference Man, Wang, Huppert, Ren, Galindo-Torres, Zhang and Zhou2026); however, recent events have shown that they can initiate on slopes below 5° and propagate over remarkably long distances, far beyond the limits predicted by conventional stability analyses (Gee et al. Reference Gee, Uy, Warren, Morley and Lambiase2007; Dai et al. Reference Dai, Zhang, Hu, Mao, Huang, Hua, Yang, Zhang and Zheng2025). This highlights the limitations of current understanding of granular surface flows and the need for deeper insight to improve natural hazard assessment and risk mitigation.
Understanding the mechanisms governing granular surface flows often involves specific experimental configurations capable of producing prototypical flows. Among these, the rotating drum has been widely recognised as a benchmark test model due to its relatively simple geometry and rich surface flow dynamics (Chen et al. Reference Chen, Suo, Dong, Zhong, Wei and Gan2024; Maguire et al. Reference Maguire, Barker, Rauter, Johnson and Gray2024; Vu et al. Reference Vu, Amarsid, Delenne, Richefeu and Radjai2024; Jin et al. Reference Jin, Zhou, Liu, Gao, Xie and Tao2025). In this configuration, a steady flow can be achieved through gravity-driven surface motion as drum rotation continuously transports the granular material upward. The corresponding flow field consists of an upward, solid-like rigid motion following the drum wall, downward surface flow and a well-defined free surface, sharing the same physical characteristics as the typical granular surface flows discussed above (Orpe & Khakhar Reference Orpe and Khakhar2007; Wang et al. Reference Wang, Barés, Renouf and Azéma2025), as shown in figure 1.
Based on the rotating drum apparatus, which provides a controllable and repeatable environment for systematic investigation, the flow dynamics of granular materials has been extensively studied, with particular attention to their dependence on rotation speed (Rajchenbach Reference Rajchenbach1990), drum size (Orozco et al. Reference Orozco, Delenne, Sornay and Radjai2020) and particle properties (Ma & Zhao Reference Ma and Zhao2018). In particular, with an increase in rotation speed for a given granular assembly, the flow can be classified into six distinct surface flow regimes (Mellmann Reference Mellmann2001; Dong et al. Reference Dong, Wang, Marks, Chen and Gan2023), among which the rolling and cascading regimes are the most representative, as they correspond to continuous and steady surface flows with a nearly flat or S-shaped free surface (Govender Reference Govender2016). In both regimes, the influence of these system parameters on granular flow is commonly characterised by the evolution of the free-surface profile and bulk flow quantities, such as the flowing layer thickness δ
0 and dynamic angle of repose $\beta$
0 (Pignatel et al. Reference Pignatel, Asselin, Krieger, Christov, Ottino and Lueptow2012). As such, it has been reported that the normalised flowing layer thickness δ
0
/d, where d is the particle diameter, follows a power-law relationship with the rotation speed
$\beta$
0 (Pignatel et al. Reference Pignatel, Asselin, Krieger, Christov, Ottino and Lueptow2012). As such, it has been reported that the normalised flowing layer thickness δ
0
/d, where d is the particle diameter, follows a power-law relationship with the rotation speed $\omega$
as
$\omega$
as $\delta _{0}/d\propto \omega ^{n}$
, with the exponent n varying from 0.17 to 0.68 as the drum-to-particle size ratio D/d increases (Félix et al. Reference Félix, Falk and D’Ortona2007). While not a dimensionally strict scaling law, this relation provides a phenomenological fit that captures the observed experimental trends. In a similar manner, the maximum surface angle has been found to increase systematically with both
$\delta _{0}/d\propto \omega ^{n}$
, with the exponent n varying from 0.17 to 0.68 as the drum-to-particle size ratio D/d increases (Félix et al. Reference Félix, Falk and D’Ortona2007). While not a dimensionally strict scaling law, this relation provides a phenomenological fit that captures the observed experimental trends. In a similar manner, the maximum surface angle has been found to increase systematically with both $\omega$
and D/d, whereas the latter effect tends to saturate at larger D/d values (Chou & Hsiau Reference Chou and Hsiau2012; Orozco et al. Reference Orozco, Delenne, Sornay and Radjai2020; Preud’homme et al. Reference Preud’homme, Lumay, Vandewalle and Opsomer2021).
$\omega$
and D/d, whereas the latter effect tends to saturate at larger D/d values (Chou & Hsiau Reference Chou and Hsiau2012; Orozco et al. Reference Orozco, Delenne, Sornay and Radjai2020; Preud’homme et al. Reference Preud’homme, Lumay, Vandewalle and Opsomer2021).
Conceptual illustration of granular surface flow and its analogue in a rotating drum. The yellow solid line marks the interface between the downward surface flow and solid-like region.

Figure 1. Long description
The image depicts a conceptual illustration of granular surface flow and its analogue in a rotating drum. On the left side, particles are shown flowing down a slope with a labeled slope angle beta. The flowing direction is indicated by an arrow. A representative flow domain is highlighted, showing the movement of particles. On the right side, a cross-sectional view of a rotating drum is shown, with particles inside. The drum rotates at a speed omega, causing the particles to move. The free surface, downward surface flow, and solid-like region are labeled. The interface between the downward surface flow and the solid-like region is marked by a yellow solid line. Sheared particles are shown near the free surface, and gravity is indicated by an arrow pointing downward.
However, most previous investigations have been limited to dry granular flows in rotating drums, and the mechanism governing the flow dynamics of cohesive granular materials remains elusive. In fact, granular materials in natural hazards often involve interstitial fluids (Jarray, Magnanimo & Luding Reference Jarray, Magnanimo and Luding2019; Liu et al. Reference Liu, Zhou, Shen, Li and Arulrajah2021; Dai et al. Reference Dai, Zhang, Hu, Mao, Huang, Hua, Yang, Zhang and Zheng2025). The presence of even a small amount of liquid can significantly alter the dynamic response of granular assemblies, which is attributed to the additional cohesion generated by non-uniform liquid bridges connecting contacting or neighbouring particles (Brewster, Grest & Levine Reference Brewster, Grest and Levine2009; Liao & Huang Reference Liao and Huang2021). Compared with the cohesionless cases, the work of Tegzes, Vicsek & Schiffer (Reference Tegzes, Vicsek and Schiffer2003), Alexander et al. (Reference Alexander, Chaudhuri, Faqih, Muzzio, Davies and Tomassone2006) and Pol, Artoni & Richard (Reference Pol, Artoni and Richard2025) demonstrated that cohesive granular systems exhibit even more complex flow behaviour, as interparticle cohesion can give rise to new motion regimes and a distinct avalanche dynamics. Specifically, as cohesion increases, the surface flow gradually transitions toward a plug flow, characterised by a plug-like region overlying a lower shear band (Rognon et al. Reference Rognon, Roux, Naaïm and Chevoir2008; Mandal, Nicolas & Pouliquen Reference Mandal, Nicolas and Pouliquen2020). Meanwhile, the increase in cohesion also manifests macroscopically as a convex free surface with a steeper slope and thicker flowing layer, whose variations tend to saturate at high cohesion levels (Brewster et al. Reference Brewster, Grest and Levine2009; Preud’homme et al. Reference Preud’homme, Lumay, Vandewalle and Opsomer2021). Correspondingly, a higher rotation speed is required to trigger the transition from the rolling to cascading regime, reflecting the interplay and competition among inertial, cohesive and gravity-driven effects acting on the particles (Dong et al. Reference Dong, Wang, Marks, Chen and Gan2023). Such complexity is further manifested in the particle-size dependence of the dynamic angle of repose on rotation speed. While coarse cohesive materials typically exhibit an increase in surface angle with increasing rotation speed (Jarray et al. Reference Jarray, Magnanimo and Luding2019; Dong et al. Reference Dong, Wang, Marks, Chen and Gan2023), the opposite trend has been reported for fine powders (e.g. particle diameter below 100 μm) (Castellanos et al. Reference Castellanos, Valverde, Pérez, Ramos and Watson1999; Neveu, Francqui & Lumay Reference Neveu, Francqui and Lumay2022), likely due to fluidisation and reduced wall friction in such systems (Pol et al. Reference Pol, Artoni and Richard2025).
Given the inherently complex dynamics of granular flows arising from the coupled effects of multiple controlling factors, it is essential to identify the governing dimensionless parameters and establish their scaling relationships. Such an approach not only enables a unified understanding of granular flow behaviour but also facilitates the scale-up from laboratory experiments to industrial and geophysical flows (Kim & Kamrin Reference Kim and Kamrin2020; Man et al. Reference Man, Huppert and Galindo-Torres2025). While previous studies have extensively investigated this challenge, most have focused primarily on dry granular systems (Orpe & Khakhar Reference Orpe and Khakhar2001; Yang et al. Reference Yang, Yu, McElroy and Bao2008). These works have revealed that the Froude number, Fr, a dimensionless parameter representing the competition between inertial and gravitational effects, alone is insufficient to fully capture the flow dynamics, and additional system factors, such as size effects, need to be incorporated (Vu et al. Reference Vu, Amarsid, Delenne, Richefeu and Radjai2024). To address this limitation, Pignatel et al. (Reference Pignatel, Asselin, Krieger, Christov, Ottino and Lueptow2012), extending the framework of GDR MiDi (Reference MiDi2004), proposed a representative dimensionless flow rate that has been widely adopted to characterise the flow characteristics of cohesionless particles. Similarly, Orozco et al. (Reference Orozco, Delenne, Sornay and Radjai2020) and Vu et al. (Reference Vu, Amarsid, Delenne, Richefeu and Radjai2024) further incorporated the filling degree J into a single scaling parameter to better capture the flow variables in the cascading regime. For cohesive granular flows, several works have examined the effects of rotation speed and cohesion on the dynamic angle of repose using dimensionless numbers such as the Weber number (Jarray et al. Reference Jarray, Magnanimo and Luding2019), which represents the competition between inertial and capillary forces, or the Bond number in combination with Fr (Dong et al. Reference Dong, Wang, Marks, Chen and Gan2023), which characterises the balance between cohesive and gravitational forces. In addition, recent numerical investigations using the discrete element method have proposed stiffness-dependent dimensionless formulations based on adhesive collision mechanics to describe flow regime transitions (Artoni et al. Reference Artoni, Jabaud, Pol, Richard, Le Menn and Tobie2025), as well as Weber-number-based coarse-graining strategies aimed at upscaling wet granular systems while preserving macroscopic rheology (Larijani, Magnanimo & Luding Reference Larijani, Magnanimo and Luding2025). Despite these efforts, few studies to date have systematically investigated the flow dynamics and scaling behaviour arising from the interplay of multiple controlling factors including cohesion, particle size and inertia, which is a practically relevant yet strongly coupled condition in granular systems that cannot be easily studied in isolation.
In this study, we aim to fill this gap through systematic drum experiments on the steady surface flow of dry and cohesive granular materials, covering a wide range of rotation speeds, drum-to-particle size ratios and cohesion strengths. A dimensionless parameter derived from dimensional analysis is proposed to capture their combined effects, and the scaling of key flow quantities with this parameter is examined to establish unified relationships across both dry and cohesive cases. The experimental methodology and dimensional formulation are described in § 2, followed by the analysis of granular flow dynamics and scaling behaviour under different conditions in § 3. Finally, § 4 concludes the paper with a summary of key findings, limitations and future perspectives.
2. Materials and methods
2.1. Rotating drum apparatus
A custom-built rotating drum apparatus, as illustrated in figure 2, was employed to investigate the steady surface flow dynamics of dry and cohesive granular assemblies under a broad range of flow conditions. The cylindrical sidewalls and end plates of the rotating drum are all fabricated from transparent poly-methyl methacrylate (PMMA), while a blackboard is positioned behind the drum to provide a uniform contrasting background, enabling optical access for flow visualisation and image processing. The inner PMMA walls are coated with transparent fluorinated ethylene propylene films to prevent particle adhesion. Additionally, a sealing strip is installed between the front-end plate and sidewalls to ensure drum watertightness. The drum, with a fixed inner diameter of D $\, = \,$
150 mm and a width of W
$\, = \,$
150 mm and a width of W $\, = \,$
50 mm, is placed vertically on a pair of parallel cylindrical rollers driven by a system-controlled stepping motor. Note that the drum width is at least 10 times the diameters d of all the particles used in this study, which exceeds the minimum requirement of 3.2d proposed by Jain, Ottino & Lueptow (Reference Jain, Ottino and Lueptow2005), thereby ensuring that the influence of front and back wall friction on the flow dynamics can be neglected (Orpe & Khakhar Reference Orpe and Khakhar2001).
$\, = \,$
50 mm, is placed vertically on a pair of parallel cylindrical rollers driven by a system-controlled stepping motor. Note that the drum width is at least 10 times the diameters d of all the particles used in this study, which exceeds the minimum requirement of 3.2d proposed by Jain, Ottino & Lueptow (Reference Jain, Ottino and Lueptow2005), thereby ensuring that the influence of front and back wall friction on the flow dynamics can be neglected (Orpe & Khakhar Reference Orpe and Khakhar2001).
Experimental set-up of the rotating drum apparatus. This configuration consists of a control system that regulates a stepping motor to drive the parallel rollers, ensuring precise and stable drum rotation at a constant speed ω. A high-speed CMOS camera records the particle motion, and the captured images are transferred to a computer for subsequent image processing. In this configuration, shear within the flowing layer arises from gravity-driven surface avalanching as drum rotation continuously transports the granular material upward; no significant basal slip is observed during the present experiments. The full time-dependent evolution is provided in supplementary movie 1 is available at https://doi.org/10.1017/jfm.2026.11716.

Figure 2. Long description
The image shows a diagram of the experimental setup of the rotating drum apparatus. The setup includes a rotating drum with a PMMA container, cover screws, and rollers. A control system regulates a stepping motor to drive the parallel rollers, ensuring precise and stable drum rotation at a constant speed. A high-speed CMOS camera records the particle motion, and the captured images are transferred to a computer for subsequent image processing. A light source illuminates the setup. The diagram illustrates the components and their arrangement in the experimental configuration.
The drum, partially filled with monodisperse acrylic spheres, was rotated counterclockwise at a constant rotation speed $\omega$
. The drum rotation was precisely regulated by the control system to ensure stable operation across all cases. The spherical beads used in this study have a density of 1.20 g cm–3, and five particle diameters of 2.0, 2.5, 3.0, 4.0 and 5.0 mm with a manufacturing tolerance of ±2 % were employed to examine size effects on granular surface flow, which covers a variation of the drum-to-particle diameter ratios D/d with the range 30 ≤ D/d ≤75. Monodisperse spheres were used to avoid the introduction of unnecessary parameters associated with gradation, and previous studies have shown that such packings do not induce noticeable crystallisation under low shear stresses (Chen et al. Reference Chen, Suo, Dong, Zhong, Wei and Gan2024). For each experiment, the total mass of acrylic spheres in the drum was kept constant at m
$\omega$
. The drum rotation was precisely regulated by the control system to ensure stable operation across all cases. The spherical beads used in this study have a density of 1.20 g cm–3, and five particle diameters of 2.0, 2.5, 3.0, 4.0 and 5.0 mm with a manufacturing tolerance of ±2 % were employed to examine size effects on granular surface flow, which covers a variation of the drum-to-particle diameter ratios D/d with the range 30 ≤ D/d ≤75. Monodisperse spheres were used to avoid the introduction of unnecessary parameters associated with gradation, and previous studies have shown that such packings do not induce noticeable crystallisation under low shear stresses (Chen et al. Reference Chen, Suo, Dong, Zhong, Wei and Gan2024). For each experiment, the total mass of acrylic spheres in the drum was kept constant at m $\, = \,$
244.92 g, corresponding to a consistent initial configuration with a filling level of J ≈ 0.42 and a solid volume fraction of
$\, = \,$
244.92 g, corresponding to a consistent initial configuration with a filling level of J ≈ 0.42 and a solid volume fraction of $\phi$
≈ 0.58. Here, the filling level is calculated as the ratio J = h
0/D, with h
0 denoting the vertical thickness of the granular assemblies, measured from the lowest particle to the midpoint of the free surface at rest (Orozco et al. Reference Orozco, Delenne, Sornay and Radjai2020; Vu et al. Reference Vu, Amarsid, Delenne, Richefeu and Radjai2024). The rotating drum was run for 10 revolutions and more to ensure that the granular assembly reaches a steady flow state. All quantities analysed in this paper, including the particle velocity, flowing thickness and dynamic angle of repose, were averaged over the steady state.
$\phi$
≈ 0.58. Here, the filling level is calculated as the ratio J = h
0/D, with h
0 denoting the vertical thickness of the granular assemblies, measured from the lowest particle to the midpoint of the free surface at rest (Orozco et al. Reference Orozco, Delenne, Sornay and Radjai2020; Vu et al. Reference Vu, Amarsid, Delenne, Richefeu and Radjai2024). The rotating drum was run for 10 revolutions and more to ensure that the granular assembly reaches a steady flow state. All quantities analysed in this paper, including the particle velocity, flowing thickness and dynamic angle of repose, were averaged over the steady state.
In this study, we focus on dense granular flows within a certain range of rotation speed $\omega$
that produces continuous motion with either a flat or S-shaped free surface, namely the rolling and cascading regimes, respectively, as defined by Mellmann (Reference Mellmann2001). In both regimes, particles continuously leave the flowing layer at the lower, downslope end and are gradually transported back to the upper end, without flow intermittency (Pol et al. Reference Pol, Artoni and Richard2025). Accordingly, rotation speeds
$\omega$
that produces continuous motion with either a flat or S-shaped free surface, namely the rolling and cascading regimes, respectively, as defined by Mellmann (Reference Mellmann2001). In both regimes, particles continuously leave the flowing layer at the lower, downslope end and are gradually transported back to the upper end, without flow intermittency (Pol et al. Reference Pol, Artoni and Richard2025). Accordingly, rotation speeds $\omega$
between 4 and 40 rpm were employed here, corresponding to Froude number Fr in the range 1.34 × 10⁻³ ≤ Fr ≤ 1.34 × 10⁻¹. The Froude number Fr is defined as
$\omega$
between 4 and 40 rpm were employed here, corresponding to Froude number Fr in the range 1.34 × 10⁻³ ≤ Fr ≤ 1.34 × 10⁻¹. The Froude number Fr is defined as
 \begin{equation} \textit{Fr}=\frac{\omega ^{2}D}{2g} ,\end{equation}
where g denotes the gravitational acceleration. It quantifies the relative importance of inertial and gravitational forces and is commonly used to characterise granular flow regimes, with an increase in Fr leading to a gradual transition from rolling to cascading flow (Yang et al. Reference Yang, Yu, McElroy and Bao2008). Note that in rotating drum systems, Fr serves as a global control parameter related to the rotation speed, rather than a criterion for subcritical/supercritical flow classification as in classical hydraulics. Within this context, the rolling-to-cascading transition typically occurs at ${\textit{Fr}}\ll 1$
.
${\textit{Fr}}\ll 1$
.
During the experiments, a high-speed CMOS camera, typically operated at 1000 fps with a resolution of 1920 × 1080 pixels, was adopted and connected to a computer to capture the granular movements under different flow conditions. To compensate for increasingly rapid particle motions at higher drum rotation speeds, the frame rate was increased up to 1600 fps, thereby maintaining sufficient temporal resolution for reliable optical analysis. In addition, an EF-220 light source (200 W, 2700 K) directed at the drum was employed to ensure sufficient illumination for the camera. The recorded images were subsequently processed for quantitative flow analysis, as described in § 2.3.
2.2. Interstitial fluid and capillary force
For cohesive cases, the present study, consistent with previous works (Khamseh, Roux & Chevoir Reference Khamseh, Roux and Chevoir2015; Jarray et al. Reference Jarray, Magnanimo and Luding2019), focuses on the pendular state of low liquid contents, in which isolated liquid bridges arise at particle contacts due to the surface tension of the interstitial fluid. In this state, the attractive capillary force, nearly independent of the liquid volume at small separation distances or contact, is regarded as the primary factor distinguishing the flow dynamics of cohesive granular assemblies from that of dry particles (Halsey & Levine Reference Halsey and Levine1998). For two contacting particles with identical diameter d, the capillary force F c can be expressed in the form as (Jarray et al. Reference Jarray, Magnanimo and Luding2019; Dong et al. Reference Dong, Wang, Marks, Chen and Gan2023)
 \begin{equation} F_{c}=\mathit{\pi }d\gamma \cos \theta ,\end{equation}
where γ is the surface tension, and θ the liquid–solid contact angle. Under typical experimental conditions, the expression can be simplified by $F_{c}=\pi d\gamma$
(Nase et al. Reference Nase, Vargas, Abatan and McCarthy2001; Pol et al. Reference Pol, Artoni and Richard2025).
$F_{c}=\pi d\gamma$
(Nase et al. Reference Nase, Vargas, Abatan and McCarthy2001; Pol et al. Reference Pol, Artoni and Richard2025).
For experiments under cohesive conditions, prior to being carefully poured into the drum, particles are uniformly mixed with 5.10 g of liquid, corresponding to a fluid content of 2 % by mass, to ensure that the granular assemblies remain in the pendular state (Li, Wang & Niu Reference Li, Wang and Niu2022). Note that the fluid content is fixed at ${w}$
${w}$ $\, = \,$
2 % in this study because higher values tend to promote particle adhesion to the drum walls, which hinders particle image velocimetry measurements, whereas very low contents (e.g. 0.5 % or 1 %) make it difficult to achieve a homogeneous liquid distribution within the granular assembly, introducing experimental uncertainties. Mixtures of ethanol–water, with ethanol mass fractions C
e
varying from 0 % to 15 %, are selected as the interstitial fluid in our experiments. This strategy enables precise adjustment of the surface tension γ (Jarray et al. Reference Jarray, Magnanimo and Luding2019), a primary contributor to the capillary force F
c
according to (2.2). To quantify the relative importance of this capillary-induced cohesion versus gravity, the granular Bond number Bo is employed, defined as the ratio of the maximum capillary force F
c
and the weight of the particle W (Nase et al. Reference Nase, Vargas, Abatan and McCarthy2001; Schaarsberg et al. Reference Schaarsberg, Peters, Stern, Dodge, Zhang and Jaeger2016; Pol et al. Reference Pol, Artoni and Richard2025), given by
$\, = \,$
2 % in this study because higher values tend to promote particle adhesion to the drum walls, which hinders particle image velocimetry measurements, whereas very low contents (e.g. 0.5 % or 1 %) make it difficult to achieve a homogeneous liquid distribution within the granular assembly, introducing experimental uncertainties. Mixtures of ethanol–water, with ethanol mass fractions C
e
varying from 0 % to 15 %, are selected as the interstitial fluid in our experiments. This strategy enables precise adjustment of the surface tension γ (Jarray et al. Reference Jarray, Magnanimo and Luding2019), a primary contributor to the capillary force F
c
according to (2.2). To quantify the relative importance of this capillary-induced cohesion versus gravity, the granular Bond number Bo is employed, defined as the ratio of the maximum capillary force F
c
and the weight of the particle W (Nase et al. Reference Nase, Vargas, Abatan and McCarthy2001; Schaarsberg et al. Reference Schaarsberg, Peters, Stern, Dodge, Zhang and Jaeger2016; Pol et al. Reference Pol, Artoni and Richard2025), given by
 \begin{equation} \textit{Bo}=\frac{F_{c}}{W}=\frac{\pi d\gamma }{\frac{4}{3}\pi \left(d/2\right)^{3}\rho _{p}g}=\frac{6\gamma }{d^{2}\rho _{p}g} ,\end{equation}
where ρ p denotes the density of the particles.
The experimental campaign under cohesive conditions is designed to achieve different levels of particle cohesion through two parameter sets: one varies the particle size at a fixed ethanol mass fraction in the ethanol–water mixtures (C
e $\, = \,$
0 %); conversely, the other varies the ethanol fraction while maintaining the particle diameter constant (d
$\, = \,$
0 %); conversely, the other varies the ethanol fraction while maintaining the particle diameter constant (d $\, = \,$
2.5 mm). The resulting combinations, together with the corresponding Bond number calculations, are summarised in table 1. Note that the contact angle θ is measured from images of liquid droplets on a PMMA plate surface using the LB-ADSA plugin in open-source imageJ software, which determines θ through fitting the Young–Laplace equation to the droplet profiles. Additionally, the surface tension values adopted are typical for room temperature and lie well within the ranges reported in previous studies (Belda, Herraez & Diez Reference Belda, Herraez and Diez2005; Khattab et al. Reference Khattab, Bandarkar, Fakhree and Jouyban2012; Jarray et al. Reference Jarray, Magnanimo and Luding2019).
$\, = \,$
2.5 mm). The resulting combinations, together with the corresponding Bond number calculations, are summarised in table 1. Note that the contact angle θ is measured from images of liquid droplets on a PMMA plate surface using the LB-ADSA plugin in open-source imageJ software, which determines θ through fitting the Young–Laplace equation to the droplet profiles. Additionally, the surface tension values adopted are typical for room temperature and lie well within the ranges reported in previous studies (Belda, Herraez & Diez Reference Belda, Herraez and Diez2005; Khattab et al. Reference Khattab, Bandarkar, Fakhree and Jouyban2012; Jarray et al. Reference Jarray, Magnanimo and Luding2019).
Summary of experimental parameters for cohesive granular flows.

Table 1. Long description
The table presents experimental parameters for cohesive granular flows, detailing various case labels, particle sizes, ethanol mass fractions, surface tension values, contact angles, and Bond numbers. It consists of eight columns and nine rows, including a header row. The columns are labeled as Case label, d (millimeters), Ce (%) (ethanol mass fraction), γ (millinewtons per meter) (surface tension), θ (degrees) (contact angle), and Bo (Bond number). The table includes two sets of parameters: one varying particle size at a fixed ethanol mass fraction and another varying ethanol fraction while keeping the particle diameter constant. Notable trends include varying Bond numbers and contact angles across different cases, reflecting changes in particle cohesion levels.
As shown in table 1, in experimental cases, denoted by the symbol CD, an increase in ethanol mass fraction C
e
leads to a systematic reduction in surface tension γ and the Bond number Bo, along with a decline in the contact angle θ that signals enhanced wettability of the PMMA surface. Meanwhile, for mixtures with pure water (C
e $\, = \,$
0 %), Bo decreases with increasing particle diameter d, spanning conditions from relatively strong to weak cohesion. The influence of Bo and particle wettability on cohesive granular flow will be examined in detail in § 3.3.
$\, = \,$
0 %), Bo decreases with increasing particle diameter d, spanning conditions from relatively strong to weak cohesion. The influence of Bo and particle wettability on cohesive granular flow will be examined in detail in § 3.3.
2.3. Image processing
Continuous image sequences of the dry and cohesive granular flows in the rotating drum are subsequently processed to extract quantitative information, including the dynamic angle of repose $\beta$
0 and particle velocity fields. Specifically, the detection of the granular bed and the measurement of the dynamic angle of repose
$\beta$
0 and particle velocity fields. Specifically, the detection of the granular bed and the measurement of the dynamic angle of repose $\beta$
0 are performed through the MATLAB Image Processing Toolbox, with the detailed procedure illustrated in figure 3. The original grey scale images (figure 3
a) are first converted into binary images (figure 3
b) by applying an intensity threshold, thereby segmenting solid particles (assigned a binary value of 0) from the background (binary value of 1). In this study, a threshold value of 160 is adopted to achieve the best visual representation of the granular assembly in the images. Small noise regions are then removed through area-based morphological filtering, which eliminates connected components smaller than a prescribed area threshold of 25 000 pixels. After that, the upper boundary of the granular bed (figure 3
c) is identified by a contour detection algorithm based on Moore-neighbour tracing (Mari & Raju Reference Mari and Raju2021), from which the free-surface profile is extracted and linearly fitted. Finally, the temporal evolution of
$\beta$
0 are performed through the MATLAB Image Processing Toolbox, with the detailed procedure illustrated in figure 3. The original grey scale images (figure 3
a) are first converted into binary images (figure 3
b) by applying an intensity threshold, thereby segmenting solid particles (assigned a binary value of 0) from the background (binary value of 1). In this study, a threshold value of 160 is adopted to achieve the best visual representation of the granular assembly in the images. Small noise regions are then removed through area-based morphological filtering, which eliminates connected components smaller than a prescribed area threshold of 25 000 pixels. After that, the upper boundary of the granular bed (figure 3
c) is identified by a contour detection algorithm based on Moore-neighbour tracing (Mari & Raju Reference Mari and Raju2021), from which the free-surface profile is extracted and linearly fitted. Finally, the temporal evolution of $\beta$
0 is obtained by iteratively applying this procedure to each frame of the image sequence, with
$\beta$
0 is obtained by iteratively applying this procedure to each frame of the image sequence, with $\beta$
0 calculated from the best-fit line to the free surface (figure 3
d).
$\beta$
0 calculated from the best-fit line to the free surface (figure 3
d).
Detailed procedure of the image analysis for the measurement of the dynamic angle of repose $\beta$
0: (a) original grey scale image; (b) binary image after thresholding; (c) detected free-surface contour (orange line); (d) linear fitting of the free surface (pink line) for calculating
$\beta$
0: (a) original grey scale image; (b) binary image after thresholding; (c) detected free-surface contour (orange line); (d) linear fitting of the free surface (pink line) for calculating $\beta$
0.
$\beta$
0.

Figure 3. Long description
The first image is a circular grayscale photo of a granular material with a smooth surface. The second image is a binary version of the first, showing black and white pixels. The third image highlights the detected free-surface contour with an orange line. The fourth image shows a linear fit of the free surface with a pink line, used to calculate the angle of repose. The images are arranged side by side in a sequence.
Considering the S-shaped free surface of granular flows in the cascading regime, the linear fitting of the free surface should be restricted to a limited region rather than applied to the entire surface. Accordingly, in this study, the dynamic angle of repose $\beta$
0 is measured from each binarised image over the central part of the flow surface in analogy with previous works (Jarray et al. Reference Jarray, Magnanimo and Luding2019; Preud’homme et al. Reference Preud’homme, Lumay, Vandewalle and Opsomer2021). The fitting region spans a horizontal length R equal to half of the drum diameter D, as shown in figure 3(d).
$\beta$
0 is measured from each binarised image over the central part of the flow surface in analogy with previous works (Jarray et al. Reference Jarray, Magnanimo and Luding2019; Preud’homme et al. Reference Preud’homme, Lumay, Vandewalle and Opsomer2021). The fitting region spans a horizontal length R equal to half of the drum diameter D, as shown in figure 3(d).
The particle image velocimetry (PIV) technique is applied to successive image frames to extract the particle velocity fields. As a non-intrusive, image-based method, PIV is implemented in this study using an open-source software PIVlab (Thielicke & Sonntag Reference Thielicke and Sonntag2021), where velocity fields are computed through a multi-pass cross-correlation algorithm coupled with a fast Fourier transform window deformation (Thielicke & Stamhuis Reference Thielicke and Stamhuis2014). The underlying principle involves dividing the region of interest into interrogation windows and calculating the displacement vector for each window by locating the peak of the cross-correlation function $r(\boldsymbol{s})$
between two consecutive frames, given by
$r(\boldsymbol{s})$
between two consecutive frames, given by
 \begin{equation} r\left(\boldsymbol{s}\right)=\iint I_{1}\left(\boldsymbol{x}\right)\boldsymbol{\cdot }I_{2}\left(\boldsymbol{x}+\boldsymbol{s}\right){\rm d}\boldsymbol{x} ,\end{equation}
where I 1 and I 2 denote the intensity distributions of the first and second interrogation windows, respectively, with x representing the image coordinate, and s the displacement vector (Chou & Hsiau Reference Chou and Hsiau2012).
In this study, a four-pass correlation algorithm with progressively refined interrogation windows is adopted to evaluate the recorded image frames, with a final interrogation size of 32 × 32 pixels selected to match the order of the particle size for reliable and robust velocity measurements. Sub-pixel displacement estimation is performed using a Gaussian 2 × 3-point estimator, and the overlap of the interrogation window is fixed at 50 % to enhance spatial resolution (Sanvitale et al. Reference Sanvitale, Zhao, Bowman and O’Sullivan2023). Prior to PIV analysis, the images are pre-processed using contrast-limited adaptive histogram equalisation to enhance local contrast and highlight particle features (Niu et al. Reference Niu, Zheng, Yuan, Mao and Huang2024). For each experimental run, PIV analysis is performed on more than 500 consecutive images, covering over 0.5 s at 1000 fps. The resulting time-averaged particle velocity field is constructed by averaging the instantaneous velocity fields calculated from successive image pairs. The velocity distributions obtained from PIV serve as the basis for further quantitative analyses of the granular flow dynamics, such as shear rates and inertial numbers, as presented in § 3.
2.4. Dimensional analysis of cohesive granular flows with capillary time scale
A proper determination of the governing dimensionless parameters and associated scaling relations is crucial for achieving scale-up, the process of bridging laboratory experiments with industrial-scale granular systems. Based on a dimensional analysis of dry granular flow in a quasi-two-dimensional rotating drum, Pignatel et al. (Reference Pignatel, Asselin, Krieger, Christov, Ottino and Lueptow2012) proposed a dimensionless flow rate as an alternative to Fr. The flow rate Q can be non-dimensionalised using a characteristic quantity with units of [L]2/[T]. In granular flows, the particle diameter d is always taken as the characteristic length scale. The challenge then lies in identifying a characteristic time scale that effectively captures the relevant dynamics.
Cohesive granular flows in the pendular state can still be studied within the same dimensional framework as dry granular flows, provided that the characteristic time scale is determined to account for cohesion (Roy, Luding & Weinhart Reference Roy, Luding and Weinhart2017). To this end, we consider the vertical balance of driving forces, including both gravity and capillary attraction, acting on an isolated cohesive particle, given by
 \begin{equation} \frac{4}{3}\pi \left(\frac{d}{2}\right)^{3}\rho _{p}\frac{\mathrm{d}v_{p}}{\mathrm{d}t}=\pi {\rm d}\gamma -\frac{4}{3}\pi \left(\frac{d}{2}\right)^{3}\rho _{p}g ,\end{equation}
where v
p
denotes the particle velocity. The solution of (2.5), with the initial condition v
p
(t $\, = \,$
0)
$\, = \,$
0) $\, = \,$
0, is given by
$\, = \,$
0, is given by
 \begin{equation} v_{p}\left(t\right)=\left(\frac{6\gamma }{d^{2}\rho _{p}}-g\right)t=g\left({\textit{Bo}}-1\right)t ,\end{equation}
where Bo denotes the Bond number as defined in (2.3). For dry granular flows where gravity dominates ( $Bo\ll 1$
), the characteristic time t
d
required for a single particle to travel a distance of its own diameter d is
$Bo\ll 1$
), the characteristic time t
d
required for a single particle to travel a distance of its own diameter d is $t_{d}=\sqrt{d/g}$
. This expression represents the time scale associated with local particle rearrangements and is consistent with that used by Pignatel et al. (Reference Pignatel, Asselin, Krieger, Christov, Ottino and Lueptow2012). However, in the pendular state, capillary forces act as a short-range dominant interaction that determines the primary driving acceleration of particles when they are in close contact (Zhao, Kruyt & Millet Reference Zhao, Kruyt and Millet2020; Pouliquen Reference Pouliquen2025). In the limit of
$t_{d}=\sqrt{d/g}$
. This expression represents the time scale associated with local particle rearrangements and is consistent with that used by Pignatel et al. (Reference Pignatel, Asselin, Krieger, Christov, Ottino and Lueptow2012). However, in the pendular state, capillary forces act as a short-range dominant interaction that determines the primary driving acceleration of particles when they are in close contact (Zhao, Kruyt & Millet Reference Zhao, Kruyt and Millet2020; Pouliquen Reference Pouliquen2025). In the limit of $Bo\gg 1$
, we can obtain
$Bo\gg 1$
, we can obtain
 \begin{equation} v_{p}\sim gBot_{c}=\frac{d}{t_{c}} ,\end{equation}
where t c is the capillary time scale, expressed as
 \begin{equation} t_{c}=\sqrt{\frac{d^{3}\rho _{p}}{6\gamma }} .\end{equation}
It characterises particle motion primarily governed by the attractive capillary force (Roy et al. Reference Roy, Luding and Weinhart2017). Note that the capillary force exhibits weak sensitivity to the liquid bridge volume but is strongly governed by the liquid surface tension γ. Since γ is an intrinsic material property shared by all liquid bridges in the system, the resulting capillary time scale t c can be regarded as a global parameter.
The volumetric flow rate per unit width in a quasi-two-dimensional rotating drum can be given by
 \begin{equation} Q=\frac{1}{2}\omega \left[\left(\frac{D}{2}\right)^{2}-{\delta }_{0}^{2}\right]\approx \frac{1}{8}\omega D^{2} ,\end{equation}
where δ
0 denotes the thickness of the flowing layer. The above approximation holds when the flowing layer is much thinner than the half of drum diameter D, a condition typical of the rolling regime (Ottino & Khakhar Reference Ottino and Khakhar2000). Consequently, the dimensionless flow rate for dry granular flows ( $Bo\ll 1$
) is defined as
$Bo\ll 1$
) is defined as
 \begin{equation} Q_{d}=\frac{\frac{1}{8}\omega D^{2}}{d^{2}/t_{d}}=\frac{\frac{1}{8}\omega D^{2}}{d^{2}/\sqrt{d/g}}=\frac{1}{4}{\textit{Fr}}^{1/2}\left(\frac{D}{d}\right)^{3/2} ,\end{equation}
which can be reformulated for cohesive granular flows by replacing t d with t c to obtain
 \begin{equation} Q_{w}=\frac{\frac{1}{8}\omega D^{2}}{d^{2}/t_{c}}=\frac{1}{4}{\textit{Fr}}^{1/2}\left(\frac{D}{d}\right)^{3/2}{\textit{Bo}}^{-1/2} .\end{equation}
Therefore, the dimensionless parameter Q
*, which unifies dry, gravity-driven flows ( $Bo\ll 1$
) and pendular-state cohesive granular flows dominated by capillary forces (
$Bo\ll 1$
) and pendular-state cohesive granular flows dominated by capillary forces ( $Bo\gg 1$
), can be expressed as
$Bo\gg 1$
), can be expressed as
 \begin{align} Q^{*}=\begin{cases} \frac{1}{4}{\textit{Fr}}^{1/2}\left(\frac{D}{d}\right)^{3/2},\qquad\qquad\qquad \textit{Bo}\ll 1,\\[10pt] \frac{1}{4}{\textit{Fr}}^{1/2}\left(\frac{D}{d}\right)^{3/2}{\textit{Bo}}^{-1/2},{\enspace}{\enspace}{\enspace}{\enspace}{\enspace}{\enspace}Bo\gg 1. \end{cases} \end{align}
The expressions in (2.12) originate from a simplified force-balance analysis on an isolated particle. Although idealised, this approach has been successfully applied to diverse granular flow configurations (Courrech du Pont et al. Reference Courrech du Pont, Gondret, Perrin and Rabaud2003; Pignatel et al. Reference Pignatel, Asselin, Krieger, Christov, Ottino and Lueptow2012) and, as shown below, also provides a valuable framework for analysing our experimental observations. In addition, it should be noted that while the expression of Q
* in cohesive cases represents a theoretical limit for $Bo\gg 1$
, the transition from gravity-driven to capillary-dominated flow fundamentally occurs as Bo surpasses 1 (Pouliquen Reference Pouliquen2025). For the Bond numbers investigated in the cohesive cases of this study, the capillary forces are sufficiently dominant to justify this asymptotic scaling approach. Meanwhile, in the cross-over regime between these two asymptotic limits, a wet–dry transition may occur where both gravity and cohesion contribute comparably to the flow; however, this regime is beyond the scope of the present study.
$Bo\gg 1$
, the transition from gravity-driven to capillary-dominated flow fundamentally occurs as Bo surpasses 1 (Pouliquen Reference Pouliquen2025). For the Bond numbers investigated in the cohesive cases of this study, the capillary forces are sufficiently dominant to justify this asymptotic scaling approach. Meanwhile, in the cross-over regime between these two asymptotic limits, a wet–dry transition may occur where both gravity and cohesion contribute comparably to the flow; however, this regime is beyond the scope of the present study.
3. Results and discussion
3.1. Characterisation of particle velocities in dry flows
3.1.1. Flow regimes and spatial velocity distributions
For the dry cases, two representative snapshots of the averaged particle velocity vectors in drums with different Froude numbers Fr but identical size ratio D/d $\, = \,$
60 are displayed in figure 4. These vector fields provide a global kinematic overview of the granular flow, capturing the overall transport of granular materials within the rotating drum. It can be observed that an increase in Fr from 1.34 × 10⁻³ to 7.55 × 10⁻² induces a clear transition of the flow regime from rolling to cascading, characterised by the evolution of the free surface from a nearly linear profile into an S-shaped curvature. Meanwhile, the particle velocity magnitude in the rotating drum, indicated by the arrow lengths, increases significantly with Fr, especially in the vicinity of the free surface and along the drum wall. In both cases, the largest velocities occur at the centre of the free surface where particles flow downward in a counterclockwise direction, and the velocity gradually decays inward to 0 at the vortex core. Near the drum wall, the flow exhibits a rigid-body motion synchronised with the drum rotation, continuously lifting and transporting particles to the upper region of the drum.
$\, = \,$
60 are displayed in figure 4. These vector fields provide a global kinematic overview of the granular flow, capturing the overall transport of granular materials within the rotating drum. It can be observed that an increase in Fr from 1.34 × 10⁻³ to 7.55 × 10⁻² induces a clear transition of the flow regime from rolling to cascading, characterised by the evolution of the free surface from a nearly linear profile into an S-shaped curvature. Meanwhile, the particle velocity magnitude in the rotating drum, indicated by the arrow lengths, increases significantly with Fr, especially in the vicinity of the free surface and along the drum wall. In both cases, the largest velocities occur at the centre of the free surface where particles flow downward in a counterclockwise direction, and the velocity gradually decays inward to 0 at the vortex core. Near the drum wall, the flow exhibits a rigid-body motion synchronised with the drum rotation, continuously lifting and transporting particles to the upper region of the drum.
Velocity vector fields for dry granular flows in a rotating drum at different rotation speeds: (a) $\omega$
= 4 rpm (Fr
$\omega$
= 4 rpm (Fr $\, = \,$
1.34 × 10⁻³); (b)
$\, = \,$
1.34 × 10⁻³); (b) $\omega$
= 30 rpm (Fr
$\omega$
= 30 rpm (Fr $\, = \,$
7.55 × 10⁻²). In both cases, the particle diameter is fixed to 2.5 mm (D/d
$\, = \,$
7.55 × 10⁻²). In both cases, the particle diameter is fixed to 2.5 mm (D/d $\, = \,$
60). Arrow length is scaled with the particle velocity magnitude.
$\, = \,$
60). Arrow length is scaled with the particle velocity magnitude.

Figure 4. Long description
The image contains two graphs labeled (a) and (b), each showing velocity vector fields for dry granular flows in a rotating drum at different rotation speeds. Graph (a) represents a rotation speed of 4 revolutions per minute (rpm) with a Froude number of 1.34 times 10 to the power of 3, while graph (b) represents a rotation speed of 30 rpm with a Froude number of 7.55 times 10 to the power of 2. In both graphs, the particle diameter is fixed at 2.5 millimeters. The arrow length in each graph is scaled with the particle velocity magnitude. The graphs illustrate the flow dynamics of granular materials under different rotational conditions, highlighting the complex and heterogeneous nature of such flows.
In both rolling and cascading regimes, the velocity in the central region near the free surface, spanning a horizontal length of R as shown in figure 3(d), is nearly parallel to the surface. Therefore, to ensure the velocity components have a physically intuitive representation of the actual flow process, we introduce a Cartesian coordinate system (x, z) with its origin at the centre of the free surface. Here, the x axis is oriented parallel to the local downward flow, while the z axis is defined normal to the surface flow and directed into the granular bed. The transformation between the (x, z) and the global (X, Z) coordinate system is given by
 \begin{equation} \left(\!\!\begin{array}{l} x\\ z \end{array}\!\!\right)=\left(\!\!\begin{array}{l} -\cos \beta _{0}-\sin \beta _{0}\\ \sin \beta _{0}-\cos \beta _{0} \end{array}\!\!\right)\left(\!\!\begin{array}{l} X\\ Z \end{array}\!\!\right)\! ,\end{equation}
where $\beta$
0 is the dynamic angle of repose measured in the global coordinate system (X, Z).
$\beta$
0 is the dynamic angle of repose measured in the global coordinate system (X, Z).
Based on this streamwise-oriented coordinate system, we compare the time-averaged fields of the x-component of particle velocity $\langle$
u
$\langle$
u $\rangle$
in rotating drums with various size ratios D/d and Froude numbers Fr, as displayed in figure 5. Positive
$\rangle$
in rotating drums with various size ratios D/d and Froude numbers Fr, as displayed in figure 5. Positive $\langle$
u
$\langle$
u $\rangle$
values correspond to the gravity-driven downward granular flow, while negative values indicate the upward transport of particles driven by drum rotation. Figure 5 shows that for drums with a fixed D/d, an increase in Fr leads to higher
$\rangle$
values correspond to the gravity-driven downward granular flow, while negative values indicate the upward transport of particles driven by drum rotation. Figure 5 shows that for drums with a fixed D/d, an increase in Fr leads to higher $\langle$
u
$\langle$
u $\rangle$
values near the free surface and an expansion of the downward flow region, which is accompanied by a gradual transition from rolling to cascading regime, consistent with the observations in figure 4. Specifically, the transition to the cascading regime is observed at Fr ≈ 10–3–10–2 in our study, which is in good agreement with the critical values reported in previous literature (Mellmann Reference Mellmann2001; Preud’homme et al. Reference Preud’homme, Lumay, Vandewalle and Opsomer2021). However, at a constant Fr, the high-velocity area within the downward flow systematically contracts as the size ratio D/d decreases, exemplified at Fr = 7.55 × 10⁻² by the noticeable reduction in the area where
$\rangle$
values near the free surface and an expansion of the downward flow region, which is accompanied by a gradual transition from rolling to cascading regime, consistent with the observations in figure 4. Specifically, the transition to the cascading regime is observed at Fr ≈ 10–3–10–2 in our study, which is in good agreement with the critical values reported in previous literature (Mellmann Reference Mellmann2001; Preud’homme et al. Reference Preud’homme, Lumay, Vandewalle and Opsomer2021). However, at a constant Fr, the high-velocity area within the downward flow systematically contracts as the size ratio D/d decreases, exemplified at Fr = 7.55 × 10⁻² by the noticeable reduction in the area where $\langle$
u
$\langle$
u $\rangle$
is larger than 0.4 m s–1. In addition, as illustrated in figure 5(e), the evolution of free-surface profiles with Fr reveals a delayed transition from the rolling to the cascading regime compared with cases with larger D/d. This indicates that larger particles, corresponding to a smaller D/d, require higher rotation speeds to trigger this transition, since their greater individual inertia combined with reduced particle contacts hinders the collective onset of cascading (Dong et al. Reference Dong, Wang, Marks, Chen and Gan2023). The dependence on D/d, despite a constant Fr, demonstrates that Fr is not the sole parameter controlling the granular flow dynamics in rotating drums, as will be discussed in more detail below.
$\rangle$
is larger than 0.4 m s–1. In addition, as illustrated in figure 5(e), the evolution of free-surface profiles with Fr reveals a delayed transition from the rolling to the cascading regime compared with cases with larger D/d. This indicates that larger particles, corresponding to a smaller D/d, require higher rotation speeds to trigger this transition, since their greater individual inertia combined with reduced particle contacts hinders the collective onset of cascading (Dong et al. Reference Dong, Wang, Marks, Chen and Gan2023). The dependence on D/d, despite a constant Fr, demonstrates that Fr is not the sole parameter controlling the granular flow dynamics in rotating drums, as will be discussed in more detail below.
Time-averaged fields of the x-component of particle velocity $\langle$
u
$\langle$
u $\rangle$
in rotating drums with different size ratios D/d and Froude numbers Fr: panels show (a) D/d
$\rangle$
in rotating drums with different size ratios D/d and Froude numbers Fr: panels show (a) D/d $\, = \,$
75; (b) D/d
$\, = \,$
75; (b) D/d $\, = \,$
60; (c) D/d
$\, = \,$
60; (c) D/d $\, = \,$
50; (d) D/d
$\, = \,$
50; (d) D/d $\, = \,$
37.5; (e) D/d
$\, = \,$
37.5; (e) D/d $\, = \,$
30. For a fixed D/d, the Fr increases from 1.34 × 10⁻³ to 1.34 × 10⁻¹ from left to right. The cases enclosed by dashed lines correspond to conditions that have visually transitioned into the cascading regime, and the colour of granular bed represents the
$\, = \,$
30. For a fixed D/d, the Fr increases from 1.34 × 10⁻³ to 1.34 × 10⁻¹ from left to right. The cases enclosed by dashed lines correspond to conditions that have visually transitioned into the cascading regime, and the colour of granular bed represents the $\langle$
u
$\langle$
u $\rangle$
values.
$\rangle$
values.

Figure 5. Long description
The image contains five rows and five columns of circular graphs, each representing different size ratios (D/d) and Froude numbers (Fr). The rows correspond to different size ratios: (a) D/d 75, (b) D/d 60, (c) D/d 50, (d) D/d 37.5, and (e) D/d 30. The columns represent increasing Froude numbers from left to right, ranging from 1.34 _ 10^−3 to 1.34 _ 10^−1. The color gradient from blue to red indicates the x-component of particle velocity, with blue representing lower velocities and red representing higher velocities. The cases enclosed by dashed lines indicate conditions that have visually transitioned into the cascading regime. The graphs show how the velocity distribution changes with different size ratios and Froude numbers, highlighting the dynamic behavior of granular materials in rotating drums.
To gain further quantitative insight into the flow dynamics, we extracted the profile of the time-averaged velocity $\langle$
u
$\langle$
u $\rangle$
in the x-direction as a function of depth z, measured from the free surface, in a rotating drum with fixed Fr
$\rangle$
in the x-direction as a function of depth z, measured from the free surface, in a rotating drum with fixed Fr $\, = \,$
3.35 × 10⁻² and D/d
$\, = \,$
3.35 × 10⁻² and D/d $\, = \,$
60, as shown in figure 6(a). The open symbols and solid line represent the results of our PIV measurements and corresponding theoretical velocity u =
$\, = \,$
60, as shown in figure 6(a). The open symbols and solid line represent the results of our PIV measurements and corresponding theoretical velocity u = $-\omega z'$
for the rigid rotation following the rotating drum, respectively. Here,
$-\omega z'$
for the rigid rotation following the rotating drum, respectively. Here, $z'$
denotes the depth measured from the drum centre. Both the measured
$z'$
denotes the depth measured from the drum centre. Both the measured $\langle$
u
$\langle$
u $\rangle$
and theoretical u velocities decrease with depth z. A pronounced deviation from rigid rotation is observed near the free surface, whereas
$\rangle$
and theoretical u velocities decrease with depth z. A pronounced deviation from rigid rotation is observed near the free surface, whereas $\langle$
u
$\langle$
u $\rangle$
converges toward the theoretical profile of u beyond a depth of z > 0.03 m, which to an extent provides a validation of our PIV measurements. In addition, a new quantity,
$\rangle$
converges toward the theoretical profile of u beyond a depth of z > 0.03 m, which to an extent provides a validation of our PIV measurements. In addition, a new quantity, $\langle$
u
x
$\langle$
u
x $\rangle$
=
$\rangle$
= $\langle$
u
$\langle$
u $\rangle$
– u, is introduced to describe the particle velocity relative to the rigid rotation of the drum, with the rotation speed subtracted from
$\rangle$
– u, is introduced to describe the particle velocity relative to the rigid rotation of the drum, with the rotation speed subtracted from $\langle$
u
$\langle$
u $\rangle$
values obtained from PIV. This approach effectively facilitates a clearer characterisation of the intrinsic dynamics of particle motion, consistent with prior studies (Hill, Gioia & Tota Reference Hill, Gioia and Tota2003; Li & Andrade Reference Li and Andrade2020).
$\rangle$
values obtained from PIV. This approach effectively facilitates a clearer characterisation of the intrinsic dynamics of particle motion, consistent with prior studies (Hill, Gioia & Tota Reference Hill, Gioia and Tota2003; Li & Andrade Reference Li and Andrade2020).
Profiles of (a) the time-averaged velocity $\langle$
u
$\langle$
u $\rangle$
and (b) the particle velocity
$\rangle$
and (b) the particle velocity $\langle$
u
x
$\langle$
u
x $\rangle$
as functions of depth z in a rotating drum with a fixed Fr
$\rangle$
as functions of depth z in a rotating drum with a fixed Fr $\, = \,$
3.35 × 10⁻² and D/d
$\, = \,$
3.35 × 10⁻² and D/d $\, = \,$
60. The depth is measured from the free surface, as shown in the inset of (a). The solid line represents the corresponding theoretical velocity u for rigid rotation of the drum, given by u =
$\, = \,$
60. The depth is measured from the free surface, as shown in the inset of (a). The solid line represents the corresponding theoretical velocity u for rigid rotation of the drum, given by u = $-\omega z'$
, where
$-\omega z'$
, where $z'$
denotes the depth measured from the drum centre. The quantity
$z'$
denotes the depth measured from the drum centre. The quantity $\langle$
u
x
$\langle$
u
x $\rangle$
=
$\rangle$
= $\langle$
u
$\langle$
u $\rangle$
– u represents the particle velocity relative to the rigid rotation of the drum.
$\rangle$
– u represents the particle velocity relative to the rigid rotation of the drum.

Figure 6. Long description
The image contains two graphs labeled (a) and (b). Graph (a) shows the time-averaged velocity <u> as a function of depth z in a rotating drum. The depth is measured from the free surface, as indicated in the inset. The orange circles represent PIV measurements, while the solid orange line represents the theoretical velocity profile for rigid rotation of the drum. The theoretical velocity is given by the equation u = −ωz’, where z’ denotes the depth measured from the drum center. Graph (b) illustrates the particle velocity <ux> as a function of depth z. The orange circles represent the residual velocity profile. The graph is divided into three regions: the surface flow region, the dense flow region, and the quasistatic region. The flowing layer thickness δ0 is marked, and an inset shows the slip velocity vs near the surface. The graphs highlight the complex dynamics of granular flow in a rotating drum.
Figure 6(b) presents the profile of the time-averaged particle velocity $\langle$
u
x
$\langle$
u
x $\rangle$
along the depth in the z direction, which gradually decreases and eventually plateaus near zero. Based on the evolution of this profile, four distinct regions can be distinguished along the depth: the surface flow, the dense flow, the quasistatic and the static flow regions. Starting from the top of the surface flow region, the particle velocity
$\rangle$
along the depth in the z direction, which gradually decreases and eventually plateaus near zero. Based on the evolution of this profile, four distinct regions can be distinguished along the depth: the surface flow, the dense flow, the quasistatic and the static flow regions. Starting from the top of the surface flow region, the particle velocity $\langle$
u
x
$\langle$
u
x $\rangle$
reaches its maximum, and particle interactions are dominated by collisions, especially in cascading flows. Moving into the dense flow region,
$\rangle$
reaches its maximum, and particle interactions are dominated by collisions, especially in cascading flows. Moving into the dense flow region, $\langle$
u
x
$\langle$
u
x $\rangle$
exhibits a nearly linear decay with depth. This linear scaling implies a nearly constant shear rate, characteristic of friction-dominated regimes. It reflects a balance between gravitational driving stress and internal frictional resistance within a densely packed flowing layer, consistent with the established observations in rotating drum studies (Rajchenbach Reference Rajchenbach1990; Bonamy et al. Reference Bonamy, Daviaud and Laurent2002; GDR MiDi Reference MiDi2004; Li & Andrade Reference Li and Andrade2020). Approaching the bottom of the flowing layer, the decay of
$\rangle$
exhibits a nearly linear decay with depth. This linear scaling implies a nearly constant shear rate, characteristic of friction-dominated regimes. It reflects a balance between gravitational driving stress and internal frictional resistance within a densely packed flowing layer, consistent with the established observations in rotating drum studies (Rajchenbach Reference Rajchenbach1990; Bonamy et al. Reference Bonamy, Daviaud and Laurent2002; GDR MiDi Reference MiDi2004; Li & Andrade Reference Li and Andrade2020). Approaching the bottom of the flowing layer, the decay of $\langle$
u
x
$\langle$
u
x $\rangle$
transitions from linear to exponential-like, marking the onset of the quasistatic region, where particle motion becomes extremely slow and interactions are predominantly governed by enduring frictional contacts (Govender Reference Govender2016). Beneath the quasistatic region lies the static flow region, where the flow is essentially static relative to the rotating drum, although a minor slip at the drum wall persists, as shown in the inset of figure 6(b).
$\rangle$
transitions from linear to exponential-like, marking the onset of the quasistatic region, where particle motion becomes extremely slow and interactions are predominantly governed by enduring frictional contacts (Govender Reference Govender2016). Beneath the quasistatic region lies the static flow region, where the flow is essentially static relative to the rotating drum, although a minor slip at the drum wall persists, as shown in the inset of figure 6(b).
Next, the dependence of the time-averaged particle velocity $\langle$
u
x
$\langle$
u
x $\rangle$
profiles along the depth z on the Froude number Fr and the size ratio D/d is investigated, where
$\rangle$
profiles along the depth z on the Froude number Fr and the size ratio D/d is investigated, where $\langle$
u
x
$\langle$
u
x $\rangle$
is normalised by
$\rangle$
is normalised by $\sqrt{gd}$
and z by the particle diameter d, as displayed in figure 7. For a drum with a fixed D/d
$\sqrt{gd}$
and z by the particle diameter d, as displayed in figure 7. For a drum with a fixed D/d $\, = \,$
60 across a wide range of Fr spanning the rolling and cascading regimes, an increase in Fr significantly enhances both the magnitude and slope of
$\, = \,$
60 across a wide range of Fr spanning the rolling and cascading regimes, an increase in Fr significantly enhances both the magnitude and slope of $\langle$
u
x
$\langle$
u
x $\rangle$
(z) within the dense flow region (figure 7
a), indicating intensified particle collisions and stronger fluidisation in the vicinity of the free surface. In addition, the slip velocity at the drum wall also increases with Fr, primarily due to the enhanced centrifugal and lift forces that promote particle detachment from the wall and thereby increase the overall mobility of the flowing layer. In figure 7(b), the velocity profiles for various values of D/d at a fixed Fr
$\rangle$
(z) within the dense flow region (figure 7
a), indicating intensified particle collisions and stronger fluidisation in the vicinity of the free surface. In addition, the slip velocity at the drum wall also increases with Fr, primarily due to the enhanced centrifugal and lift forces that promote particle detachment from the wall and thereby increase the overall mobility of the flowing layer. In figure 7(b), the velocity profiles for various values of D/d at a fixed Fr $\, = \,$
3.35 × 10⁻² are shown. As D/d increases, both the surface velocity and the velocity gradient within the flowing layer become more pronounced, accompanied by a reduction in slip velocity. This size effect indicates that larger D/d corresponds to a higher particle feed rate at the upstream end of the free surface, resulting in a thicker flowing layer as well as a more curved free-surface profile (Orozco et al. Reference Orozco, Delenne, Sornay and Radjai2020), as evidenced in figure 5.
$\, = \,$
3.35 × 10⁻² are shown. As D/d increases, both the surface velocity and the velocity gradient within the flowing layer become more pronounced, accompanied by a reduction in slip velocity. This size effect indicates that larger D/d corresponds to a higher particle feed rate at the upstream end of the free surface, resulting in a thicker flowing layer as well as a more curved free-surface profile (Orozco et al. Reference Orozco, Delenne, Sornay and Radjai2020), as evidenced in figure 5.
Profiles of the time-averaged particle velocity $\langle$
u
x
$\langle$
u
x $\rangle$
normalised by
$\rangle$
normalised by $\sqrt{gd}$
, plotted as a function of the normalised depth z/d. (a) Effect of Fr at D/d
$\sqrt{gd}$
, plotted as a function of the normalised depth z/d. (a) Effect of Fr at D/d $\, = \,$
60; (b) effect of D/d at Fr
$\, = \,$
60; (b) effect of D/d at Fr $\, = \,$
3.35 × 10⁻².
$\, = \,$
3.35 × 10⁻².

Figure 7. Long description
Two line graphs depict the profiles of time-averaged particle velocity normalized by depth. The first graph (a) shows the effect of the Froude number (Fr) at a fixed diameter-to-depth ratio (D/d) of 60. Different symbols represent various Fr values, ranging from 1.34 times 10 to the power of negative 1 to 1.34 times 10 to the power of negative 3. The second graph (b) illustrates the effect of varying D/d ratios at a fixed Fr of 3.35 times 10 to the power of negative 2. Different symbols represent D/d ratios from 30 to 75. Both graphs plot normalized particle velocity on the y-axis against normalized depth on the x-axis, showing how these parameters influence the velocity profiles.
3.1.2. Flowing layer thickness
In a rotating drum, the dominant physical mechanisms are primarily confined to the flowing layer, a region characterised by its thickness δ
0, which provides a basis for estimating the order of magnitude of other critical kinematic quantities, such as the mean velocity and shear rate (Pignatel et al. Reference Pignatel, Asselin, Krieger, Christov, Ottino and Lueptow2012). Following the approach of Jarray et al. (Reference Jarray, Magnanimo and Luding2019), δ
0 is defined as the depth from the free surface to the boundary of the quasistatic region, as shown in figure 6(b). Here, this boundary is determined from the $\langle$
u
x
(z)
$\langle$
u
x
(z) $\rangle$
profile where
$\rangle$
profile where $\langle$
u
x
$\langle$
u
x $\rangle$
falls below 1 % of its maximum value at the free surface. Note that although various methods for estimating the flowing layer thickness have been reported in previous studies (Pignatel et al. Reference Pignatel, Asselin, Krieger, Christov, Ottino and Lueptow2012; Orozco et al. Reference Orozco, Delenne, Sornay and Radjai2020), the choice of δ
0 definition has been shown to have little effect on the qualitative scaling behaviour, as discussed in Félix et al. (Reference Félix, Falk and D’Ortona2007). This is attributed to the self-similar scaling structure of the velocity profile, which ensures that modifying the boundary effectively rescales the thickness without altering its dependence on control parameters, including Fr and D/d. Detailed derivations supporting this argument can be found in Oba & Otsuki (Reference Oba and Otsuki2026).
$\rangle$
falls below 1 % of its maximum value at the free surface. Note that although various methods for estimating the flowing layer thickness have been reported in previous studies (Pignatel et al. Reference Pignatel, Asselin, Krieger, Christov, Ottino and Lueptow2012; Orozco et al. Reference Orozco, Delenne, Sornay and Radjai2020), the choice of δ
0 definition has been shown to have little effect on the qualitative scaling behaviour, as discussed in Félix et al. (Reference Félix, Falk and D’Ortona2007). This is attributed to the self-similar scaling structure of the velocity profile, which ensures that modifying the boundary effectively rescales the thickness without altering its dependence on control parameters, including Fr and D/d. Detailed derivations supporting this argument can be found in Oba & Otsuki (Reference Oba and Otsuki2026).
Figure 8(a) shows the normalised flowing thickness δ 0 /d plotted against the Froude number Fr for different size ratios D/d. For a fixed D/d, δ 0 /d scales with Fr as a power law with an exponent of approximately 0.15. Meanwhile, δ 0 /d exhibits a clear positive dependence on D/d, indicating that Fr alone cannot fully govern the granular flow dynamics in rotating drums. This dependence is primarily attributed to the reduced influence of end-wall effects and lateral confinement at higher D/d, which promotes the development of a thicker shear zone (Bonamy et al. Reference Bonamy, Daviaud and Laurent2002). Therefore, the effect of D/d should be considered together with Fr when characterising the flow behaviour.
Normalised flowing layer thickness δ 0 /d as a function of (a) the Froude number Fr and (b) the scaling parameter Q * defined in (2.12) for different values of the size ratio D/d. The dashed lines represent the correlations fitted to our experimental data.

Figure 8. Long description
The image contains two scatter plots with fitting curves. The first plot (a) shows the normalized flowing layer thickness (delta_0/d) as a function of the Froude number (Fr) for different size ratios (D/d). The second plot (b) shows the normalized flowing layer thickness (delta_0/d) as a function of the scaling parameter (Q*) for different size ratios (D/d). The dashed lines represent the correlations fitted to the experimental data. The size ratios (D/d) are represented by different symbols: circles for D/d = 75, squares for D/d = 60, upward triangles for D/d = 50, downward triangles for D/d = 37.5, and diamonds for D/d = 30. In plot (b), additional data points from previous studies are included, represented by stars and crosses. The fitting curves in both plots help to visualize the trends and relationships between the variables. All values are approximated.
As introduced in § 2.4, the dimensionless flow rate for dry cases, given by Q
* = ${\textit{Fr}}^{1/2}(D/d)^{3/2}/4$
, provides an alternative approach to scaling the experimental data. It can be clearly seen from figure 8(b) that most data points of δ
0
/d as a function of Q
* collapse onto a unified curve, irrespective of the rotation speed or particle size, with a coefficient of determination (R
2) of 0.96. The data follow a power-law relationship similar to that observed when δ
0
/d is plotted against Fr, but with a larger exponent of 0.35 and a significantly better overall collapse. To validate the robustness of the δ
0
/d–Q
* scaling law for dry cases in this study, experimental data from Orpe & Khakhar (Reference Orpe and Khakhar2001) and Pignatel et al. (Reference Pignatel, Asselin, Krieger, Christov, Ottino and Lueptow2012) are also plotted in figure 8(b) for comparison. Given that the definition of δ
0 and particle properties differ among these studies, which mainly affect the prefactor rather than the qualitative scaling behaviour, the comparison therefore focuses on the scaling exponent. As shown in figure 8(b), the present scaling exponent (n
${\textit{Fr}}^{1/2}(D/d)^{3/2}/4$
, provides an alternative approach to scaling the experimental data. It can be clearly seen from figure 8(b) that most data points of δ
0
/d as a function of Q
* collapse onto a unified curve, irrespective of the rotation speed or particle size, with a coefficient of determination (R
2) of 0.96. The data follow a power-law relationship similar to that observed when δ
0
/d is plotted against Fr, but with a larger exponent of 0.35 and a significantly better overall collapse. To validate the robustness of the δ
0
/d–Q
* scaling law for dry cases in this study, experimental data from Orpe & Khakhar (Reference Orpe and Khakhar2001) and Pignatel et al. (Reference Pignatel, Asselin, Krieger, Christov, Ottino and Lueptow2012) are also plotted in figure 8(b) for comparison. Given that the definition of δ
0 and particle properties differ among these studies, which mainly affect the prefactor rather than the qualitative scaling behaviour, the comparison therefore focuses on the scaling exponent. As shown in figure 8(b), the present scaling exponent (n $\, = \,$
0.35) is higher than the value of 0.15 reported by Pignatel et al. (Reference Pignatel, Asselin, Krieger, Christov, Ottino and Lueptow2012). This discrepancy is likely attributed to the fact that n is not a universal constant but depends on the range of Q
* explored and the flow regime (Pignatel et al. Reference Pignatel, Asselin, Krieger, Christov, Ottino and Lueptow2012). While the Q
* ranges are comparable, the datasets in Pignatel et al. (Reference Pignatel, Asselin, Krieger, Christov, Ottino and Lueptow2012) are restricted to the rolling regime characterised by nearly flat free surfaces, whereas our experiments span both rolling and cascading regimes. The development of pronounced S-shaped free-surface profiles in the cascading regime leads to a steeper scaling response. Our interpretation is further supported by Orpe & Khakhar (Reference Orpe and Khakhar2001), whose experiments also involved cascading flows and yielded an exponent of 0.31, close to the present value of 0.35 within a similar Q
* range.
$\, = \,$
0.35) is higher than the value of 0.15 reported by Pignatel et al. (Reference Pignatel, Asselin, Krieger, Christov, Ottino and Lueptow2012). This discrepancy is likely attributed to the fact that n is not a universal constant but depends on the range of Q
* explored and the flow regime (Pignatel et al. Reference Pignatel, Asselin, Krieger, Christov, Ottino and Lueptow2012). While the Q
* ranges are comparable, the datasets in Pignatel et al. (Reference Pignatel, Asselin, Krieger, Christov, Ottino and Lueptow2012) are restricted to the rolling regime characterised by nearly flat free surfaces, whereas our experiments span both rolling and cascading regimes. The development of pronounced S-shaped free-surface profiles in the cascading regime leads to a steeper scaling response. Our interpretation is further supported by Orpe & Khakhar (Reference Orpe and Khakhar2001), whose experiments also involved cascading flows and yielded an exponent of 0.31, close to the present value of 0.35 within a similar Q
* range.
Temporal evolution of the free-surface angle $\beta$
at a fixed size ratio of D/d
$\beta$
at a fixed size ratio of D/d $\, = \,$
60 under different Froude numbers: (a) Fr
$\, = \,$
60 under different Froude numbers: (a) Fr $\, = \,$
2.10 × 10⁻⁵; (b) Fr
$\, = \,$
2.10 × 10⁻⁵; (b) Fr $\, = \,$
3.01 × 10⁻³; (c) Fr
$\, = \,$
3.01 × 10⁻³; (c) Fr $\, = \,$
1.34 × 10⁻¹. Panel (d) shows the case with the same Fr as in (c) but with a smaller size ratio D/d
$\, = \,$
1.34 × 10⁻¹. Panel (d) shows the case with the same Fr as in (c) but with a smaller size ratio D/d $\, = \,$
30, highlighting the effect of D/d on the surface profile. The experimental data are fitted by a smoothing spline shown in orange.
$\, = \,$
30, highlighting the effect of D/d on the surface profile. The experimental data are fitted by a smoothing spline shown in orange.

Figure 9. Long description
The image contains four line graphs labeled (a), (b), (c), and (d). Each graph plots the free-surface angle (beta) in degrees against time (t) in seconds. Graph (a) shows data for a Froude number of 2.10 times 10 to the power of negative 5, with a size ratio of D/d equal to 60. Graph (b) presents data for a Froude number of 3.01 times 10 to the power of negative 3, also with a size ratio of D/d equal to 60. Graph (c) displays data for a Froude number of 1.34 times 10 to the power of negative 1, with the same size ratio of D/d equal to 60. Graph (d) shows data for a Froude number of 1.34 times 10 to the power of negative 1 but with a smaller size ratio of D/d equal to 30. The experimental data in each graph are fitted by a smoothing spline shown in orange. The graphs illustrate the effect of different Froude numbers and size ratios on the surface profile of granular materials.
3.2. Free surface in dry granular flows
3.2.1. Dynamic angle of repose
A simple yet effective characterisation of the macroscopic surface morphology of granular flows can be achieved through the free-surface angle $\beta$
(Zhao et al. Reference Zhao, An, Gou, Zhao and Yang2018), which reflects the dynamic balance between gravitational driving and internal resistance forces within the flowing layer. Figure 9 presents the temporal evolution of the free-surface angle
$\beta$
(Zhao et al. Reference Zhao, An, Gou, Zhao and Yang2018), which reflects the dynamic balance between gravitational driving and internal resistance forces within the flowing layer. Figure 9 presents the temporal evolution of the free-surface angle $\beta$
for different values of the Fr and D/d. At an extremely low rotation speed of
$\beta$
for different values of the Fr and D/d. At an extremely low rotation speed of $\omega = 0.5$
rpm shown in figure 9(a),
$\omega = 0.5$
rpm shown in figure 9(a), $\beta$
increases linearly with time as particles gradually lifted to the upper part of the drum until reaching the critical stable inclination angle, called the angle of avalanche
$\beta$
increases linearly with time as particles gradually lifted to the upper part of the drum until reaching the critical stable inclination angle, called the angle of avalanche $\beta$
a
(Marteau & Andrade Reference Marteau and Andrade2018). Once
$\beta$
a
(Marteau & Andrade Reference Marteau and Andrade2018). Once $\beta$
exceeds this threshold, an avalanche is released with a downslope fluid-like flow suddenly happening, accompanied by a linear drop in
$\beta$
exceeds this threshold, an avalanche is released with a downslope fluid-like flow suddenly happening, accompanied by a linear drop in $\beta$
until the lowest energy is reached. Further rotation triggers successive avalanches, and this periodic behaviour signifies the occurrence of the slumping regime (Mellmann Reference Mellmann2001), which is beyond the scope of the present study. As the rotation speed increases to 6 rpm, the free surface eventually stabilises after an avalanche at the dynamic angle of repose
$\beta$
until the lowest energy is reached. Further rotation triggers successive avalanches, and this periodic behaviour signifies the occurrence of the slumping regime (Mellmann Reference Mellmann2001), which is beyond the scope of the present study. As the rotation speed increases to 6 rpm, the free surface eventually stabilises after an avalanche at the dynamic angle of repose $\beta$
0, indicating that the flow reaches a continuous state, as displayed in figure 9(b). When the flow transitions into the cascading regime (Fr
$\beta$
0, indicating that the flow reaches a continuous state, as displayed in figure 9(b). When the flow transitions into the cascading regime (Fr $\, = \,$
1.34 × 10⁻¹ in figure 9
c),
$\, = \,$
1.34 × 10⁻¹ in figure 9
c), $\beta$
0 becomes larger and exhibits more pronounced temporal fluctuations during the continuous steady state. This is because higher rotation speeds amplify particle inertia and collisional interactions, leading to a steeper free surface and a higher degree of disorder in surface particle motion. In addition, as shown in figure 9(d), a smaller size ratio D/d induces a decisive, large-scale avalanche, following which the free surface stabilises in the steady state characterised by larger surface fluctuations and a lower
$\beta$
0 becomes larger and exhibits more pronounced temporal fluctuations during the continuous steady state. This is because higher rotation speeds amplify particle inertia and collisional interactions, leading to a steeper free surface and a higher degree of disorder in surface particle motion. In addition, as shown in figure 9(d), a smaller size ratio D/d induces a decisive, large-scale avalanche, following which the free surface stabilises in the steady state characterised by larger surface fluctuations and a lower $\beta$
0, compared with the case in figure 9(c) at the same Fr. The underlying mechanism involves the facilitated shear accommodation of larger particles through more frequent rolling and rearrangement, which reduces the effective internal friction and enables stable flow at a gentler slope.
$\beta$
0, compared with the case in figure 9(c) at the same Fr. The underlying mechanism involves the facilitated shear accommodation of larger particles through more frequent rolling and rearrangement, which reduces the effective internal friction and enables stable flow at a gentler slope.
The tangent of the dynamic angle of repose tan $\beta$
0 as a function of (a) the Froude number Fr and (b) the scaling parameter Q
* defined in (2.12) for dry cases with different values of the size ratio D/d. The dashed lines represent the fitted correlations.
$\beta$
0 as a function of (a) the Froude number Fr and (b) the scaling parameter Q
* defined in (2.12) for dry cases with different values of the size ratio D/d. The dashed lines represent the fitted correlations.

Figure 10. Long description
The image contains two scatter plots with fitting curves. The first plot (a) shows the tangent of the dynamic angle of repose (tan beta 0) as a function of the Froude number (Fr) for dry cases with different values of the size ratio D/d. The second plot (b) shows the tangent of the dynamic angle of repose (tan beta 0) as a function of the scaling parameter Q*. The size ratios D/d are represented by different symbols: circles for D/d = 75, squares for D/d = 60, triangles for D/d = 50, diamonds for D/d = 37.5, and hexagons for D/d = 30. The dashed lines represent the fitted correlations for each plot. The fitting curves in plot (a) are labeled with values such as 0.11, 0.21, and 1.00, while the fitting curves in plot (b) are labeled with values such as 1.00, 0.11, 0.23, and 1.00. The x-axes are logarithmic scales, and the y-axes are linear scales. The plots illustrate how the tangent of the dynamic angle of repose varies with the Froude number and the scaling parameter Q* for different size ratios.
Given the observed temporal fluctuations of the free surface, the dynamic angle of repose $\beta$
0 is computed by averaging the surface angles identified in each frame throughout the steady-state period. Its tangent, tan
$\beta$
0 is computed by averaging the surface angles identified in each frame throughout the steady-state period. Its tangent, tan $\beta$
0, which is commonly used to characterise the flow dynamics, is then plotted as a function of the Froude number Fr and the scaling parameter Q
* for different size ratios D/d, as shown in figures 10(a) and 10(b), respectively. Globally, for a constant D/d, tan
$\beta$
0, which is commonly used to characterise the flow dynamics, is then plotted as a function of the Froude number Fr and the scaling parameter Q
* for different size ratios D/d, as shown in figures 10(a) and 10(b), respectively. Globally, for a constant D/d, tan $\beta$
0 increases systematically with Fr, following a two-stage power-law behaviour consistent with previous work (Preud’homme et al. Reference Preud’homme, Lumay, Vandewalle and Opsomer2021). The slope in the log–log plot changes from 0.11 to 0.21 at Fr
$\beta$
0 increases systematically with Fr, following a two-stage power-law behaviour consistent with previous work (Preud’homme et al. Reference Preud’homme, Lumay, Vandewalle and Opsomer2021). The slope in the log–log plot changes from 0.11 to 0.21 at Fr $\, = \,$
8.38 × 10⁻³, marking the transition from the rolling to the cascading regime. The observed two-fold increase in the growth rate of tan
$\, = \,$
8.38 × 10⁻³, marking the transition from the rolling to the cascading regime. The observed two-fold increase in the growth rate of tan $\beta$
0 in the cascading regime can be fundamentally attributed to the shift to a more efficient energy dissipation mechanism (Vu et al. Reference Vu, Amarsid, Delenne, Richefeu and Radjai2024). In this regime, particles experience more frequent collisions and longer trajectories along the S-shaped free surface, leading to an enhanced internal energy dissipation. To maintain a steady flow, the system must establish a steeper dynamic angle of repose, thereby providing sufficient gravitational driving force to balance this enhanced internal resistance. Consequently, the enhanced inertial effects make tan
$\beta$
0 in the cascading regime can be fundamentally attributed to the shift to a more efficient energy dissipation mechanism (Vu et al. Reference Vu, Amarsid, Delenne, Richefeu and Radjai2024). In this regime, particles experience more frequent collisions and longer trajectories along the S-shaped free surface, leading to an enhanced internal energy dissipation. To maintain a steady flow, the system must establish a steeper dynamic angle of repose, thereby providing sufficient gravitational driving force to balance this enhanced internal resistance. Consequently, the enhanced inertial effects make tan $\beta$
0 more sensitive to changes in Fr, leading to a faster growth compared with the rolling regime.
$\beta$
0 more sensitive to changes in Fr, leading to a faster growth compared with the rolling regime.
The data in figure 10(a) also reveal a clear dependence of tan $\beta$
0 on the size ratio D/d at a given Fr, with smaller D/d corresponding to a lower tan
$\beta$
0 on the size ratio D/d at a given Fr, with smaller D/d corresponding to a lower tan $\beta$
0. This trend is most pronounced for D/d
$\beta$
0. This trend is most pronounced for D/d $\, = 30$
due to size effects. To incorporate this dependence, the evolution of tan
$\, = 30$
due to size effects. To incorporate this dependence, the evolution of tan $\beta$
0 is plotted against the scaling parameter Q
* in figure 10(b). Similarly, figure 10(b) clearly exhibits a piecewise power-law growth, with exponents of 0.11 and 0.23 separated by a critical threshold at Q
* ≈ 8. This behaviour indicates that the increase in inertial effects with Q
* leads to a transition in the dominant particle interaction mechanisms. The introduction of Q
*, however, leads to a markedly improved data collapse across all values of D/d and Fr, with most data following a universal two-stage scaling relation. This further demonstrates that the scaling parameter Q
* is a governing dimensionless parameter capable of predicting and controlling the dry granular flow based on the particle size ratio and operational Froude number.
$\beta$
0 is plotted against the scaling parameter Q
* in figure 10(b). Similarly, figure 10(b) clearly exhibits a piecewise power-law growth, with exponents of 0.11 and 0.23 separated by a critical threshold at Q
* ≈ 8. This behaviour indicates that the increase in inertial effects with Q
* leads to a transition in the dominant particle interaction mechanisms. The introduction of Q
*, however, leads to a markedly improved data collapse across all values of D/d and Fr, with most data following a universal two-stage scaling relation. This further demonstrates that the scaling parameter Q
* is a governing dimensionless parameter capable of predicting and controlling the dry granular flow based on the particle size ratio and operational Froude number.
Relationships between the tangent of the dynamic angle of repose tan $\beta$
0 and the normalised flowing layer thickness δ
0
/d for different size ratios D/d. The dashed lines correspond to linear fits, and the dotted line marks the transition from the rolling to the cascading regime.
$\beta$
0 and the normalised flowing layer thickness δ
0
/d for different size ratios D/d. The dashed lines correspond to linear fits, and the dotted line marks the transition from the rolling to the cascading regime.

Figure 11. Long description
A scatter plot with several data points showing the relationship between the tangent of the dynamic angle of repose and the normalized flowing layer thickness for different size ratios. The x-axis represents the normalized flowing layer thickness, while the y-axis represents the tangent of the dynamic angle of repose. The data points are color-coded and shaped differently to represent different size ratios. Dashed lines indicate linear fits, and a dotted line marks the transition from the rolling to the cascading regime. The plot shows clusters and patterns in the data, with some data points deviating from the general trend.
3.2.2. Relationship between the surface angle and flowing layer thickness
Particular attention is directed to the correlation between the surface profile, as a kinematic feature, and the flowing layer thickness, which reflects the flow dynamics. Figure 11 presents the tangent of the dynamic angle of repose tan $\beta$
0 as a function of the normalised flowing layer thickness δ
0
/d for different size ratios D/d. For a given D/d, tan
$\beta$
0 as a function of the normalised flowing layer thickness δ
0
/d for different size ratios D/d. For a given D/d, tan $\beta$
0 exhibits a piecewise linear growth with δ
0
/d, characterised by a significantly steeper slope in the second stage, reflecting intensified particle collisions and momentum transfer typical of the cascading regime; for instance, the slope increases from 0.013 to 0.07 for the case of D/d
$\beta$
0 exhibits a piecewise linear growth with δ
0
/d, characterised by a significantly steeper slope in the second stage, reflecting intensified particle collisions and momentum transfer typical of the cascading regime; for instance, the slope increases from 0.013 to 0.07 for the case of D/d $\, = 75$
. Interestingly, the transition between the two stages of linear growth consistently occurs at a critical angle, tan
$\, = 75$
. Interestingly, the transition between the two stages of linear growth consistently occurs at a critical angle, tan $\beta$
0 ≈ 0.58, irrespective of Fr and D/d, which can be interpreted as a turning point from the rolling and cascading regimes. This observation is in good agreement with the visual evidence of the free-surface morphologies shown in figure 5 and corresponds to the rolling-to-cascading transition identified in figure 10, providing a promising criterion for distinguishing the onset of regime transition.
$\beta$
0 ≈ 0.58, irrespective of Fr and D/d, which can be interpreted as a turning point from the rolling and cascading regimes. This observation is in good agreement with the visual evidence of the free-surface morphologies shown in figure 5 and corresponds to the rolling-to-cascading transition identified in figure 10, providing a promising criterion for distinguishing the onset of regime transition.
Another interesting observation is that the slope k in each stage systematically increases with decreasing D/d, indicating an enhanced sensitivity of tan $\beta$
0 to δ
0
/d. The relationship between tan
$\beta$
0 to δ
0
/d. The relationship between tan $\beta$
0 and δ
0
/d in the first stage, corresponding to the rolling regime, can be expressed as
$\beta$
0 and δ
0
/d in the first stage, corresponding to the rolling regime, can be expressed as
 \begin{equation} \tan \beta _{0}=k_{1}\left(\delta _{0}/d\right)+b_{1} ,\end{equation}
where b
1 is the fitting parameter that depends on the size ratio, exhibiting an increasing trend with D/d. A similar linear form describing the relationship between the surface angle and the flowing layer thickness was also reported by Pignatel et al. (Reference Pignatel, Asselin, Krieger, Christov, Ottino and Lueptow2012). Based on a static friction force balance, they related the slope k
1 to an effective Coulombic friction parameter μ $_{w}$
, serving as a macroscopic measure of particle–wall interactions. From this perspective, larger particles, associated with higher values of k
i
and consequently greater effective Coulombic friction against the sidewalls, experience stronger lateral confinement, thereby requiring higher rotation speeds to achieve a comparable flow dynamics. This provides a physical explanation for the increase in δ
0
/d with larger D/d at a given surface angle, as shown in figure 11. In addition, the intercept b
1 physically represents the macroscopic resistance to flow initiation, which can be associated with the effective friction μ
s
between the moving particles and the static granular bed (Pignatel et al. Reference Pignatel, Asselin, Krieger, Christov, Ottino and Lueptow2012). As D/d increases, smaller particles form more contacts with the fixed granular bed, resulting in a higher μ
s
and thereby necessitating a steeper surface angle to overcome these interactions and initiate flow (Zhang et al. Reference Zhang, Huang, Ge, Man and Huppert2025).
$_{w}$
, serving as a macroscopic measure of particle–wall interactions. From this perspective, larger particles, associated with higher values of k
i
and consequently greater effective Coulombic friction against the sidewalls, experience stronger lateral confinement, thereby requiring higher rotation speeds to achieve a comparable flow dynamics. This provides a physical explanation for the increase in δ
0
/d with larger D/d at a given surface angle, as shown in figure 11. In addition, the intercept b
1 physically represents the macroscopic resistance to flow initiation, which can be associated with the effective friction μ
s
between the moving particles and the static granular bed (Pignatel et al. Reference Pignatel, Asselin, Krieger, Christov, Ottino and Lueptow2012). As D/d increases, smaller particles form more contacts with the fixed granular bed, resulting in a higher μ
s
and thereby necessitating a steeper surface angle to overcome these interactions and initiate flow (Zhang et al. Reference Zhang, Huang, Ge, Man and Huppert2025).
Considering the good agreement between the physical interpretation of the friction coefficients and our experimental observations, equation (3.2) can be rewritten as
 \begin{equation} \tan \beta _{0}=\mu _{w}\left(\delta _{0}/d\right)+\mu _{s} .\end{equation}
This relationship represents a force balance between the gravitational driving force and the frictional resistance from the sidewalls and the static granular bed, effectively capturing the granular flow dynamics through the macroscopic friction coefficients μ $_{w}$
and μ
s
, which vary systematically with the size ratio D/d.
$_{w}$
and μ
s
, which vary systematically with the size ratio D/d.
When transitioning into the cascading regime, the relationship between tan $\beta$
0 and δ
0
/d is given by
$\beta$
0 and δ
0
/d is given by
 \begin{equation} \tan \beta _{0}=k_{2}\left(\delta _{0}/d-b_{2}\right)+C ,\end{equation}
where C ≈ 0.58 denotes the critical angle marking the rolling–cascading transition. In this regime, k
2 can still be interpreted as an effective Coulombic friction parameter μ $_{w}$
due to the enhanced wall friction. However, once the flow fully enters the inertia- and collision-dominated cascading regime, b
2 no longer reflects a direct measure of macroscopic friction between particles and the static bed. Instead, it acts primarily as a fitting offset characterising the threshold thickness of the flowing layer required for the transition into the cascading regime. As b
2 increases systematically with D/d, larger values of D/d correspond to a thicker flowing layer involving a greater fraction of mobilised particles and stronger collisional interactions, leading to more pronounced inertial flow behaviour.
$_{w}$
due to the enhanced wall friction. However, once the flow fully enters the inertia- and collision-dominated cascading regime, b
2 no longer reflects a direct measure of macroscopic friction between particles and the static bed. Instead, it acts primarily as a fitting offset characterising the threshold thickness of the flowing layer required for the transition into the cascading regime. As b
2 increases systematically with D/d, larger values of D/d correspond to a thicker flowing layer involving a greater fraction of mobilised particles and stronger collisional interactions, leading to more pronounced inertial flow behaviour.
3.3. Flow dynamics and scaling behaviour of cohesive granular materials
3.3.1. Effect of size ratio
Having characterised the flow dynamics of dry granular materials, attention is now directed to cohesive granular systems obtained by introducing a small amount of liquid, which transforms the assembly into a pendular state. The presence of interstitial liquid generates capillary bridges between particles, giving rise to cohesive interactions that significantly change the overall flow dynamics (Pol et al. Reference Pol, Artoni and Richard2025). To illustrate these effects, cohesive particles with pure water as the interstitial fluid are first examined in rotating drums at a liquid content of ${w}$
${w}$ $\, = 2$
% and a rotation speed of
$\, = 2$
% and a rotation speed of $\omega = 10$
rpm (Fr
$\omega = 10$
rpm (Fr $\,= 8.38$
× 10–3). Two representative particle size ratios (D/d
$\,= 8.38$
× 10–3). Two representative particle size ratios (D/d $\, = 75$
and 37.5) are considered, and the corresponding surface morphologies and particle velocity fields are shown in figures 12(b) and 12(d), with the dry counterparts presented in figures 12(a) and 12(c) for comparison.
$\, = 75$
and 37.5) are considered, and the corresponding surface morphologies and particle velocity fields are shown in figures 12(b) and 12(d), with the dry counterparts presented in figures 12(a) and 12(c) for comparison.
Time-averaged fields of particle velocity $\langle$
u
$\langle$
u $\rangle$
(a–d) and shear rate
$\rangle$
(a–d) and shear rate $\langle \dot{\gamma }\rangle$
(e–h) in rotating drums with different size ratios D/d (75 and 37.5) and liquid contents
$\langle \dot{\gamma }\rangle$
(e–h) in rotating drums with different size ratios D/d (75 and 37.5) and liquid contents ${w}$
(0 % and 2 %). The rotation speed is fixed at
${w}$
(0 % and 2 %). The rotation speed is fixed at $\omega = 10$
rpm (Fr
$\omega = 10$
rpm (Fr $\,= 8.38$
× 10–3). The region enclosed by the black dashed line denotes the shear band, while the area between this band and the free surface corresponds to the plug zone.
$\,= 8.38$
× 10–3). The region enclosed by the black dashed line denotes the shear band, while the area between this band and the free surface corresponds to the plug zone.

Figure 12. Long description
The image contains eight circular plots arranged in two columns and four rows. The left column shows particle velocity fields, while the right column shows shear rate fields. Each plot represents different size ratios and liquid contents. The top row shows data for a size ratio of 75, and the bottom row shows data for a size ratio of 37.5. The left column plots (a) and (c) represent 0 percent liquid content, while plots (b) and (d) represent 2 percent liquid content. Similarly, the right column plots (e) and (g) represent 0 percent liquid content, and plots (f) and (h) represent 2 percent liquid content. The plots include a shear band region enclosed by a black dashed line and a plug zone between the shear band and the free surface. The color scales at the bottom indicate the range of values for particle velocity and shear rate.
It can be clearly seen that the addition of pure water leads to a larger dynamic angle of repose $\beta$
0 for both size ratios with respect to the cohesionless cases. For
$\beta$
0 for both size ratios with respect to the cohesionless cases. For $D/d=75$
, the free surface of the cohesive granular material exhibits a more convex profile (figure 12
b), accompanied by the appearance of particle clusters formed through liquid bridges and the associated capillary forces. These cohesive clusters enhance the internal shear resistance of the flowing layer, demanding a steeper surface to sustain steady flow. When D/d in the cohesive granular system decreases to 37.5, corresponding to a reduction in Bo from 9.43 to 2.36, the free surface becomes smoother with a smaller
$D/d=75$
, the free surface of the cohesive granular material exhibits a more convex profile (figure 12
b), accompanied by the appearance of particle clusters formed through liquid bridges and the associated capillary forces. These cohesive clusters enhance the internal shear resistance of the flowing layer, demanding a steeper surface to sustain steady flow. When D/d in the cohesive granular system decreases to 37.5, corresponding to a reduction in Bo from 9.43 to 2.36, the free surface becomes smoother with a smaller $\beta$
0, and the clustering effect weakens (figure 12
d). This behaviour is attributed to the reduced dominance of capillary over gravitational forces, implying a weaker cohesion effect. Therefore, at a given rotation speed, smaller particles experience stronger relative capillary cohesion, which efficiently resists shear and allows them to be transported further up the drum wall, resulting in a steeper surface slope. A similar dependence of the surface angle on particle size has been reported in previous studies on cohesive granular systems (Nowak, Samadani & Kudrolli Reference Nowak, Samadani and Kudrolli2005; Liu, Yang & Yu Reference Liu, Yang and Yu2011). In addition, the surface flow velocity decreases when cohesion is introduced, primarily because capillary bridges strengthen interparticle forces that hinder particle sliding, while the kinetic energy is further dissipated through cohesive interactions between partially saturated particles. Compared with smaller cohesive particles, larger particles possess weaker capillary bridges that are prone to continuous rupture and reformation under shear, resulting in pronounced hysteretic energy dissipation and consequently a reduced surface velocity under identical rotational speed. This highlights the coupled roles of inertial and capillary forces in governing cohesive granular flow.
$\beta$
0, and the clustering effect weakens (figure 12
d). This behaviour is attributed to the reduced dominance of capillary over gravitational forces, implying a weaker cohesion effect. Therefore, at a given rotation speed, smaller particles experience stronger relative capillary cohesion, which efficiently resists shear and allows them to be transported further up the drum wall, resulting in a steeper surface slope. A similar dependence of the surface angle on particle size has been reported in previous studies on cohesive granular systems (Nowak, Samadani & Kudrolli Reference Nowak, Samadani and Kudrolli2005; Liu, Yang & Yu Reference Liu, Yang and Yu2011). In addition, the surface flow velocity decreases when cohesion is introduced, primarily because capillary bridges strengthen interparticle forces that hinder particle sliding, while the kinetic energy is further dissipated through cohesive interactions between partially saturated particles. Compared with smaller cohesive particles, larger particles possess weaker capillary bridges that are prone to continuous rupture and reformation under shear, resulting in pronounced hysteretic energy dissipation and consequently a reduced surface velocity under identical rotational speed. This highlights the coupled roles of inertial and capillary forces in governing cohesive granular flow.
By visual inspection of the particle velocity fields, the flowing layer thickness exhibits an increasing trend with cohesion. To further understand the underlying particle movement mechanisms within this expanded flowing region, the time-averaged fields of the local shear rate $\langle \dot{\gamma }\rangle$
are analysed, as shown in figure 12(e–h). Here, the shear rate
$\langle \dot{\gamma }\rangle$
are analysed, as shown in figure 12(e–h). Here, the shear rate $\dot{\gamma }$
is calculated as
$\dot{\gamma }$
is calculated as
 \begin{equation} \dot{\gamma }=\frac{1}{2}\left(\frac{\partial u}{\partial z}+\frac{\partial v}{\partial x}\right)\! ,\end{equation}
where u and v denote the particle velocities in the directions parallel and normal to the free surface, respectively, defined in the local streamwise coordinate system (x, z). The symmetric form of the rate-of-strain tensor in (3.5) is employed to inherently exclude the contribution of rigid-body rotation, ensuring that the calculated shear rate reflects only the intrinsic deformation of the granular bed. This approach is consistent with established practices in recent granular flows studies (Dong et al. Reference Dong, Wang, Marks, Chen and Gan2023; Chen et al. Reference Chen, Suo, Dong, Zhong, Wei and Gan2024).
In contrast to the cohesionless cases, where high shear rates are localised near the free surface, the presence of cohesion leads to a distinct stratification of the flowing layer into an upper plug zone and a lower shear band, as shown in figure 12(f). Within the plug zone, the shear rate approaches zero, indicating collective particle motion in the form of quasi-rigid clusters with negligible internal deformation (Preud’homme et al. Reference Preud’homme, Lumay, Vandewalle and Opsomer2021; Wang et al. Reference Wang, Guo, Ding, Liu, Qin, Wang and Wang2023). The change in the surface flow region signifies a transition from a collisional to a viscoplastic regime, where the dominance of capillary forces strengthens interparticle bonding and enhances energy dissipation, leading to reduced shear rates and less intensive deformation in both the plug zone and the shear band. In addition, with a decrease in D/d, both the plug zone and the shear band become narrower, and the shear rates within these regions decline (figure 12 h), indicating that the flow gradually approaches a collisional regime as the relative cohesion effect becomes less significant. This variation in flowing layer thickness reflects the competition between cohesive and inertial forces, where stronger cohesion effects enhance interparticle coupling and facilitate stress transmission over a greater depth, thereby extending the sheared region.
To provide a quantitative insight into how cohesion affects the velocity distribution within the flowing layer, the profiles of the time-averaged particle velocity $\langle u_{x}\rangle /\sqrt{gd}$
along the depth are investigated for dry and cohesive cases with different particle size ratios D/d under a fixed rotation speed of
$\langle u_{x}\rangle /\sqrt{gd}$
along the depth are investigated for dry and cohesive cases with different particle size ratios D/d under a fixed rotation speed of $\omega = 10$
rpm, as presented in figure 13. The velocity profiles for cohesive cases exhibit a slower decrease with depth compared with the dry cases, resulting in a more flattened and stretched shape and a thicker flowing layer. This reflects a reduced shear rate within the flowing layer, which arises from the formation of particle clusters induced by interparticle cohesion, consistent with the observations in figure 12. From a classical hydraulic perspective, the normalised velocity
$\omega = 10$
rpm, as presented in figure 13. The velocity profiles for cohesive cases exhibit a slower decrease with depth compared with the dry cases, resulting in a more flattened and stretched shape and a thicker flowing layer. This reflects a reduced shear rate within the flowing layer, which arises from the formation of particle clusters induced by interparticle cohesion, consistent with the observations in figure 12. From a classical hydraulic perspective, the normalised velocity $\langle u_{x}\rangle /\sqrt{gd}$
can be interpreted as a local Froude number Frlocal
(Yang et al. Reference Yang, Jing, Kwok and Sobral2020), where Frlocal
> 1 and Frlocal
< 1 correspond to supercritical and subcritical flow states, respectively. Note that, while the surface flow in dry cases remains predominantly supercritical, the introduction of cohesion significantly suppresses the flow intensity. For instance, in cases with D/d
$\langle u_{x}\rangle /\sqrt{gd}$
can be interpreted as a local Froude number Frlocal
(Yang et al. Reference Yang, Jing, Kwok and Sobral2020), where Frlocal
> 1 and Frlocal
< 1 correspond to supercritical and subcritical flow states, respectively. Note that, while the surface flow in dry cases remains predominantly supercritical, the introduction of cohesion significantly suppresses the flow intensity. For instance, in cases with D/d $\, = \,$
50 (figure 13
c) and 37.5 (figure 13
d), a distinct transition from supercritical to subcritical flow is observed near the free surface. Moreover, as D/d increases, corresponding to an enhanced capillary cohesion effect, the velocity profile near the surface becomes nearly flat, indicating that particles begin to flow with the same velocity. This further reflects the transition toward a cohesion-dominated plug flow regime, where the deviation between cohesive and dry cases becomes increasingly pronounced.
$\, = \,$
50 (figure 13
c) and 37.5 (figure 13
d), a distinct transition from supercritical to subcritical flow is observed near the free surface. Moreover, as D/d increases, corresponding to an enhanced capillary cohesion effect, the velocity profile near the surface becomes nearly flat, indicating that particles begin to flow with the same velocity. This further reflects the transition toward a cohesion-dominated plug flow regime, where the deviation between cohesive and dry cases becomes increasingly pronounced.
Profiles of the time-averaged particle velocity $\langle$
u
x
$\langle$
u
x $\rangle$
normalised by
$\rangle$
normalised by $\sqrt{gd}$
plotted against the normalised depth z/d for dry and cohesive cases with different particle size ratios D/d. Panels show (a) D/d
$\sqrt{gd}$
plotted against the normalised depth z/d for dry and cohesive cases with different particle size ratios D/d. Panels show (a) D/d $\, = \,$
75; (b) D/d
$\, = \,$
75; (b) D/d $\, = \,$
60; (c) D/d
$\, = \,$
60; (c) D/d $\, = \,$
50; (d) D/d
$\, = \,$
50; (d) D/d $\, = \,$
37.5; (e) D/d
$\, = \,$
37.5; (e) D/d $\, = \,$
30. For each case, blue dashed lines correspond to dry granular flows (
$\, = \,$
30. For each case, blue dashed lines correspond to dry granular flows ( ${w}$
${w}$ $\, = \,$
0 %), and red solid lines correspond to cohesive flows with
$\, = \,$
0 %), and red solid lines correspond to cohesive flows with ${w}$
${w}$ $\, = \,$
2 %.
$\, = \,$
2 %.

Figure 13. Long description
The image contains five line graphs labeled (a) through (e), each showing the profiles of time-averaged particle velocity normalized by the square root of gravity and particle diameter, plotted against the normalized depth. The graphs compare dry granular flows (blue dashed lines) with cohesive flows (red solid lines) for different particle size ratios: (a) 75, (b) 60, (c) 50, (d) 37.5, and (e) 30. Each graph illustrates how the velocity profiles differ between dry and cohesive cases across various depths. The blue dashed lines represent dry granular flows with 0 percent water content, while the red solid lines represent cohesive flows with 2 percent water content. The graphs show that cohesive flows generally exhibit lower particle velocities compared to dry flows, particularly at greater depths.
Building upon these analyses and observations, figure 14 summarises the evolutions of the normalised flowing layer thickness δ
0/d and the tangent of the dynamic angle of repose tan $\beta$
0 with the particle size ratio D/d for both dry and cohesive cases. For a given Froude number, a reduction in particle size under identical interstitial fluid properties increases the Bond number, Bo, defined in (2.3) and strengthens capillary cohesion effect, which in turn leads to larger values of both δ
0/d and tan
$\beta$
0 with the particle size ratio D/d for both dry and cohesive cases. For a given Froude number, a reduction in particle size under identical interstitial fluid properties increases the Bond number, Bo, defined in (2.3) and strengthens capillary cohesion effect, which in turn leads to larger values of both δ
0/d and tan $\beta$
0. Although no clear functional dependence (e.g. linear or power law) of δ
0/d and tan
$\beta$
0. Although no clear functional dependence (e.g. linear or power law) of δ
0/d and tan $\beta$
0 on D/d is observed for cohesive cases, both quantities remain consistently larger than those in dry cases, indicating that cohesion plays an important role in shaping the macroscopic flow behaviour. Note that the observed changes in the flow dynamics are governed by the combined effects of both size ratio D/d and cohesion. This provides a basis to test whether the proposed dimensionless parameter Q
∗ can effectively capture these simultaneous influences, as demonstrated in § 3.3.3.
$\beta$
0 on D/d is observed for cohesive cases, both quantities remain consistently larger than those in dry cases, indicating that cohesion plays an important role in shaping the macroscopic flow behaviour. Note that the observed changes in the flow dynamics are governed by the combined effects of both size ratio D/d and cohesion. This provides a basis to test whether the proposed dimensionless parameter Q
∗ can effectively capture these simultaneous influences, as demonstrated in § 3.3.3.
(a) Normalised flowing layer thickness δ
0
/d and (b) tangent of the dynamic angle of repose tan $\beta$
0 as functions of the size ratio D/d for both dry and cohesive cases.
$\beta$
0 as functions of the size ratio D/d for both dry and cohesive cases.

Figure 14. Long description
The image contains two scatter plots side by side. The left plot (a) shows the normalized flowing layer thickness (delta sub 0 divided by d) on the y-axis against the size ratio (D divided by d) on the x-axis. The right plot (b) shows the tangent of the dynamic angle of repose (tan beta sub 0) on the y-axis against the same size ratio (D divided by d) on the x-axis. Both plots compare data for dry cases, represented by red circles, and cohesive cases, represented by blue circles with white centers. The data points indicate how these parameters vary with the size ratio. The plots suggest that both the normalized flowing layer thickness and the tangent of the dynamic angle of repose increase with the size ratio, with cohesive cases generally showing higher values than dry cases. All values are approximated.
In addition, although the Bond numbers of the cohesive particles are generally below 10 in this study, indicating a weakly cohesive regime, we observed that interparticle cohesion can significantly affect the flow dynamics, as discussed above. Furthermore, regarding the flow regime transition, at lower rotation speeds (e.g. $\omega = 4$
rpm), the addition of 2 % interstitial fluid induces discontinuous avalanches for granular assemblies with D/d
$\omega = 4$
rpm), the addition of 2 % interstitial fluid induces discontinuous avalanches for granular assemblies with D/d $\, = \,$
60, whereas the dry counterpart exhibits continuous flow under the same conditions, as shown in figure 15(a). This demonstrates that the cohesion increases the critical rotation speed required to achieve a steady, continuous flow. This study focuses on dense granular flows under relatively weak cohesion and within a rotation speed range that ensures continuous motion, while the intermittent avalanche (slumping) regime is beyond our scope. Therefore, a rotation speed of 10 rpm (figure 15
b) was selected to ensure that cohesive particles of different sizes achieve continuous flows, which is higher than that required for the cohesionless systems.
$\, = \,$
60, whereas the dry counterpart exhibits continuous flow under the same conditions, as shown in figure 15(a). This demonstrates that the cohesion increases the critical rotation speed required to achieve a steady, continuous flow. This study focuses on dense granular flows under relatively weak cohesion and within a rotation speed range that ensures continuous motion, while the intermittent avalanche (slumping) regime is beyond our scope. Therefore, a rotation speed of 10 rpm (figure 15
b) was selected to ensure that cohesive particles of different sizes achieve continuous flows, which is higher than that required for the cohesionless systems.
Temporal evolution of the free-surface angle $\beta$
at D/d
$\beta$
at D/d $\, = \,$
60 for dry and cohesive cases: (a) Fr
$\, = \,$
60 for dry and cohesive cases: (a) Fr $\, = \,$
1.34 × 10⁻³; (b) Fr
$\, = \,$
1.34 × 10⁻³; (b) Fr $\, = \,$
8.38 × 10⁻³.
$\, = \,$
8.38 × 10⁻³.

Figure 15. Long description
Two line graphs illustrate the temporal evolution of the free-surface angle at a diameter ratio of 60 for dry and cohesive cases. The first graph (a) represents a Froude number of 1.34 times 10 to the power of negative 3, with data collected over 14 seconds. The second graph (b) represents a Froude number of 8.38 times 10 to the power of negative 3, with data collected over 8 seconds. In both graphs, the red line indicates a 0 percentage cohesion, while the blue line indicates a 2 percentage cohesion. The y-axis measures the angle in degrees, ranging from 0 to 50 degrees. The x-axis measures time in seconds. The graphs show that the angle increases rapidly initially and then stabilizes, with the cohesive case exhibiting higher angles and more fluctuations compared to the dry case.
3.3.2. Effect of capillary-induced cohesion
Particular attention is given to the effects of interstitial fluid properties on the dynamics of cohesive granular flows, since the capillary force between particles in the pendular state partly originates from the surface tension at the liquid–air interface, which directly governs the interparticle cohesion. In this study, the ethanol fraction in the liquid mixtures varies from 0 % (pure water) to 15 % while maintaining a fixed size ratio of D/d $\, = \,$
60 and liquid content of
$\, = \,$
60 and liquid content of ${w}$
${w}$ $\, = \,$
2 %, thereby reducing the Bo from 6.03 to 3.27 to achieve different levels of particle cohesion, as listed in table 1.
$\, = \,$
2 %, thereby reducing the Bo from 6.03 to 3.27 to achieve different levels of particle cohesion, as listed in table 1.
Figures 16(a) and 16(b) display the evolution of the normalised flowing layer thickness δ
0
/d and the tangent of the dynamic angle of repose tan $\beta$
0 as a function of the microscopic Bond number Bo defined in (2.3) for different values of Froude numbers Fr at a fixed size ratio of D/d
$\beta$
0 as a function of the microscopic Bond number Bo defined in (2.3) for different values of Froude numbers Fr at a fixed size ratio of D/d $\, = \,$
60. Here,
$\, = \,$
60. Here, $\omega$
≥ 10 rpm is used to ensure continuous flows. For a given Fr, a systematic decrease in both δ
0
/d and tan
$\omega$
≥ 10 rpm is used to ensure continuous flows. For a given Fr, a systematic decrease in both δ
0
/d and tan $\beta$
0 is observed with Bo. Furthermore, the effect of Bo appears to be linked to inertial effects, with tan
$\beta$
0 is observed with Bo. Furthermore, the effect of Bo appears to be linked to inertial effects, with tan $\beta$
0 showing a more pronounced decline in drums operating at a higher rotation speed, while varying only slightly with Bo at lower Fr. It should be noted that opposite behaviours have been reported in previous studies, where Preud’homme et al. (Reference Preud’homme, Lumay, Vandewalle and Opsomer2021) and Dong et al. (Reference Dong, Wang, Marks, Chen and Gan2023) observed that particles with a larger Bo tend to exhibit a steeper surface slope and a thicker flowing layer. In their simulations, Bo was increased by enhancing the surface tension γ at the liquid–air interface while keeping the contact angle θ unchanged, thereby strengthening the capillary cohesion between particles. However, in our experiments, the contact angle inevitably varies with the fluid composition. As listed in table 1, an increase in ethanol mass fraction leads to a systematic reduction in γ, accompanied by a more pronounced increase in cos θ, indicating enhanced wettability of the PMMA surface. Consequently, the effective adhesive term γ cosθ, qualitatively reflecting the effective cohesion (Nase et al. Reference Nase, Vargas, Abatan and McCarthy2001; Schaarsberg et al. Reference Schaarsberg, Peters, Stern, Dodge, Zhang and Jaeger2016), increases with ethanol concentration despite the decrease in γ alone. In essence, both our results and previous studies reflect the same mechanism, namely that enhanced cohesion promotes a thicker flowing layer and a steeper surface slope.
$\beta$
0 showing a more pronounced decline in drums operating at a higher rotation speed, while varying only slightly with Bo at lower Fr. It should be noted that opposite behaviours have been reported in previous studies, where Preud’homme et al. (Reference Preud’homme, Lumay, Vandewalle and Opsomer2021) and Dong et al. (Reference Dong, Wang, Marks, Chen and Gan2023) observed that particles with a larger Bo tend to exhibit a steeper surface slope and a thicker flowing layer. In their simulations, Bo was increased by enhancing the surface tension γ at the liquid–air interface while keeping the contact angle θ unchanged, thereby strengthening the capillary cohesion between particles. However, in our experiments, the contact angle inevitably varies with the fluid composition. As listed in table 1, an increase in ethanol mass fraction leads to a systematic reduction in γ, accompanied by a more pronounced increase in cos θ, indicating enhanced wettability of the PMMA surface. Consequently, the effective adhesive term γ cosθ, qualitatively reflecting the effective cohesion (Nase et al. Reference Nase, Vargas, Abatan and McCarthy2001; Schaarsberg et al. Reference Schaarsberg, Peters, Stern, Dodge, Zhang and Jaeger2016), increases with ethanol concentration despite the decrease in γ alone. In essence, both our results and previous studies reflect the same mechanism, namely that enhanced cohesion promotes a thicker flowing layer and a steeper surface slope.
(a) Normalised flowing layer thickness δ
0
/d and (b) tangent of the dynamic angle of repose tan $\beta$
0 as functions of the Bond number Bo for different Froude numbers Fr at a fixed size ratio of D/d
$\beta$
0 as functions of the Bond number Bo for different Froude numbers Fr at a fixed size ratio of D/d $\, = \,$
60. The blue arrow indicates that, for cohesive cases with fixed D/d
$\, = \,$
60. The blue arrow indicates that, for cohesive cases with fixed D/d $\, = \,$
60, effective cohesion increases with decreasing Bo.
$\, = \,$
60, effective cohesion increases with decreasing Bo.

Figure 16. Long description
The image contains two separate graphs. The first graph (a) shows the normalized flowing layer thickness (delta_0/d) on the y-axis and the Bond number (Bo) on the x-axis. Different symbols and colors represent various Froude numbers (Fr), including circles for Fr = 1.34 _ 10^−1, squares for Fr = 7.55 _ 10^−2, triangles for Fr = 3.35 _ 10^−2, and diamonds for Fr = 1.89 _ 10^−2 and Fr = 8.38 _ 10^−3. The second graph (b) displays the tangent of the dynamic angle of repose (tan beta_0) on the y-axis and the Bond number (Bo) on the x-axis, with the same symbols and colors representing the different Froude numbers. The blue arrow in graph (a) indicates that effective cohesion increases with decreasing Bond number for cohesive cases with a fixed size ratio of D/d = 60. The data points show how these parameters vary with the Bond number for different Froude numbers, illustrating the relationship between these variables. All values are approximated.
This phenomenon can be interpreted through a simplified slab-based force balance, similar to that adopted to account for the flow in a confined granular heap (Taberlet et al. Reference Taberlet, Richard, Valance, Losert, Pasini, Jenkins and Delannay2003). Considering a granular slab, parallel to the free surface, with thickness δ
0 and density $\rho _{p}$
, the downslope driving shear stress acting at the base is
$\rho _{p}$
, the downslope driving shear stress acting at the base is
 \begin{equation} \tau \left(\delta _{0}\right)=\rho _{p}g\delta _{0}\sin \beta _{0} .\end{equation}
The corresponding normal stress at the base of the slab is
 \begin{equation} p\left(\delta _{0}\right)=\rho _{p}g\delta _{0}\cos \beta _{0} .\end{equation}
Following the Mohr–Coulomb framework, the base of the slab (flowing layer) is treated as a yield surface (Pol et al. Reference Pol, Artoni and Richard2025), with the shear stress τ at the base expressed as
 \begin{equation} \tau =\mu _{s}p+c ,\end{equation}
where μ s denotes the effective friction coefficient between the flowing layer and the underlying static granular bed, and c represents the cohesive stress induced by capillary bridges. Equation (3.8) shows that the presence of cohesion increases the resisting shear stress at the base of the flowing layer, thereby requiring a larger driving shear stress to sustain steady flow. Substituting equations (3.6) and (3.7) into (3.8), we obtain
 \begin{equation} \tan \beta _{0}=\mu _{s}+\frac{c}{\rho _{p}g\delta _{0}\cos \beta _{0}} ,\end{equation}
which clearly clarifies how the system adjusts to increased cohesion. That is, an increase in the cohesive force should be balanced by increasing either the basal normal stress p through a thicker flowing layer, or the downslope driving stress through a steeper surface angle $\beta$
0. Under steady flow conditions, both adjustments typically occur concurrently, leading to simultaneous increases in δ
0 and
$\beta$
0. Under steady flow conditions, both adjustments typically occur concurrently, leading to simultaneous increases in δ
0 and $\beta$
0, consistent with the experimentally observed trends in figures 14 and 16.
$\beta$
0, consistent with the experimentally observed trends in figures 14 and 16.
In addition, for a given cohesion and D/d, both δ
0
/d and tan $\beta$
0 increase systematically with Fr, as presented in figure 16. This behaviour can be rationalised within the same framework. At higher Fr, stronger inertial effects intensify particle collisions and velocity fluctuations, thus generating additional collisional stresses that enhance the total shear resistance. To accommodate this elevated stress and facilitate energy dissipation, the flow develops a thicker layer, allowing more particles to participate in energy dissipation, and a steeper surface that provides greater gravitational driving stress to overcome the enhanced inertial resistance.
$\beta$
0 increase systematically with Fr, as presented in figure 16. This behaviour can be rationalised within the same framework. At higher Fr, stronger inertial effects intensify particle collisions and velocity fluctuations, thus generating additional collisional stresses that enhance the total shear resistance. To accommodate this elevated stress and facilitate energy dissipation, the flow develops a thicker layer, allowing more particles to participate in energy dissipation, and a steeper surface that provides greater gravitational driving stress to overcome the enhanced inertial resistance.
3.3.3. Scaling analysis and unified law
The results presented in § 3.3 demonstrate that the flow dynamics of cohesive granular materials in a rotating drum is governed by a complex interplay of several dominant parameters, including cohesion, size effects and inertial effects. Among them, cohesion and size effects are strongly coupled and nonlinear, primarily due to the dependence of interparticle capillary forces on particle size, which complicates the establishment of scaling laws for quantitatively describing cohesive granular flows.
Based on the dimensional analysis of cohesive granular flows with the introduction of a capillary time scale, we propose a dimensionless flow rate Q
* for cohesive cases, defined as Q
* $= {\textit{Fr}}^{1/2}(D/d)^{3/2}({\textit{Bo}})^{-1/2}/4$
, to quantify the combined effects of cohesion, size and inertial effects, as detailed in § 2.4. Figures 17(a) and 17(b) plot the normalised flowing layer thickness δ
0
/d and dynamic angle of repose tan
$= {\textit{Fr}}^{1/2}(D/d)^{3/2}({\textit{Bo}})^{-1/2}/4$
, to quantify the combined effects of cohesion, size and inertial effects, as detailed in § 2.4. Figures 17(a) and 17(b) plot the normalised flowing layer thickness δ
0
/d and dynamic angle of repose tan $\beta$
0, respectively, as functions of the proposed scaling parameter Q
*, covering a wide range of Fr, D/d and Bo values. Both δ
0
/d and tan
$\beta$
0, respectively, as functions of the proposed scaling parameter Q
*, covering a wide range of Fr, D/d and Bo values. Both δ
0
/d and tan $\beta$
0 increase with Q
*, reflecting their coupled evolution as discussed in the previous section. Remarkably, all experimental data collapse onto single master curves with respect to Q
*, regardless of the rotation speed, particle size or capillary force. For comparison, simulation data from Dong et al. (Reference Dong, Wang, Marks, Chen and Gan2023) are also included and exhibit a similar scaling trend.
$\beta$
0 increase with Q
*, reflecting their coupled evolution as discussed in the previous section. Remarkably, all experimental data collapse onto single master curves with respect to Q
*, regardless of the rotation speed, particle size or capillary force. For comparison, simulation data from Dong et al. (Reference Dong, Wang, Marks, Chen and Gan2023) are also included and exhibit a similar scaling trend.
(a) Normalised flowing layer thickness δ
0
/d and (b) tangent of the dynamic angle of repose tan $\beta$
0 plotted against the proposed scaling parameter Q
* for cohesive cases, covering a wide range of Fr, D/d and Bo values. Open symbols represent cohesive cases with different particle size ratios (D/d
$\beta$
0 plotted against the proposed scaling parameter Q
* for cohesive cases, covering a wide range of Fr, D/d and Bo values. Open symbols represent cohesive cases with different particle size ratios (D/d $\, = \,$
30–75) at fixed surface tension (γ
$\, = \,$
30–75) at fixed surface tension (γ $\, = \,$
7.35 × 10⁻² N·m–1) and fixed rotation speed (Fr
$\, = \,$
7.35 × 10⁻² N·m–1) and fixed rotation speed (Fr $\, = \,$
8.38 × 10⁻³). Half-filled symbols denote cases with fixed D/d
$\, = \,$
8.38 × 10⁻³). Half-filled symbols denote cases with fixed D/d $\, = \,$
60, where the capillary strength is varied via the ethanol fraction. Simulation data from Dong et al. (Reference Dong, Wang, Marks, Chen and Gan2023) are included for comparison (D/d
$\, = \,$
60, where the capillary strength is varied via the ethanol fraction. Simulation data from Dong et al. (Reference Dong, Wang, Marks, Chen and Gan2023) are included for comparison (D/d $\, = \,$
96, γ
$\, = \,$
96, γ $\, = \,$
1.46 × 10⁻¹ N·m–1).
$\, = \,$
1.46 × 10⁻¹ N·m–1).

Figure 17. Long description
The image contains two graphs. The first graph on the left shows the normalized flowing layer thickness (delta_0/d) plotted against the scaling parameter Q*. The data points are represented by various symbols indicating different Froude numbers (Fr) and diameter ratios (D/d). A fitting curve is included with the equation delta_0/d = 8.47(Q*)^0.23. The second graph on the right shows the tangent of the dynamic angle of repose (tan beta_0) plotted against the scaling parameter Q*. The data points are similarly represented by different symbols, and a fitting curve is included with the equation tan beta_0 = 0.01(Q*)^1.55 + 0.67. The graphs cover a wide range of Fr, D/d, and Bo values, with open symbols representing cohesive cases with different particle size ratios and half-filled symbols denoting cases with fixed D/d and varied capillary strength. Simulation data from Dong et al. (2023) are included for comparison.
Specifically, the datasets in our study follow well-defined power-law relationships, which can be expressed as
 \begin{align} \delta _{0}/d&=8.47(Q^{*})^{0.23}, \end{align}
 \begin{align} \tan \beta _{0}&=0.01(Q^{*})^{1.55}+0.67 . \end{align}
Here, the exponents (0.23 and 1.55) characterise the power-law sensitivity of δ
0
/d and tan $\beta$
0 to the unified parameter Q
∗, while the prefactors (8.47 and 0.01) determine the proportionality between these quantities and Q
∗. The constant term 0.67 in (3.10b
) represents an empirical intercept obtained from fitting within our experimental range.
$\beta$
0 to the unified parameter Q
∗, while the prefactors (8.47 and 0.01) determine the proportionality between these quantities and Q
∗. The constant term 0.67 in (3.10b
) represents an empirical intercept obtained from fitting within our experimental range.
Although the term γcosθ plays an important role in qualitatively reflecting the cohesion level at the particle scale, it should be noted that the θ values shown in table 1 correspond to static measurements obtained on a flat PMMA substrate. In the rotating drum, however, the liquid bridges are subject to dynamic deformation and shearing, and the effective contact angle within these dynamic bridges may deviate from the static value. When the measured static θ is explicitly incorporated into a modified Bond number, additional scatter is introduced in the data collapse. It can be observed from figure 17 that the proposed power-law scaling, which employs a conventional Bond number that does not explicitly include θ, remains remarkably effective. This indicates that employing surface tension γ alone provides a consistent basis for establishing a unified scaling law, as γ and θ vary concurrently with liquid composition and are inherently coupled rather than independent control parameters. This approach is consistent with the principle of employing a minimal and physically coherent set of control parameters to capture the underlying physics (Pignatel et al. Reference Pignatel, Asselin, Krieger, Christov, Ottino and Lueptow2012; Man et al. Reference Man, Huppert and Galindo-Torres2025).
Overall, these results highlight the robustness and universality of the proposed scaling parameter Q * in governing the cohesive granular flows by unifying the complex interplay among the key controlling parameters. Furthermore, the proposed scaling law deepens the understanding of the complex flow behaviour of cohesive granular materials. It also has the potential to provide a theoretical foundation for continuum modelling of large-scale geophysical mass movements.
3.4. Connection to the μ(I) rheology
Having established the scaling behaviour of δ
0 and $\beta$
0 for both dry and cohesive granular materials, it is insightful to interpret these observations within the framework of rheological laws. While more recent frameworks incorporating non-local effects (Kamrin & Koval Reference Kamrin and Koval2012) or soft-particle interactions (Chialvo, Sun & Sundaresan Reference Chialvo, Sun and Sundaresan2012) have been proposed to capture the complex physics of dense granular flows, their application typically requires spatially resolved internal stress distributions or microscopic contact parameters (e.g. particle stiffness) that cannot be directly measured in the present experiments. Therefore, the classical μ(I) rheology, linking the friction coefficient μ to a dimensionless shear rate that can be estimated from macroscopic parameters accessible in rotating drums, provides a parsimonious and robust framework for comparing the rheological behaviour of dry and cohesive granular flows, following its recent numerical extensions to cohesive granular systems (Gu, Chialvo & Sundaresan Reference Gu, Chialvo and Sundaresan2014; Mandal et al. Reference Mandal, Nicolas and Pouliquen2020).
$\beta$
0 for both dry and cohesive granular materials, it is insightful to interpret these observations within the framework of rheological laws. While more recent frameworks incorporating non-local effects (Kamrin & Koval Reference Kamrin and Koval2012) or soft-particle interactions (Chialvo, Sun & Sundaresan Reference Chialvo, Sun and Sundaresan2012) have been proposed to capture the complex physics of dense granular flows, their application typically requires spatially resolved internal stress distributions or microscopic contact parameters (e.g. particle stiffness) that cannot be directly measured in the present experiments. Therefore, the classical μ(I) rheology, linking the friction coefficient μ to a dimensionless shear rate that can be estimated from macroscopic parameters accessible in rotating drums, provides a parsimonious and robust framework for comparing the rheological behaviour of dry and cohesive granular flows, following its recent numerical extensions to cohesive granular systems (Gu, Chialvo & Sundaresan Reference Gu, Chialvo and Sundaresan2014; Mandal et al. Reference Mandal, Nicolas and Pouliquen2020).
Following a similar approach proposed by Pignatel et al. (Reference Pignatel, Asselin, Krieger, Christov, Ottino and Lueptow2012), the friction coefficient μ can be approximated in our experiments by an effective coefficient μeff
≈ tan $\beta$
0, which serves as a macroscopic measure of the ratio between shear and normal stresses within the flowing layer under steady states, as also discussed in § 3.3. In addition, the shear rate
$\beta$
0, which serves as a macroscopic measure of the ratio between shear and normal stresses within the flowing layer under steady states, as also discussed in § 3.3. In addition, the shear rate $\dot{\gamma }$
is made dimensionless to define the inertial number I, which is estimated from the shear rate within the flowing layer, using
$\dot{\gamma }$
is made dimensionless to define the inertial number I, which is estimated from the shear rate within the flowing layer, using $I\approx \dot{\gamma }t_{d}$
for dry and
$I\approx \dot{\gamma }t_{d}$
for dry and $I\approx \dot{\gamma }t_{c}$
for cohesive cases, where t
d
and t
c
are the characteristic inertial and capillary time scales defined in § 2.4. And the shear rate
$I\approx \dot{\gamma }t_{c}$
for cohesive cases, where t
d
and t
c
are the characteristic inertial and capillary time scales defined in § 2.4. And the shear rate $\dot{\gamma }$
is derived from the flow rate as
$\dot{\gamma }$
is derived from the flow rate as $\dot{\gamma }\approx (Q/\delta _{0})/\delta _{0}\approx ({1}/{8})\omega D^{2}/{\delta }_{0}^{2}$
. Within our simplified framework, it is mathematically evident that the inertial number I is not independent but can be expressed as a function of Q
*, given by I = Q
*/(δ
0/d)2, which is consistent with the results obtained by Pignatel et al. (Reference Pignatel, Asselin, Krieger, Christov, Ottino and Lueptow2012). The macroscopic flow structure emerges as a direct consequence of the local rate-dependent rheology.
$\dot{\gamma }\approx (Q/\delta _{0})/\delta _{0}\approx ({1}/{8})\omega D^{2}/{\delta }_{0}^{2}$
. Within our simplified framework, it is mathematically evident that the inertial number I is not independent but can be expressed as a function of Q
*, given by I = Q
*/(δ
0/d)2, which is consistent with the results obtained by Pignatel et al. (Reference Pignatel, Asselin, Krieger, Christov, Ottino and Lueptow2012). The macroscopic flow structure emerges as a direct consequence of the local rate-dependent rheology.
Figure 18 presents the relationship between the effective friction coefficient μ eff and the inertial number I for both dry and cohesive cases, providing a rheological interpretation of our experimental data based on the above simplifications. A monotonic increase of μeff with I is observed across nearly all experimental cases, consistent with the general trend predicted by the μ(I) rheology (Badetti et al. Reference Badetti, Fall, Chevoir and Roux2018; Pouliquen Reference Pouliquen2025), indicating a rate-dependent strengthening of shear resistance. Compared with the dry cases, the monotonic rheological response of cohesive flows exhibits a higher effective friction coefficient at a given I, capturing the increased flow resistance induced by interparticle capillary cohesion. Given that the cohesion of granular assemblies reflects the enhanced intensity of contact forces, several recent simulations (Abramian, Staron & Lagrée Reference Abramian, Staron and Lagrée2020; Vo et al. Reference Vo, Nezamabadi, Mutabaruka, Delenne and Radjai2020; Deboeuf & Fall Reference Deboeuf and Fall2023) have applied the stress additivity method to extend the applicability of the μ(I) framework to cohesive systems. Within this framework, the total shear resistance is interpreted as the sum of a frictional term and additional cohesive contributions (Pouliquen Reference Pouliquen2025). The influence of cohesion can then be incorporated through the definition of a modified inertial number that includes a capillary-like characteristic time scale. Therefore, our experimental findings reveal an enhanced effective friction coefficient in cohesive flows, providing direct evidence for the validity of this stress additivity approach. Furthermore, although strict quantitative comparisons between different studies on cohesive granular flows remain challenging due to variations in particle properties and boundary conditions (Pouliquen Reference Pouliquen2025), the consistent monotonic increase of μeff with I across these studies indicates that the underlying physics of cohesive granular flows remains fundamentally governed by a rate-dependent friction law, regardless of the specific flow configuration.
Effective friction coefficient μ eff as a function of inertial number I for all experimental data, covering both dry and cohesive cases.

Figure 18. Long description
A scatter plot illustrates the relationship between the effective friction coefficient (μ_eff) and the inertial number (I) for both dry and cohesive cases. The plot features several data points, each represented by different shapes and colors, indicating varying conditions such as Froude number (Fr) and drum-to-particle size ratio (D/d). The x-axis represents the inertial number (I) ranging from approximately 0.03 to 0.15, while the y-axis represents the effective friction coefficient (μ_eff) ranging from 0.5 to 1.5. The data points are categorized into dry cases and cohesive cases, with distinct markers for different D/d ratios. The plot shows clusters of data points for each category, highlighting patterns and trends in the relationship between μ_eff and I. The dry cases are represented by circles, squares, triangles, diamonds, and hexagons in various colors, while the cohesive cases are represented by similar shapes but in different colors. The plot includes a legend explaining the symbols and colors used. The overall trend indicates a positive correlation between the inertial number and the effective friction coefficient, with variations depending on the specific conditions of each experiment. All values are approximated.
However, small deviations from the μ(I) rheological trend can be seen in some datasets, which may be attributed to the simplified assumption used in estimating the shear rate. In the present analysis, the shear rate within the flowing layer is treated as a constant, neglecting the spatial variation of the local shear rate and the gradual decay of the streamwise velocity into the bulk, both of which are known to contribute to non-local effects (Liu & Henann Reference Liu and Henann2017). Nevertheless, the current results exhibit a noticeably improved collapse compared with those reported by Pignatel et al. (Reference Pignatel, Asselin, Krieger, Christov, Ottino and Lueptow2012), likely due to the reduced effects of wall friction in our experimental set-up, which prevented the complex frictional responses observed in their studies.
Overall, despite the observed small deviations, our experimental results show a good collapse across a wide range of Fr, D/d and Bo values, with the data exhibiting clear rate-dependent frictional behaviour. This demonstrates that the adopted time-scale-based definition of I to a certain extent captures the dominant physics governing both dry and cohesive granular flows.
4. Conclusions
In this work, we have experimentally investigated the steady surface flow of dry and cohesive granular materials in a rotating drum. The effects of rotation speed, drum-to-particle size ratio D/d and cohesion strength on flow dynamics, including the velocity field, flowing layer thickness δ
0 and dynamic angle of repose $\beta$
0, were examined using PIV and statistical post-processing. In addition, scaling relationships were established to describe both dry and cohesive granular flows by unifying the complex interplay among the key controlling parameters. Our main findings are summarised below.
$\beta$
0, were examined using PIV and statistical post-processing. In addition, scaling relationships were established to describe both dry and cohesive granular flows by unifying the complex interplay among the key controlling parameters. Our main findings are summarised below.
-
(i) For dry granular flows, both δ 0 /d and tan $\beta$
0 exhibit a clear positive dependence on the Froude number Fr. As Fr increases, a transition from the rolling to the cascading regime is observed, while a smaller D/d shows a more delayed onset of this transition. A physical interpretation based on a static friction force balance suggests that larger particles experience greater effective Coulombic friction against the sidewalls and stronger lateral confinement, thereby requiring higher rotation speeds to achieve comparable flow dynamics. The dimensionless flow rate Q
* (
$Bo\ll 1$
) effectively unifies the inertia and size effects, yielding consistent power-law relationships with δ
0
/d and tan
$\beta$
0 across different Fr and D/d values. Moreover, a robust correlation between tan
$\beta$
0 and δ
0
/d identifies a critical transition angle of tan
$\beta$
0 ≈ 0.58, marking the onset of cascading behaviour.
$\beta$
0 exhibit a clear positive dependence on the Froude number Fr. As Fr increases, a transition from the rolling to the cascading regime is observed, while a smaller D/d shows a more delayed onset of this transition. A physical interpretation based on a static friction force balance suggests that larger particles experience greater effective Coulombic friction against the sidewalls and stronger lateral confinement, thereby requiring higher rotation speeds to achieve comparable flow dynamics. The dimensionless flow rate Q
* (
$Bo\ll 1$
) effectively unifies the inertia and size effects, yielding consistent power-law relationships with δ
0
/d and tan
$\beta$
0 across different Fr and D/d values. Moreover, a robust correlation between tan
$\beta$
0 and δ
0
/d identifies a critical transition angle of tan
$\beta$
0 ≈ 0.58, marking the onset of cascading behaviour. -
(ii) Compared with cohesionless cases, the presence of interstitial liquid induces capillary bridges that enhance interparticle coupling and internal shear resistance, giving rise to a distinct plug-like regime with a convex free surface, characterised by collective particle motion as quasi-rigid clusters and by larger values of
$\beta$
0 and δ
0. Smaller particles or higher ethanol contents, through their direct control over the particle-scale cohesive strength, enhance effective cohesion and thereby promote steeper free surfaces and thicker flowing layers. This behaviour is mechanistically explained by a slab-based force-balance model, wherein increased cohesive stress must be compensated by greater basal normal stress through a thicker layer or by enhanced downslope driving stress through a steeper surface. Concurrently, elevated inertia at higher Fr intensifies collisional stresses, further amplifying both δ
0
/d and tan
$\beta$
0 to facilitate energy dissipation. -
(iii) For cohesive granular materials in a pendular state, a governing dimensionless parameter Q * was proposed, derived from dimensional analysis incorporating a capillary time scale, to quantify the combined effects of cohesion, size, and inertial effects. Remarkably, nearly all experimental data for δ 0 /d and tan
$\beta$
0 collapse onto single master curves when plotted against Q
*, following well-defined power-law relationships across a wide range of Fr, D/d and Bo values. These results highlight the robustness and universality of Q
* as a governing parameter that captures the essential physics of cohesive granular flows. -
(iv) A rheological interpretation of our experimental data, linking the effective friction coefficient μ eff to the inertial number I, reveals a monotonic increase of μ eff with I across nearly all experimental cases, consistent with the general trend predicted by the μ(I) rheology. Compared with the dry cases, the rheological response of cohesive flows exhibits a higher effective friction coefficient at a given I, capturing the increased flow resistance induced by interparticle capillary cohesion. This demonstrates that the adopted definition of I, based on the characteristic time scale, captures to a certain extent the dominant physics governing both dry and cohesive granular flows.


Overall, the proposed scaling law advances the understanding of the dry and cohesive granular flow dynamics and provides a unified framework for modelling large-scale geophysical flows. Despite these advances, the present work remains phenomenological, as it relies primarily on macroscopic observations. Future studies should therefore employ numerical simulations to investigate the micro-mechanical origins of these scaling laws and to validate the proposed framework from a particle-scale perspective, for example, by extracting the non-local μ(I) rheology to characterise the intrinsic rheological response of the granular system. In addition, the drum length and diameter were kept fixed in the present experiments, which prevents a systematic decoupling of the respective effects of radial (D/d) and axial (W/d) confinement when varying the particle diameter. Although the adopted W/d range lies within the values commonly reported to mitigate sidewall effects (Orpe & Khakhar Reference Orpe and Khakhar2001; Félix et al. Reference Félix, Falk and D’Ortona2007), the specific particle properties and cohesive conditions considered here may alter the corresponding thresholds. It would also be beneficial for future studies to systematically vary the drum geometry to quantify wall influences and further generalise the proposed scaling framework.
Supplementary movie
Supplementary movie is available at https://doi.org/10.1017/jfm.2026.11716.
Acknowledgements
We thank Professor L. Xie, Dr G. Jin and Ms Q. Chen for inspiring and helpful discussions.
Funding
Funding for this study was received from the Australian Research Council through the Future Fellowship scheme (FT220100515).
Declaration of interests
The authors report no conflict of interest.
Data availability statement
The data supporting this study’s findings are openly available from the corresponding author upon reasonable request.


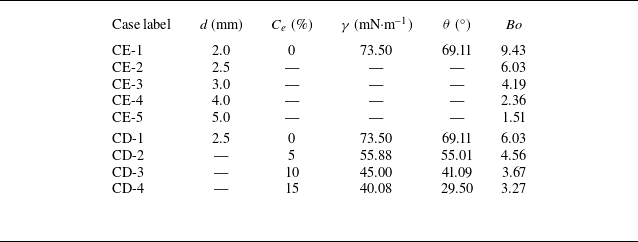

 β
β β
β
 ω
ω =
= ω
ω =
= =
=
 ⟨
⟨ ⟩
⟩ =
= =
= =
= =
= =
= ⟨
⟨ ⟩
⟩
 ⟨
⟨ ⟩
⟩ ⟨
⟨ ⟩
⟩ =
= =
= −ωz′
−ωz′ z′
z′ ⟨
⟨ ⟩
⟩ ⟨
⟨ ⟩
⟩
 ⟨
⟨ ⟩
⟩ gd
gd =
= =
=

 β
β =
= =
= =
= =
= =
=
 β
β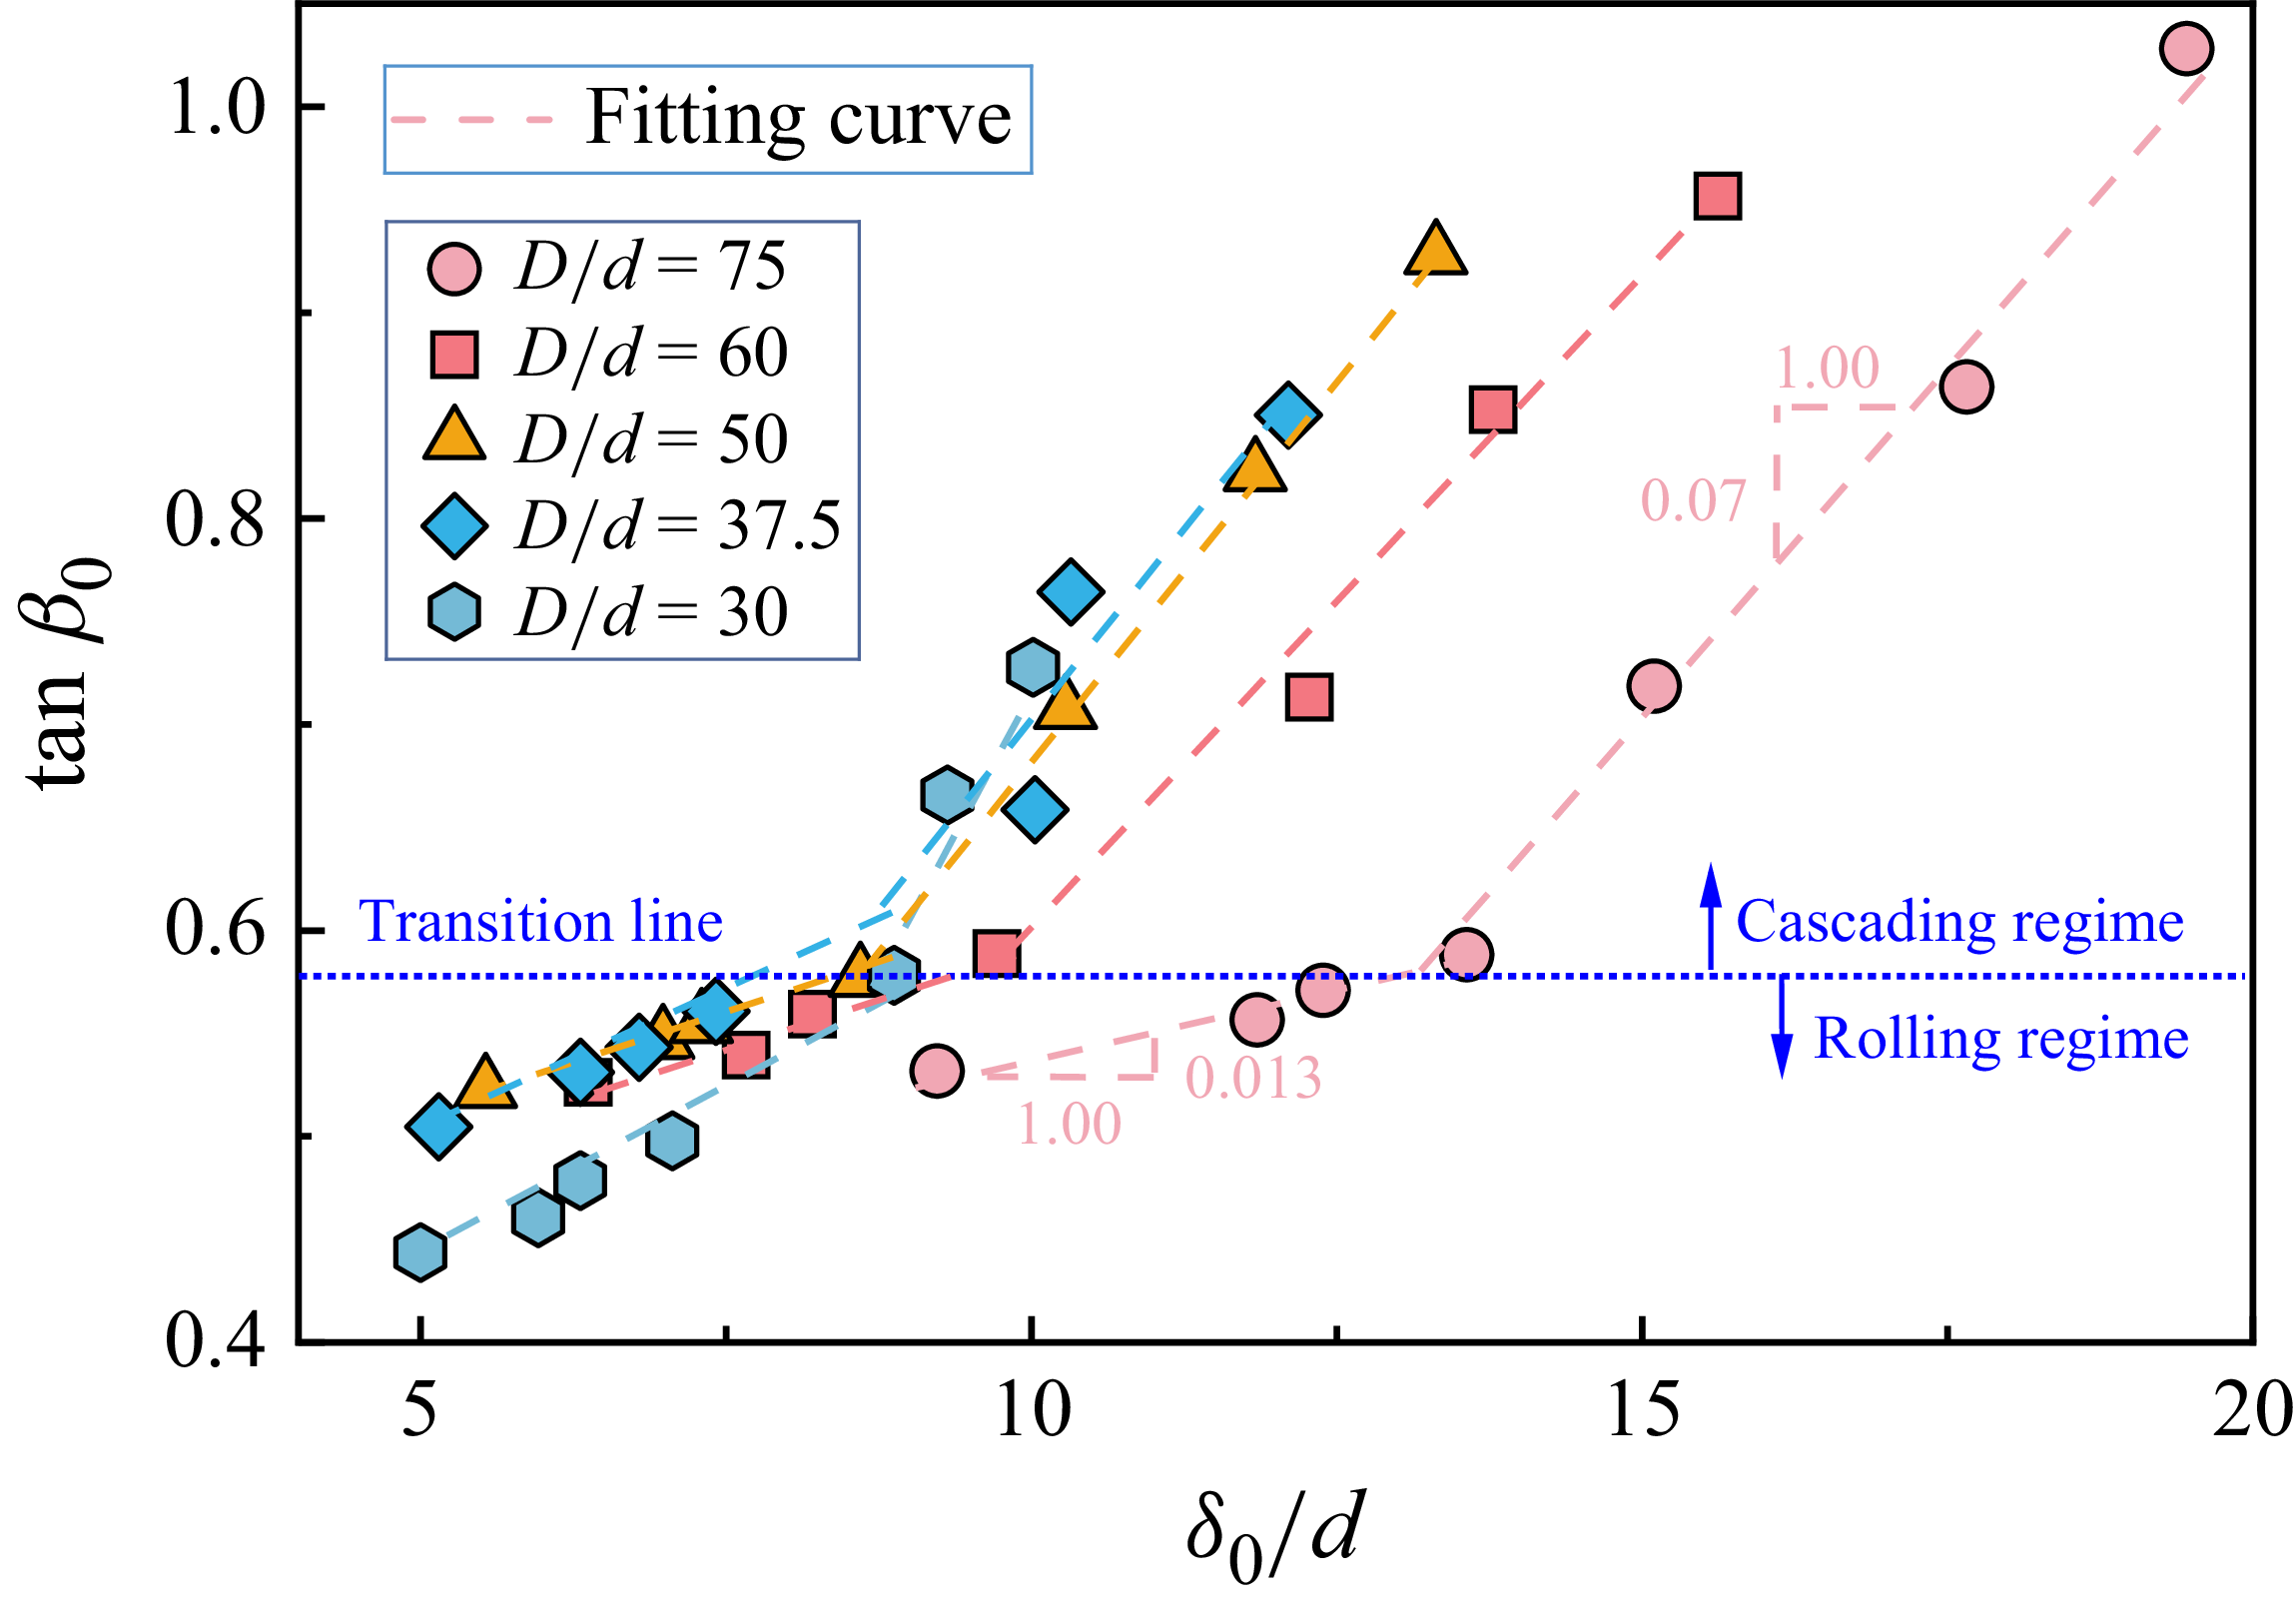
 β
β
 ⟨
⟨ ⟩
⟩ ⟨γ˙⟩
⟨γ˙⟩ w
w ω=10
ω=10 =8.38
=8.38
 ⟨
⟨ ⟩
⟩ gd
gd =
= =
= =
= =
= =
= w
w =
= w
w =
=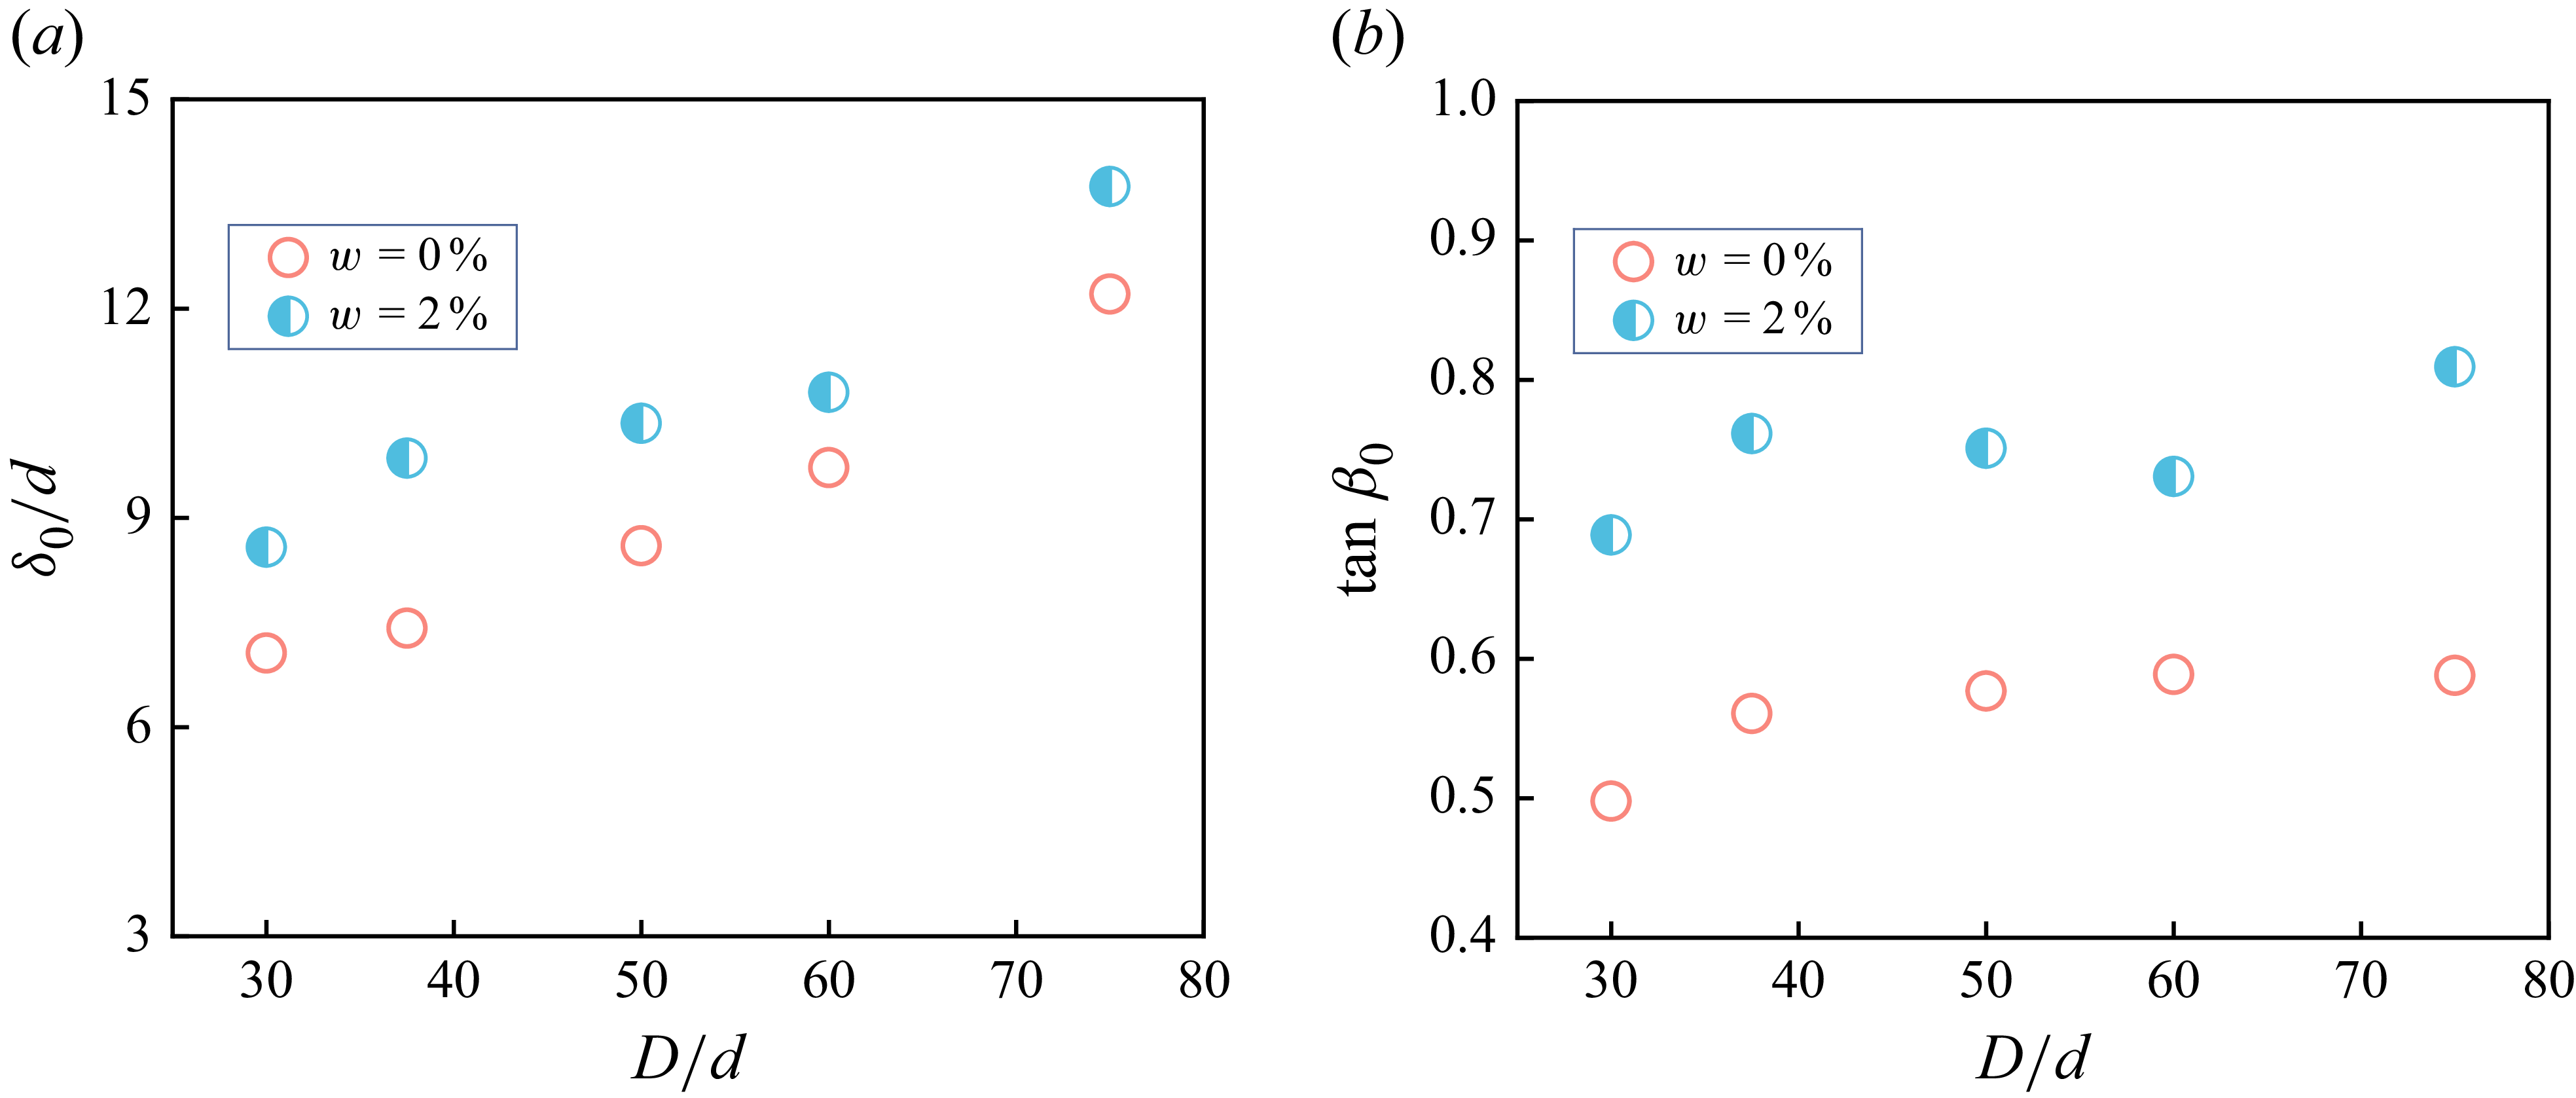
 β
β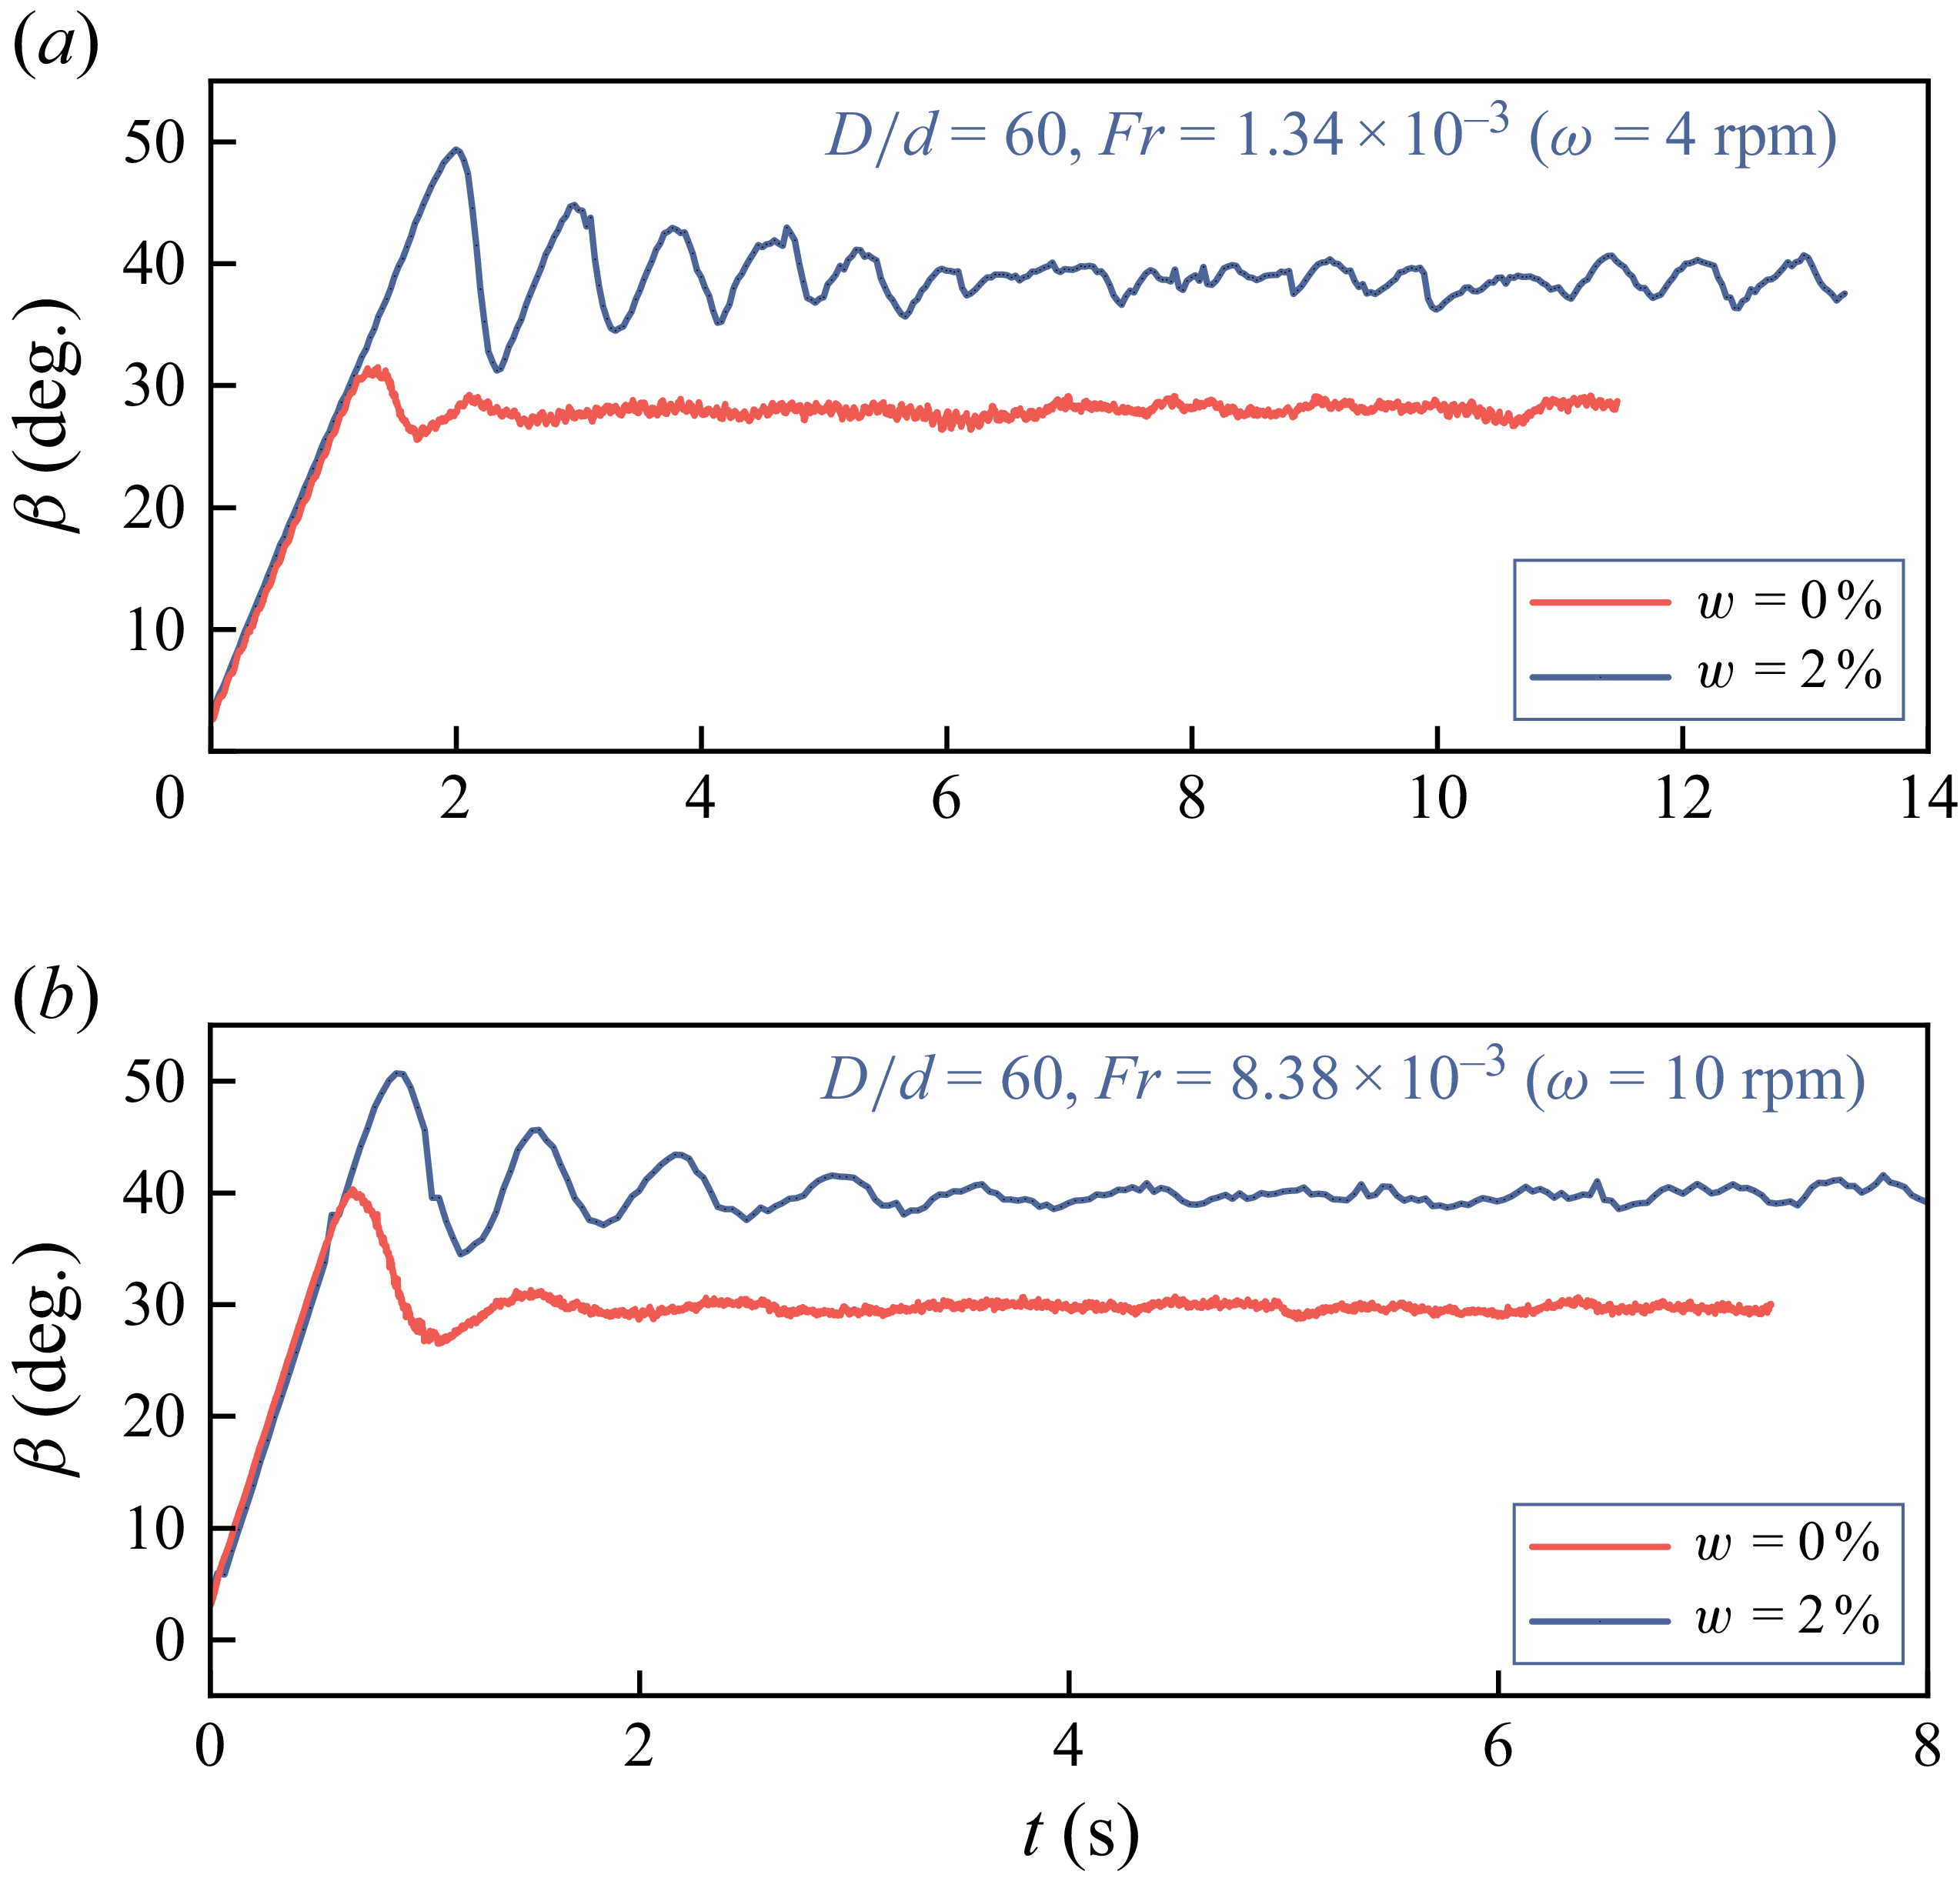
 β
β =
= =
= =
=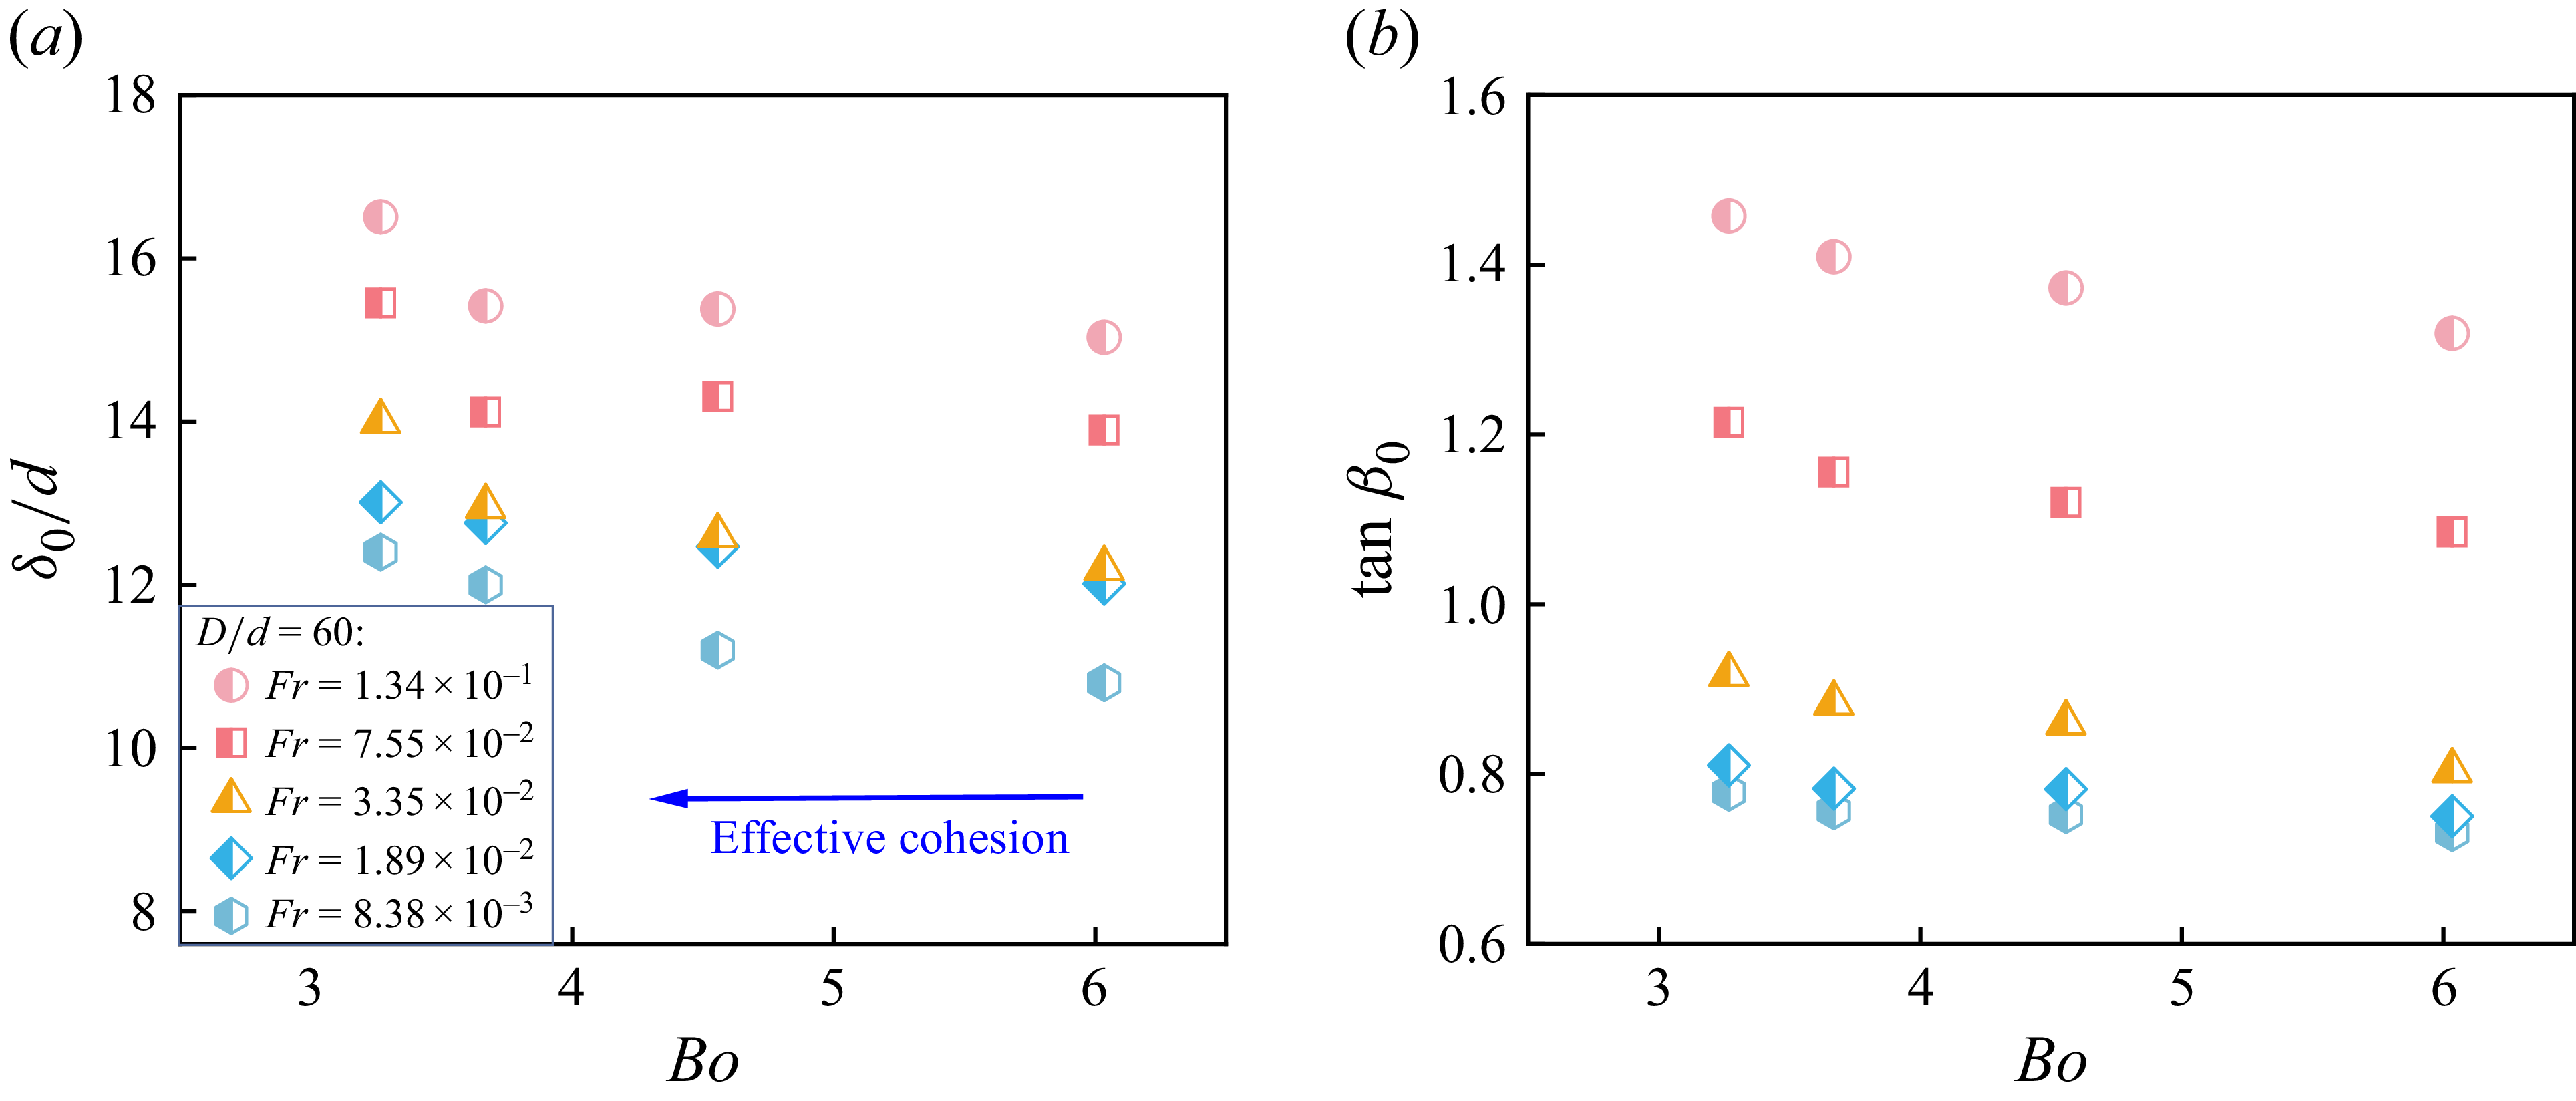
 β
β =
= =
=
 β
β =
= =
= =
= =
= =
= =
=


 Open access

