Ultra-processed foods are defined as industrially manufactured, ready-to-eat or ready-to-heat formulations made mostly from substances that are derived from foods with little, if any, whole foods( Reference Moubarac, Parra and Cannon 1 ). These products are typically convenient, omnipresent and sophisticatedly marketed; high in added sugars, salt and/or SFA; and contain cosmetic additives such as flavourings, colouring agents, emulsifiers and preservatives( Reference Moubarac, Parra and Cannon 1 – Reference Poti, Mendez and Ng 4 ). Ultra-processed foods include, but are not limited to, so-called ‘junk foods’ such as soft drinks, potato chips and confectionery, and industrially manufactured baked goods( Reference Moubarac, Parra and Cannon 1 ). However, several products that are often marketed and perceived as healthy, for example, granola bars, low-fat flavoured yogurt, low-energy frozen dinners, most industrially produced breads and canned soups, are also ultra-processed( Reference Moubarac, Parra and Cannon 1 ).
Ultra-processed foods provide on average 58 % of daily energy and 89 % of added sugars in the US diet( Reference Martinez Steele, Baraldi and Louzada 5 ). The nutritional value of ultra-processed foods and their role in a healthy diet is controversial. Although these foods may contribute to the intake of several essential nutrients in the American diet, they are also more likely to be excessive in SFA, added sugar and Na compared with less processed foods( Reference Poti, Mendez and Ng 4 , Reference Eicher-Miller, Fulgoni and Keast 6 , Reference Eicher-Miller, Fulgoni and Keast 7 ). In addition, studies in the USA, UK, Canada, Chile, France and Brazil have consistently found diets with a higher proportion of ultra-processed foods to be of poorer nutritional quality( Reference Martinez Steele, Popkin and Swinburn 8 – Reference Cediel, Reyes and da Costa Louzada 14 ).
The recent abundance of ultra-processed food in the global food supply has been hypothesised as a contributor to the worldwide rise in overweight and obesity( Reference Monteiro, Moubarac and Cannon 2 , Reference Lustig 15 ). However, few epidemiological studies have examined ultra-processed foods as a group in relation to excess weight( Reference Adams and White 10 , Reference Julia, Martinez and Allès 12 , Reference Louzada, Baraldi and Steele 16 – Reference Canella, Levy and Martins 18 ). Greater household purchases of ultra-processed foods and consuming a higher proportion of daily energy from ultra-processed foods was associated with higher BMI and prevalence of overweight and obesity in two cross-sectional studies using nationally representative data from Brazil in 2008–2009( Reference Louzada, Baraldi and Steele 16 , Reference Canella, Levy and Martins 18 ). Similarly, higher consumption of ultra-processed foods was associated with higher prevalence of overweight and obesity in a cross-sectional study of over 74 000 French adults( Reference Julia, Martinez and Allès 12 ). In the prospective Seguimiento University of Navarra (SUN) study of middle-aged Spanish college graduates, higher consumption of ultra-processed food was associated with significantly higher risk of developing overweight or obesity over approximately 9 years of follow-up( Reference Mendonca, Pimenta and Gea 17 ). Conversely, no association was observed between relative energy intake from ultra-processed and moderately processed foods combined and body weight in a cross-sectional study of a nationally representative sample in the UK( Reference Adams and White 10 ).
Studies in the USA on specific ultra-processed foods have shown that fast food, potato chips, French fries, sugar-sweetened beverages, processed meat products, fried foods, sweets and desserts are associated with weight gain( Reference Pereira, Kartashov and Ebbeling 19 , Reference Mozaffarian, Hao and Rimm 20 ). Nevertheless, the association between all ultra-processed foods as a group, that is not only specific ‘junk’ and fast foods, and excess weight has not been examined in a US population. Examining ultra-processed foods as a group, rather than just evaluating individual foods, is essential to our understanding of how food processing per se can affect health, body weight and adiposity, and this, in turn, can inform food-based dietary guidelines, weight management strategies and food and nutrition policies in the USA.
Given that ultra-processed foods provide the majority of energy in the average American diet( Reference Martinez Steele, Baraldi and Louzada 5 ), it is of particular relevance to increase our understanding regarding the relationship between these foods as a group and excess weight in the USA. Importantly, findings from existing international studies may not generalise to the US setting owing to considerable national differences in food choices, dietary habits and population characteristics. Processing methods, ingredients and the types of ultra-processed foods that are available to consumers may also differ between countries. The objective of the present investigation is therefore to examine the association between consumption of ultra-processed foods and excess weight in a nationally representative sample of US adults.
Methods
Data source
We used the National Health and Nutrition Examination Survey (NHANES) survey cycles 2005–2006 through 2013–2014. NHANES is a cross-sectional, nationally representative survey of the US non-institutionalised civilian population( Reference Zipf, Chiappa and Porter 21 ). Samples for each cycle were obtained using a complex, stratified, multi-stage probability cluster sampling design( Reference Zipf, Chiappa and Porter 21 ).
Data collection
Data on demographics, socio-economic characteristics and health behaviours were self-reported during an interview by trained interviewers in the respondents’ homes. Trained health technologists measured participants’ height, weight and waist circumference (WC) during a health examination performed at a mobile examination centre( Reference Zipf, Chiappa and Porter 21 – 25 ). Dietary intake data were collected through two 24-h dietary recall interviews( Reference Zipf, Chiappa and Porter 21 ), using the validated US Department of Agriculture Automated Multiple-Pass Method (AMPM)( Reference Moshfegh, Rhodes and Baer 26 – Reference Raper, Perloff and Ingwersen 28 ). The first recall was performed in-person at the time of the health examination, and the second recall was carried out over the telephone 3–10 d later. A total of 50 965 individuals responded to the household interview, of whom 49 116 individuals participated in the health examination( 29 ). A total of 45 538 individuals provided at least one valid 24-h dietary recall.
Definition of exposure variable
We used consumption of ultra-processed food (measured as percentage of total energy intake) categorised into quintiles as the exposure variable. To calculate this measure, we classified all food items recorded in NHANES 2005–2014 as ultra-processed or non-ultra-processed on the basis of the extent and purpose of the industrial food processing applied in accordance with the NOVA food classification( Reference Moubarac, Parra and Cannon 1 ). The scientific basis and logic of NOVA has been explained elsewhere( Reference Lustig 15 , Reference Monteiro 30 , Reference Ludwig 31 ). NOVA defines ultra-processed foods as industrial formulations made with no or minimal whole foods and produced with substances extracted from foods or synthesised in laboratories such as dyes, flavourings and preservatives, often using processing techniques with no domestic equivalent such as extrusion or moulding( Reference Moubarac, Parra and Cannon 1 ). The purpose of ultra-processing is to create convenient and intensely palatable products that are ready-to-drink, ready-to-eat or ready-to-heat and have a long shelf-life( Reference Moubarac, Parra and Cannon 1 ). The following foods were considered to be ultra-processed: instant and canned soups; reconstituted meat and fish products; ready-made sauces, gravies and dressings; French fries and other pre-made potato products such as chips; ready-to-eat and dry-mix desserts such as pudding; confectionery; sweet and savoury snack foods including granola bars and protein bars; sugar-sweetened or artificially sweetened beverages including soda, fruit drinks, pre-sweetened tea and coffee, energy drinks and dairy-based drinks; flavoured and/or sweetened yoghurt; industrially manufactured cakes, cookies and pies; dry cake and pancake mixes; industrially manufactured breads; sweet breakfast cereals; frozen and shelf-stable plate meals; ice cream, frozen yogurt and ice pops; meatless patties and fish sticks and infant formula( Reference Moubarac, Parra and Cannon 1 ). Non-ultra-processed foods encompass ‘unprocessed or minimally processed foods’ including fresh, dry or frozen fruits or vegetables, grains, legumes, meat, fish and milk; ‘processed culinary ingredients’ including table sugar, oils, fats, salt and other constituents extracted from foods or from nature and used in kitchens to make culinary preparations; and ‘processed foods’ including foods such as canned fish and vegetables and artisanal cheeses, which are manufactured by adding salt, sugar, oil or other processed culinary ingredients to unprocessed or minimally processed foods( Reference Moubarac, Parra and Cannon 1 ).
We classified foods by taking into account the NHANES variables ‘Main Food Description’, ‘Additional Food Description’, which describes foods (food codes), and ‘SR Code Description’, which describes the underlying ingredients of foods (SR codes). We also considered the NHANES variables ‘Combination Food Type’ and ‘Source of Food’. In consequence, most foods categorised as ‘Lunchables’ or ‘Frozen meals’, or sourced from a ‘Restaurant fast food/pizza’ or ‘Vending machine’, were classified as ultra-processed. When foods were judged to be a hand-made recipe, we applied the classification to the underlying ingredients in order to ensure a more accurate classification. Two authors independently reviewed the classification of each item. Discrepant classifications were resolved by discussion. Fig. 1 describes the classification process.
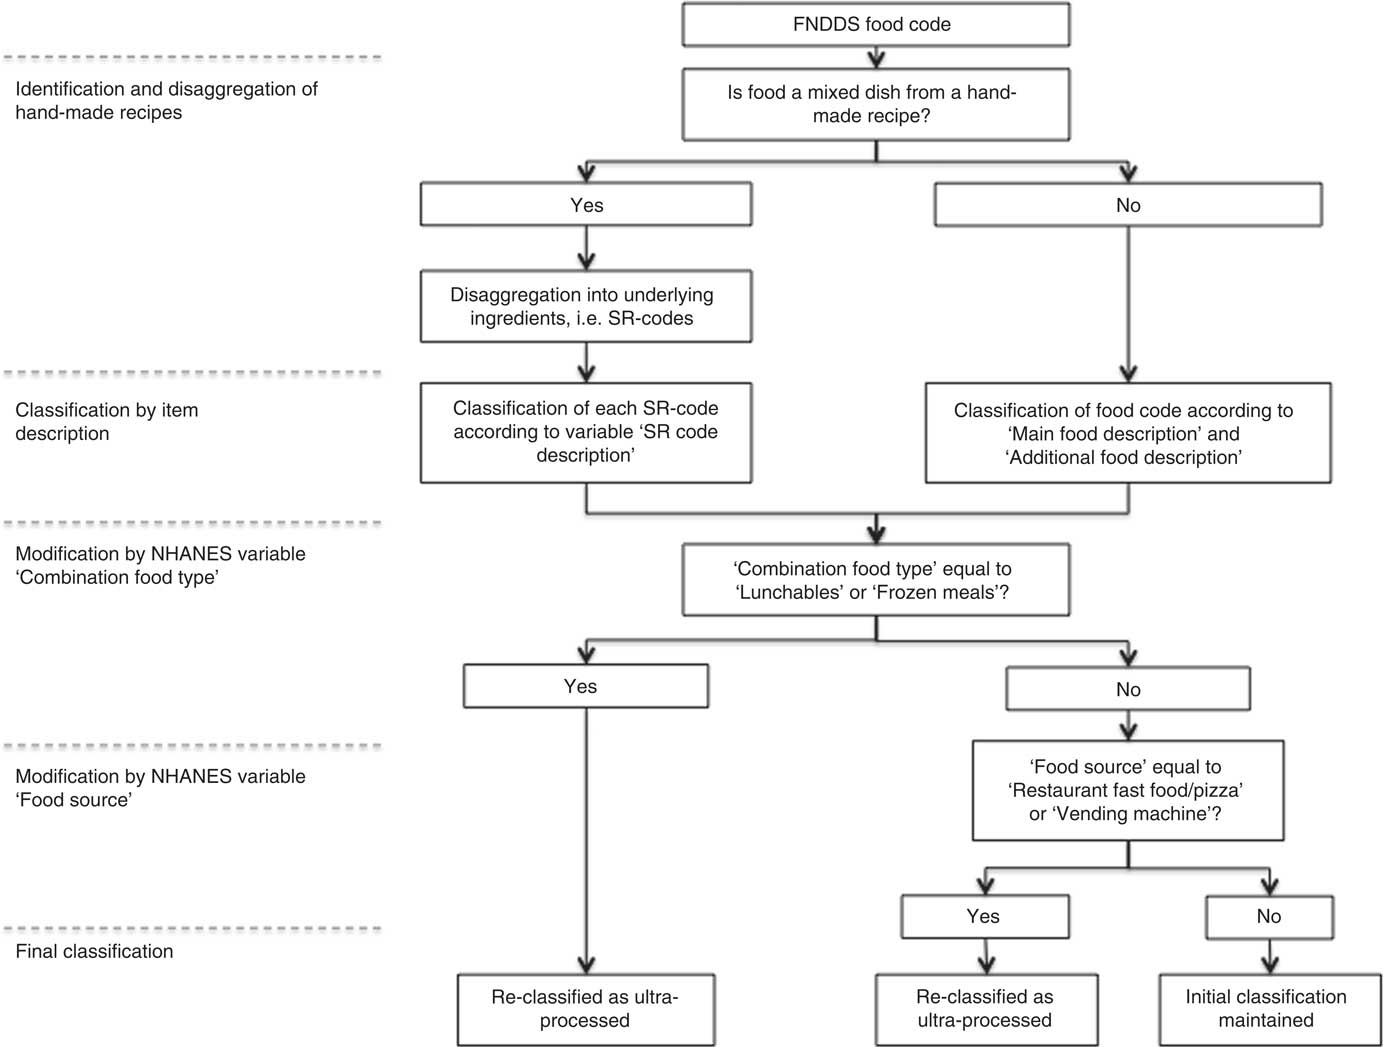
Fig. 1 Flow chart of the food classification process. FNDDS, Food and Nutrient Database for Dietary Studies; NHANES, National Health and Nutrition Examination Survey.
SR codes for each cycle were obtained from the corresponding versions of the US Department of Agriculture (USDA) Food and Nutrient Database for Dietary Studies (FNDDS) – that is FNDDS 3·0, 4·0, 5·0, 2011–2012 and 2013–2014. Food Code energy values provided by NHANES were used to calculate energy intakes from each NOVA food group. For hand-made recipes, energy values of the underlying ingredients (SR Codes) were calculated using data from both FNDDS and the USDA National Nutrient Database for Standard Reference, Release 20–28. The procedures and calculations have been described in detail elsewhere( Reference Martinez Steele, Baraldi and Louzada 5 ).
Using dietary data for day 1, we calculated the relative contribution of ultra-processed products to total energy intake for each observation (% of total energy). We thereafter divided the sample into quintiles according to relative dietary contribution of ultra-processed foods.
Definition of outcome variables
BMI (kg/m2) and WC (cm) were used as measures of excess weight and abdominal obesity, respectively. BMI values of ≥25 and ≥30 kg/m2 were classified as ‘overweight and obesity’ and ‘obesity’, respectively, according to World Health Organization criteria( 32 ). Abdominal obesity was defined as a WC ≥102 cm for men and ≥88 cm for women( 33 ).
Definition of covariates
Demographic covariates of interest included race/ethnicity (non-Hispanic white, non-Hispanic Black, Hispanic, other race including multi-racial), sex, age (in years, continuous) and marital status (married, divorced/widowed/separated, never married). Socio-economic status was measured by education level (less than high school, high school degree/general equivalency diploma, some college, college graduate or above) and family poverty income ratio, defined as the ratio of family income:the federal poverty threshold (continuous). Physical activity was classified as low (<150 min of moderate intensity equivalent activity per week), medium (150–300 min of moderate intensity equivalent activity per week) and high (>300 min of moderate intensity equivalent activity per week), based on the fulfilment of the 2008 Physical Activity Guidelines for Americans( 34 ). Smoking status was categorised as never smoked, former smoker and current smoker.
Inclusion and exclusion criteria
The analytical sample was restricted to adults aged 20–64 years, as the association between BMI and adiposity may differ for senior compared with young and middle-aged adults. Individuals were included in the analyses if they had at least one valid dietary recall and complete data for BMI, WC and demographic, socio-economic and behavioural covariates. A total of 21 637 participants were in the appropriate age span and eligible to be included in the analyses. Of these, we excluded pregnant and lactating women (n 455); participants who were underweight (BMI<18·5 kg/m2; n 355) or reported implausible energy intakes, defined as <2092 or >14 644 kJ (<500 or >3500 kcal) for women and <2510 or >18 828 kJ (<600 or >4500 kcal) for men (n 899); and individuals missing data for outcomes, exposure or covariates (n 3951). Thus, the final sample of this study was 15 977 participants.
Statistical analyses
We first assessed the distribution of participant demographic, socio-economic, dietary and behavioural characteristics by quintile of ultra-processed food consumption. Differences in individual and dietary characteristics by quintile of ultra-processed food consumption were evaluated by Pearson’s χ 2 test of independence (categorical variables) and linear regression (continuous variables).
Multiple linear regression analysis was used to evaluate associations between relative energy intake of ultra-processed food and BMI and WC, respectively. Multiple logistic regression analysis was used to determine associations between relative energy intake of ultra-processed food and the odds overweight/obesity, obesity and abdominal obesity, respectively. In both linear and logistic models, quintile of relative contribution of ultra-processed foods to total energy intake was included as the explanatory variable, with the first quintile as the reference category. For all outcomes, we first fitted an age-adjusted model and thereafter a multivariable model adjusted for age, sex, educational attainment, race/ethnicity, ratio of family income to poverty, marital status, smoking and physical activity level. Test of linear trend was performed by treating quintile of ultra-processed food as an ordinal variable. On the basis of the multivariable regression models, we calculated and plotted the estimated margins for each outcome (BMI, WC and probability of overweight, obesity and abdominal obesity) according to quintile of relative ultra-processed food consumption. Margins were estimated at the means of all covariates.
All analyses were performed both for the full analytical sample and stratified by sex. We tested for interaction between relative consumption of ultra-processed food and sex, age (years, continuous) and age group (20–39, 40–59 and >59 years), respectively, by including an interaction term (female×quintile of ultra-processed food, age×quintile of ultra-processed food and age-group×quintile of ultra-processed food, respectively) in the multivariable models. As energy intake is a plausible mediator of the association between ultra-processed food consumption and excess weight and abdominal obesity but may also act as a confounder, we performed all multivariable analyses with and without controlling for total energy. We also performed the following sensitivity analyses: (1) performing the linear and logistic multivariable analyses stratified by total energy intake (< v.>median energy intake), and (2) using a continuous measure of percentage of energy intake from ultra-processed foods (0–100 %) as the explanatory variable. Finally, as OR may overestimate prevalence ratios for common outcomes, we computed the multivariable-adjusted prevalence ratios for overweight/obesity, obesity and abdominal obesity among the full sample and stratified by sex, using Poisson regression with robust variance( Reference Barros and Hirakata 35 ).
Descriptive statistics and regression analyses were conducted using the NHANES sample weights in order to account for oversampling of certain populations, non-response and population coverage( Reference Rothwell, Madans and Porter 36 ). We used the Taylor Series Linearization variance approximation procedure to account for the complex sample design of NHANES in the variance estimation( Reference Rothwell, Madans and Porter 36 ). All analyses were performed using Stata/SE 14.2. Statistical significance was set to α=0·05.
Results
A total of 15 977 adults met the study’s inclusion criteria and were included in the analytical sample. The sample prevalence of BMI≥25 kg/m2, BMI≥30 kg/m2 and abdominal obesity was 69·2, 36·1 and 53·0 %, respectively (Table 1). Participants consumed on average 56·1 % of their total energy intake in the form of ultra-processed foods. Ultra-processed foods provided 84·5 % of total energy intake in the highest quintile of ultra-processed food consumption, compared with 25·4 % of total energy intake in the lowest quintile. Compared with participants in the lowest quintile, individuals in the top quintile were younger (39·8 v. 43·3 years, P<0·001), more likely to be female (53·5 v. 47·7 %, P=0·009), non-Hispanic white (71·6 v. 59·2 %, P<0·001) and have a family income <130 % of the federal poverty threshold (25·6 v. 22·7 %, P<0·001). Participants in the highest quintile had the highest mean BMI (29·9 kg/m2, P<0·001) and WC (100·3 cm, P<0·001), as well as the greatest prevalence of overweight (71·4 %, P=0·001), obesity (41·9 %, P<0·001) and abdominal obesity (58·8 %, P=0·001). Compared with participants consuming the least ultra-processed foods (quintile 1), participants consuming the most ultra-processed foods (quintile 5) had higher average energy intake, greater relative energy contributions from carbohydrates, sugar, SFA and PUFA and lower relative intake of protein and fibre (P=0·002 for PUFA and P<0·001 for all other variables).
Table 1 Characteristics of adults aged 20–64 years in the National Health and Nutrition Examination Survey 2005–2014 according to relative dietary contribution of ultra-processed food, n 15 977 (Mean values and standard deviations; percentages)

GED, general equivalency diploma.
*P value for continuous variables is estimated through unadjusted linear regression, treating quintile as an ordinal variable, and Pearson’s χ 2 for categorical variables.
† Natural, packaged, cut, chilled or frozen vegetables, fruits, potatoes, cassava and other roots and tubers; white, parboiled and whole-grain rice; whole or separated maize; grains of wheat and other cereals that are dried, polished or ground as grits or flour; dried or fresh pasta made from wheat flour and water; beans; lentils, chickpeas and other legumes; dried fruits, fruit juices fresh or pasteurised without added sugar or other substances; nuts, peanuts and other oilseeds without salt or sugar; fresh and dried mushrooms; fresh and dried herbs and spices; fresh, frozen, dried beef, pork, poultry and other meat and fish; pasteurised, ‘long-life’ and powdered milk; fresh and dried eggs, yogurt without sugar; tea, herbal infusions, coffee and tap, spring and mineral water.
‡ Plant oils; coconut and animal fats (including butter and lard); table sugar, maple syrup (100 %), molasses and honey; and table salt.
§ Canned and bottled vegetables, legumes or fruits; salted nuts or seeds; salted, smoked or cured meat or fish; canned fish or meat; cheeses.
|| Instant and canned soups; reconstituted meat and fish products; ready-made sauces, gravies and dressings; French fries and other pre-made potato products such as chips; ready-to-eat and dry-mix desserts such as pudding; confectionery; sweet and savoury snack foods including granola and protein bars; sugar-sweetened or artificially sweetened beverages including soda, fruit drinks, pre-sweetened tea and coffee, energy drinks and dairy product-based drinks; flavoured and/or sweetened yogurt; industrially manufactured cakes, cookies and pies; dry cake and pancake mixes; industrially manufactured breads; processed cheese products; sweet breakfast cereals; frozen and shelf-stable plate meals; ice cream, frozen yogurt and ice pops; meatless patties and fish sticks and infant formula.
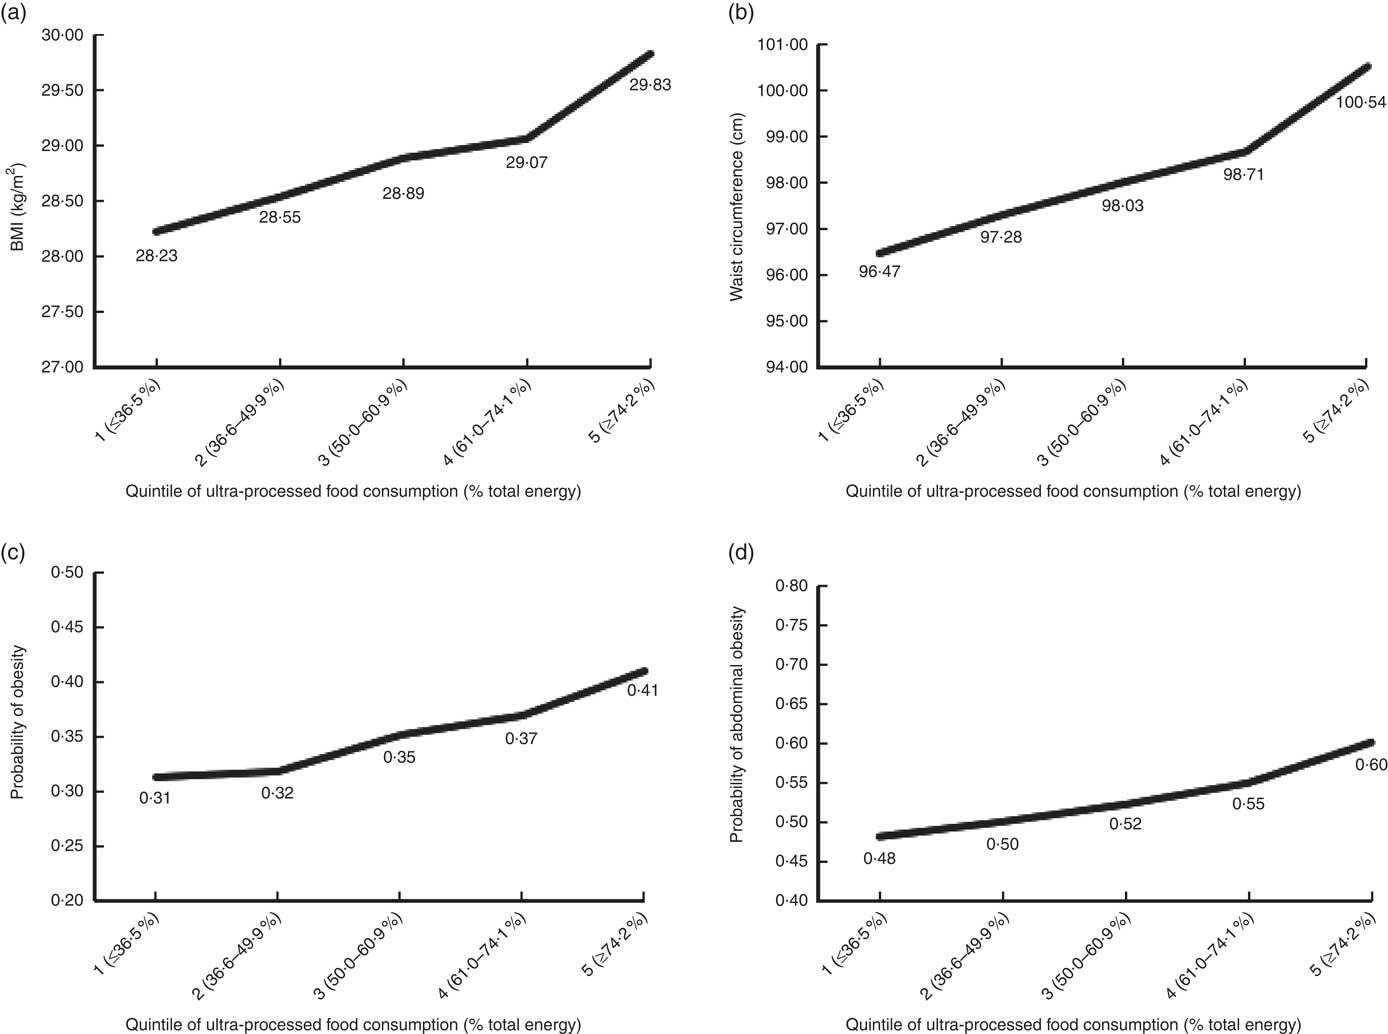
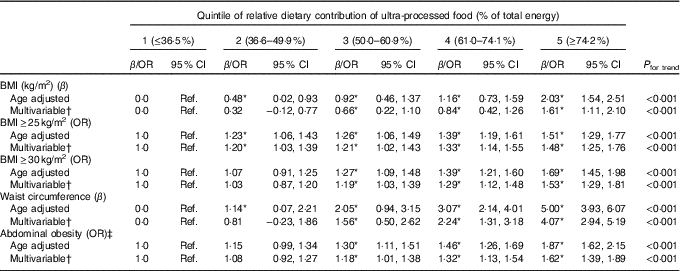
Table 2 shows that consumption of ultra-processed food was significantly associated with all outcomes in both age-adjusted and multivariable models adjusted for potential confounders. In multivariable analyses, the highest consumption of ultra-processed food (quintile 5; 74·2–100 % energy) was associated with 1·61 units higher BMI (95 % CI 1·11, 2·10), 4·07 cm greater WC (95 % CI 2·94, 5·19) and 48, 53 and 62 % higher odds of having a BMI≥25 kg/m2, BMI≥30 kg/m2 and abdominal obesity, respectively (OR=1·48; 95 % CI 1·25, 1·76; OR=1·53; 95 % CI 1·29, 1·81; and OR=1·62; 95 % CI 1·39, 1·89, respectively), compared with the lowest consumption (quintile 1; 0–36·5 % energy). A significant linear trend was observed for the association between quintile of ultra-processed food consumption and each outcome (P<0·001). Fig. 2 shows the multivariable-adjusted estimated margins for BMI, WC and probability of obesity and abdominal obesity according to quintile of ultra-processed food consumption at the means of all covariates. We obtained consistent results using Poisson regression. Multivariable-adjusted prevalence ratios of overweight/obesity, obesity and abdominal obesity in relation to ultra-processed food consumption are presented in the online Supplementary Table S1 of the online Supplementary material.

Fig. 2 Estimated mean (a) BMI, (b) waist circumference and probability of (c) obesity and (d) abdominal obesity according to quintile of relative dietary contribution of ultra-processed food (% of total energy), based on multivariable regression models. Predicted values are adjusted for all covariates of the multivariable models and estimated at the means of all covariates.
Table 2 Age-adjusted and multivariable analyses of the association between quintile of relative dietary contribution of ultra-processed food (% of total energy) and indicators of excess weight and abdominal obesity among adults aged 20–64 years in the National Health and Nutrition Examination Survey 2005–2014, n 15 977 (Linear regression coefficients (β)/odds ratios and 95 % confidence intervals)
Ref., reference group.
* P<0·05.
† Adjusted for age (years), sex, educational attainment (less than high school, high school degree/general equivalency diploma, some college, college graduate or above), race/ethnicity (Hispanic, Non-Hispanic White, Non-Hispanic Black, other race including multi-racial), ratio of family income:poverty, marital status (married, separated/divorced/widowed, never married) and smoking (never smoked, former smoker, current smoker) and physical activity level (low, medium, high).
‡ Defined as waist circumference ≥88/102 cm for women and men, respectively.
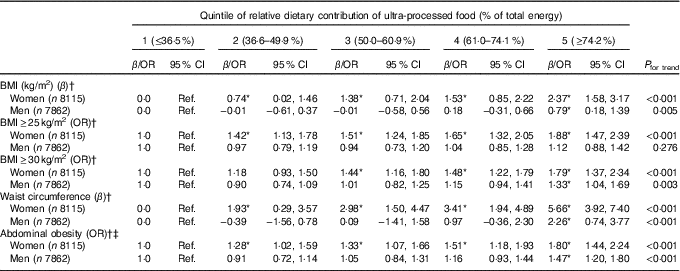
A significant interaction between being female and relative dietary contribution of ultra-processed food was observed for BMI (F 4,79=4·89, P=0·002), WC (F 4,79=3·71, P=0·008) and overweight (F 4,79=5·35, P<0·001), but not obesity and abdominal obesity. Compared with women in the lowest quintile of ultra-processed food consumption, women in the second to fifth quintile had significantly higher BMI, WC and odds of being overweight and having abdominal obesity (Table 3). Women in the third to fifth quintile had significantly higher odds of being obese compared with women in the first quintile. In contrast, associations between ultra-processed food consumption and BMI, WC and odds of obesity and abdominal obesity were only significant for men in the top compared with the lowest quintile of consumption, and no association was observed for odds of overweight. Compared with the lowest quintile of relative intake of ultra-processed food, being in the top quintile was associated with 2·37 units higher BMI among women and only 0·79 units higher BMI among men (β=2·37; 95 % CI 1·58, 3·17 and β=0·79; 95 % CI 0·18, 1·39, respectively). Similarly, the coefficient for WC was considerably higher for women compared with that in men in the top quintile of consumption (β=5·66; 95 % CI 3·92, 7·40 and β=2·26; 95 % CI 0·74, 3·77, respectively). No significant interaction was observed for ultra-processed food consumption and age or age group.
Table 3 Sex-stratified multivariable analyses of the association between quintile of relative dietary contribution of ultra-processed food (% of total energy) and indicators of excess weight and abdominal obesity among adults aged 20–64 years in the National Health and Nutrition Examination Survey 2005–2014, n 15 977 (Linear regression coefficients (β)/odds ratios and 95 % confidence intervals)
Ref., reference group.
* P<0·05.
† Adjusted for age (years), sex, educational attainment (less than high school, high school degree/general equivalency diploma, some college, college graduate or above), race/ethnicity (Hispanic, Non-Hispanic White, Non-Hispanic Black, other race including multi-racial), ratio of family income to poverty, marital status (married, separated/divorced/widowed, never married) and smoking (never smoked, former smoker, current smoker) and physical activity level (low, medium, high).
‡ Defined as waist circumference ≥88/102 cm for women and men, respectively.
We accounted for energy adjustment in multiple ways. Including total energy intake as a confounding variable, stratifying the sample by energy intake or treating relative dietary contribution of ultra-processed foods as a continuous variable did not meaningfully change our results (data not shown).
Discussion
In this large, nationally representative sample of US adults, higher consumption of ultra-processed food was associated with greater BMI, WC and odds of overweight, obesity and abdominal obesity. Although consumption of ultra-processed food was directly associated with excess weight and abdominal obesity in both sexes, the association was more pronounced among women.
The findings of the present study are supported by previous research suggesting an association between relative intake of ultra-processed food and excess weight( Reference Louzada, Baraldi and Steele 16 – Reference Canella, Levy and Martins 18 ), with potential differences between sexes( Reference Louzada, Baraldi and Steele 16 ). Louzada et al. ( Reference Louzada, Baraldi and Steele 16 ) observed a significant association between the share of total energy intake from ultra-processed food and BMI, overweight and obesity in a cross-sectional study of 30 243 individuals aged ≥10 years in Brazil. However, the association between ultra-processed food consumption (% energy) and excess weight was only significant among women in sex-stratified analyses( Reference Louzada, Baraldi and Steele 16 ).
The reasons for the observed sex differences are unclear but may be influenced by sex-related differences in food choices. In the present study, women on average, as compared with men, consumed a higher percentage of daily energy intake in the form of high-sugar ultra-processed foods such as cakes, cookies and pies (P=0·016); ice cream and frozen yogurt (P=0·015); ready-to-eat-desserts (<0·001); sweet snacks (<0·001); and milk-based sweet drinks (<0·001). Men, on the other hand, had higher relative intakes of savoury ultra-processed foods such as ultra-processed meat products (P<0·001), potato products such as chips and French fries (P=0·038) and frozen pizza (P=0·01), but also regular soda (P<0·001). As a result, women had higher average relative intakes of carbohydrates (49·6 v. 47·5 % of total energy; P<0·001) and total sugars (22·4 v. 20·9 % of total energy, P<0·001) (results not shown).
An accumulating body of evidence indicates that foods with high glycaemic index and glycaemic load may have more harmful metabolic effects and influence adiposity to a greater extent among women than among men( Reference Mirrahimi, Chiavaroli and Srichaikul 37 – Reference Youn, Woo and Cho 39 ). Therefore, it can be hypothesised that a higher intake of sugary foods and refined carbohydrates, in combination with a greater sensitivity to the hyper-glycaemic effects of these foods, is contributing to the stronger association between ultra-processed foods and excess weight and abdominal obesity among women. As we observed an association between ultra-processed foods and BMI and WC only among the highest quintile of ultra-processed food consumption among men (consuming ≥74·2 % energy from ultra-processed foods), it can be speculated that higher consumption levels are necessary to influence body weight and abdominal obesity among men than among women.
Ultra-processed foods may contribute to weight gain through their nutritional profile, by displacing low-energy nutrient-dense unprocessed and minimally processed foods from the diet, and by promoting poor dietary habits( Reference Moubarac, Parra and Cannon 1 – Reference Moubarac, Martins and Claro 3 ). The convenience, omnipresence, affordability, large portion sizes and aggressive marketing of ultra-processed food promotes constant snacking and involuntary over-eating, and may dislocate less processed, more nutritious foods from the diet( Reference Moubarac, Parra and Cannon 1 – Reference Moubarac, Martins and Claro 3 ). Ultra-processed products may also facilitate over-eating as they are less satiating than less processed foods( Reference Fardet 40 ). The high-intensity flavouring resulting from high levels of fat, salt, sugar and artificial flavourings make ultra-processed products extremely palatable, for which endogenous satiety mechanisms may be superseded( Reference Ludwig 31 ). In addition, ultra-processed foods are, on average, more energy-dense than unprocessed and minimally processed foods and culinary preparations based on minimally processed foods( Reference Moubarac, Parra and Cannon 1 , Reference Monteiro, Moubarac and Cannon 2 ). As human satiety mechanisms are more sensitive to volume than energetic content, foods with higher energy density may facilitate excessive energy intakes( Reference Rolls 41 ).
Beyond nutrient composition, greater deconstruction of the original food matrix, as occurs in processing, has been associated with lower satiety and higher glycaemic response( Reference Fardet 40 ). Ultra-processed foods were found to be significantly less satiating and more hyper-glycaemic than minimally processed foods in an experimental study of ninety-eight food items( Reference Fardet 40 ). Finally, food structure and fibre content of the diet influence the gut microbiomic profile and integrity, with potential important implications for body weight and adiposity( Reference Wahlqvist 42 ). The gut microbiota is altered in obesity, and evidence from both human and animal studies suggests that the gut microbiota effects energy harvest, energy homoeostasis and lipid accumulation of the host, although the biological mechanisms are not completely understood( Reference Boulange, Neves and Chilloux 43 ).
To our knowledge, this is the first study to examine the association between consumption of ultra-processed food, defined per NOVA, and excess weight in a national population of the USA. The use of NOVA is a key strength of the study as it enabled food-processing level to be determined according to standardised and objective criteria. NOVA has been recognised as a valid tool for public health and nutrition research and policy by the FAO of the United Nations( 44 ) and the Pan American Health Organization( 45 ). The high-quality design and methodology of NHANES is another important strength of the present study. Importantly, dietary intakes are assessed with a sufficient level of detail to enable determination of processing level. The dietary data also allowed for the disaggregation of dishes into their constituents and classification of the underlying ingredients, which enabled the calculation of more precise estimates of intakes of each NOVA group and reduced the risk of misclassification. Finally, as NHANES is nationally representative, the external validity of the findings is high.
Some limitations should be noted. Owing to the cross-sectional nature of the data, temporality and causality cannot be established and reverse causality cannot be excluded. However, consumption of ultra-processed foods was significantly associated with incident overweight and obesity in the prospective Spanish SUN study, thereby showing a linkage between the consumption of ultra-processed foods and subsequent, excess weight( Reference Mendonca, Pimenta and Gea 17 ). As is common in nutritional epidemiologic studies, dietary assessment by 24-h recall provides an imperfect measure of diet, and foods consumed on the assessment day may not be representative of usual diet. However, the AMPM is a validated method for dietary data collection that has been shown to reduce bias in dietary data collection( Reference Moshfegh, Rhodes and Baer 26 , Reference Blanton, Moshfegh and Baer 27 ).
Using relative consumption as the exposure variable attenuates the effect of total energy intake and mitigates bias introduced by misreporting as long as individuals misreport energy intake from all foods to the same extent. Nevertheless, research suggests that individuals may be more likely to under-report foods considered unhealthy, including ultra-processed foods such as confectionery, pastries and French fries, compared with minimally processed foods such as vegetables( Reference Lafay, Mennen and Basdevant 46 ). However, if obese individuals are more likely to under-report consumption of ultra-processed foods, the association would be biased towards the null. Finally, misclassification of foods cannot be excluded, as it was not always possible to determine NOVA group with certainty owing to insufficient information. We used a conservative approach, such that the lower level of processing was always assigned in case of uncertainty. Potential bias arising from misclassification would therefore lead to underestimation of ultra-processed food consumption and would not necessarily affect the association between ultra-processed foods and excess weight. Despite potential underestimation of the exposure, we observed a strong association between ultra-processed food consumption and excess weight and abdominal obesity, which is biologically plausible and consistent with the existing literature.
To date, little attention has been paid to the potential role of food processing in excess weight and adiposity. In recent years, nutrition research and dietary guidelines have increasingly focused on dietary patterns and food groups such as fruits, vegetables and whole grains, rather than just nutrients. Nevertheless, except for processed meat, the form in which foods are consumed and how they have been processed is generally not addressed( Reference Fardet, Rock and Bassama 47 ). In consequence, individual foods with diverse characteristics are often categorised within the same exposure group in nutritional studies; for example both brown rice and sugary and artificially flavoured whole-wheat breakfast cereals may count towards whole-grain consumption. This approach probably limits the ability to differentiate foods with beneficial and hazardous health effects owing to processing and may lead to inconsistent and contradictory findings( Reference Fardet, Rock and Bassama 47 ). Similarly, recommendations to consume certain food groups without specifying processing level may not provide sufficient guidance to allow consumers to make healthful choices. For example, recommendations to consume more vegetables do not distinguish between fresh vegetables and instant vegetable soups, which are generally high in Na. Conversely, the classification of foods according to level of processing enables the identification of food groups with similar characteristics, nutritional quality and potential health effects. Importantly, NOVA takes into account that both the nutritional (e.g. chemical additives, macronutrient and micronutrient content) and non-nutritional attributes (e.g. mode of consumption, marketing) of foods may affect eating behaviour, nutritional quality and health outcomes.
Conclusion
Our findings suggest that ultra-processed foods may contribute to the high rates of excess weight and abdominal obesity in the USA. This study makes an important contribution to the literature as the first study to investigate this association in a US setting, confirming findings from Brazil, France and Spain. Given the unprecedented rates of obesity worldwide( Reference Ng, Fleming and Robinson 48 ), it is crucial to further elucidate the role of ultra-processed foods in the development of excess weight and adiposity. Moreover, studies are needed to improve our understanding of the biological, social or cultural drivers of potential sex differences. Enhanced knowledge regarding the influence of food-processing level on excess weight has potential implications for food production businesses, one of the fastest-growing industries. These results, if furthermore confirmed in longitudinal studies, raise the question of whether specific recommendations to distinguish ultra-processed from moderately and minimally processed foods should be included as an extension of the food-based US dietary recommendations. In clinical practice level, a better comprehension of the associations between food processing and excess weight may aid in individual dietary guidance and weight management strategies.
Acknowledgements
This research received no specific grant from any funding agency or from commercial or not-for-profit sectors. While the present study was unfunded, the initial work of C. A. M. and E. M.-S. to classify the NHANES dietary data according to NOVA was supported by the Sao Paulo Research Foundation (FAPESP) grant number 2015/14900-9.
F. J. and V. W. C. developed the overall research plan and designed the statistical analyses within the existing data set; F. J. performed the statistical analyses and took the lead in writing the manuscript; E. M.-S. and F. J. classified the dietary data into the primary exposure variable; E. M.-S. aided in the statistical analyses and interpretation of the data and revised the manuscript for critical intellectual content; N. P. provided expertise regarding statistical analyses as it pertains to nutritional epidemiology and revised the manuscript for important intellectual content; C. A. M. developed and defined the NOVA classification that was used in the present study, provided guidance regarding the classification of the dietary data and revised the article for critical intellectual content; V. W. C. participated in the analysis and interpretation of data, revised the manuscript for important intellectual content, and oversaw the entire study. All authors approved the final manuscript and take full responsibility for the final content.
The authors declare that there are no conflicts of interest.
Supplementary material
For supplementary material/s referred to in this article, please visit https://doi.org/10.1017/S0007114518001046