


Waist-to-height ratio (WHtR) is a proxy for central (visceral) adipose tissue(Reference Ashwell, Cole and Dixon1–Reference Swainson, Batterham and Tsakirides4). It has recently received attention as an indicator of ‘early health risk’. Several systematic reviews and meta-analyses of data in adults of all ages(Reference Lee, Huxley and Wildman5–Reference Correa, Thume and De Oliveira8) and in children and adolescents(Reference Lo, Wong and Khalechelvam9,Reference Ochoa Sangrador and Ochoa-Brezmes10) have supported the superiority of WHtR over the use of BMI and waist circumference (WC) in predicting early health risk. More than 20 years ago, a boundary value of WHtR 0·5 was first suggested as a risk assessment tool and this translates into the simple message ‘keep your waist to less than half your height’(Reference Ashwell, Cole and Dixon1,Reference Hsieh and Yoshinaga11–Reference Ashwell and Gibson13) . Studies in many populations have supported the premise that WHtR is a simple and effective anthropometric index to identify health risks in adults of all ages(Reference Ashwell, Gunn and Gibson6,Reference Savva, Lamnisos and Kafatos7,Reference Park, Choi and Lee14–Reference Kawamoto, Kikuchi and Akase25) and in children and adolescents(Reference Choi, Hur and Kang26–Reference Ejtahed, Kelishadi and Qorbani29). Not only does WHtR have a close relationship with morbidity, but also it has a clearer relationship with mortality compared with BMI(Reference Ashwell and Gibson13,Reference Schneider, Friedrich and Klotsche30) .
In relation to screening, two very large prospective studies in USA have shown that WHtR is better than BMI in predicting diabetes risk(Reference Lee, Keum and Hu31) in all adult age groups. Similar findings have been found in Korea(Reference Son, Kim and Park32). Further, prospective data from the Avon Longitudinal Study of Parents and Children (ALSPAC) in the UK have shown that WHtR in children aged 7–9 years predicts adolescent cardiometabolic risk better than BMI(Reference Graves, Garnett and Cowell33). In a comprehensive narrative review, Yoo(Reference Yoo34) concluded that ‘additional use of WHtR with BMI or WC may be helpful because WHtR considers both height and central obesity. WHtR may be preferred because of its simplicity and because it does not require sex- and age-dependent cut-offs’. In 2006, the National Institute for Health and Care Excellence (NICE) tried to overcome the limitation of BMI by suggesting that WC is measured alongside BMI(35). Public Health England then built on this suggestion to produce a comprehensive cross-classification ‘matrix’ to categorise risk(36). For simplicity and clarity, we will refer to this as the ‘matrix’ (see Box 1). NICE has recently published a surveillance document on obesity which includes a section on the ‘Identification and classification of overweight and obesity’(37). In relation to its previous clinical guidance on obesity (CG189), this notes new evidence and expert feedback indicating the superior discriminatory value of WHtR as an alternative measure of adiposity. We have previously used data from the UK National Diet and Nutrition Survey to show that, within the adult UK population, the use of a simple boundary value for WHtR (0·5) identifies more people at ‘early health risk’ than does the ‘matrix’, which is based on a combination of BMI and WC(Reference Ashwell and Gibson38). We have now used more recent data (2016) from the Health Survey for England (HSE)(39) to assist NICE by comparing the risk estimated by the ‘matrix’ with that estimated by WHtR.
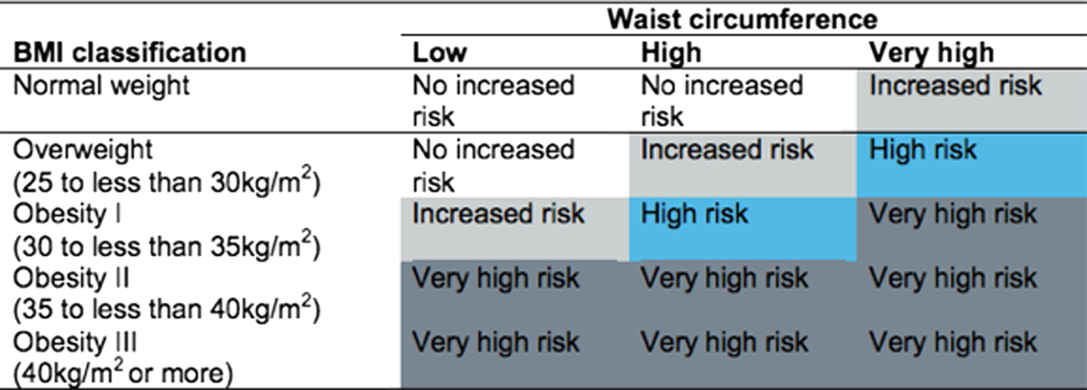
Categorisation by BMI and waist circumference (WC) – the ‘matrix’
Methods
Survey design and participants
The HSE 2016 sample comprised of a core general population sample of 9558 addresses selected at random in 531 postcode sectors, issued over 12 months from January to December 2016. Fieldwork was completed in March 2017. Where an address was found to have multiple dwelling units, one dwelling unit was selected at random. A total of 8011 adults (aged 16 years and over) and 2056 co-residing children were interviewed (household response rate 59 %), and about two-thirds of adults had a nurse visit for measurements of height and weight, blood pressure (BP) and waist and hip circumference. Nurses obtained written consent for sampling and sending results to general practitioners. Weight (in bare feet and minimal clothes) was measured to the nearest 100 g using calibrated scales. Height was measured with a portable stadiometer with the head in horizontal Frankfort plane. WC was measured with a standard tape measure to the nearest millimetre at the midpoint between the lower rib and the upper margin of the iliac crest. The measurement was taken twice, with a third taken if they differed by more than 3 cm. The mean of the two closest valid measurements was used in the analysis. Participants were excluded from waist measurements if they reported that they were pregnant, had a colostomy or ileostomy or were unable to stand. All those with measurements considered unreliable by the nurse, for example, due to excessive clothing or movement, were also excluded from the analysis. Adults were also asked to provide non-fasting blood samples for the analysis of total cholesterol and HDL-cholesterol and glycated Hb. Systolic BP (SBP) and diastolic BP were measured using a standard method (Omron; mean of three measurements). Full details of the HSE sampling design and procedures, response and weighting are given at https://files.digital.nhs./publication/m/3/hse2016-methods-text.pdfuk.
Statistical methods
Data and documentation were obtained from the UK Data Archive. Our analysis was based on adults aged 18 years and over with valid measurements for the combination of weight, height and WC. HbA1c, HDL-cholesterol, total/HDL-cholesterol, SBP and diastolic BP were used to represent cardiovascular risk factors; for high risk cut-offs, we used HbA1c of 48 mmol/mol and over; HDL-cholesterol < 1 mmol/l, total/HDL-cholesterol > 4 and for hypertension, we used the diagnostic criterion of SBP > 140 mmHg or diastolic BP over 90 mmHg or on antihypertensive medication. ANOVA was used to compare mean levels of risk factors across the tiers of anthropometric risk in separate models for WHtR and for the ‘matrix’. Logistic regression was used to assess the power of WHtR or ‘matrix’ to predict people at high risk; the area under the receiver operating characteristic curve was used to assess discrimination. Data were weighted to adjust for unequal selection and non-response to the nurse visit; percentages are based on weighted sample n of 4112. P < 0·05 (two-sided) was taken to indicate statistical significance.
Classification of respondents by anthropometric indicators (‘matrix’ of BMI and waist circumference and waist-to-height ratio)
The ‘matrix’ of WC and BMI (produced by Public Health England and NICE) categorises health risk as: ‘no increased risk’, ‘increased risk’, ‘high risk’ and ‘very high risk’, as shown in Box1(36). Underweight adults are unclassified, but for the purpose of the present study, they were counted as ‘no increased risk’.
To make the data manageable for analysis, we combined the ‘matrix’ categories of ‘increased risk’ and ‘high risk’ to obtain three tiers: Tier 0 ‘no increased risk’ (including underweight), Tier 1 ‘increased’/‘high risk’ and Tier 2 ‘very high risk’. WHtR was also classified into three tiers: Tier 0 ‘no increased risk’ (WHtR < 0·5), Tier 1 ‘increased risk’ (WHtR ≥ 0·5 and <0·6) and Tier 2 ‘very high risk’ (WHtR ≥ 0·6). The boundary value for Tier 1 (WHtR = 0·5) was suggested more than 20 years ago and is now used routinely to indicate the first level of risk for WHtR because of the wealth of data which has accrued to support it. The boundary value for Tier 2 (WHtR 0·6) is a pragmatic decision justified by many studies which show there is a linear association between WHtR and cardiometabolic risk factors.
Results
Table 1 shows participant characteristics, according to their classification under the WHtR criteria and matrix criteria. Both showed that higher risk adults were more likely to be older and on lower income. However, WHtR classified more women in the low risk tier (Tier 0), whereas the matrix showed no sex differential.
Participant numbers and characteristics in the Health Survey for England sample*
(Total number and percentage in each group)
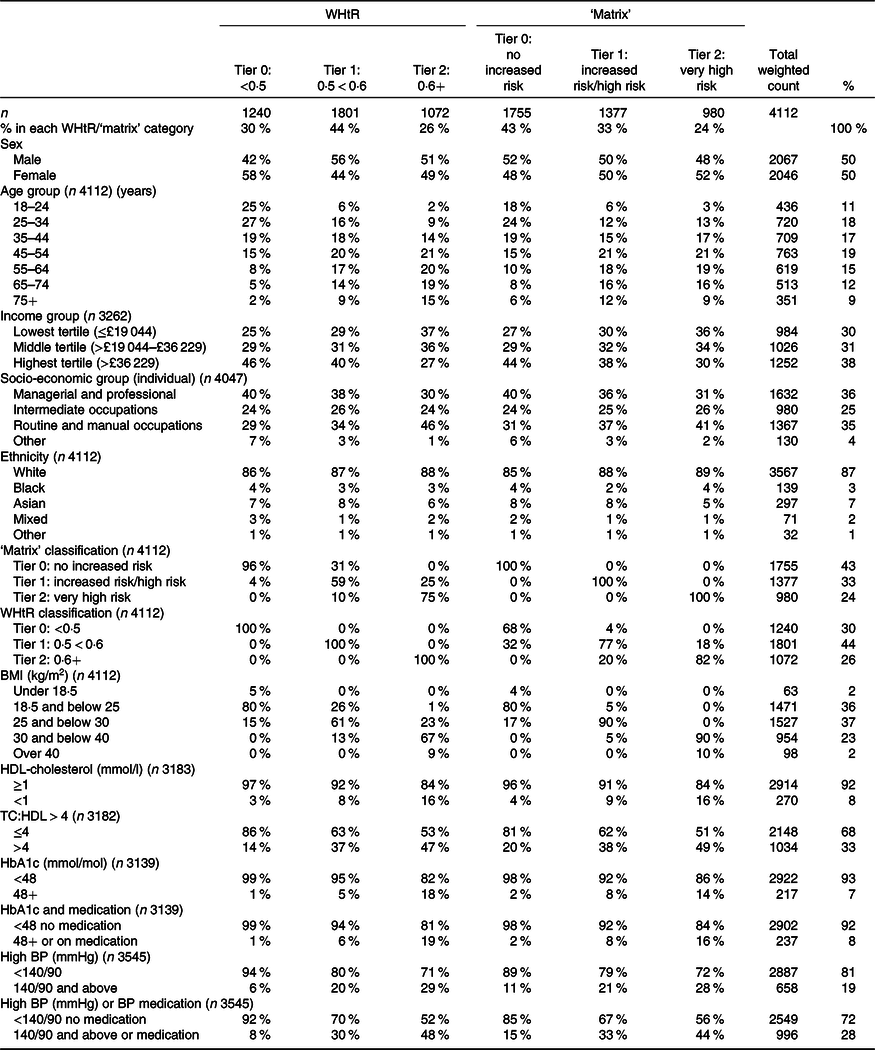
WHtR, waist-to-height ratio; TC, total cholesterol; BP, blood pressure.
* Adults aged 18 years and over including classification by WHtR and the ‘matrix’ tiers. Column percentages have been rounded to the nearest integer.
Classification of participants by anthropometric indicators
Table 1 shows that the ‘matrix’ categorised 43 % of the adults sampled as Tier 0 (‘no increased risk’), 33 % as Tier 1 (‘increased risk’ or ‘high risk’) and 24 % as Tier 2 or ‘very high risk’. By contrast, WHtR categorised the same population as 30 % ‘no increased risk’ (Tier 0), 44 % ‘increased risk’ (Tier 1) and 26 % as ‘very high risk’ (Tier 2). Compared with the ‘matrix’, WHtR put more participants in Tier 1 (44 v. 33 %) and fewer in Tier 0 (30 v. 43 %). This is because the ‘matrix’ underplays risk in normal BMI people with a moderately high WC (Box 1), many of whom have high WHtR.
Cross-classification of participants by anthropometric indicators
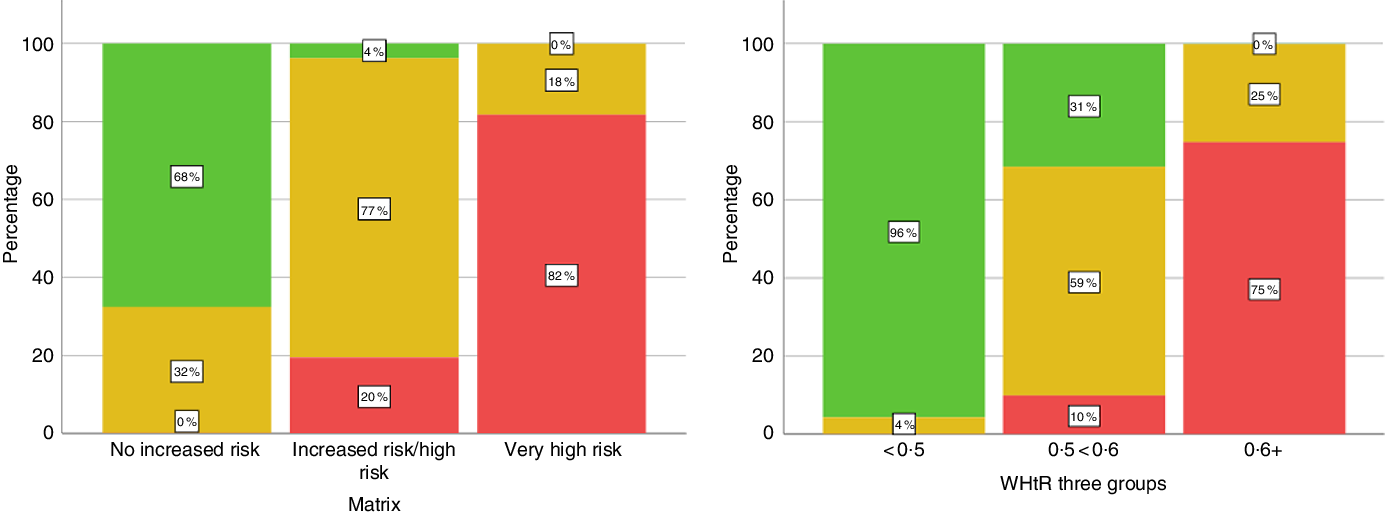
The cross tabulation in Table 1 shows that 32 % of the adult group who were judged to be at ‘no increased risk’ according to the ‘matrix’ had WHtR equal to or greater than 0·5. Conversely, 31 % judged at increased risk (Tier 1) according to WHtR were classified as Tier 0 (‘no increased risk’) by the ‘matrix’. This cross classification is illustrated graphically in Fig. 1.
Cross-classification of subjects by waist-to-height ratio (WHtR) and the ‘matrix’. Matrix = ‘matrix’ based on BMI and waist circumference. ‘No increased risk’ includes unclassified (underweight) adults. Percentages refer to the proportion of individuals in each group (x-axis). Total 4112, data are weighted. Numbers in Matrix categories: no increased risk = 1755; increased risk/high risk = 1379; very high risk = 980. Numbers in WHtR groups: <0·5 = 1240; 0·5 < 0·6 = 1801; 0·6+ = 1072.
Waist-to-height ratio is a better indicator of cardiometabolic risk factors than the ‘matrix’
Table 2 shows the mean values with their standard errors of the cardiometabolic risk factors by risk tier. WHtR was a stronger predictor than the ‘matrix’ in models for HbA1c and SBP, as indicated by higher F values in ANOVA (Table 2). Mean values of HbA1c between highest and lowest risk tiers differed by 7·2 mmol/mol for WHtR compared with 5·2 mmol/mol for the ‘matrix’; the difference in SBP was 12 mmHg for WHtR compared with 9 mmHg for the ‘matrix’ (Table 2). For total and HDL-cholesterol and diastolic BP, there was little difference between the indicators. Results are shown without adjustment for covariates, in order to compare the anthropometric indicators as they might be used in primary assessment. However, adjustment for age and sex slightly attenuated the effect sizes for both WHtR and the ‘matrix’ to a similar extent (data not shown).
HbA1c, HDL-cholesterol and systolic blood pressure (SBP), by risk tier of anthropometric indicators: waist-to-height ratio (WHtR) and the ‘matrix’
(Mean values with their standard errors)
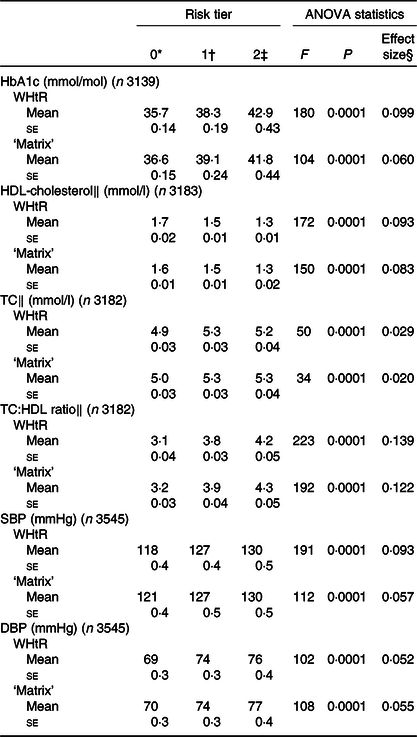
TC, total cholesterol; DBP, diastolic blood pressure.
* Risk tier 0 = WHtR < 0·5 or ‘no increased risk’ in ‘matrix’.
† Risk tier 1 = WHtR 0·5 < 0·6 or ‘increased/high risk’ in ‘matrix’.
‡ Risk tier 2 = WHtR 0·6+ or ‘very high risk’ in ‘matrix’.
§ Partial Eta squared or proportion of variance explained (0·1 = 10 %).
‖ Includes adults on lipid-lowering medication.
Logistic regression was used to assess how well each of the two anthropometric indicators predicted raised HbA1c (≥48 mmol/mol), low HDL-cholesterol (<1 mmol/l), high total/HDL-cholesterol (>4) and overall hypertension (BP > 140/90 mmHg or on medication).
Table 3 shows that WHtR had a higher predictive value than the ‘matrix’ for raised HbA1c, high total/HDL-cholesterol and hypertension, based on the percentage of variance explained (14–16 % for WHtR v. 6–12 % for matrix) and higher OR. For low HDL-cholesterol, both classifications explained about 6 % of the variance.
Logistic regression models showing odds of high level of risk factors, as predicted by waist-to-height ratio (WHtR) or the ‘matrix’*
(Odds ratios and 95 % confidence intervals)
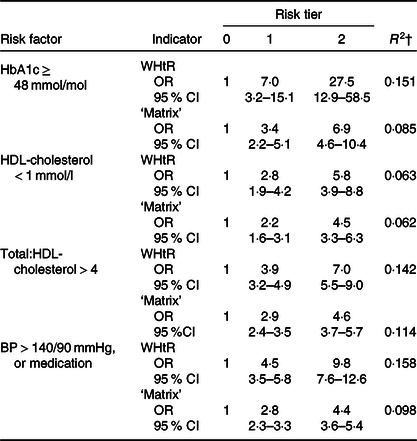
BP, blood pressure.
* Percentage of adults at risk: HbA1c 48 mol/mol and over (7·4 %) (total n 3139); HDL-cholesterol < 1 mmol/L (8·5 %) (total n 3183); total:HDL-cholesterol >4 (33 %) (total n 3182) BP > 140/90 mmHg or on medication (28·1 %) (total n 3544).
† R 2 (Nagelkerke) = proportion of variance explained by the indicator.
These findings were confirmed in a receiver operating characteristic analysis based on all five categories of the ‘matrix’ v. three categories for WHtR. The AUC was greater with WHtR than with the ‘matrix’, for raised HbA1c (0·75 v. 0·69) and hypertension (0·68 v. 0·65). AUC were nearly identical on both indicators for low HDL (0·66) and total/HDL-cholesterol (0·65) (see Table 4).
AUC (receiver operating characteristic analysis) for models based on waist-to-height ratio (WHtR) and the ‘matrix’
(Mean values, with lower and upper 95 % confidence limits)
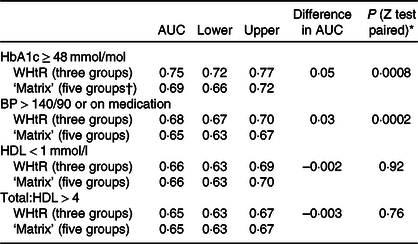
* All five categories of the matrix were used in receiver operating characteristic analysis (‘not applicable’/underweight, ‘no increased risk’, ‘increased risk’, ‘high risk’ and ‘very high risk’).
† Calculated according to the method of Hanley et al.(Reference Hanley and McNeil40) for comparing AUC on the same subjects.
Underestimation of cardiometabolic risk is greater using the ‘matrix’ than waist-to-height ratio
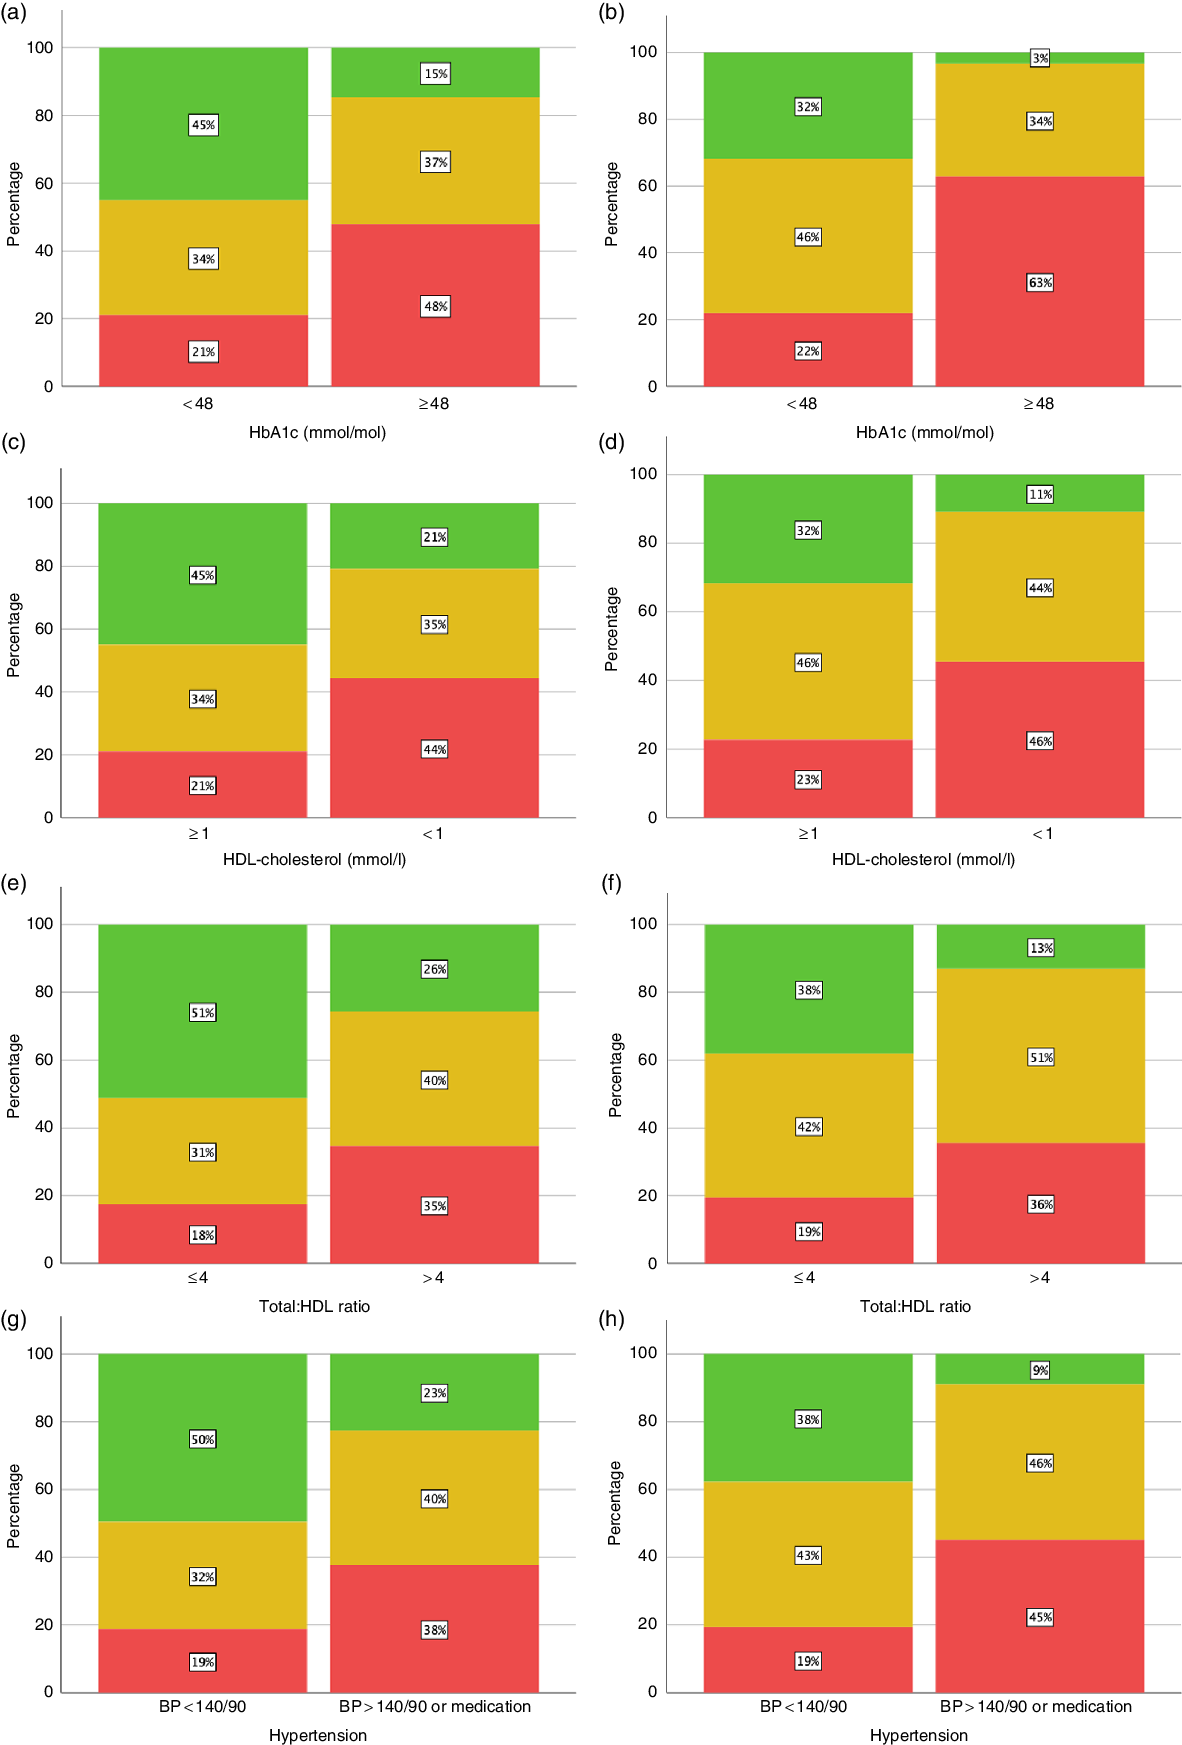
Fig. 2 shows that Tier 0 of the ‘matrix’ (no increased risk) was most likely to underestimate the actual risk. One in seven adults (15 %) with raised HbA1c would have been judged as at ‘no increased risk’ using the ‘matrix’, compared with only 3 % using WHtR < 0·5. Similarly, for hypertension (BP > 140/90), 23 % of those with hypertension would have been judged as ‘no increased risk’, compared with 9 % missed using WHtR. For low HDL-cholesterol and high total/HDL-cholesterol, about twice as many were missed using the ‘matrix’ than using WHtR.
Proportion of subjects at normal and high risk for cardiometabolic risk factors (HbA1c, HDL-cholesterol, total/HDL-cholesterol and hypertension). Classification by categories of anthropometric index (‘matrix’ and waist-to-height ratio (WHtR)). (a) HbA1c by ‘matrix’ (n 3139). (b) HbA1c by WHtR (n 3139). (c) HDL-cholesterol by ‘matrix’ (n 3183). (d) HDL-cholesterol by WHtR (n 3183). (e) Total/HDL-cholesterol by ‘matrix’ (3182). (f) Total/HDL-cholesterol by WHtR (n 3182). (g) Hypertension by ‘matrix’ (n 3545). (h) Hypertension by WHtR (n 3545). Matrix:  , no increased risk;
  , increased risk/high risk;
  , very high risk. WHtR three groups: , <0·5; , 0·5 < 0·6; , 0·6+. BP, blood pressure (mmHg).
Discussion
Principal findings
Among adults surveyed in the HSE 2016, important cardiometabolic risk factors representing glycaemia, dyslipidaemia and hypertension were more strongly associated with anthropometric classification using the simple cut-off for WHtR than with the ‘matrix’. Prevalence data showed that nearly one-third of the ‘no increased risk’ group in the NICE ‘matrix’ had WHtR ≥ 0·5 and could therefore be under-diagnosed for cardiometabolic risk.
Comparison with analyses of previous UK data
These findings support previous studies(Reference Ashwell and Gibson38,Reference Gibson and Ashwell41,Reference Ashwell and Gibson42) where we showed that men and women with a BMI in the ‘healthy’ range but WHtR ≥ 0·5 had increased levels of cardiometabolic risk factors, not only when compared with participants with ‘healthy’ BMI and WHtR < 0·5, but also when compared with overweight participants (BMI > 25 kg/m2) with low WHtR < 0·5. In the present study, we suggest that the ‘matrix’ underperforms compared with WHtR because it considers individuals with moderately high WC (80–88 cm for women, 94–102 cm for men) not to be at risk unless they are also overweight.
Normal weight central obesity
Our results support other data showing that normal weight central obesity (NWCO) is linked with cardiometabolic risk. NWCO is usually defined on the basis of BMI and WC measurements. Participants with NWCO show increased morbidity in relation to cardiometabolic risk greater than those in normal weight people without central obesity(Reference Batsis, Zbehlik and Scherer43,Reference Owolabi, Ter Goon and Adeniyi44) . Further, their mortality is also increased as shown in several studies(Reference Sharma, Batsis and Coutinho45,Reference Hamer, O’Donovan and Stensel46) . Others diagnose NWCO from BMI and WHtR and have shown that it can be associated with increase morbidity(Reference Thaikruea and Thammasarot47–Reference Liu, Ma and Lou50) and increased mortality(Reference Coutinho, Goel and Correa de Sa51,Reference Sahakyan, Somers and Rodriguez-Escudero52) . The extent of NWCO in UK has previously been estimated as nearly one-third of the adult population, based on those in normal BMI range with WHtR > 0·5(Reference Ashwell and Gibson42). Results of the present study show that even when WC is taken into account, more than 30 % of the participants in the ‘no increased risk’ category (based on the ‘matrix’) have WHtR > 0·5.
We are only aware of one other country where risk identified by WHtR has been compared with ‘matrix’ based on BMI and WC. The New Zealand Ministry of Health showed from their National Survey data that WHtR 0·5 classified more people, particularly men, as being at ‘early increased risk’ compared with the ‘matrix’. WHtR is a measure that is reported on by the Ministry of Health in its annual reports(53).
Practicality of measuring waist circumference
In general, WC is measured at one of the two places: either halfway between the iliac crest and the lower rib (WHO method) or at the umbilical level, just above the right iliac crest at the mid-axillary line. However, measurements of WHtR by either protocol similarly estimated current and prospective cardiometabolic risk biomarkers among youth with recently diagnosed diabetes(Reference Kahn, Divers and Fino54).
Implications for screening
There is good evidence from around the world that screening for WHtR could prevent the metabolic implications of misdiagnosis by BMI alone in children(Reference Khoury, Manlhiot and McCrindle15,Reference Cho, Kim and Lee55) , adolescents(Reference Mokha, Srinivasan and Dasmahapatra56,Reference Frayon, Cavaloc and Wattelez57) and adults(Reference Ashwell, Gunn and Gibson6,Reference Ashwell and Gibson13,Reference Lam, Koh and Chen58) . Further, recent reports from the US Army(Reference Bernstein, Lo and Davis59) and US Air Force(Reference Griffith, White and Fass60) have recommended screening of body fat and cardio fitness in military personnel using WHtR instead of other anthropometric measures.
Very simple screening based on waist-to-height ratio 0·5: the ‘String Test’
Although many authors have produced specific WHtR boundary values for populations(Reference Dong, Wang and Chu24,Reference Jiang, Dou and Xiong27,Reference Yang, Xin and Feng61,Reference Gu, Li and He62) , many suggest that the simple boundary value of 0·5 can be used to indicate increased risk and used universally for primary screening(Reference Ejtahed, Kelishadi and Qorbani29). Since it was first advocated in 2006(Reference McCarthy and Ashwell63), the simple message ‘Keep your waist to less than half your height’ has been recommended often(Reference Kazlauskaite, Avery-Mamer and Li20,Reference Yoo34,Reference Garnett, Baur and Cowell64–Reference Kuba, Leone and Damiani66) . More recently, the ‘Ashwell® String Test’(Reference Ashwell67), which can broadly assess if the WHtR is below 0·5, even without a tape measure, has been suggested. This simple method is currently Government policy in Thailand(Reference Thaikruea and Yavichai18).
Central obesity is increasing; screening is needed
Many studies have shown that the prevalence of high WC in adults has increased over time. In England, mean WC has risen from 93 to 98 cm in men and from 82 to 89 cm in women from 1993 to 2017(36). WC has increased more rapidly than BMI in adolescents(Reference Mindell, Dinsdale and Ridler68), and future predictions are that this gap will widen further(Reference Shaw, Retat and Brown69) reflecting the increase in central, rather than total, obesity. Studies in China and Australia have shown there to be an acceleration in the prevalence of NWCO even without a corresponding increase in BMI(Reference Song, Li and Bu22,Reference Li, Ford and Mokdad70,Reference Hardy, Mihrshahi and Gale71) . The time has surely come to include routine screening for central obesity.
In terms of cost-effectiveness, measuring BMI requires weighing scales as well as stadiometer for measuring height. WHtR only requires a tape measure, making use of WHtR more cost-effective. For the simplest dichotomous assessment (WHtR above 0·5), a piece of string is sufficient(Reference Ashwell67).
Strengths and limitations of our study
Strengths
The use of the WHtR addresses a current dilemma of how to best identify ‘early health risk’ with a very simple, low-cost, anthropometric measure. This UK study provides further evidence for NICE to consider regarding alternative measures of adiposity.
HSE is designed to be nationally representative of the population in England. The method includes assessment for a range of cardiovascular risk factors, including blood lipids and BP, which were investigated in our study. The anthropometric data are highly reliable (measured not self-reported).
There are no studies comparing the predictive value of the ‘matrix’ v. other anthropometric indicators. This paper highlights a potential problem with the existing ‘matrix’ (i.e. underestimating risk in normal BMI adults with moderate raised WC) and provides evidence that WHtR would provide better accuracy and simplicity.
The predictive value of WHtR is backed by systematic reviews and meta-analyses in many different populations. Prospective studies are also supportive.
WC measurement is not difficult to do and could be done by the subject.
The simple cut-off WHtR > 0·5 may be particularly valuable as an indicator of ‘early health risk’, even in adults in the normal BMI range.
Limitations
Causality between anthropometric indicators and risk factors cannot be inferred from observational data. Body weight and body shape are plausible causes or mediators of higher levels of risk factors, but other genetic or environmental factors may affect both anthropometric indices and risk markers in tandem.
The sample is restricted to households in England in 2016. Other datasets could be used to test the reproducibility and generalisability of our conclusions.
WC measurement may be a sensitive issue for some people and may be less precise than height or weight. However, it is a proven risk indicator, hence its inclusion in guidelines for assessment and monitoring of obesity.
Further studies need to address the efficiency of using WHtR as an alternative to the ‘matrix’ in primary care, and its value as a public health message for all ages.
Conclusions
Although BMI, WC and WHtR are, by their very nature, strongly correlated(Reference Molarius and Seidell72,Reference Ashwell and Gibson73) , the more important question is which anthropometric proxy measure is the simplest and most accurate in helping to indicate early cardiometabolic risk?
WHtR is a simple primary screening risk assessment tool that identifies more people at ‘early health risk’ than the current method of assessing risk, the ‘matrix’, which uses a combination of BMI and WC. We recommend that the ‘matrix’ be amended to show that having a high WC even in the ‘healthy’ range of BMI, carries ‘increased’ risk. Further, we believe that serious consideration should be given to the use of the simple cut-off WHtR 0·5 to replace the ‘matrix’.
Of course, any anthropometric measure is only the first step in identifying people at ‘early health risk’. More complex scores (e.g. for diabetes) include further risk factors such as sex, age, ethnicity, socio-economic status and family history. Further screening for clinical risk factors should follow for those deemed at risk by these simpler measures.
Our results lend support to the opinion that clinicians should look beyond BMI. Although assessing for total fat mass with BMI to identify patients at greater cardiovascular risk is a good start, it is not sufficient(Reference Poirier74). It is therefore timely that, in UK, NICE intends to investigate the potential use of WHtR(37).
Acknowledgements
This research received no specific grant from any funding agency, commercial or not-for-profit sectors.
Both authors conceived the article and drafted the manuscript. S. G. analysed data from the HSE. Both authors agreed the final manuscript.
The authors declare no financial competing interests. M. A. devised and copyrighted the Ashwell® Shape Chart which is distributed to health professionals on a non-profit-making basis.
Data sharing statement
All unpublished results from the study are available on request from the authors.


