

1. Introduction
The financial sustainability of pension reform refers to the ability of the public pension system to balance the contributions and the pension costs in the long run as the population is aging with the number of retirees growing relative to the number of workers.Footnote 1 For example, if the dependency rate is projected to double in the next decades, the share of transfers from the working age population to the elderly must double over the next decades for future pensioners to maintain their relative living standard. The 2024 Pension Adequacy report predicts that, based on the pension policies recently enacted in EU27 countries, the replacement rates (pension benefit relative to wage) are set to fall over the next four decades in most countries (see Figure 3 for average-earner retiring at the standard pensionable age). The focus on budget balance, as usually done, is important, but it should be complemented by a specific attention on the political sustainability, which is the capacity of future governments to implement budget-balanced pension policies that are also politically difficult as the bargaining power of retirees increases relative to the workers.
In this paper, following Barr and Diamond (Reference Barr and Diamond2009), we consider that pensions are not inherently sustainable or unsustainable, but they are rather dependent on political support for a successful adjustment of pension parameters over time. In that sense, we shift attention to the political sustainability of pensions subject to the budget balance constraint. We define the political sustainability of pension reforms as the continued ability of policymakers and stakeholders to negotiate a coherent set of pension scheme parameters capable of securing pension finance (Sorsa and van der Zwan, Reference Sorsa and van der Zwan2022). The key question we address is two-fold.
The first question is analytical. We study the optimal balance between benefit cut and contribution increase using a static bargaining game between workers and retirees subject to the budget balance constraint and retirement incentives. If bargaining power is fixed, the optimal sharing rule involves fixed-contribution, so that the full burden of aging is shifted to the elderly. However, when bargaining power varies with the share of retirees, the optimal sharing rule is a balance between contribution increase and benefit cut. An important aspect of our bargaining model is the retirement incentive. When bargaining over pension benefits and contributions, successive cohorts anticipate that a higher pension benefit will reduce labor force participation, which will feed back on the contribution rate via the budget balance requirement.Footnote 2 As a result, retirement elasticity is a crucial part of pension design (James (Reference James, Birdsall, Graham and Sabot1998); Börsch-Supan (Reference Börsch-Supan2000); Giesecke and Jäger (Reference Giesecke and Jäger2021)). In our bargaining model, the optimal pension benefit decreases with the retirement elasticity. There are two effects: (i) a direct cost effect of the pension benefit via the budget constraint, and (ii) an indirect effect of the pension benefit on early retirement and the resulting loss of income. As discussed in Appendix A, retirement incentives can also be seen as a potential migration risk, with workers moving in response to the pressures of an aging population and the corresponding contribution rates.
The second question is empirical. We calibrate the bargaining model to the 2021 Economic Policy Committee (EPC) projections of pension benefits and dependency rates for the period 2020-2050. From these projections, we deduce the implied bargaining power of workers and retirees that would make this pension benefit optimal, and we compare these bargaining weights to their respective demographic shares. The difference represents the democratic gap which we view as a political stress test for pension reforms. It helps assess whether policymakers will have the future capacity to maintain the legislated pension reforms, given the increasing influence of the elderly in the bargaining process. The strategy is similar to the inverse optimal tax approach, in which implicit social weights are the social welfare weights that rationalize the observed tax schedule as maximizing the social welfare function, given labor supply elasticities (Bourguignon and Spadaro, Reference Bourguignon and Spadaro2012). Our main finding is that, in many countries, the democratic gap is increasing over the period 2020-2050, and the gap is statistically significant. We complement the analysis from a different perspective with the benefit gap. The benefit gap is the difference between projected pension benefits and the optimal pension benefit, considering the evolution of bargaining power in relation to demographic shares. Our results show considerable variation in the benefit gap across countries, with the gap generally widening over time as the projected pension benefits fall below the optimal benefit in most countries.
We use a static bargaining model with no connection between workers’ contributions and their future pension benefits. In each period, workers aim to minimize their contributions, while retirees seek to maximize their pension benefits. This bargaining model highlights a key issue with pension systems: the lack of commitment. In theory, benefits are tied to past contributions, but in practice, workers know their current contributions while remaining uncertain about their future pension benefits. As suggested in Barr and Diamond (Reference Barr and Diamond2009), the conflict of interest across cohorts is compounded by a time-consistency issue with pension reforms. A policy that has been supported today by the current demographic structure might not receive enough support in the future as the demographic structure changes. Galasso and Profeta (Reference Galasso and Profeta2004) and Galasso (Reference Galasso2008) have argued that demographic dynamics may have opposite economic and political effects.Footnote 3 On the other hand, Automatic Adjustment Mechanisms (AAMs) and Automatic Balance Mechanisms (ABM) are used in two-thirds of OECD countries. According to Börsch-Supan (Reference Börsch-Supan2007), the intention is to secure financial sustainability gradually and isolate pension from ‘disruptive’ political intervention. Unfortunately, these automatic mechanisms do not provide guarantees against political intervention or reversal. Some automatic adjustment/erosion mechanisms are now under electoral pressure in Sweden and Germany. For instance, in Germany, the sustainability factor, which accounts for changes in the number of contributors relative to the number of pensioners, has been used to index the pension point value since 2005. Following OECD (2021), the sustainability factor is now projected to be negative, decreasing the adjustment of the pension point value by 0.5% per year until 2032.
There is a literature analyzing the importance of aging on election outcomes.Footnote 4 Lindert (Reference Lindert1994); (Reference Lindert1996), and Persson and Tabellini (Reference Persson and Tabellini2003) find a significant positive relationship between pension share and the share of the elderly by analyzing groups of countries. Lindert (Reference Lindert1994) estimates an elasticity of the pension share in GDP with respect to the share of the elderly larger than unity.Footnote 5 We contribute to existing research on political support for pension reforms focused on financial sustainability. This paper presents a stylized bargaining model between workers and retirees, considering that current cohorts negotiate pension contribution and benefit rates based on the dependency ratio, while being subject to the budget constraint.
Pension reforms involve a conflict of interest across cohorts. It is difficult for policymakers to design policies that can be agreed simultaneously by older and younger cohorts (Buti et al., (Reference Buti, Turrini, Van den Noord and Biroli2010); Leroux et al., (Reference Leroux, Pestieau and Racionero2011)). Kitao (Reference Kitao2014) show that younger cohorts prefer options to reduce benefits, but older cohorts prefer to finance the transition with payroll taxes. Baurin and Hindriks (Reference Baurin and Hindriks2022) show that younger cohorts prefer to limit pension benefits by restricting indexation, while older cohorts favor increasing worker contributions by reducing accrual rates. While the indexation reform can distribute the adjustment between workers and retirees (reducing the per capita cost), the majority of the population favors the accrual reform over the indexation reform. As a result, the burden of aging costs is shifted primarily onto the younger half of the population. (Baurin and Hindriks, Reference Baurin and Hindriks2022).
The structure of the paper is as follows. Section 2 introduces our static bargaining model between workers and retirees, along with analytical results that provide a foundation for our empirical analysis. Section 3 presents the EPC projections of the benefit rates and dependency rates, based on European Union (EU)-wide pension reforms (where the country-specific changes in the pensionable age or contribution period are reflected in changes to the dependency rate). Section 4 presents the political stress tests based on the democratic gap. Section 5 introduces the benefit gap as an alternative perspective on the political stress test. Section 6 offers an interpretation of the results, while Section 7 concludes with the main findings, limitations, and directions for future research.
2. The model
In this paper, we examine the political economy of pensions from a bargaining perspective. In an economy with overlapping generations of workers and retirees, the political process surrounding pension policy can be viewed as a bargaining process, where pension policy seeks to balance the conflicting interests of both groups.Footnote 6 In this context, we propose a model of generational bargaining between workers and retirees, based on Nash (Reference Nash1950).Footnote 7 Workers and retirees are assumed to be rational and share the same preferences for consumption. They must agree on how to distribute the economic surplus while adhering to the budget constraint. Our model captures the gradual shift in preferences of each group regarding the pension benefit and contribution rate as the relative size of each group changes.
2.1. Generational bargaining
At any time  $t$, the economy consists of two groups: workers with a normalized population of size 1 and retirees of size
  $D_t$ (so
  $D_t$ stands for the dependency rate: the ratio of retirees to workers). Workers at time
  $t$ supply labor at wage
  $w_t$ and pay a contribution rate
  $\tau_t$ on labor income. The retiree receives a pension benefit at rate
  $\delta_{t}$ of earnings
  $ w_t$.Footnote 8 Time is discrete. We consider a representative agent in each group. The equilibrium allocations are determined by a bargaining between the representative worker and the representative retiree with different bargaining powers. The model is static in that there is no connection (no commitment) between the current contributions of workers and their future pension benefits.(PAYG principles). Workers negotiate to reduce contributions, while retirees negotiate to increase pensions (with no link between the two). We normalize the disagreement point to zero surplus, and the existence of allocations that strictly Pareto dominate the disagreement point ensures a motivation to bargain.Footnote 9 The social security system is perceived as a social contract between generations that lasts as long as all generations participate. Sharing of the economic surplus is conditional on a balanced social security budget in each period.
Workers and retirees utilities are, respectively,
 \begin{equation*}
U_W=u((1-\tau_t)w_t),
\end{equation*}
\begin{equation*}
U_W=u((1-\tau_t)w_t),
\end{equation*} \begin{equation*}
U_R=u(\delta_tw_t)
\end{equation*}
\begin{equation*}
U_R=u(\delta_tw_t)
\end{equation*}and the pension budget constraint is
 \begin{equation*}
\tau_t=D_t \delta_t.
\end{equation*}
\begin{equation*}
\tau_t=D_t \delta_t.
\end{equation*} In a defined-benefit (DB) pension system, an increase in the dependency rate  $D_t$ — the ratio of retirees to workers — raises the financial burden on workers, as maintaining a fixed pension benefit requires higher contributions. Conversely, in a defined-contribution (DC) system, a rise in the dependency rate reduces the pension benefits received by retirees in order to sustain a constant contribution rate. Between these two extremes lies a spectrum of mixed policies, which balance adjustments to both contribution and benefit rates to accommodate changes in the dependency rate. Musgrave (1981) suggested to using the proportional sharing rule so as to maintain the Musgrave ratio fixed.Footnote 10 In the following analysis, we use the Musgrave ratio,
  $M=\frac{\delta_t}{1-\tau_t}$, — defined as the ratio of the benefit rate to the net wage — to illustrate how changes in the dependency rate are distributed between workers and retirees. Besides those adaptation policies to aging, there are also attenuation policies. In response to aging, many countries are changing the pensionable age or the contribution period. We interpret this retirement policy as an attenuation policy, as it aims to mitigate the impact of aging on the dependency ratio by requiring individuals to work longer. In the empirical section, country-specific changes in the pensionable age are incorporated into the projections of the dependency rate.
We denote by  $\theta_t$ the bargaining power of the workers seeking to maximize
  $U_W$; and
  $1-\theta_t$ is the bargaining power of the retirees seeking to maximize
  $U_R$. The two competing groups negotiate an agreement on the allocation of the economic surplus
  $w_t$.Footnote 11 We assume that the outcome of this negotiation is the Nash bargaining solution, where the solution depends on
  $\theta_t$,
  $U_W$, and
  $U_R$. We consider a stylized static model where both agents have the same utility function defined over income. Adopting different utility functions between retirees and workers would involve making an interpersonal utility comparison. We treat individuals as if they were all identical, sharing the same preferences as a representative member of society. This is a standard assumption in most analyses of optimal taxation and pensions within the overlapping generations model. We assume the representative agent in each group displays CRRA preferences.
 \begin{equation}
u(x) = \left\{\begin{aligned} \frac{x^{1-\alpha}}{1-\alpha}{\rm{ }} \quad for \quad {\rm{ }}\alpha \gt 0 \\
ln(x){\rm{ }} \quad for \quad {\rm{ }}\alpha =1 \end{aligned}
\right..
\end{equation}
\begin{equation}
u(x) = \left\{\begin{aligned} \frac{x^{1-\alpha}}{1-\alpha}{\rm{ }} \quad for \quad {\rm{ }}\alpha \gt 0 \\
ln(x){\rm{ }} \quad for \quad {\rm{ }}\alpha =1 \end{aligned}
\right..
\end{equation} The coefficient of relative risk aversion  $\alpha=-x\frac{u''(x)}{u'(x)}$ is constant, which is consistent with the empirical measure of risk aversion.Footnote 12
Another important aspect of the bargaining process is the retirement incentive. Generous pension benefits reduce incentives to work longer (Giesecke and Jäger, Reference Giesecke and Jäger2021). This is the ‘pension wealth effect’. When an individual decides to work one more year, s/he gives up one year of pension benefits and has to pay social security contributions for another year. If the pension benefits and contributory taxes are high, the pension system encourages early retirement.Footnote 13 To address these concerns, we consider that the dependency rate depends on the pension benefit rate  $D_t(\delta_t)$. We assume that pension generosity increases retirement incentives,
  $D_t'(\delta_t) \gt 0$.Footnote 14 We are now ready to solve the bargaining model over pension. We will distinguish between fixed and variable bargaining powers. Under fixed bargaining weights, an increase in the dependency rate shifts the allocation of resources between workers and retirees through the budget constraint and retirement incentives. With variable bargaining weights, an additional effect emerges, as the retirement incentives link benefits to bargaining weights, through the impact of benefit levels on the dependency rate.
2.2. Fixed bargaining power
Let us define the consumption of workers as  $c_t=(1-\tau_t)w_t$ and the benefit of retirees as
  $b_t=\delta_t w_t$. Under fixed bargaining power,
  $\theta_t=\theta$ for some
  $\theta \in (0,1)$, the generational bargaining problem can be represented as;
 \begin{equation*}
\max_{\delta_t\in (0,1)} u(c_t)^{\theta} u(b_t)^{1-\theta}
\end{equation*}
\begin{equation*}
\max_{\delta_t\in (0,1)} u(c_t)^{\theta} u(b_t)^{1-\theta}
\end{equation*} subject to the budget constraint  $\tau_t =D_t(\delta_t) \delta_t$. The first-order condition yields:
 \begin{equation*}
\theta \frac{u'(c_t)}{u(c_t)} \Big(D'_t \delta_t + D(\delta_t) \Big) = (1-\theta) \frac{u'(b_t)}{u(b_t)}
\end{equation*}
\begin{equation*}
\theta \frac{u'(c_t)}{u(c_t)} \Big(D'_t \delta_t + D(\delta_t) \Big) = (1-\theta) \frac{u'(b_t)}{u(b_t)}
\end{equation*} Defining the retirement elasticity  $\epsilon_t := D'_t(\delta_t) \frac{\delta_t}{D_t}$, and substituting it in the above equation, we obtain:
 \begin{equation*}
\frac{u'(c_t)/u(c_t)}{u'(b_t)/u(b_t)}=\frac{1-\theta}{\theta D_t}\Big(\frac{1}{1+ \epsilon_t}\Big).
\end{equation*}
\begin{equation*}
\frac{u'(c_t)/u(c_t)}{u'(b_t)/u(b_t)}=\frac{1-\theta}{\theta D_t}\Big(\frac{1}{1+ \epsilon_t}\Big).
\end{equation*} The optimal bargaining allocation of the economic burden of aging between successive cohorts of workers and retirees ensures that the ratio of their relative utility changes is proportional to the ratio of their bargaining power to their population share, and inversely proportional to the elasticity of retirement. A striking feature of CRRA preference is that the ratio of their relative utility changes is the inverse of the ratio of their consumption levels.Footnote 15 Therefore, using CRRA preferences (1) and defining the Musgrave ratio as  $M_t:=b_t/c_t$ yield:
 \begin{equation}
M_t=\frac{1-\theta}{\theta D_t}\Big(\frac{1}{1+ \epsilon_t}\Big)
\end{equation}
\begin{equation}
M_t=\frac{1-\theta}{\theta D_t}\Big(\frac{1}{1+ \epsilon_t}\Big)
\end{equation} The optimal Musgrave ratio is proportional to the bargaining power of the retirees relative to their population share, and inversely proportional to the elasticity of retirement. It is noteworthy that with CRRA preferences, the bargaining outcome is independent of the coefficient of relative risk aversion  $\alpha$. Using the budget constraint, the optimal benefit and contribution rates are:
 \begin{equation*}
\delta_t=\frac{1-\theta}{D_t}\Big(\frac{1}{1+\theta \epsilon_t}\Big)
\end{equation*}
\begin{equation*}
\delta_t=\frac{1-\theta}{D_t}\Big(\frac{1}{1+\theta \epsilon_t}\Big)
\end{equation*} \begin{equation*}
\tau_t=\frac{1-\theta}{1+\theta \epsilon_t}
\end{equation*}
\begin{equation*}
\tau_t=\frac{1-\theta}{1+\theta \epsilon_t}
\end{equation*} The optimal contribution rate  $0 \lt \tau_t=\frac{1-\theta}{1+\theta \epsilon_t} \lt 1$ decreases with the bargaining power of the workers (
 $\theta$), and with the retirement elasticity (
 $\epsilon_t)$. The optimal contribution rate is independent of the dependency rate. It implies that with fixed bargaining power, all the burden of an increase in the dependency rate is shifted to retirees through a benefit cut. The optimal benefit is also inversely proportional to the retirement elasticity, in line with the inverse elasticity (Ramsey) rule, which advocates for allocating resources in inverse proportion to responsiveness in order to minimize behavioral distortions. Therefore, the optimal solution with fixed bargaining power resembles a defined-contribution system. We summarize our analytical results with fixed bargaining power in the following proposition.
Proposition 2.1. Under CRRA preferences, with fixed bargaining power and constant retirement elasticity, optimal pension bargaining entails a fixed contribution rate, and a benefit rate that varies inversely with the dependency rate. An increase in the dependency rate (aging) leads to a reduction in the optimal Musgrave ratio (pension benefit relative to net wage). An increase in retirement elasticity results in lower benefit and contribution rates, as well as a decrease in the Musgrave ratio.
We do not assert that the fixed contribution rule applies universally, as it is specific to the family of CRRA preferences and fixed bargaining power. However, we use it as a relevant policy benchmark where the pension-to-GDP ratio remains constant. In this framework, if the dependency rate rises, the proportion of transfers from workers to the elderly stays the same, meaning that the relative living standard of the elderly decreases in proportion to the increase in dependency. What we demonstrate below is that CRRA preferences may necessitate an increase in the share of transfers from workers to the elderly in order to maintain their relative living standard, but only if bargaining power changes with the dependency rate.
2.3. Variable bargaining power
With variable bargaining, the bargaining weights are related to the dependency rate. The increase in the dependency rate translates into an increase in the bargaining weight of the retirees. The optimal bargaining now has an additional effect, as increased pension generosity raises the dependency rate (through retirement incentives), which, in turn, enhances the bargaining weight of retirees. Consider that bargaining weight is related to population shares,  $\theta_t(D_t)$, with
  $\theta'_t(D_t) \lt 0$, and that dependency rate is related to benefit rate
  $D'_t(\delta_t) \lt 0$ through the retirement elasticity (
 $\epsilon_t)$, then the Nash bargaining problem can be represented as follows:
 \begin{equation*}
\max_{\delta_t \in (0,1)} u(c_t)^{\theta_t(D_t) } u(b_t)^{1-\theta_t(D_t) }
\end{equation*}
\begin{equation*}
\max_{\delta_t \in (0,1)} u(c_t)^{\theta_t(D_t) } u(b_t)^{1-\theta_t(D_t) }
\end{equation*} subject to the budget constraint  $\tau_t =D_t(\delta_t) \delta_t$. Using the log transformation, the first-order condition yields:
 \begin{equation*}
\theta_t' D_t'log\Big(\frac{u(c_t)}{u(b_t)}\Big)- \theta_t(D_t) \frac{u'(c_t) }{u(c_t)}(D_t+\delta_t D_t')w_t+ (1-\theta_t(D_t)) \frac{u'(b_t)}{u(b_t)}w_t=0.
\end{equation*}
\begin{equation*}
\theta_t' D_t'log\Big(\frac{u(c_t)}{u(b_t)}\Big)- \theta_t(D_t) \frac{u'(c_t) }{u(c_t)}(D_t+\delta_t D_t')w_t+ (1-\theta_t(D_t)) \frac{u'(b_t)}{u(b_t)}w_t=0.
\end{equation*}Using (1) gives:
 \begin{equation*}
\theta_t' D_t' log\Big(\frac{c_t}{b_t}\Big) - \theta_t(D_t) \Big(\frac{D_t+\delta_t D_t'}{1-D_t \delta_t}\Big) + \frac{1-\theta_t(D_t)}{\delta_t} = 0
\end{equation*}
\begin{equation*}
\theta_t' D_t' log\Big(\frac{c_t}{b_t}\Big) - \theta_t(D_t) \Big(\frac{D_t+\delta_t D_t'}{1-D_t \delta_t}\Big) + \frac{1-\theta_t(D_t)}{\delta_t} = 0
\end{equation*} Using the Musgrave ratio 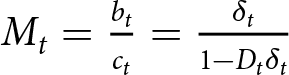 $M_t=\frac{b_t}{c_t}=\frac{\delta_t}{1-D_t\delta_t}$ and the retirement elasticity
  $\epsilon_t$, after some rearrangement, we obtain:
 \begin{equation}
M_t=\frac{1-\theta}{\theta D_t}\Big(\frac{1}{1+ \epsilon_t}\Big)-\theta_t' \epsilon_t log(M_t)
\end{equation}
\begin{equation}
M_t=\frac{1-\theta}{\theta D_t}\Big(\frac{1}{1+ \epsilon_t}\Big)-\theta_t' \epsilon_t log(M_t)
\end{equation} The optimal Musgrave ratio  $M_t$ consists of two terms. The first term is the optimal Musgrave ratio with fixed bargaining power as in (2). It is the product of the bargaining power of the retirees relative to their population share, and the inverse retirement elasticity. The second term is the correction for variable bargaining weight. When the bargaining weight
  $\theta_t(D_t)$ is linked to the dependency rate
  $D_t$ with
 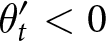 $\theta_t' \lt 0$, the sign of the correction term depends on the sign of
  $log(M_t)$. This term reflects the marginal incidence of the benefit rate on the bargaining weight. Given the retirement elasticity
  $\epsilon_t \gt 0$, higher benefit increases the dependency rate, shifting the bargaining weight by an amount
  $\theta'_t \epsilon_t$ to the retirees. When
  $M_t \lt 1$ we have
  $c_t \gt b_t$ and total utility
  $u(c_t)^{\theta_t} u(b_t)^{1-\theta_t }$ is reduced by inducing workers to retire earlier with lower income. When
  $M_t=1$, income is equalized between workers and retirees, this effect disappears and the correction term vanishes (
 $log(M)=0$). Similarly, when retirement elasticity tends to zero, this early retirement cost also tends to zero.
When the bargaining power is set equal to population share 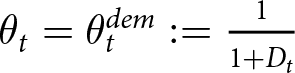 $\theta_t= \theta_t^{dem} := \frac{1}{1+D_t}$ for all
  $t$, the first-order condition (3) can be written as:
 \begin{equation}
M_t = \frac{1}{1+\epsilon_t}+\frac{\epsilon_t}{1+\epsilon_t} \frac{log(M_t)}{1+D_t} .
\end{equation}
\begin{equation}
M_t = \frac{1}{1+\epsilon_t}+\frac{\epsilon_t}{1+\epsilon_t} \frac{log(M_t)}{1+D_t} .
\end{equation} The first-order condition implicitly defines  $M$ as a function of
  $\epsilon$ and
  $D$, where we drop the time index for notation convenience. Let
 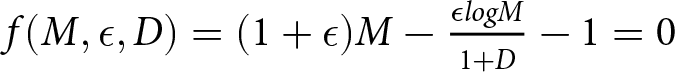 $f(M,\epsilon,D)=(1+\epsilon)M-\frac{\epsilon log M}{1+D} -1=0$. Differentiating with respect to
  $M$ gives
 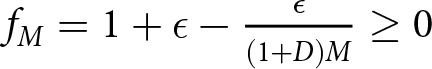 $f_M=1+\epsilon-\frac{\epsilon}{(1+D)M}\ge 0$ for
 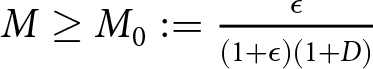 $M \ge M_0:=\frac{\epsilon}{(1+\epsilon)(1+D)}$. The equation
 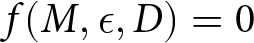 $f(M,\epsilon, D)=0$ has in general two distinct real roots for
  $M$ around
  $M_0$. We consider
 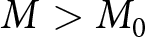 $M \gt M_0$. Total differentiation of
  $f(M,\epsilon, D)=0$ gives
 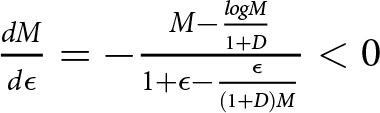 $\frac{dM}{d\epsilon}=-\frac{M-\frac{log M}{1+D}}{1+\epsilon-\frac{\epsilon}{(1+D)M}} \lt 0 $ for all
  $M_0\leq M\leq 1$ and
  $\frac{dM}{dD}=-\frac{\frac{\epsilon log M}{(1+D)^2}}{1+\epsilon-\frac{\epsilon}{(1+D)M}} \gt 0 $ for all
 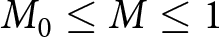 $M_0\leq M\leq 1$. We illustrate in Figure 1 the optimal
  $M$ as a function of the parameters
  $\epsilon$ and
  $D$. The optimal Musgrave ratio is always less than one, and decreasing in
  $\theta$. The reason is that the retirement incentive increases the marginal cost of the pension benefit. The Musgrave ratio is increasing in
  $D$ because when the dependency rate increases, the bargaining power of the retirees also increases. We also indicate in Figure 1 the optimal
  $M$ with fixed bargaining power as in (2) evaluated at the point where the bargaining power is set equal to the population shares (
 $\theta_t=\frac{1}{1+D_t}$) for some
  $t$. We can confirm that with variable bargaining power, the optimal Musgrave ratio is lower compared to the case with fixed bargaining power, and that the gap widens with the retirement elasticity, as indicated by the correction term in (4).
Optimal Musgrave ratio with bargaining power equal to population share.

Dependency rates in Europe.

For  $\epsilon_t=0$ and any bargaining power
  $\theta$ (possibly different from the population share), the optimal Musgrave ratio in (3) is:
 \begin{equation}
M_t=\frac{1-\theta}{\theta D_t}.
\end{equation}
\begin{equation}
M_t=\frac{1-\theta}{\theta D_t}.
\end{equation} In other words, the Musgrave ratio is given by the bargaining power of the retirees relative to their population share. In particular, when their bargaining power equals their population share, the Musgrave ratio is 1, and the ‘democratic’ bargaining model results in equal consumption between workers and retirees  $c_t=b_t$. This corresponds to the utilitarian recommendation of smoothing consumption across groups in the absence of tax distortions (
 $\epsilon=0$). Combining equation (5) using
 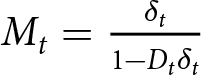 $M_t=\frac{\delta_t}{1-D_t\delta_t}$, with the budget constraint
 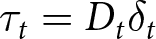 $\tau_t=D_t \delta_t$ gives the following benefit and contribution rates:
 \begin{equation*}
\delta_t=\frac{1}{1+ D_t}
\end{equation*}
\begin{equation*}
\delta_t=\frac{1}{1+ D_t}
\end{equation*} \begin{equation*}
\tau_t=\frac{D_t}{1+ D_t}
\end{equation*}
\begin{equation*}
\tau_t=\frac{D_t}{1+ D_t}
\end{equation*} It follows that 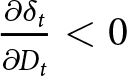 $\frac{\partial \delta_t}{\partial D_t} \lt 0$ and
 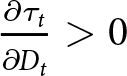 $\frac{\partial \tau_t}{\partial D_t} \gt 0$. Thus, neither fixed-benefit nor fixed contribution are optimal. We summarize our findings in the following proposition.
Proposition 2.2. Under CRRA preferences, when bargaining power is variable and set equal to the population share, optimal pension bargaining requires both contribution and benefit rates to adjust with the dependency rate. An increase in the dependency rate (aging) raises the Musgrave ratio. Conversely, an increase in retirement elasticity results in a decrease in both benefit and contribution rates, as well as the Musgrave ratio. As retirement elasticity approaches zero, the optimal Musgrave ratio tends toward one.
3. Data on EU-wide pension reforms
The EPC produces a set of long-term budgetary projections on the basis of population projections provided by Eurostat. These pension projections provide a detailed image of the institutional features of the pension systems in each country, and the most recent legislated pension reforms using national models (to accommodate for country-specific institutional pension features) under certain demographic and macroeconomic assumptions. The core of the pension projection exercise concerns government expenditure on public pension schemes. Pension expenditures cover pensions and equivalent cash benefits granted for a long period (over 1 year) for old age, early retirement, disability (including pension-type benefits granted because of reduced work capacity or because of labor market conditions), and survivors. The aim is to cover those pension schemes that affect public finances.Footnote 16 The projections also include the quasi-mandatory occupational pension schemes that play a role equivalent to social-security schemes in pension provision.Footnote 17
Pension systems differ across EU countries. In many European countries, public pay-as-you-go schemes follow a general DB format. Private occupational DB schemes are mandatory or quasi-mandatory in the Netherlands and Switzerland. There are points schemes (PS) in France, Estonia, Germany, Lithuania, and the Slovak Republic. In PS schemes, workers earn pension points based on their earnings, which are converted to a monetary value upon retirement. Italy, Latvia, Norway, Poland, and Sweden have notional defined contribution (NDC) schemes. Additionally, Greece has a small supplementary component, which is the NDC. In NDC schemes, each worker’s contributions are recorded in a notional individual account, and at retirement, pension benefits are determined from the accumulated notional capital based on life expectancy at the time of retirement.
Countries also differ in how they address aging and budget balance. Several countries, such as Germany, Spain, Lithuania, and Sweden, have introduced automatic balancing mechanisms. These mechanisms reduce pension indexation to secure future budget balance. Another adjustment mechanism found in several countries is the sustainability factor that determines the initial pension benefit as a function of life expectancy. Many countries also extend the contribution period or the pensionable age. Finland links the retirement age to life expectancy improvements through the life expectancy coefficient. In France, the gradual increase in the contribution period for a full pension is decided to cope with increasing longevity without modifying the replacement rate, while in Denmark, Estonia, Greece, and Italy there is a one-to-one link between statutory retirement age and life expectancy (EPC, 2021). Considering these observations, countries implement a range of reforms to adjust pension benefits and contributions, and to reduce the impact of population aging by increasing the contribution period and the pensionable age.
3.1. Dependency rate projections (EPC 2021)
The standard metric used to measure the burden of aging on pension systems is the (total) economic dependency rate. It is defined as the ratio of total inactive individuals to the working individuals in the population above 21 years old. Unlike the old age ratio (number of individuals aged 65 and over per 100 people of working age), this dependency rate takes into account the change in labor force participation, life expectancy, and pension eligibility conditions, which are key for the coverage of pension systems (see Sanderson and Sherbov (Reference Sanderson and Sherbov2016)).Footnote 18 Our dependency rate also includes the feature that many countries provide early retirement paths and pay early retirement or auxiliary benefits before 65. Interestingly, the dependency rate varies quite a lot across countries, both in terms of initial level and projection. Italy and Greece start with a large initial dependency rate, and they will face a large dependency increase until 2050. On the other hand, countries like France and Germany start with a similar dependency rate as Spain, but the dependency rate in Spain will grow faster. Similarly, the dependency rate in Poland will grow much faster than in the Netherlands or Sweden.
3.2. Benefit rate projections (EPC 2021)
A key projection parameter is the pension benefit rate, which is defined as the average pension benefit including all its components (i.e., contributory and non-contributory), divided by an economy-wide average wage. Changes in the benefit rate reflect the characteristics of the pension framework, including recently legislated reforms such as the (new) rules for calculating and indexing the pension entitlement, changes in the pension formula, and changes in the contribution periods.
The EPC projections are based on common macroeconomic assumptions and country-specific projection models, along with several sensitivity checks for the underlying assumptions. The labor force projections are produced using a cohort simulation model, under the assumption of no policy changes beyond legislated pension reforms. The budgetary projections are based on national projection models, which capture the basic parameters of pension structure, as well as the degree of heterogeneity across countries. Across the EU, state pension spending constitutes more than a fifth of total government outlays (EPC, 2021). Public pension systems can be classified into different groups based on the funding source and the specific risks they cover. The funding source of pensions can be contributions, general taxes, or other sources, and the risks covered can include old age and early pensions, disability, survivor, and minimum pensions. The EPC projections for public pensions reflect this diversity and are based on an exhaustive definition of public pensions, which allows comparability across countries (EPC, 2021).
Based on our analytical model, we are interested in identifying the country-specific responses to the dependency rate increase ( $D_t$), in terms of benefit rate change (
 $\delta_t$) and contribution rate change (
 $\tau_t$). The EPC projected pension benefit rates (
 $\delta_t$) are defined as average pensions relative to average wages (EPC, 2021). This definition is independent of the country specific pension structure, this is a general definition that covers average transfers made to an average retiree within the social security system, regardless of the specific source. Figure 3 compares the benefit rates in 2020 and 2050 based on the EPC projections. We clearly see the predicted benefit cut in most countries, with a few countries, such as Belgium and Ireland, where the benefit rate is constant.
Projected pension benefit rates.
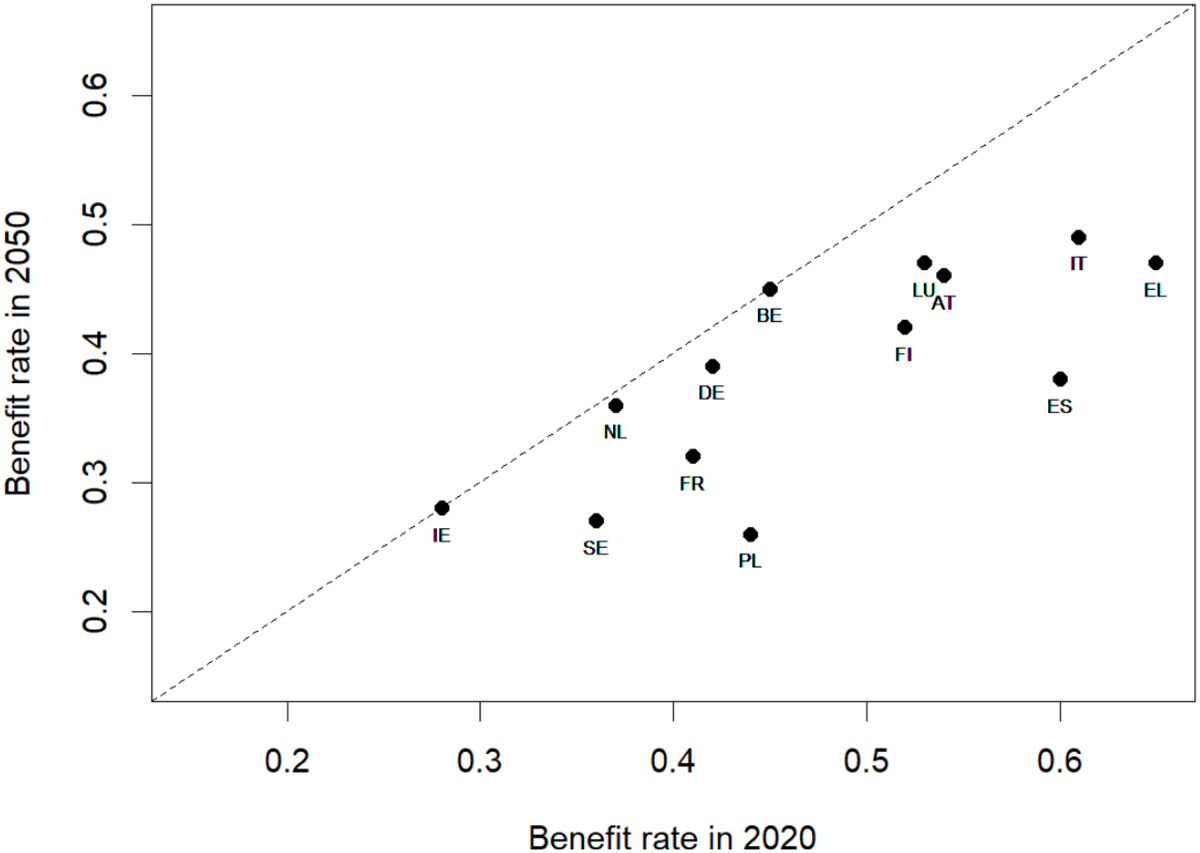
Across countries, we find European catching up of pension benefits: there is a negative correlation between the change in benefit rate and the initial benefit rate ( $\rho=-0.36$,
  $p=.046$).
3.3. Sharing rules
In our analysis, we use the Musgrave ratio  $M_t=\frac{\delta_t}{1-\tau_t}$ to measure from the enacted pension reforms (as of 2019) the change in the income of the retirees relative to the net income of the workers. Combining the benefit rate
  $\delta_t$ and the dependency rate
  $D_t$ with the budget constraint, we can retrieve the contribution rates as
  $\tau_t=\delta_t D_t$. A central issue is how to share the cost of aging across cohorts. The Musgrave rule introduced by Musgrave (Reference Musgrave1981) proposes a proportional sharing rule. Under a fixed Musgrave ratio, the ratio of pension benefits to the net wages stays constant over time, implying that as the population ages, the consumption levels of retirees
  $b_t$ and workers
  $c_t$ evolve at the same rate.Footnote 19
To compare the projections of the Musgrave rates, consider two hypothetical polar cases. The first case is the hypothetical Musgrave rate if countries adopt the fixed-benefit rate, and change the contribution rate ( $\tau_t$) in response to the dependency rate (
 $D_t$), so as to maintain budget balance. The second case is the hypothetical Musgrave rate if countries adopt the fixed-contribution rate, and change the benefit rate (
 $\delta_t$) in response to the dependency rate, to maintain budget balance. Figure 4 shows the evolution of the Musgrave ratio from 2019 to 2070 under the projected policy frameworks (EPC-2019 and EPC-2070, respectively) and indicates the ‘hypothetical’ Musgrave ratio in 2070 if the countries were to impose either a purely DB (Fixed Benefit Rate-2070) or a purely DC scheme (Fixed-Contribution rate-2070) as a adjustment rule. The countries are sorted based on the level of public pensions in the baseline from left to right (the leftmost country has the smallest benefit rate in 2019, and the rightmost country has the highest benefit rate). Comparing the EPC ratio in 2070 with the hypothetical DB or DC ratio reveals that no country, except Ireland, is expected to adopt a pure DB adjustment rule, whereas France appears to be close to a DC rule, even though its pension system is based on DB structure (EPC-2070 ratio is close to the Fixed Contribution Rate 2070 ratio).
Musgrave ratio in 2019 and 2070.

Deviation of workers’ implicit bargaining power from their demographic share.

The Musgrave rate is the average gross pension relative to the average wage net of social security contributions. We use this ‘gross’ Musgrave rate throughout the analysis. In Appendix B, we show that our results are based on the ‘net’ Musgrave rate taking into account both social security contributions and income taxes (with differential tax treatment of wages and pension benefits). It is shown that in most countries, the net Musgrave rate is higher than the same gross Musgrave rate.
4. The political stress test: the democratic gap
We now assess the sustainability of the pension reforms implemented by EU countries by examining the disparity between the democratic bargaining power, represented by population shares, and the implicit bargaining power required to maintain the projected pension benefits as the optimal outcome of the bargaining problem discussed in Section 2. The strategy is similar to the inverse optimal tax approach in which the implicit social weights correspond to the solution to the ‘inverse-optimum’ program in the optimal tax literature: they are the social welfare weights that rationalize the status quo tax schedule as optimal given the labor supply elasticity (Bourguignon and Spadaro, Reference Bourguignon and Spadaro2012). This approach was used in Jacobs et al. (Reference Jacobs, Jongen and Zoutman2017) to estimate distributive preference of Dutch political parties by using the proposed tax systems, and assuming that Dutch political parties optimize the tax system according to their political preferences. It was also used in Hendren (Reference Hendren2020) to evaluate income distributions across countries based on the implicit social preferences. In our approach, we estimate the bargaining weights that would rationalize the projected pension benefits given the retirement elasticity  $\epsilon_t$. We then compare these bargaining weights to the population shares of workers and retirees. The deviation measures the stress on the political sustainability of the projected pension benefits (i.e., political stress test). It is important to note that this analysis of revealed social preferences relies on three conditions: (i) the government selects an optimal policy while ensuring budget balance, (ii) the policy accurately reflects individual preferences, and (iii) the government correctly predicts labor supply responses (Saez and Stantcheva, Reference Saez and Stantcheva2016). We refer to this stress test as the ‘democratic gap’, which measures the deviation of implicit bargaining power from population share over time. In the next section, we conduct the same test from a different perspective, using the ‘benefit gap’ to measure the deviation over time between the optimal benefit and the projected pension benefit. For each approach, we performed a statistical test to determine, for each country, whether the median deviation over time is statistically significant. To account for data that may not follow a normal distribution, we use the non-parametric Wilcoxon signed-rank test as an alternative to the Student’s t-test. We begin our empirical analysis by using the fixed bargaining model in Section 2.
4.1. Fixed bargaining power
Assume that initially, each country determines the benefit rate and contribution rate based on the demographic share of the population. In other words, the bargaining power of workers is represented by  $\theta_0=\frac{1}{1+D_0}$, and the bargaining power of retirees is
  $1-\theta_0=\frac{D_0}{1+D_0}$. Using the optimal Musgrave ratio condition (2), the country-specific retirement elasticity is given by:
 \begin{equation*}
\epsilon^f_0=\frac{1-M_0}{M_0}
\end{equation*}
\begin{equation*}
\epsilon^f_0=\frac{1-M_0}{M_0}
\end{equation*} This represents the country-specific retirement elasticity that sustains the initial Musgrave ratio in each country as optimal. Assuming that the retirement elasticity is constant over time, we can estimate the implicit bargaining power  $\tilde{\theta}^f_t$ as a function of dependency rate
  $D_t$ and the EPC projected Musgrave rate
  $M_t$:
 \begin{equation*}
\tilde{\theta }^f_t=\frac{1}{1+ D_t M_t(1+\epsilon^f_0) }
\end{equation*}
\begin{equation*}
\tilde{\theta }^f_t=\frac{1}{1+ D_t M_t(1+\epsilon^f_0) }
\end{equation*} So,  $\tilde{\theta }^f_t$ is decreasing with the Musgrave ratio
  $M_t$ for any given
  $D_t$. That is, a higher Musgrave ratio reveals a lower bargaining power of the workers relative to their population share. To capture cross-country variation in the evolution of the implicit bargaining power, we plot the deviation of the implicit bargaining power from the population share below.
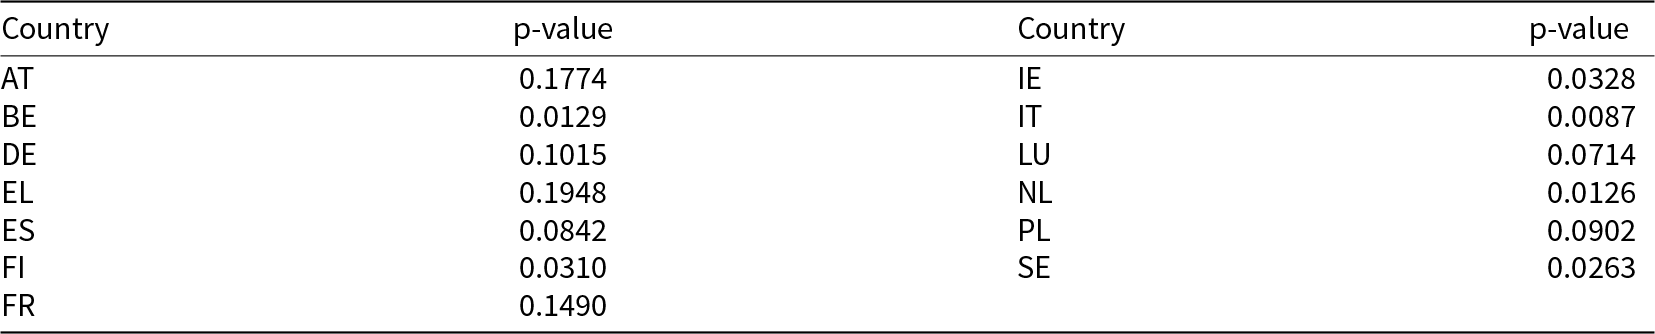
In many countries, we observe a growing gap over time between population shares and the bargaining weights implied by the projected pension benefits. The deviation is positive in most countries, indicating that changes in the projected pension benefits would require the bargaining power of workers to be increasingly higher than their population share. There are a few exceptions in countries such as Belgium, Ireland, the Netherlands, and Luxembourg, where the gap is always negative. Some countries, such as Italy and, to a lesser extent, France, exhibit a U-shaped deviation, starting with a negative gap followed by a growing positive gap between the implicit bargaining power of workers and their population share. The following table provides the statistical test for the significance levels of those deviations relative to random variation alone (null hypothesis). The Wilcoxon signed-rank test is applied as a repeated measurement on two separate country-specific samples (the implicit bargaining power sample and the demographic share sample) to evaluate whether the mean ranks differ, by ranking the absolute values and ignoring the sign. We find that except for Germany, Greece, France, the Netherlands, and Poland, all other countries deviate from zero at a significance level of 10%. (See Table 1).
Statistical test for non-zero deviation – fixed bargaining power

Notes: P-values of the Wilcoxon signed-rank test for H0: The deviation from the demographic share is different than zero.
4.2. Variable bargaining power
To enhance the calibration of our model, we now incorporate the feedback effect of pension benefits on bargaining power through the early retirement incentive (the second term in (3)). We repeat the previous exercise using the variable bargaining power model from Section 2. The retirement elasticity that generates the initial Musgrave ratio  $M_0$ as optimal is:
 \begin{equation*}
\epsilon^v_0=\frac{1-M_0}{M_0-\frac{log(M_0)}{1+D_0}}
\end{equation*}
\begin{equation*}
\epsilon^v_0=\frac{1-M_0}{M_0-\frac{log(M_0)}{1+D_0}}
\end{equation*} Considering that the country-specific retirement elasticity is constant for each country, we estimate the implicit bargaining power  $\tilde{\theta }^v_t$ as a function of
  $D_t$ and
  $M_t$:
 \begin{equation*}
\tilde{\theta }^v_t=\frac{1}{1+ D_t M_t+D_t \epsilon^v_0 \Big(M_t-\frac{log(M_t)}{1+D_t}\Big) }
\end{equation*}
\begin{equation*}
\tilde{\theta }^v_t=\frac{1}{1+ D_t M_t+D_t \epsilon^v_0 \Big(M_t-\frac{log(M_t)}{1+D_t}\Big) }
\end{equation*}The gap between the implicit bargaining power and the population share is illustrated in Figure 6. Interestingly, only Belgium shows a negative gap throughout the period from 2020 to 2050. Italy exhibits a pronounced u-shaped gap, while most other countries display a positive and growing gap for the majority of the period. It is also worth noting that the magnitude of the gap has decreased for most countries compared to the fixed bargaining model. This is because the variable bargaining power model introduces a new effect through the income loss associated with early retirement (the second term in (3)). As a result, the optimal benefit is lowered in all countries, bringing it closer to the projected benefit.
Deviation of workers’ implicit bargaining power from their demographic share.

The magnitude of the gap has decreased for most countries, but the statistical significance of the gap has increased, as shown by the statistical test in Table 2. Comparing Table 1 with Table 2, we observe that the p-values have decreased for almost all countries, with the largest reductions seen in Germany (p-value dropping from 0.40 to 0.10) and France (p-value dropping from 0.39 to 0.15). Except for Germany, Greece, France, the Netherlands, and Poland, all other countries show significant deviations from zero at a 10% significance level.
Statistical test for non-zero deviation – variable bargaining power
Notes: P-values of the Wilcoxon signed-rank test for H0: The deviation from the demographic share is different than zero.
5. The political stress test: the benefit gap
In this section, we present the political stress test in a different way by measuring the benefit gap between the projected pension benefits and the optimal pension benefit derived from the Nash bargaining model, assuming a retirement incentive ( $\epsilon_t \gt 0$) and that the bargaining power is equal to the population share.
We fix the retirement elasticity at the level estimated for the initial year 2019 ( $\epsilon_{0}=\epsilon_{2019}$). Using the first-order condition (3), the implicit retirement elasticity that sustains the pension benefit in 2019 as optimal is:
 \begin{equation}
\epsilon_{0}=\frac{1-M_{0}}{M_{0}-\frac{log(M_{0})}{1+D_{0}}}
\end{equation}
\begin{equation}
\epsilon_{0}=\frac{1-M_{0}}{M_{0}-\frac{log(M_{0})}{1+D_{0}}}
\end{equation}The retirement elasticity for each country is reported in Figure C1 in Appendix C. It is worth noting that there is significant dispersion across countries. This reflects the cross-country variation in the initial benefit levels and dependency rates. For instance, in 2020, Italy and Greece displayed high benefit rates relative to their dependency ratios, meaning their implicit retirement elasticity must be low to achieve the optimal bargaining outcome. In contrast, Germany and France have lower benefit levels relative to their dependency ratios in 2020, necessitating a higher implicit retirement elasticity to reach the optimal bargaining outcome.
Figure 7 illustrates the projected benefit rate and the optimal benefit rate when the bargaining power is equal to the share of the population (with statistical test in Table 3). In most countries, the optimal benefit rate appears to be higher than the projected benefit rate. In Poland and Sweden, which have NDC pension systems, this gap grows over time. This is because NDC pension schemes function primarily as defined contribution plans, placing most of the aging burden on the elderly. This allocation of the aging burden would only be optimal if the bargaining power of the elderly remained unchanged over time (as demonstrated in Proposition 1). The implication is that to reduce the political resistance of the elderly, the NDC system should combine elements of both defined benefit and defined contribution. In Austria, France, Germany, and Italy, the projected benefit rate is initially above the optimal benefit rate, but the gap later reverses. This may suggest a growing level of tension regarding pension schemes in the future. In the Appendix, available upon request, we provide the same comparison of optimal and projected benefit rates for a larger set of 25 EU countries. The vast majority of countries show future benefits that progressively fall below the optimal benefit when bargaining power changes with aging.
Statistical test for non-zero deviation of the projected Musgrave ratio from the optimal Musgrave ratio

Notes: P-values of the Wilcoxon signed-rank test for H0: The deviation of the Projected Musgrave Ratio from the Optimal Musgrave Ratio is different than zero.
OECD (2021) reports that only Germany, Luxembourg, the Netherlands, and Sweden apply automatic balancing mechanisms in Europe, while Denmark, Finland, Greece, Italy, the Netherlands, and Portugal link the retirement age and/or benefits to life expectancy. Austria, Belgium, France, Ireland, and Spain do not impose any link between pension parameters and life expectancy, nor any balancing mechanisms (see Appendix D). In Figure 7, the smallest gap between projected and optimal benefit rates is observed in Germany and Luxembourg. This suggests that balancing mechanisms in those countries’ pension systems are more effective in eliminating tensions between different generations, whereas in NDC pension schemes like Sweden and Poland, the gap between the projected and optimal benefit grows over time regardless of their different balancing mechanisms.
Projected benefit rate vs. optimal benefit rate.

6. Discussion of the results
It is useful to connect our two stress tests, as they represent two sides of the same coin. The implicit weights in Figure 5 reveal a growing gap between the workers’ population share and their implicit bargaining weight required to sustain the projected pension benefit. In the context of bargaining over the allocation of the aging burden between workers and the elderly, this result implies that workers, aiming to limit pension benefits in order to reduce their budget-balanced contribution rate, end up with pension benefits (and contribution rates) that are lower than what they would obtain if their bargaining power matched their population share. The benefit gap in Figure 8 translates that very same idea in terms of a growing gap between the projected pension benefit and the optimal pension benefit that would result if the bargaining power were to match the population share. We consider the two tests as two different perspectives on the same issue. That issue is our concern about the political sustainability of the enacted reforms and their resulting projected benefits.
Deviation of the projected Musgrave ratio from the optimal Musgrave ratio.

The reference to ‘automatic balancing mechanism’ may be confusing because our background model considers budget balance throughout the period for each country. In this context, it is important to clarify the key differences in the implicit adjustment mechanisms across countries. (see Table D1 in Appendix) Many pension systems use demographic factors as part of their automatic adjustments. As the population ages and the proportion of retirees increases, the government may adopt adaptation policy adjusting pension levels, or contribution rates in response to the increasing burden of aging. Government may also adopt attenuation policy adjusting the age at which pensions can be drawn or the contribution period. This seeks to ensure that the ratio of working years to retirement years remains balanced. In our analysis, the attenuation policy is best seen in Figure 2 from the projected changes of the dependency rates. For instance, Poland, Spain, and Italy display much higher increases in their dependency rates, than Sweden, Germany, Belgium, and France. The latter group has a more effective attenuation policy.
Comparing more closely Poland and Sweden, both start out with similar dependency rate, but Poland faces a much higher rise in its dependency rate. Poland has an automatic adjustment for pensions. Under this system, if the ratio of retirees increases, pension benefits might be adjusted downward, to ensure that the pension system remains financially viable over the long term. Sweden displays a more effective attenuation policy (due to work incentives embedded in their NDC system). Notional contributions ‘keep track’ of how much the worker earns and how much is contributed during their working years, and the conversion rate effectively discounts pension for early retirement. However, Sweden shows a high benefit gap in Figure 8. The reason is that the benefit formula in Sweden incorporates a ‘balance ratio’ that is automatically adjusted, based on the financial health of the pension system. If the system’s finances are under strain (due to lower-than-expected contributions or higher-than-expected payouts), the balance ratio can be adjusted downward. This adjustment impacts how much people will receive in pensions, ensuring that the total expenditures of the pension system remain in balance with the income generated from worker contributions. This might involve freezing pension increases for a period or reducing benefits if necessary.
A second relevant comparison is between Spain and Italy. Both countries face a sharp increase in their dependency rates, suggesting ineffective attenuation policy. However, the benefit gap is greater in Spain than in Italy. In Spain, since 2013, the annual increase in pensions has been tied to the Consumer Price Index (CPI), with some conditions on how much the increase can be. The Sustainability Factor implies that the amount of pension benefits is to be adjusted according to the ratio of pensioners to contributors. It reduces the future pensions of individuals who retired as this ratio increases. Italy uses a sustainability factor (fattore di sostenibilità) adjusting both benefit and contribution rates. Indeed, since Fornero Law (2011) automatic, contribution rate increases (and contribution period increase) can occur if the ratio of retirees to workers becomes unsustainable.
A third comparison is between Germany and Belgium. Both countries display similar dependency rate increase (Figure 2), and a small benefit gap (Figure 8). However, the drivers are quite different. Germany combines rather effectively attenuation policy with attenuation policy balancing contribution and benefit rates adjustment. In Germany, the sustainability factor is a key mechanism designed to ensure the financial sustainability of the pension system. The factor adjusts the annual pension increase to reflect the ratio of contributors to retirees. In addition, the German pension system has an automatic contribution rate adjustment mechanism designed to keep the system financially balanced. If the system faces financial pressure due to an imbalance between income from contributions and pension payouts, the contribution rate may be adjusted automatically. In Belgium, there is no AAM. CEV (2024) estimates that the expansion of the employment rate will absorb about one half of the population aging. The benefit and contribution rates are fixed, and the growing gap between income from contributions and pension payout is covered by alternative financing (VAT and income tax revenue). Belgium is the only country where the pension-to-GDP ratio continues to increase throughout the period.
It is tempting to try to relate benefit gaps to countries’ characteristics of the pension systems in order to draw from our analysis some general features of pension systems and adjustment mechanisms that can better resist the increasing power of the elderly. However, the substantial variation across countries makes it both premature and potentially risky. What our preliminary cross-country analysis suggests is that there is no magic solution, since different countries face similar political tension with different pension systems, various adjustment mechanisms (AAMs or ABMs) and attenuation policies of pensionable age and contribution period. It is certainly worth in future research to delve deeper into country characteristics to try to find out empirical regularities (if any). This will require a full econometric analysis that is beyond the scope of this cross-country stress test analysis.
7. Conclusion
According to EPC (2021), in most EU countries, the projected pension benefit rate decreases over time in response to population aging. In a democracy, policies require electoral support for implementation, and more represented cohorts typically push policies toward their preferred outcomes. As older populations grow larger and become more politically influential, implementing certain policies will become increasingly challenging. As a result, aging may gradually increase public resistance to gradual pension cuts.
The aim of this paper is to provide an analytical framework to assess whether the projected pension policy allocates the aging burden in accordance with a democratic bargaining process between the working and retired populations. In this context, we propose a Nash bargaining solution to determine the optimal allocation between workers and retirees through a combination of gradual contribution increases and benefit cuts. Our model is straightforward yet effective, incorporating the incentive effects of pension policies to account for retirement elasticity. Our findings show that when the bargaining power of retirees is fixed, the bargaining outcome follows a defined-contribution rule. The contribution rate is fixed, and the pension benefit is reduced to adjust to the aging cost and the retirement elasticity. All the burden of aging is shifted to the elderly. Conversely, when the bargaining power of retirees increases with population aging, the Nash bargaining outcome results in a Musgrave ratio (pension benefit relative to net wage) that decreases with the retirement incentive and increases with the dependency rate.
To assess the political sustainability of the legislated pension reforms, we used the projected pension benefits of EU countries to derive the implicit bargaining weights of different cohorts, assuming that the projected pension benefit is determined optimally through our bargaining process. The implicit bargaining power will evolve both with aging (via the dependency rate) and the projected pension benefit. By calibrating the projected benefit rates and dependency rates to our fixed bargaining power model, we conclude that a growing democratic gap exists in many countries, measured by the disparity between implicit bargaining power and the population share of each group. The implicit bargaining power of workers, which sustains the projected pension benefit, increases faster than their population share. This suggests a growing political resistance among retirees to the projected pension benefits. However, when considering variable bargaining power, we arrive at a different conclusion. In several countries, the implicit bargaining power of workers is approaching their population share, although the gap continues to grow over time in most countries. The variation in the gap across countries underscores that some nations may face greater challenges than others in dealing with the increasing resistance of retirees to projected cuts in pension benefits. Then, we approach the analysis from a different perspective by comparing the projected pension benefits to the optimal benefit when bargaining power evolves in line with population share. We find that in most countries, the projected pension benefits fall below the optimal benefit, primarily driven by the growing bargaining power of the elderly.
What do we learn from our empirical analysis? In some countries adopting AAMs, the gap is widening over time, suggesting a growing resistance to some forms of AAMs. But this is not a general finding. Germany, for example, uses an automatic balancing mechanism via the sustainability coefficient, but the benefit gap is smaller than in other countries. Our cross-country empirical analysis reveals a widespread and growing tension between workers and the elderly regarding the future distribution of the aging cost. While countries employ different pension systems, adjustment mechanisms (AAMs or ABMs), and policies to manage pensionable age and contribution periods, they all face similar political tensions.
In future research, we aim to explore country-specific characteristics more thoroughly to identify empirical regularities or common patterns. This will involve a comprehensive econometric analysis, which goes beyond the scope of our current cross-country stress test analysis. Additionally, we plan to update our analytical model to better accommodate these country-specific characteristics. One area we find particularly interesting is modeling the variable migration threat from workers as the aging burden increases. We provide a preliminary model in Appendix A showing that the migration risk enhances the ‘effective’ bargaining power of workers, allowing the model predictions to better align with benefit projections. Another avenue for future research is to extend the analytical model to explicitly incorporate bargaining over attenuation policies, such as retirement policies that extend the contribution period and pensionable age. So far, these policies have been incorporated implicitly into the countries’ projected dependency rates. However, we do not have an analytical model to compute the optimal balance between refinancing (contribution increases), retrenchment (benefit cuts), and retirement policies (working longer) to address the aging pressure on pension systems.
There is no one-size-fits-all approach to achieving the political sustainability of pension reform, as different countries face unique contexts and constraints. However, two general factors can enhance the political sustainability of pension reform. The first factor is the level of consensus and consultation among the key stakeholders in the reform process, including political parties, social partners, civil society, and experts. A broad and inclusive dialogue can foster trust, legitimacy, and ownership of the reform, while also helping to identify and address potential conflicts and grievances. This solution directly addresses the commitment issue, which is central to our static bargaining model. The second factor is the design and timing of the reform, including the scope, pace, sequencing of changes, and the distribution of costs and benefits across generations. A well-designed, progressive, and carefully timed reform can help distribute the burden of aging across multiple cohorts, smoothing the transition and mitigating the negative effects of the reform.
Acknowledgements
The authors would like to thank Xuyang Chen, Pierre Devolder, Alain Jousten, Mathieu Lefebvre, and Vincent Vandenberghe for their comments. We are grateful to the co-editor and one anonymous reviewer for very useful comments and suggestions. The research has benefited from the funding from the Belgian French-speaking Community (convention ARC  $\mathrm{n}^{\circ}$18/23-088 on ‘Sustainable, adequate and safe pensions: financial architecture, social justice and governance’).
Appendix A. Non-zero disagreement point for workers
There is a fundamental asymmetry between workers and retirees in the bargaining process, driven by the migration threat. Labor mobility within the EU can impact the issue of sharing the aging burden. By comparing the pension policies of neighboring countries, workers could gain significant leverage by setting their threat point at the average level of consumption they could achieve in other countries if they were to migrate. To incorporate the migration risk, we can extend our model by assigning a non-zero disagreement point for workers, while keeping the threat point for retirees at zero. Suppose the outside option for workers is represented by a fraction  $k \in (0,1)$ of their domestic gross wage
  $w$ (we drop the time index for simplicity). This more advantageous threat point for workers will shift the bargaining outcome in their favor. The generational bargaining problem, with an outside option for workers, can be represented as follows:
 \begin{equation*}
\max_{\delta_t \in (0,1)} \Big[U((1-D_t\delta_t)w)-U(k w)\Big]^{\theta_t} \Big[U(\delta_tw)\Big]^{1-\theta_t}
\end{equation*}
\begin{equation*}
\max_{\delta_t \in (0,1)} \Big[U((1-D_t\delta_t)w)-U(k w)\Big]^{\theta_t} \Big[U(\delta_tw)\Big]^{1-\theta_t}
\end{equation*}subject to participation (no migration) constraint  $1-D_t\delta_t \geq k$ with
  $k\geq 0$. An interior solution to this program is characterized by the following;
 \begin{equation*}
\begin{aligned}
\theta_t \Big[U(w(1-D_t\delta_t)-U(wk)\Big]^{\theta_t-1} \Big[U(w\delta_t)\Big]^{1-\theta_t} U'(w(1-D_t\delta_t)) (-w D_t) \\
+ (1-\theta_t) \Big[U(w(1-D_t \delta_t)-U(wk)\Big]^{\theta_t} \Big[U(w\delta_t)\Big]^{-\theta_t}U'(w\delta_t) w=0
\end{aligned}
\end{equation*}
\begin{equation*}
\begin{aligned}
\theta_t \Big[U(w(1-D_t\delta_t)-U(wk)\Big]^{\theta_t-1} \Big[U(w\delta_t)\Big]^{1-\theta_t} U'(w(1-D_t\delta_t)) (-w D_t) \\
+ (1-\theta_t) \Big[U(w(1-D_t \delta_t)-U(wk)\Big]^{\theta_t} \Big[U(w\delta_t)\Big]^{-\theta_t}U'(w\delta_t) w=0
\end{aligned}
\end{equation*} \begin{equation*}
\theta_t \Big[U(w\delta_t)\Big] U'(w(1-D_t\delta_t)) (- D_t)\\
+(1-\theta_t) \Big[U(w(1-D_t \delta_t)-U(wk)\Big] U'(w\delta_t)=0
\end{equation*}
\begin{equation*}
\theta_t \Big[U(w\delta_t)\Big] U'(w(1-D_t\delta_t)) (- D_t)\\
+(1-\theta_t) \Big[U(w(1-D_t \delta_t)-U(wk)\Big] U'(w\delta_t)=0
\end{equation*}Using the CRRA utility function,
 \begin{equation*}
\theta_t \Big[\frac{w\delta_t}{1-\alpha}\Big]\Big[w(1-D_t\delta_t)\Big]^{-\alpha} D_t=(1-\theta_t) \Big[ \frac{(w(1-D_t\delta_t))^{1-\alpha}}{1-\alpha}-\frac{wk^{1-\alpha}}{1-\alpha}\Big]
\end{equation*}
\begin{equation*}
\theta_t \Big[\frac{w\delta_t}{1-\alpha}\Big]\Big[w(1-D_t\delta_t)\Big]^{-\alpha} D_t=(1-\theta_t) \Big[ \frac{(w(1-D_t\delta_t))^{1-\alpha}}{1-\alpha}-\frac{wk^{1-\alpha}}{1-\alpha}\Big]
\end{equation*} Dividing by  $w(1-D_t\delta_t)^{1-\alpha}$ yields:
 \begin{equation*}
\theta_t \Big[\frac{w\delta_t}{w(1-D_t\delta_t)}\Big] D_t=(1-\theta_t) \Big[ 1-({\frac{wk}{w(1-D_t\delta_t)}})^{1-\alpha}\Big]
\end{equation*}
\begin{equation*}
\theta_t \Big[\frac{w\delta_t}{w(1-D_t\delta_t)}\Big] D_t=(1-\theta_t) \Big[ 1-({\frac{wk}{w(1-D_t\delta_t)}})^{1-\alpha}\Big]
\end{equation*} Using  $M_t=\frac{\delta_t}{1-D_t\delta_t}$ gives:
 \begin{equation}
M_t =\Big[\frac{1-\theta_t}{\theta_t D_t} \Big] \Big[ 1-\Big({\frac{k}{(1-D_t\delta_t)}}\Big)^{1-\alpha}\Big]
\end{equation}
\begin{equation}
M_t =\Big[\frac{1-\theta_t}{\theta_t D_t} \Big] \Big[ 1-\Big({\frac{k}{(1-D_t\delta_t)}}\Big)^{1-\alpha}\Big]
\end{equation}Note that equation (A.1) is similar to (5) with a correction term 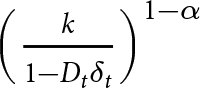 $\Big({\frac{k}{1-D_t\delta_t}}\Big)^{1-\alpha}$ which reflects the value of the outside option for workers. The marginal cost of pensions rises when tax capacity is constrained by the threat of worker mobility (note that there is no retirement incentive in this version of the bargaining model). The higher the value of
  $k$, the lower the equilibrium level of the Musgrave ratio
  $M_t$. This result aligns with our expectations: a better outside option for workers is essentially equivalent to stronger bargaining power. Additionally, in the equation, we observe the impact of risk aversion. An increase in relative risk
  $\alpha$ aversion shifts the bargaining outcome in favor of the workers.
Appendix B. Gross vs. net Musgrave ratios
In our analysis, we have excluded income taxes and focused solely on an economy with social security contributions. One could argue that what truly matters in sharing the aging cost is after-tax income. The Musgrave ratio based on net income differs from that based on gross income due to progressive taxation and the different tax treatments of pension benefits and labor income. The net income of retirees, relative to the net income of workers, is generally higher than the corresponding gross income ratio. To offer a more realistic comparison of pension schemes across countries and distinguish between gross and net income ratios, we reproduce the Musgrave ratio, the initial implicit bargaining power of retirees (baseline), and the deviation from this baseline. We extract income tax rate information for workers at average earnings and pensioners at the gross replacement rate of average earnings from the OECD.Footnote 20
Musgrave ratio (gross vs. net).

Initial deviation of retirees’ implicit bargaining power from their population share (gross vs. net).

Let us denote the income tax rate of workers by  $\tau_W$, and the income tax rate of retirees by
  $\tau_R$, then the net consumption of workers can be written as
  $c_{net}=w(1-\tau-\tau_w)$, while it is represented by
  $b_{net}=w \delta (1-\tau_R)$. Under this formulation, the net Musgrave ratio is defined as the ratio of the net consumption levels between the two generations,
 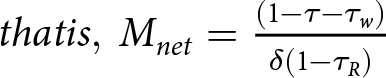 $that is, \ M_{net}=\frac{(1-\tau-\tau_w)}{\delta (1-\tau_R)}$. Figure B1 compares the net and gross Musgrave ratios. We observe that except for Ireland, Sweden, and the Netherlands, the net Musgrave ratio differs significantly from the gross Musgrave ratio. When examining the initial deviation of retirees’ implicit bargaining power from their population share, we observe that for Austria, Belgium, Greece, Spain, and Italy, the sign of the deviation changes between net and gross income. Below, we present a comparison of the stress test with inelastic retirement.
Figure B2 shows that the initial implicit bargaining power of retirees is higher relative to their population share when using net income compared to gross income. In Germany and France, retirees’ initial implicit bargaining power is close to their population share only when net income is used. In Ireland, the Netherlands, and Sweden, the results are the same for both gross and net income. To estimate how the implicit bargaining power of retirees evolves over time, we calculate the deviation from the baseline of retirees’ implicit bargaining power (with inelastic retirement). The evolution of this deviation, both in gross and net values, is shown in Figure B3. We observe a similar pattern for both gross income (left panel) and net income (right panel). The same grouping of countries emerges based on the sign and magnitude of the deviation from the baseline. Therefore, the stress test of the political sustainability of pension reforms across different countries is not sensitive to the choice between net and gross income.
Deviation of the implicit bargaining power of retirees from the baseline (gross vs. net) (a) Net Deviation. (b) Gross Deviation.

Appendix C. Implicit elasticity
The following figure demonstrates the implicit elasticity derived based on the variable bargaining power model under the assumption that the pension benefit in 2019 is the optimal solution in all the sample countries and elasticity is constant over time.
Implicit elasticity.

Appendix D. Automatic adjustment in the OECD
The table below outlines the types of AAMs implemented in the public pension schemes of various OECD countries.
Types of automatic adjustment mechanisms in the OECD
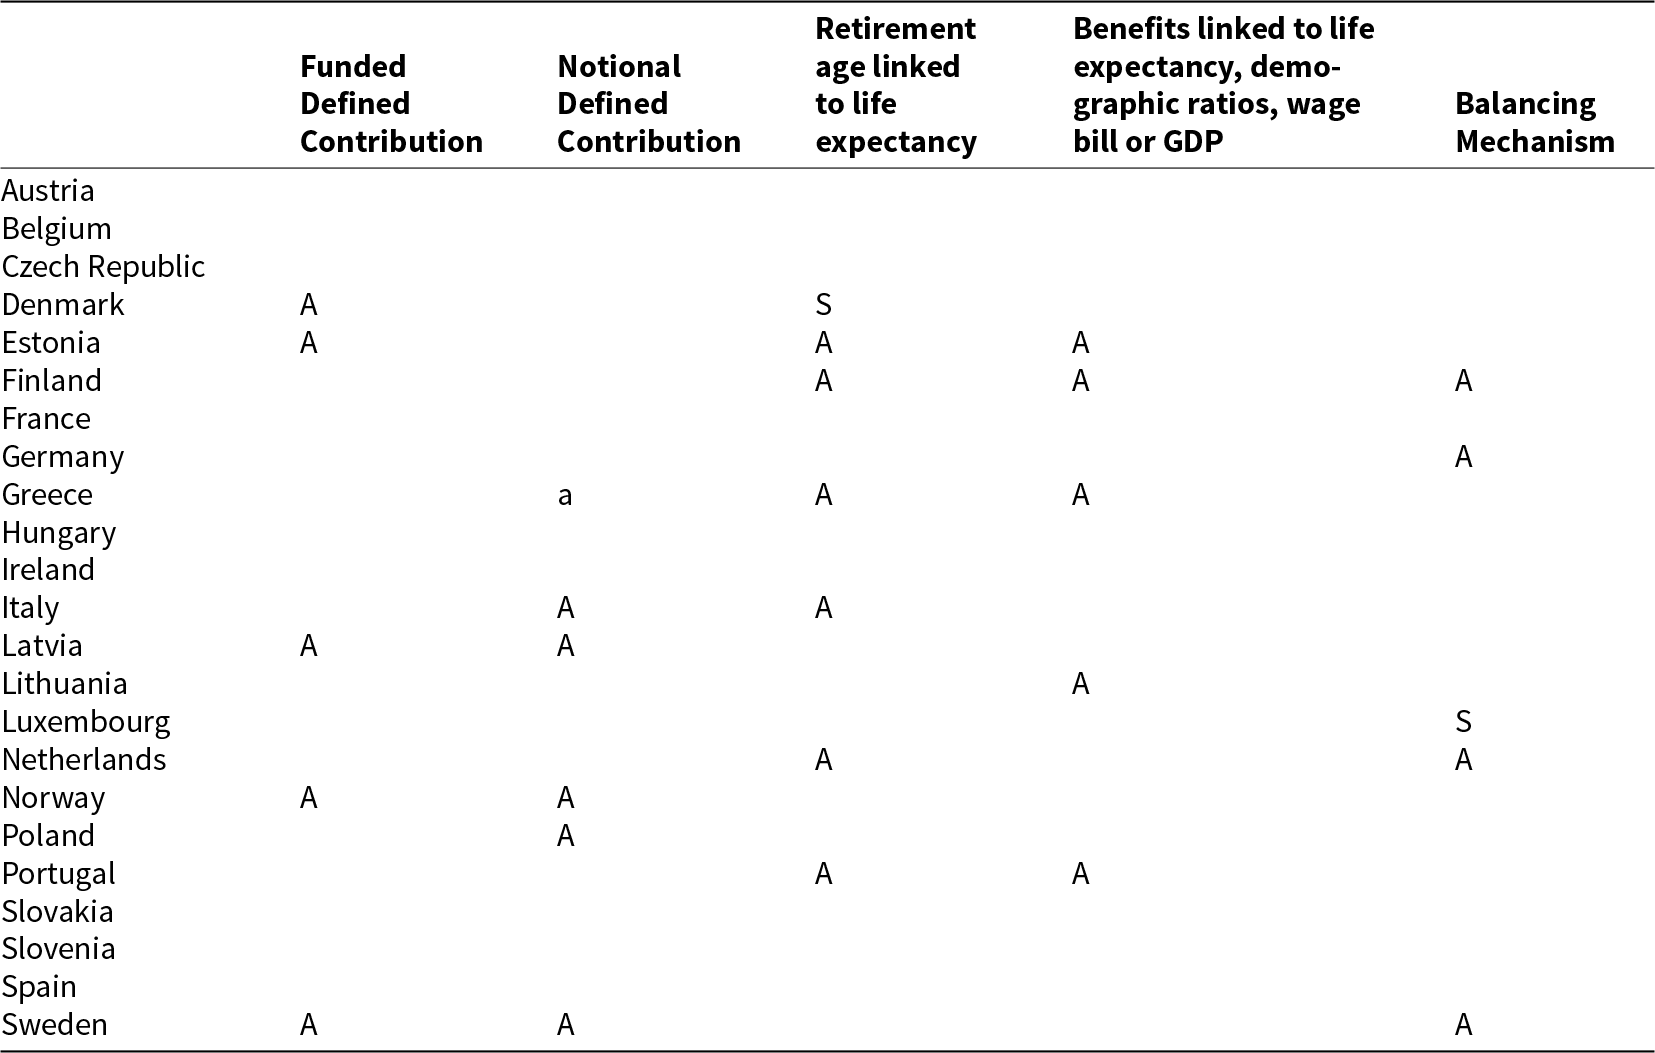
Source: OECD Pensions at a Glance 2021.
Notes: A = fully automatic adjustment; S = semi-automatic adjustment (adjustment requires political approval each time in order to be activated). a = The NDC scheme in Greece applies to auxiliary pensions, which account for 12% of total public pension expenditure.

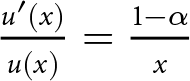
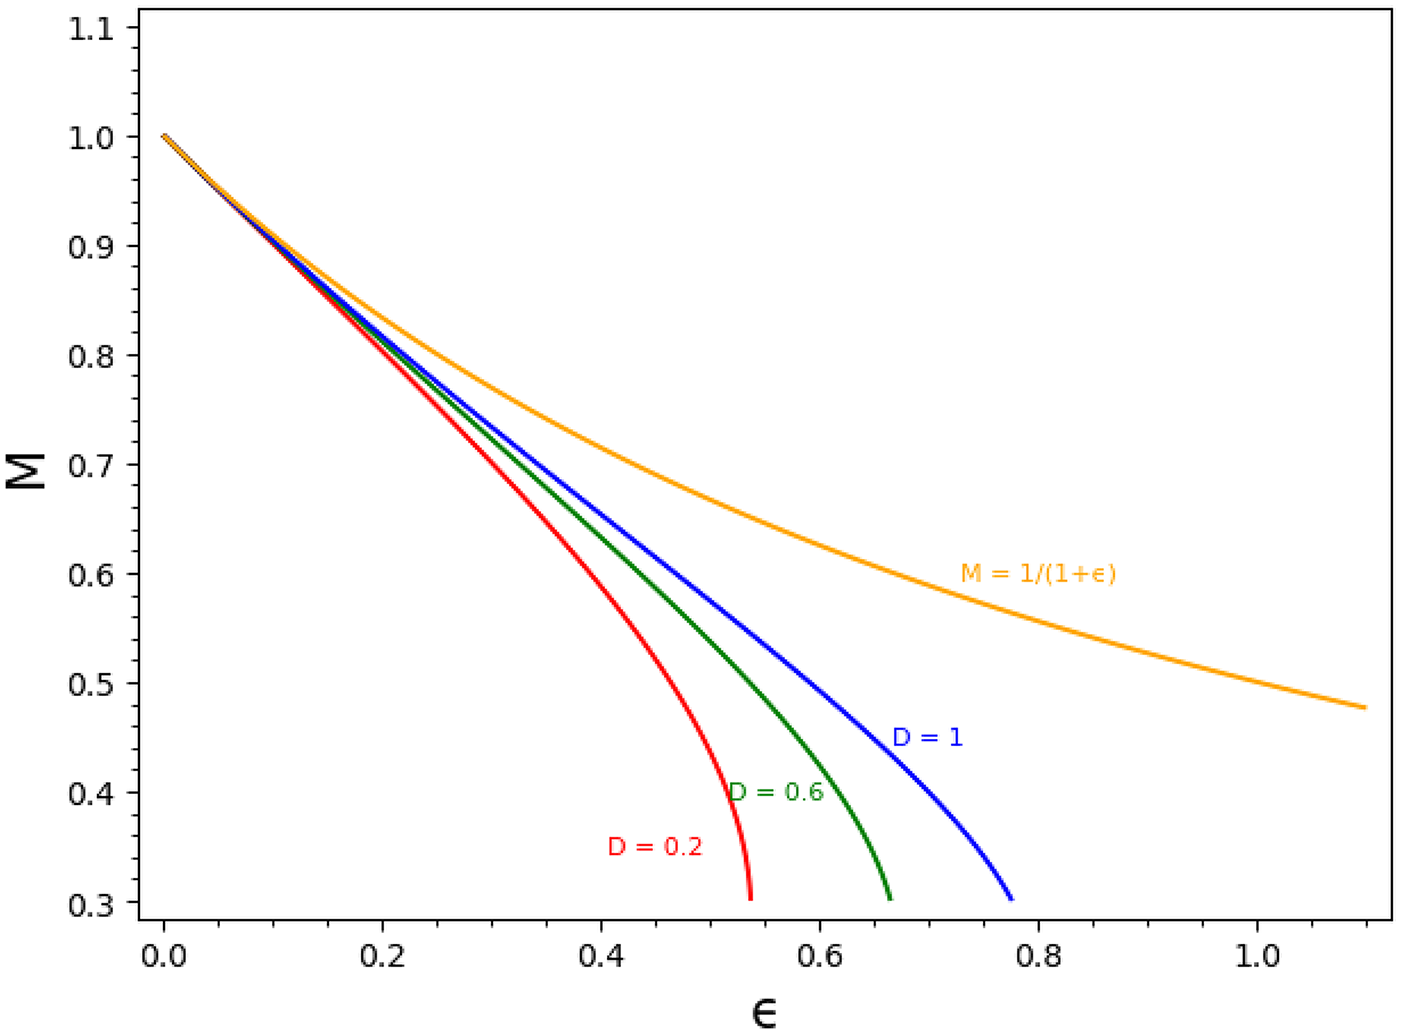
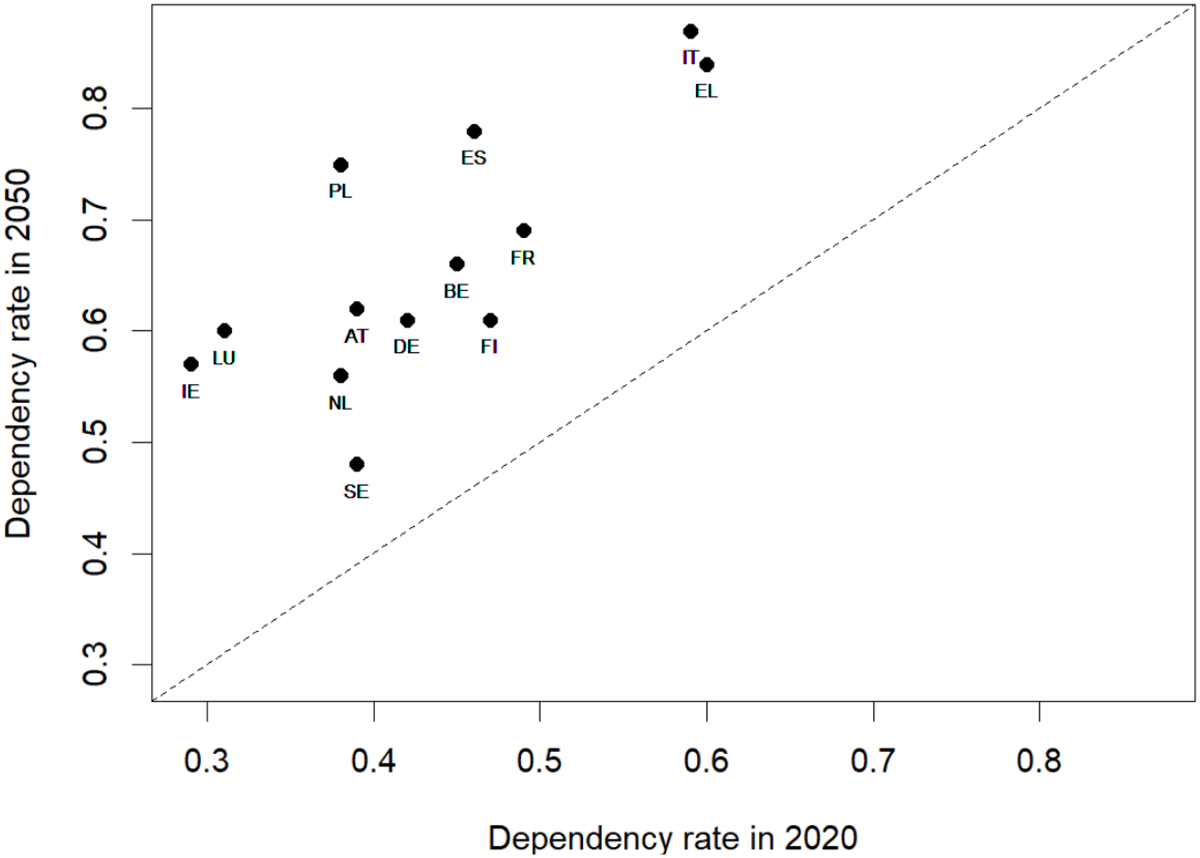

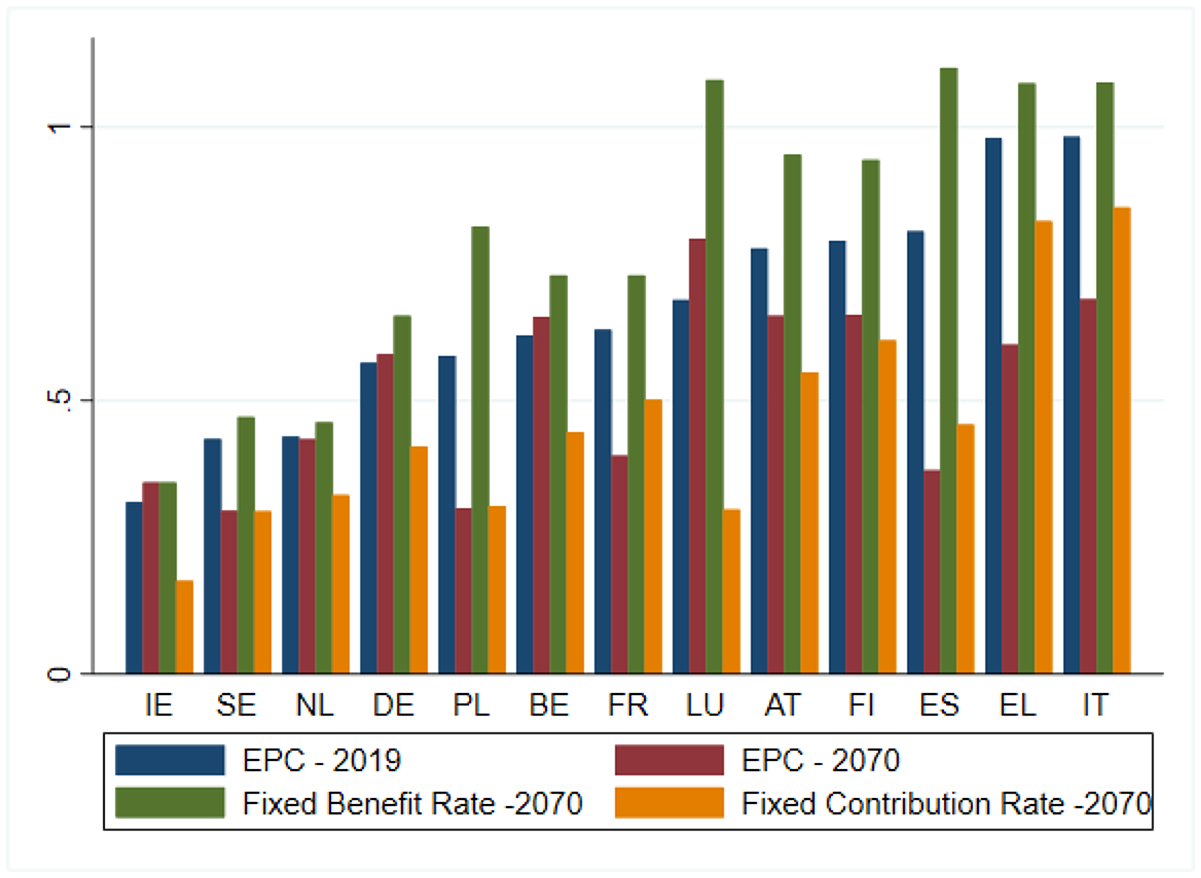
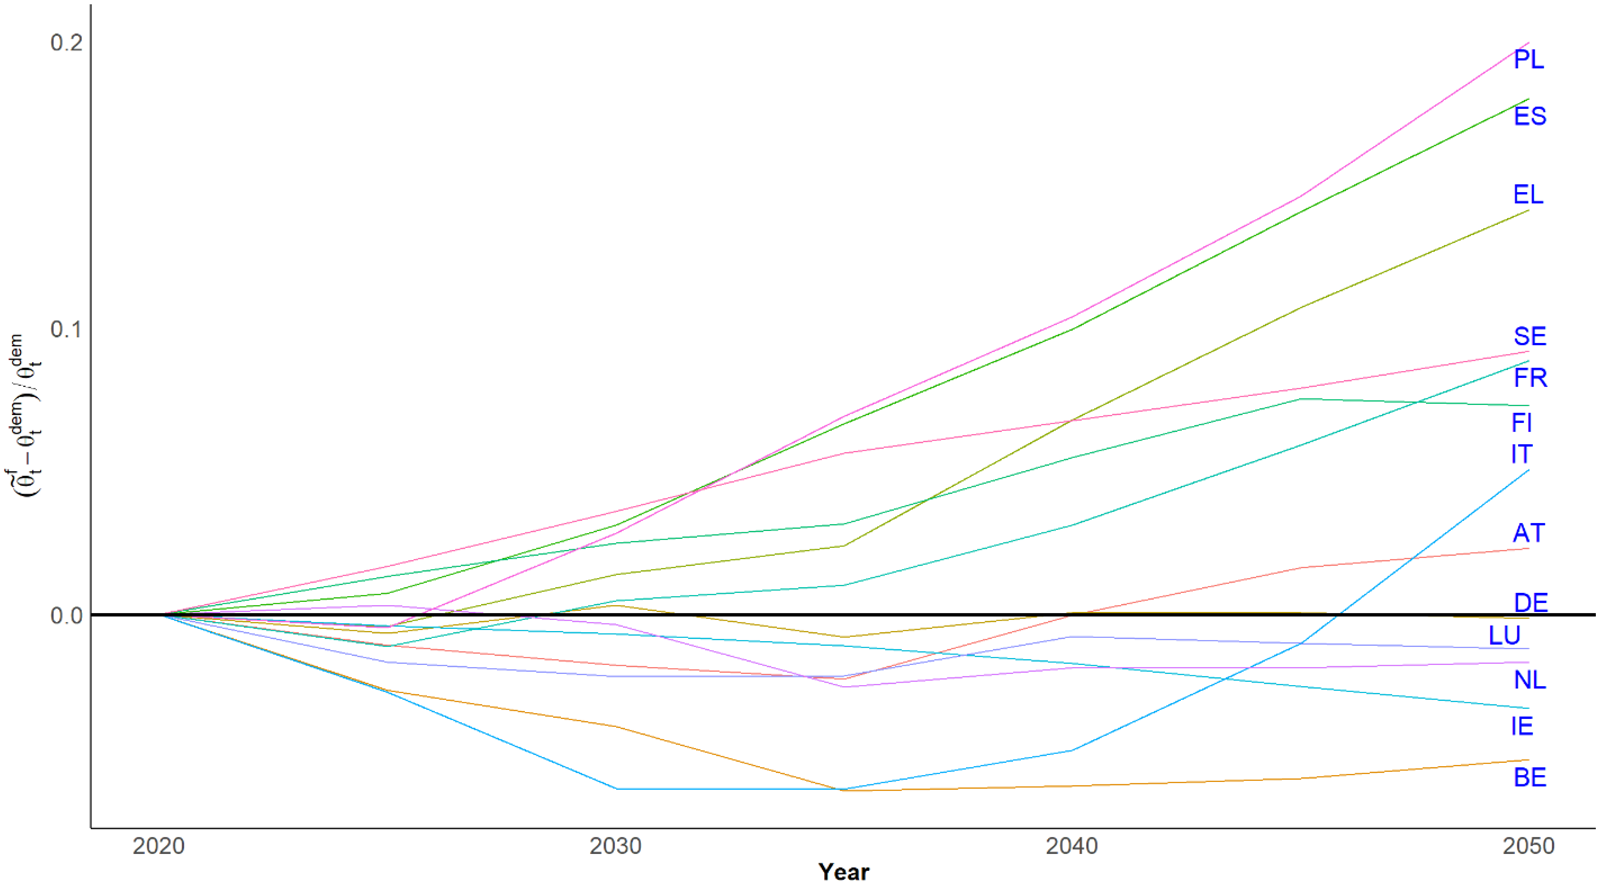

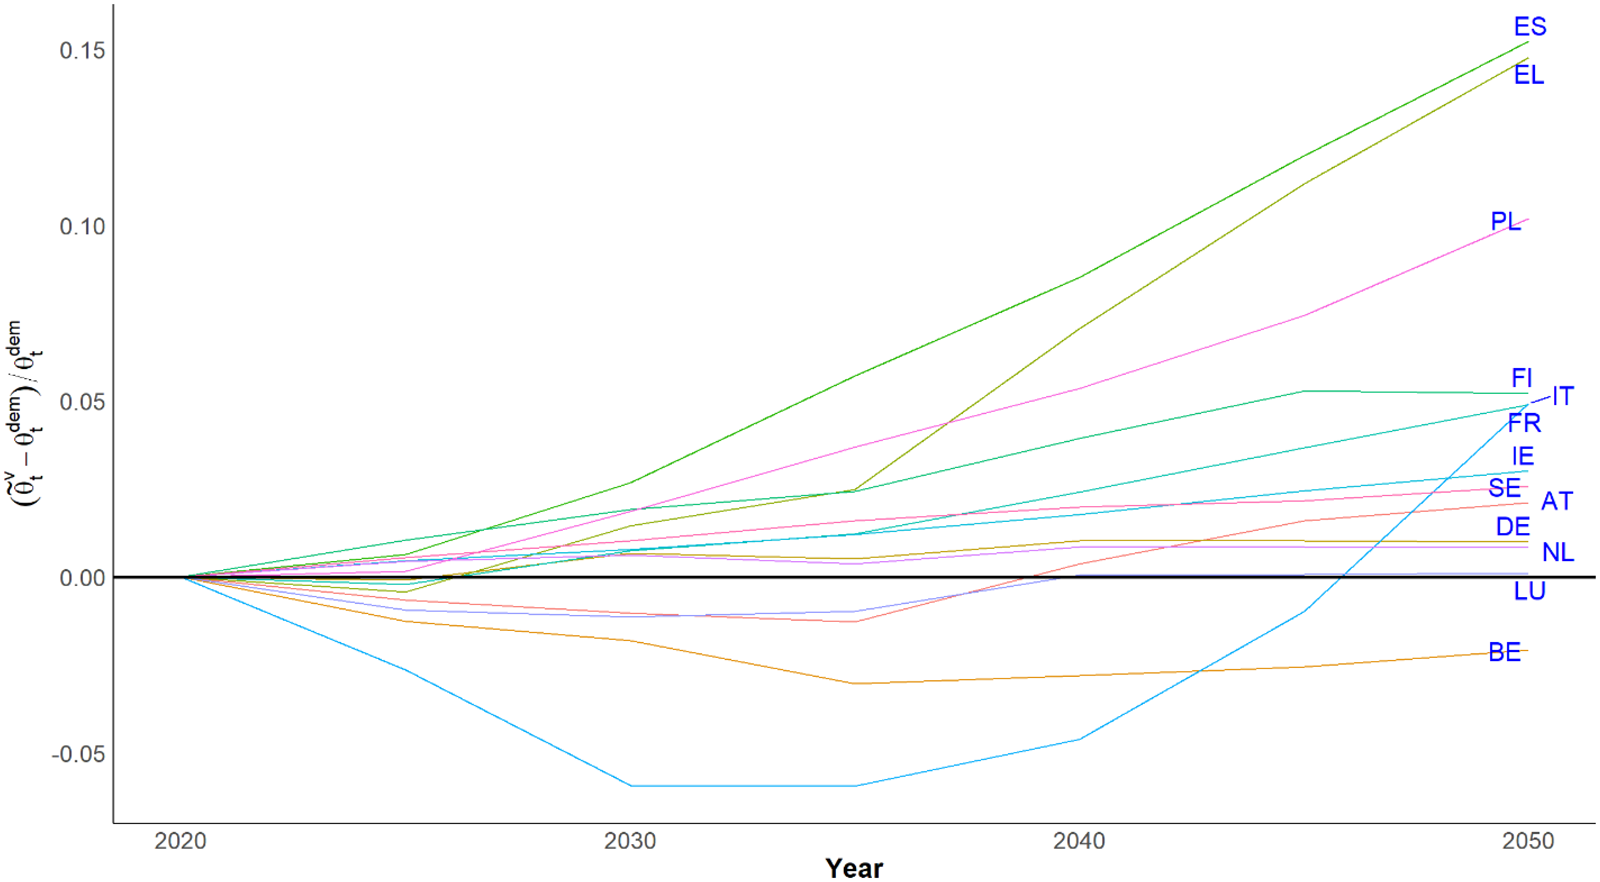

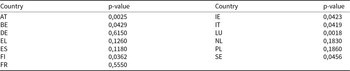


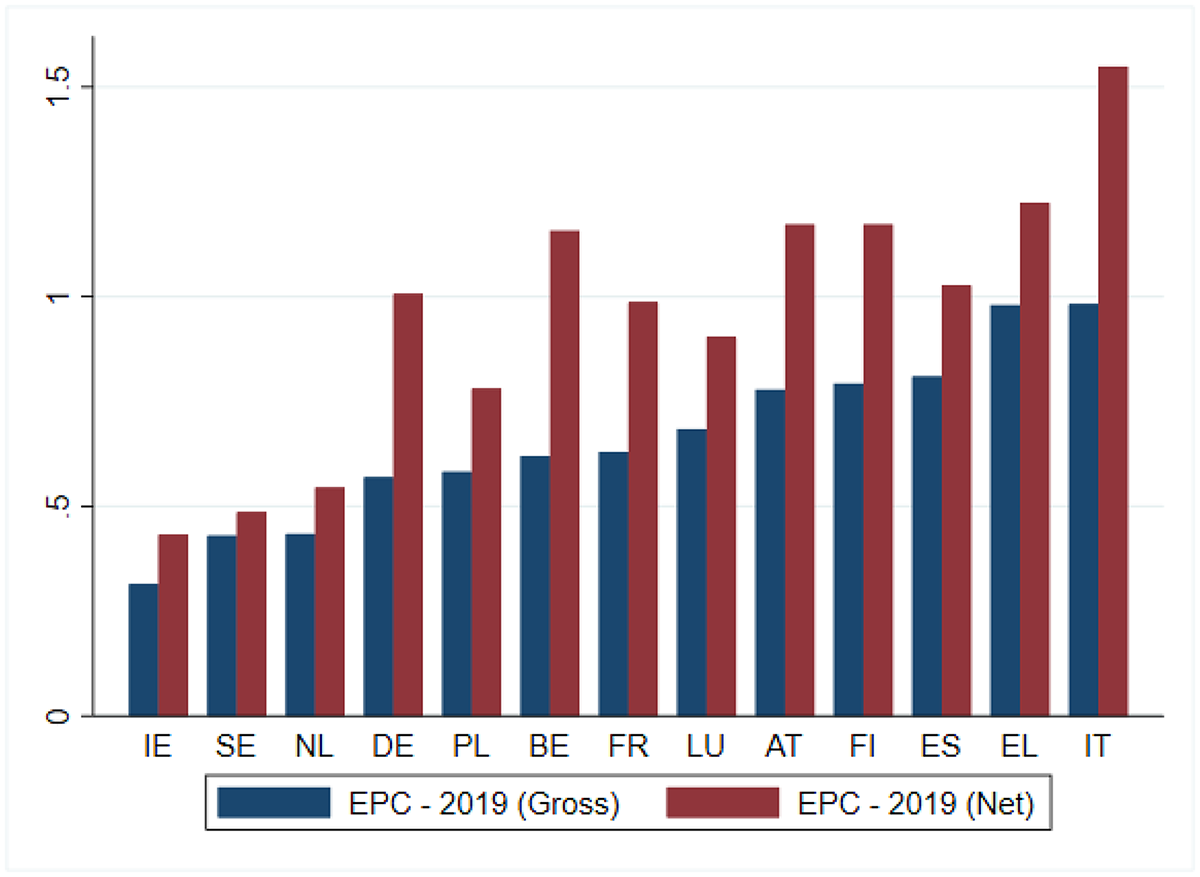
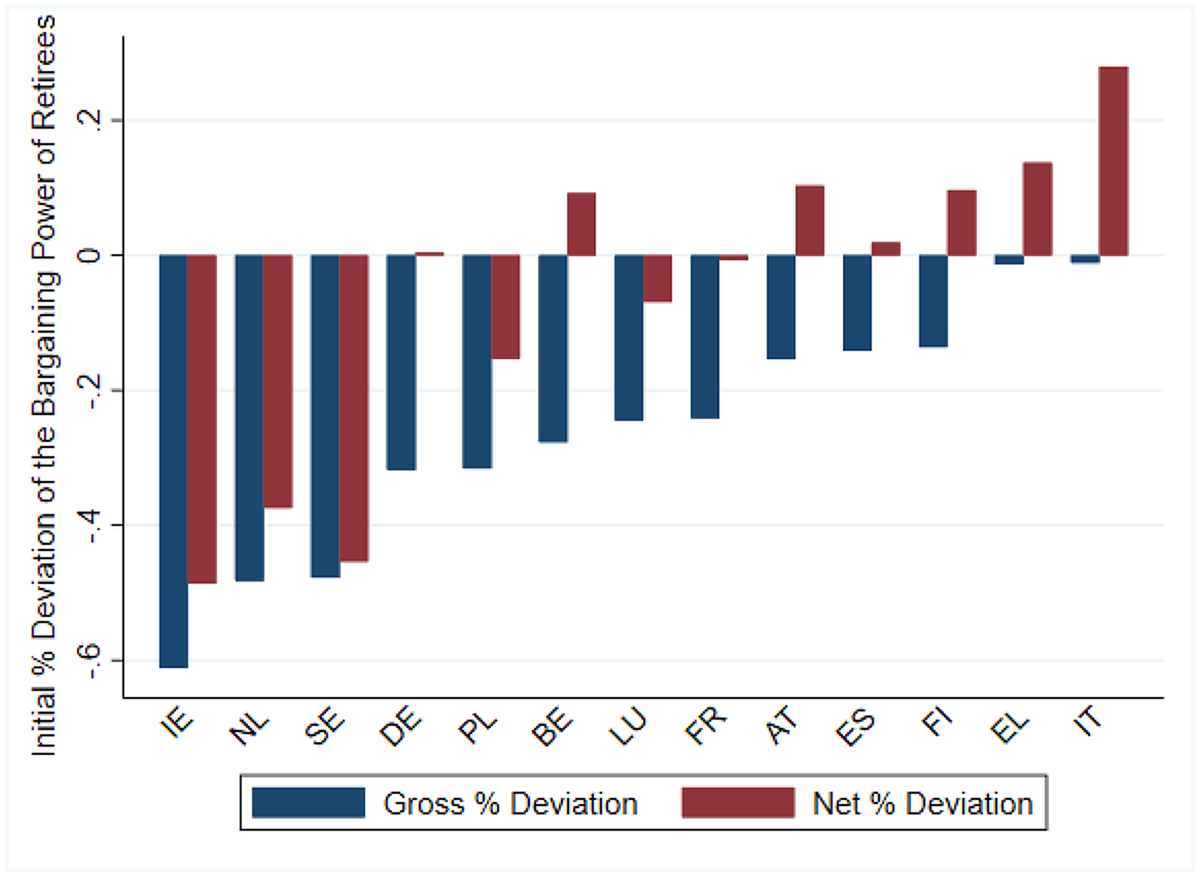

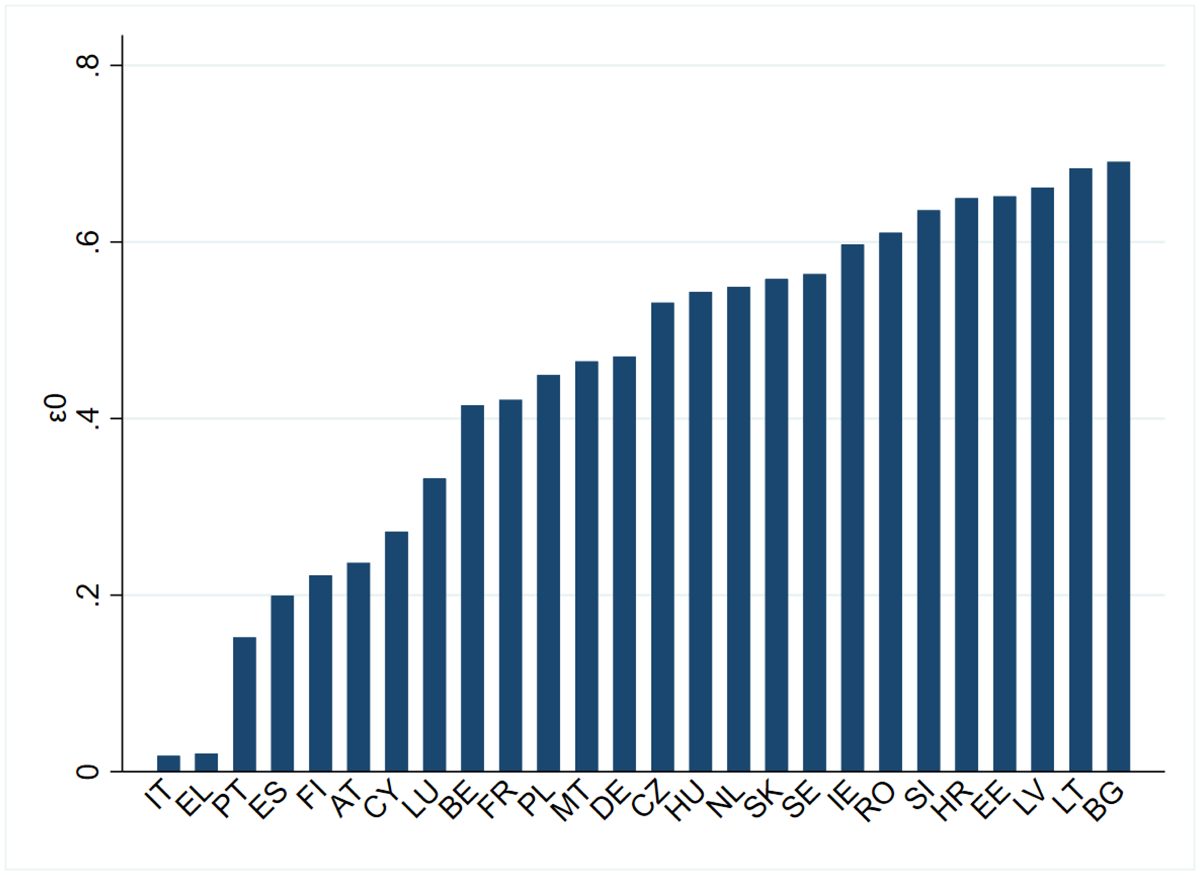
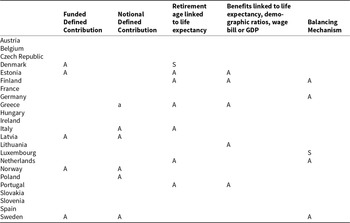

 Open access