


Non-technical Summary
Some marine reptiles from the Mesozoic, such as ichthyosaurs, plesiosaurs, and metriorhynchids, were capable of reaching elevated body temperatures, and some could maintain body temperatures a few degrees above those of their marine environments, a characteristic similar to that observed in modern cetaceans. Nevertheless, the estimation of their body temperatures from the chemical oxygen signatures of their fossil remains (bones and teeth) is accompanied by uncertainties associated with the chemical oxygen signatures of the surrounding water and the mineralization processes of the bones and teeth. In this study, new data were collected from four ichthyosaurs, three plesiosaurs, and one metriorhynchid in order to gain a deeper understanding of the mechanisms by which these marine reptiles were able to maintain body temperatures higher than those of their environments. The chemical signatures of oxygen in the bones and teeth of the specimens did not exhibit any discernible patterns indicative of specific zones of heat production or loss, unlike what has been observed in modern marine vertebrates. Concurrently, we reassessed the estimated body temperatures of these marine reptiles, thereby corroborating the hypothesis that ichthyosaurs were homeothermic endotherms. Conversely, our new estimates suggest that plesiosaurs were likely poikilothermic endotherms, whereas metriorhynchids were probably also poikilothermic endotherms but with a limited capacity for heat production. Finally, the narrow range of body temperatures maintained by ichthyosaurs indicates that the oxygen chemical signatures of fossilized remains could serve as valuable markers for reconstructing variations in the oxygen isotope composition of the Mesozoic oceans, paving the way to enhance our understanding of the environment and climate of this period in Earth’s history.
Introduction
During the Mesozoic Era (251.9 to 66.0 Ma), marine reptiles such as ichthyosaurs, plesiosaurs, and metriorhynchids were distributed worldwide and played a key role in the trophic networks. Paleobiogeographic (Kear Reference Kear2006b; Bardet et al. Reference Bardet, Falconnet, Fischer, Houssaye, Jouve, Suberbiola, Pérez-García, Rage and Vincent2014; Vavrek et al. Reference Vavrek, Wilhelm, Maxwell and Larsson2014; Delsett et al. Reference Delsett, Novis, Roberts, Koevoets, Hammer, Druckenmiller and Hurum2016; Rogov et al. Reference Rogov, Zverkov, Zakharov and Arkhangelsky2019; Zverkov et al. Reference Zverkov, Grigoriev and Danilov2021), osteo-histological (Ichthyosauria: de Buffrénil and Mazin Reference de Buffrénil and Mazin1989, Reference de Buffrénil and Mazin1990; Anderson et al. Reference Anderson, Druckenmiller, Erickson and Maxwell2019; Plesiosauria: Wiffen et al. Reference Wiffen, De Buffrénil, De Ricqlès and Mazin1995; Delsett and Hurum Reference Delsett and Hurum2012; Fleischle et al. Reference Fleischle, Wintrich and Sander2018), geochemical (Bernard et al. Reference Bernard, Lécuyer, Vincent, Amiot, Bardet, Buffetaut and Cuny2010; Séon et al. Reference Séon, Amiot, Martin, Young, Middleton, Fourel, Picot, Valentin and Lécuyer2020; Leuzinger et al. Reference Leuzinger, Kocsis, Luz, Vennemann, Ulyanov and Fernández2023), and modeling studies (Brice and Grigg Reference Brice, Grigg, Ballard and Farlow2023) all indicate that Ichthyosauria Blainville, Reference Blainville1835 and Plesiosauria Blainville, Reference Blainville1835 were endothermic and probably homeothermic organisms, much like extant Cetacea Brisson, Reference Brisson1762. They would have been able to produce enough body heat to raise their body temperatures above those of the environments in which they lived (Bernard et al. Reference Bernard, Lécuyer, Vincent, Amiot, Bardet, Buffetaut and Cuny2010; Séon et al. Reference Séon, Amiot, Martin, Young, Middleton, Fourel, Picot, Valentin and Lécuyer2020; Leuzinger et al. Reference Leuzinger, Kocsis, Luz, Vennemann, Ulyanov and Fernández2023). High and constant body temperature in Ichthyosauria would have been facilitated by their fusiform morphology favoring heat retention and the presence of a layer of fibroadipose tissue surrounding the trunk (Lindgren et al. Reference Lindgren, Sjövall, Thiel, Zheng, Ito, Wakamatsu, Hauff, Kear, Engdahl and Alwmark2018; Delsett et al. Reference Delsett, Friis, Kölbl-Ebert and Hurum2022). Evidence for adipose tissue is lacking for Plesiosauria, for which very few specimens preserving soft tissues have been found (Vincent et al. Reference Vincent, Allemand, Taylor, Suan and Maxwell2017). Thermophysiological studies of Metriorhynchidae Fitzinger, Reference Fitzinger1843, a group of fully aquatic marine Mesozoic crocodylomorphs, have not led to a consensus. The fossil occurrences confined to tropical paleolatitudes (Bardet et al. Reference Bardet, Falconnet, Fischer, Houssaye, Jouve, Suberbiola, Pérez-García, Rage and Vincent2014) and the osteo-histological findings from studies by Hua and de Buffrénil (Reference Hua and de Buffrénil1996) and de Buffrénil et al. (Reference de Buffrénil, Laurin, Jouve, de Buffrénil, de Ricqlès, Zylberberg and Padian2021) suggested that Metriorhynchidae had an ectothermic poikilothermic thermoregulatory strategy similar to that of modern crocodylomorphs. Conversely, the oxygen isotope analyses of Séon et al. (Reference Séon, Amiot, Martin, Young, Middleton, Fourel, Picot, Valentin and Lécuyer2020) suggested that Metriorhynchidae were able to raise their body temperatures a few degrees above that of the ambient environment by metabolic heat production but could not maintain a constant body temperature, indicating they were poikilothermic endotherms like extant tunas (Block and Finnerty Reference Block and Finnerty1994; Graham and Dickson Reference Graham and Dickson2004).
Previous estimates of body temperature reconstruction of Ichthyosauria, Plesiosauria, and Metriorhynchidae, calculated from the phosphate oxygen isotope composition of the bioapatite of their bones and teeth (δ18Op), assumed a constant global oceanic δ18O value (δ18Osw) of −1 ± 1‰ (Bernard et al. Reference Bernard, Lécuyer, Vincent, Amiot, Bardet, Buffetaut and Cuny2010; Séon et al. Reference Séon, Amiot, Martin, Young, Middleton, Fourel, Picot, Valentin and Lécuyer2020; Leuzinger et al. Reference Leuzinger, Kocsis, Luz, Vennemann, Ulyanov and Fernández2023; Supplementary Information 1 for details about isotope-based body temperature estimations), an oversimplified assumption given latitudinal gradients in δ18Osw values recorded in Jurassic and Cretaceous seas (Alberti et al. Reference Alberti, Fürsich, Abdelhady and Andersen2017, Reference Alberti, Leshno, Fürsich, Edelman-Furstenberg, Andersen and Garbe-Schönberg2020; Letulle et al. Reference Letulle, Suan, Daëron, Rogov, Lécuyer, Vinçon-Laugier, Reynard, Montagnac, Lutikov and Schlögl2022). Furthermore, recent work has shown that the oxygen isotope compositions of body water from extant air-breathing fully marine species—Orcinus orca Linnæus, Reference Linnæus1758, Tursiops truncatus Montagu, Reference Montagu1821 (Séon et al. Reference Séon, Brasseur, Scala, Tacail, Catteau, Fourel and Vincent2023), and Caretta caretta Linnæus, Reference Linnæus1758 (Séon Reference Séon2023)—are less 18O-enriched relative to their drinking water than that of semiaquatic vertebrates (crocodiles, turtles) used previously to reconstruct body temperatures of extinct marine reptiles (Bernard et al. Reference Bernard, Lécuyer, Vincent, Amiot, Bardet, Buffetaut and Cuny2010; Séon et al. Reference Séon, Amiot, Martin, Young, Middleton, Fourel, Picot, Valentin and Lécuyer2020; Leuzinger et al. Reference Leuzinger, Kocsis, Luz, Vennemann, Ulyanov and Fernández2023).
Previous osteo-histological and geochemical studies were exclusively based on isolated teeth or bone remains (de Buffrénil and Mazin Reference de Buffrénil and Mazin1990; Bernard et al. Reference Bernard, Lécuyer, Vincent, Amiot, Bardet, Buffetaut and Cuny2010; Fleischle et al. Reference Fleischle, Wintrich and Sander2018; Séon et al. Reference Séon, Amiot, Martin, Young, Middleton, Fourel, Picot, Valentin and Lécuyer2020) and thus provided only partial information on the thermoregulation of Ichthyosauria, Plesiosauria, and Metriorhynchidae. A key aspect of thermophysiology is to define how constant body temperature is at the level of vital organs (homeotherm vs. poikilotherm; Clarke and Pörtner Reference Clarke and Pörtner2010; Furukawa et al. Reference Furukawa, Chiang, Watanabe, Hung, Lin, Yeh, Wang, Tone and Kawabe2015; Lovegrove Reference Lovegrove2017) and the distribution of body temperature within the body, known as regional heterothermies (Irving and Hart Reference Irving and Hart1957; Folkow and Blix Reference Folkow and Blix1987; Favilla et al. Reference Favilla, Horning and Costa2022). An investigation into the mechanisms employed by Ichthyosauria, Plesiosauria, and Metriorhynchidae to regulate their body temperatures allows for an understanding of their adaptation to their environments and the explanation of their stratigraphic occurrences in the fossil record in view of fluctuating environmental temperatures during the Mesozoic (Takashima et al. Reference Takashima, Nishi, Huber and Leckie2006; Dera et al. Reference Dera, Brigaud, Monna, Laffont, Pucéat, Deconinck, Pellenard, Joachimski and Durlet2011; Wierzbowski et al. Reference Wierzbowski, Rogov, Matyja, Kiselev and Ippolitov2013). Such climate changes do not seem to have affected their diversity (Bardet Reference Bardet1994; Martin et al. Reference Martin, Amiot, Lécuyer and Benton2014; Stubbs and Benton Reference Stubbs and Benton2016). Moreover, precisely defining their thermoregulatory strategies opens the way to investigating their behavior. For instance, homeothermic endotherms are typically active organisms, as they are fully independent of the temperatures of their environments. Nevertheless, this requires a significant energy input (Clarke and Pörtner Reference Clarke and Pörtner2010). Conversely, some species that are considered to be regional endotherms can produce heat locally, which can result in temperature heterogeneities or regional heterothermies (Carey Reference Carey1982; Block Reference Block1986; Dickson and Graham Reference Dickson and Graham2004; Graham and Dickson Reference Graham and Dickson2004). In swordfish, for example, the heat production located close to the eyes improves visual acuity in foraging cold environments of great depth (Block Reference Block1987; Fritsches et al. Reference Fritsches, Brill and Warrant2005), whereas heat production in locomotory muscles of tunas and lamnid sharks enables them to swim faster or migrate over longer distances than poikilothermic ectothermic organisms (Blank et al. Reference Blank, Morrissette, Farwell, Price, Schallert and Block2007; Bernal et al. Reference Bernal, Carlson, Goldman and Lowe2012; Watanabe et al. Reference Watanabe, Goldman, Caselle, Chapman and Papastamatiou2015; Harding et al. Reference Harding, Jackson, Barnett, Donohue, Halsey, Huveneers and Meyer2021). The mapping of intraindividual temperature variations, and thus regional heterothermies, through the use of oxygen isotopes enables the identification of heat-producing zones within an organism, in addition to the delineation of thermal windows, the preferred sites for heat loss, which serve to regulate body temperature (Séon et al. Reference Séon, Amiot, Suan, Lécuyer, Fourel, Demaret, Vinçon-Laugier, Charbonnier and Vincent2022, Reference Séon, Amiot, Suan, Lécuyer, Fourel, Vinçon-Laugier, Charbonnier and Vincent2024).
In this study, we performed an oxygen isotope analysis of 239 bones and 8 teeth from complete or subcomplete specimens, enabling the first evaluation of possible regional heterothermies within the bodies of ichthyosaurs, plesiosaurs, and metriorhynchids. We also reassessed body temperature estimates of Ichthyosauria, Plesiosauria, and Metriorhynchidae using new and published δ18Op tooth data and an 18O-enrichment of fully aquatic animals and considering a global δ18Osw gradient for the Jurassic and Cretaceous seas.
Institutional Abbreviations. MHNLM, Muséum d’Histoire Naturelle Le Mans; MPV, Musée Paléontologique de Villers-sur-Mer; PMO, Palaeontological collections of the Natural History Museum, University of Oslo, Norway.
Material and Methods
Sampled Specimens
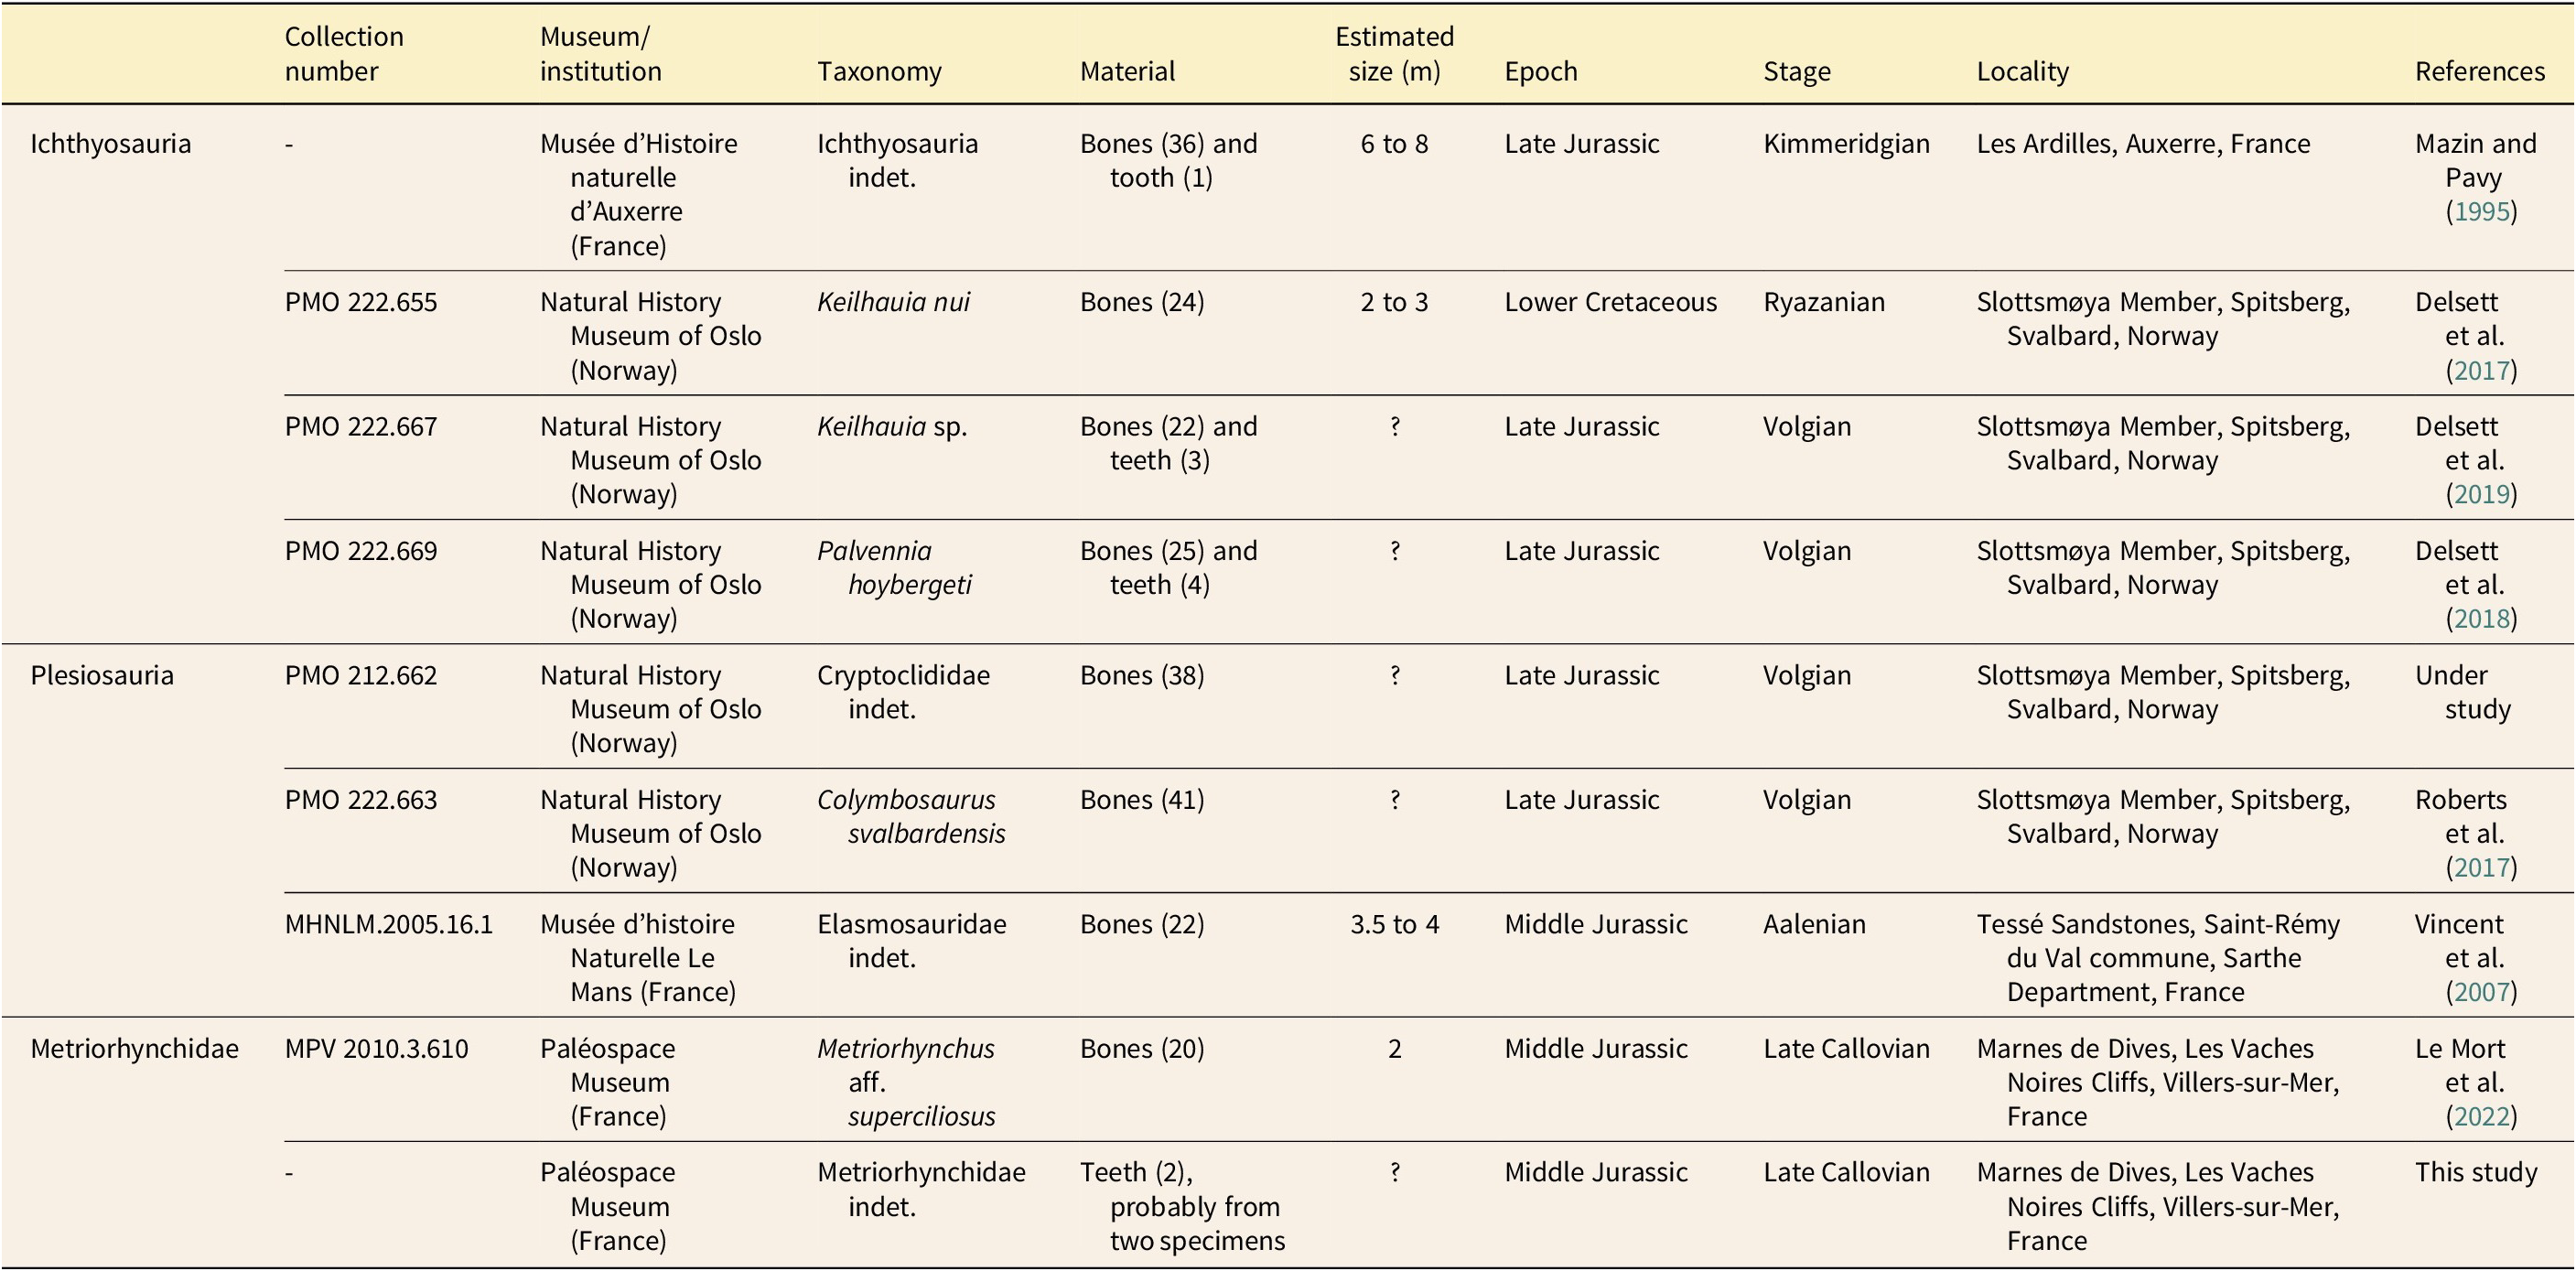
Specimens of four Ichthyosauria, three Plesiosauria, and one Metriorhynchidae were sampled for their intraskeletal δ18Op variability; taxonomic affiliation, collection number, size estimate, stratigraphic age, locality, and type of sampled material for each marine reptile specimen are reported in Table 1. In addition to these complete and subcomplete specimens, two teeth of Metriorhynchidae indet. specimens from the Marnes de Dives Formation (late Callovian, Les Vaches Noires Cliffs, France) were sampled for their δ18Op values to reassess metriorhynchid body temperatures (Table 1), as well as a pachycormid fish tooth belonging to Hypsocormus Wagner, 1863 recovered from the same stratigraphic layer as the Ichthyosauria indet. specimen from Les Ardilles (Kimmeridgian, Auxerre, France) to determine the oceanic paleotemperature of this deposit. Overall preservation and appearance of the studied specimens vary between the localities. The Ichthyosauria indet. specimen from Les Ardilles (France) is slightly deformed and marked by numerous fractures secondarily filled with calcite (Mazin and Pavy Reference Mazin and Pavy1995). The skeletal remains of the specimen of Metriorhynchus aff. superciliosus from Les Vaches Noires Cliffs (France) seem to have been little affected by compaction, except for the skull, which shows a few cracks with surface recrystallization (Le Mort et al. Reference Le Mort, Martin, Picot and Hua2022). The ichthyosaurs (PMO 222.655, PMO 222.667, PMO 222.669) and plesiosaurs (PMO 212.662, PMO 222.663) from the Slottsmøya Member (Spitsbergen) are partly eroded, probably by the action of suspended particles and sediments transported by bottom currents (Martill Reference Martill1985; Reisdorf et al. Reference Reisdorf, Bux, Wyler, Benecke, Klug, Maisch, Fornaro and Wetzel2012) and show recrystallizations of calcite and barite in the pores of the skeletal elements (Kihle et al. Reference Kihle, Hurum and Liebe2012; Delsett et al. Reference Delsett, Novis, Roberts, Koevoets, Hammer, Druckenmiller and Hurum2016). The skeletal remains are also for the most part highly fractured, partly due to local faults within the deposit and to frost weathering. For instance, the specimen of Keilhauia nui (PMO 222.655) was crossed by large fractures (Delsett et al. Reference Delsett, Roberts, Druckenmiller and Hurum2017). Its skeletal elements are particularly fractured and have a sandy appearance.
Summary of information from Ichthyosauria, Plesiosauria, and Metriorhynchidae specimens sampled.

Sampling Method
Approximately 40 mg of each skeletal element and tooth were ground to fine powder using a Dremel micro-drill equipped with a diamond-studded drill bit; cortical bone was selected to maximize the chances of preserving a biological isotopic record. Skeletal elements of complete and subcomplete specimens were grouped in five categories, as follows: “Skull” groups all the bone forming the skull and the mandible; “Cervical region” groups the cervical vertebra only in Plesiosauria; “Dorsal region” groups the dorsal vertebrae, ribs, and skeletal elements forming the pectoral and pelvic girdles; “Caudal region” groups the caudal vertebrae; and “Appendicular region” groups the humerus, femur, radius, ulna, tibia, fibula, metacarpals, metatarsals, phalanges, and accessory bone elements located in the limbs. For the specimen of Colymbosaurus svalbardensis (PMO 222.663), the “Appendicular region” was split into anterior right limb (ARL), anterior left limb (ALL), posterior right limb (PRL), and posterior left limb (PLL), as most of the elements were found in articulation (Delsett et al. Reference Delsett, Novis, Roberts, Koevoets, Hammer, Druckenmiller and Hurum2016). For Ichthyosauria and Metriorhynchus aff. superciliosus specimens, cervical vertebrae were included in the “Dorsal region.” A total of 247 skeletal elements and teeth were sampled, averaging about 20 and 40 samples per specimen. In addition to the bone and tooth samples, a sample of the recrystallization mineral observed in one dorsal vertebra from the Ichthyosauria indet. specimen from Les Ardilles was taken.
Bioapatite P2O5 Content and Phosphate Group Oxygen Isotope Analysis
Cortical bone and tooth powders (n = 247) were prepared using the wet chemical procedure detailed by Crowson et al. (Reference Crowson, Showers, Wright and Hoering1991) and modified by Lécuyer et al. (Reference Lécuyer, Grandjean, O’Neil, Cappetta and Martineau1993), which involves the isolation of phosphate ions (PO43−) from the bioapatite, which are then precipitated as silver phosphate crystals (Ag3PO4). For each sample, 20–30 mg of cortical bone or tooth enamel powder was dissolved in 2 ml of 2M HF. The CaF2 residue was separated by centrifugation, and the solution was neutralized by adding 2.2 ml of 2M KOH. Amberlite IRN78 anion-exchange resin beads were added to the solution to isolate the PO43− ions. After 24 h, the solution was removed, and the resin was rinsed with deionized water and eluted with 27.5 ml of 0.5M NH4NO3. After 4 h, the Amberlite IRN78 anion-exchange resin beads were removed from the solution. Then, 0.5 ml of NH4OH and 15 ml of an ammoniacal solution of AgNO3 were added, and the solutions were placed in a thermostatted bath at 70°C for 7 h, allowing the slow and quantitative precipitation of Ag3PO4 crystals. The Ag3PO4 crystals were filtered, dried, and cleaned. For each sample, the P2O5 content, a proxy for qualitatively estimating the dissolution of phosphate minerals of the mineralized skeletal elements bioapatite in fossil specimens (Nemliher et al. Reference Nemliher, Baturin, Kallaste and Murdmaa2004), was estimated. It was calculated from the recovered mass of silver phosphate (Ag3PO4) after the chemical purification of the samples and phosphate chemical yields obtained for the NIST SRM 120c standards (P2O5 = 33.34 wt%), assuming stoichiometric conversion of bioapatite phosphate ions into silver phosphate (Lécuyer et al. Reference Lécuyer, Bogey, Garcia, Grandjean, Barrat, Floquet, Bardet and Pereda-Superbiola2003).
For oxygen isotope composition measurements, five aliquots of 300 ± 20 μg of Ag3PO4 for each sample were mixed with 400 ± 50 μg of graphite in silver foil capsules. Oxygen isotope ratios were measured using a high-temperature vario PYRO cube elemental analyzer (EA), equipped with “purge and trap” technology (Fourel et al. Reference Fourel, Martineau, Lécuyer, Kupka, Lange, Ojeimi and Seed2011) and interfaced in continuous-flow mode to an IsoPrime isotope ratio mass spectrometer (Elementar UK, Cheadle, U.K.). To calibrate the measurements, the NBS 127 (barium sulfate precipitated from seawater from Monterey Bay, Calif., U.S.A., Sigma-Aldrich), and a silver phosphate precipitated from the international standards NIST SRM 120c (natural Miocene phosphorite from Florida, U.S.A., National Bureau of Standards) were used. The δ18O value for NBS 127 is fixed to the certified value of +9.3‰ Vienna Standard Mean Ocean Water (VSMOW; Hut Reference Hut1987; Halas and Szaran Reference Halas and Szaran2001) and that for NIST SRM 120c to +21.7‰ VSMOW according to Lécuyer et al. (Reference Lécuyer, Grandjean, O’Neil, Cappetta and Martineau1993), Chenery et al. (Reference Chenery, Müldner, Evans, Eckardt and Lewis2010), and Halas et al. (Reference Halas, Skrzypek, Meier‐Augenstein, Pelc and Kemp2011) for correction of instrumental mass fractionation during CO isotope analysis. Along with the silver phosphate samples derived from bone and tooth bioapatite, silver phosphates precipitated from standard NIST SRM 120c were repeatedly analyzed (δ18Op = 21.7 ± 0.3‰, n = 59) to ensure that no isotope fractionation occurred during the wet chemistry. Values are reported as delta per mille values expressed with respect to VSMOW.
Oxygen and Carbon Isotope Analysis of Bioapatite Carbonate and Carbonate Content
Bone and tooth powders (n = 71) were pretreated to measure the oxygen and carbon isotope compositions of the carbonate group of the bone bioapatite (Plesiosauria: n = 40; Ichthyosauria: n = 29, Metriorhynchus aff. superciliosus: n = 1; and pachycormid fish tooth of Hypsocormus sp.: n = 1). The protocol used was that of Koch et al. (Reference Koch, Tuross and Fogel1997) and consisted of removing organic matter through a chemical reaction between bone powder and 0.4 ml of 2% sodium hypochlorite (NaOCl) for 24 h (0.4 ml NaClO per 10 mg of bone powder). The solution was centrifuged and rinsed three times with ultrapure water before 0.1 M acetic acid (CH3COOH) was added for 24 h to remove any secondary carbonates that may have precipitated during the organic removal procedure. The solution was again centrifuged and rinsed three times. Then, the powders were dried at 50°C for 48 h before being collected. For each sample, three replicates of 2 mg were weighed into 3.7 ml round-bottomed glass vials and sealed (Exetainer, LABCO UK, Lampeter, Wales, U.K.). Oxygen (δ18Oc) and carbon (δ13Cc) isotope composition of the carbonate group of bone and tooth bioapatite was measured using an isoFLOW-type preparation system (Elementar GmbH, Germany) connected in continuous flow to a precisION isotope ratio mass spectrometer (Elementar UK). Each of the pretreated samples was reacted with saturated anhydrous phosphoric acid (H3PO4) prepared according to the protocol of McCrea (Reference McCrea1950). The reaction took place at a constant temperature of 90°C. The CO2 generated during acid digestion of the carbonate sample was then transferred to the mass spectrometer. Carbonate content (CO32− %wt) of the bioapatite samples was measured based on the peak area of CO2 detected by the mass spectrometer. Isotope measurements were corrected for instrumental drift and calibrated using two calcite isotopic standards: a Carrara marble (laboratory standard) with values of δ18OVPDB = −1.84‰ and δ13CVPDB = +2.03‰ (Fourel et al. Reference Fourel, Martineau, Tóth, Görög, Escarguel and Lécuyer2015) and the NBS18 (international standard), whose values are δ18OVPDB = −23.2‰ and δ13CVPDB = −5.01‰ (Friedman et al. Reference Friedman, O’Neil and Cebula1982; Hut Reference Hut1987; Coplen et al. Reference Coplen, Brand, Gehre, Gröning, Meijer, Toman and Verkouteren2006); as well as NIST SRM 120c, whose values are δ18OVPDB= −1.13‰ and δ13CVPDB = −6.27‰ (Passey et al. Reference Passey, Cerling and Levin2007). For bone and tooth apatite, the acid fractionation factor α(CO2–apatite carbonate) of 1.00773 determined for the NIST SRM 120c phosphate rock reference material was selected (Passey et al. Reference Passey, Cerling and Levin2007). Values are reported as delta per mille values expressed with respect to VSMOW for oxygen and Vienna Pee Dee Belemnite (VPDB) for carbon.
Raman Spectroscopy
Characterization of the mineralogical composition of the samples was carried out using an XploRA Raman microscope equipped with a diode-pumped Nd:YAG laser at 532 nm. For each sample analyzed (n = 84), 10 spectra of 10 s were acquired at 100× magnification. The scattered light was detected in the range of 150 and 2000 cm−1. The first-order band of a pure silicon reference material at 520.7 cm−1 was used to calibrate the spectrometer before each measurement. The full width at half maximum (FWHM) and the position of the ν1(PO43−) fully symmetric stretching band were measured to obtain information on the mineralogical composition and crystal structure of bioapatite (Pucéat et al. Reference Pucéat, Reynard and Lécuyer2004; Thomas et al. Reference Thomas, Fordyce, Frew and Gordon2007, Reference Thomas, McGoverin, Fordyce, Frew and Gordon2011; Dal Sasso et al. Reference Dal Sasso, Angelini, Maritan and Artioli2018; Barthel et al. Reference Barthel, Fougerouse, Geisler and Rust2020; Kral et al. Reference Kral, Lagos, Guagliardo, Tütken and Geisler2022).
Body Temperature Estimates
Body temperatures of Ichthyosauria, Plesiosauria, and Metriorhynchidae were re-estimated from published tooth δ18Op values (Anderson et al. Reference Anderson, Popp, Williams, Ho and Hudson1994; Bernard et al. Reference Bernard, Lécuyer, Vincent, Amiot, Bardet, Buffetaut and Cuny2010; Séon et al. Reference Séon, Amiot, Martin, Young, Middleton, Fourel, Picot, Valentin and Lécuyer2020) as well as newly measured values from two teeth belonging to specimens of Metriorhynchidae indet. from Les Vaches Noires Cliffs (late Callovian, Villers-sur-Mer, France) and the teeth from the three specimens of ichthyosaur referred to as Palvennia hoybergeti (PMO 222.669), Keilhauia sp. (PMO 222.667), and Ichthyosauria indet. from Les Ardilles. The equation published by Lécuyer et al. (Reference Lécuyer, Amiot, Touzeau and Trotter2013), adapted for air-breathing vertebrates, was used and an average 18O-enrichment of +0.8 ± 0.9‰, for air-breathing fully aquatic marine vertebrates was applied (Séon et al. Reference Séon2023). Paleolatitudes were reconstructed using the software developed by van Hinsbergen et al. (Reference van Hinsbergen, De Groot, van Schaik, Spakman, Bijl, Sluijs, Langereis and Brinkhuis2015) and then used for the estimation of the δ18Osw values from the equation published by Alberti et al. (Reference Alberti, Leshno, Fürsich, Edelman-Furstenberg, Andersen and Garbe-Schönberg2020). For each locality, sea-surface temperature was calculated from the δ18Op values of contemporary fish using the equation of Lécuyer et al. (Reference Lécuyer, Amiot, Touzeau and Trotter2013), considering that body temperature (T b) is equal to seawater temperature (T sw), and that δ18Obw ≈ δ18Osw (Kolodny et al. Reference Kolodny, Luz and Navon1983). The associated error in temperature calculation is equal to 3°C (based on the slope of 4.5 of the Lécuyer et al. [Reference Lécuyer, Amiot, Touzeau and Trotter2013] equation used). As no contemporary fish tooth has been analyzed for the Slottsmøya Member fossil locality, the environmental temperature was estimated from the oxygen isotope composition of one brachiopod shell from Hammer et al. (Reference Hammer, Nakrem, Little, Hryniewicz, Sandy, Hurum, Druckenmiller, Knutsen and Høyberget2011) using the oxygen isotope fractionation equation provided by Letulle et al. (Reference Letulle, Gaspard, Daëron, Arnaud-Godet, Vinçon-Laugier, Suan and Lécuyer2023).
Statistical Analyses
We used descriptive statistics to explore body temperature re-estimates and intraskeletal δ18Op variations in Mesozoic marine reptiles. The normality and homoscedasticity (the uniformity of the error associated with the variance for each of the values) of the δ18Op values could not be verified. Considering the variable number of samples for each set (between 1 and 14 samples), the nonparametric Mann-Whitney-Wilcoxon test was used to compare median values between two sets of observations, each corresponding to a skeletal region. Statistical tests were performed using R software with a significance threshold set at p-value < 0.05. Pearson’s correlation coefficient r was employed to ascertain the degree of correlation between two quantitative variables.
Results
Bioapatite P2O5 Content and Phosphate Oxygen Isotope Composition (δ18Op)
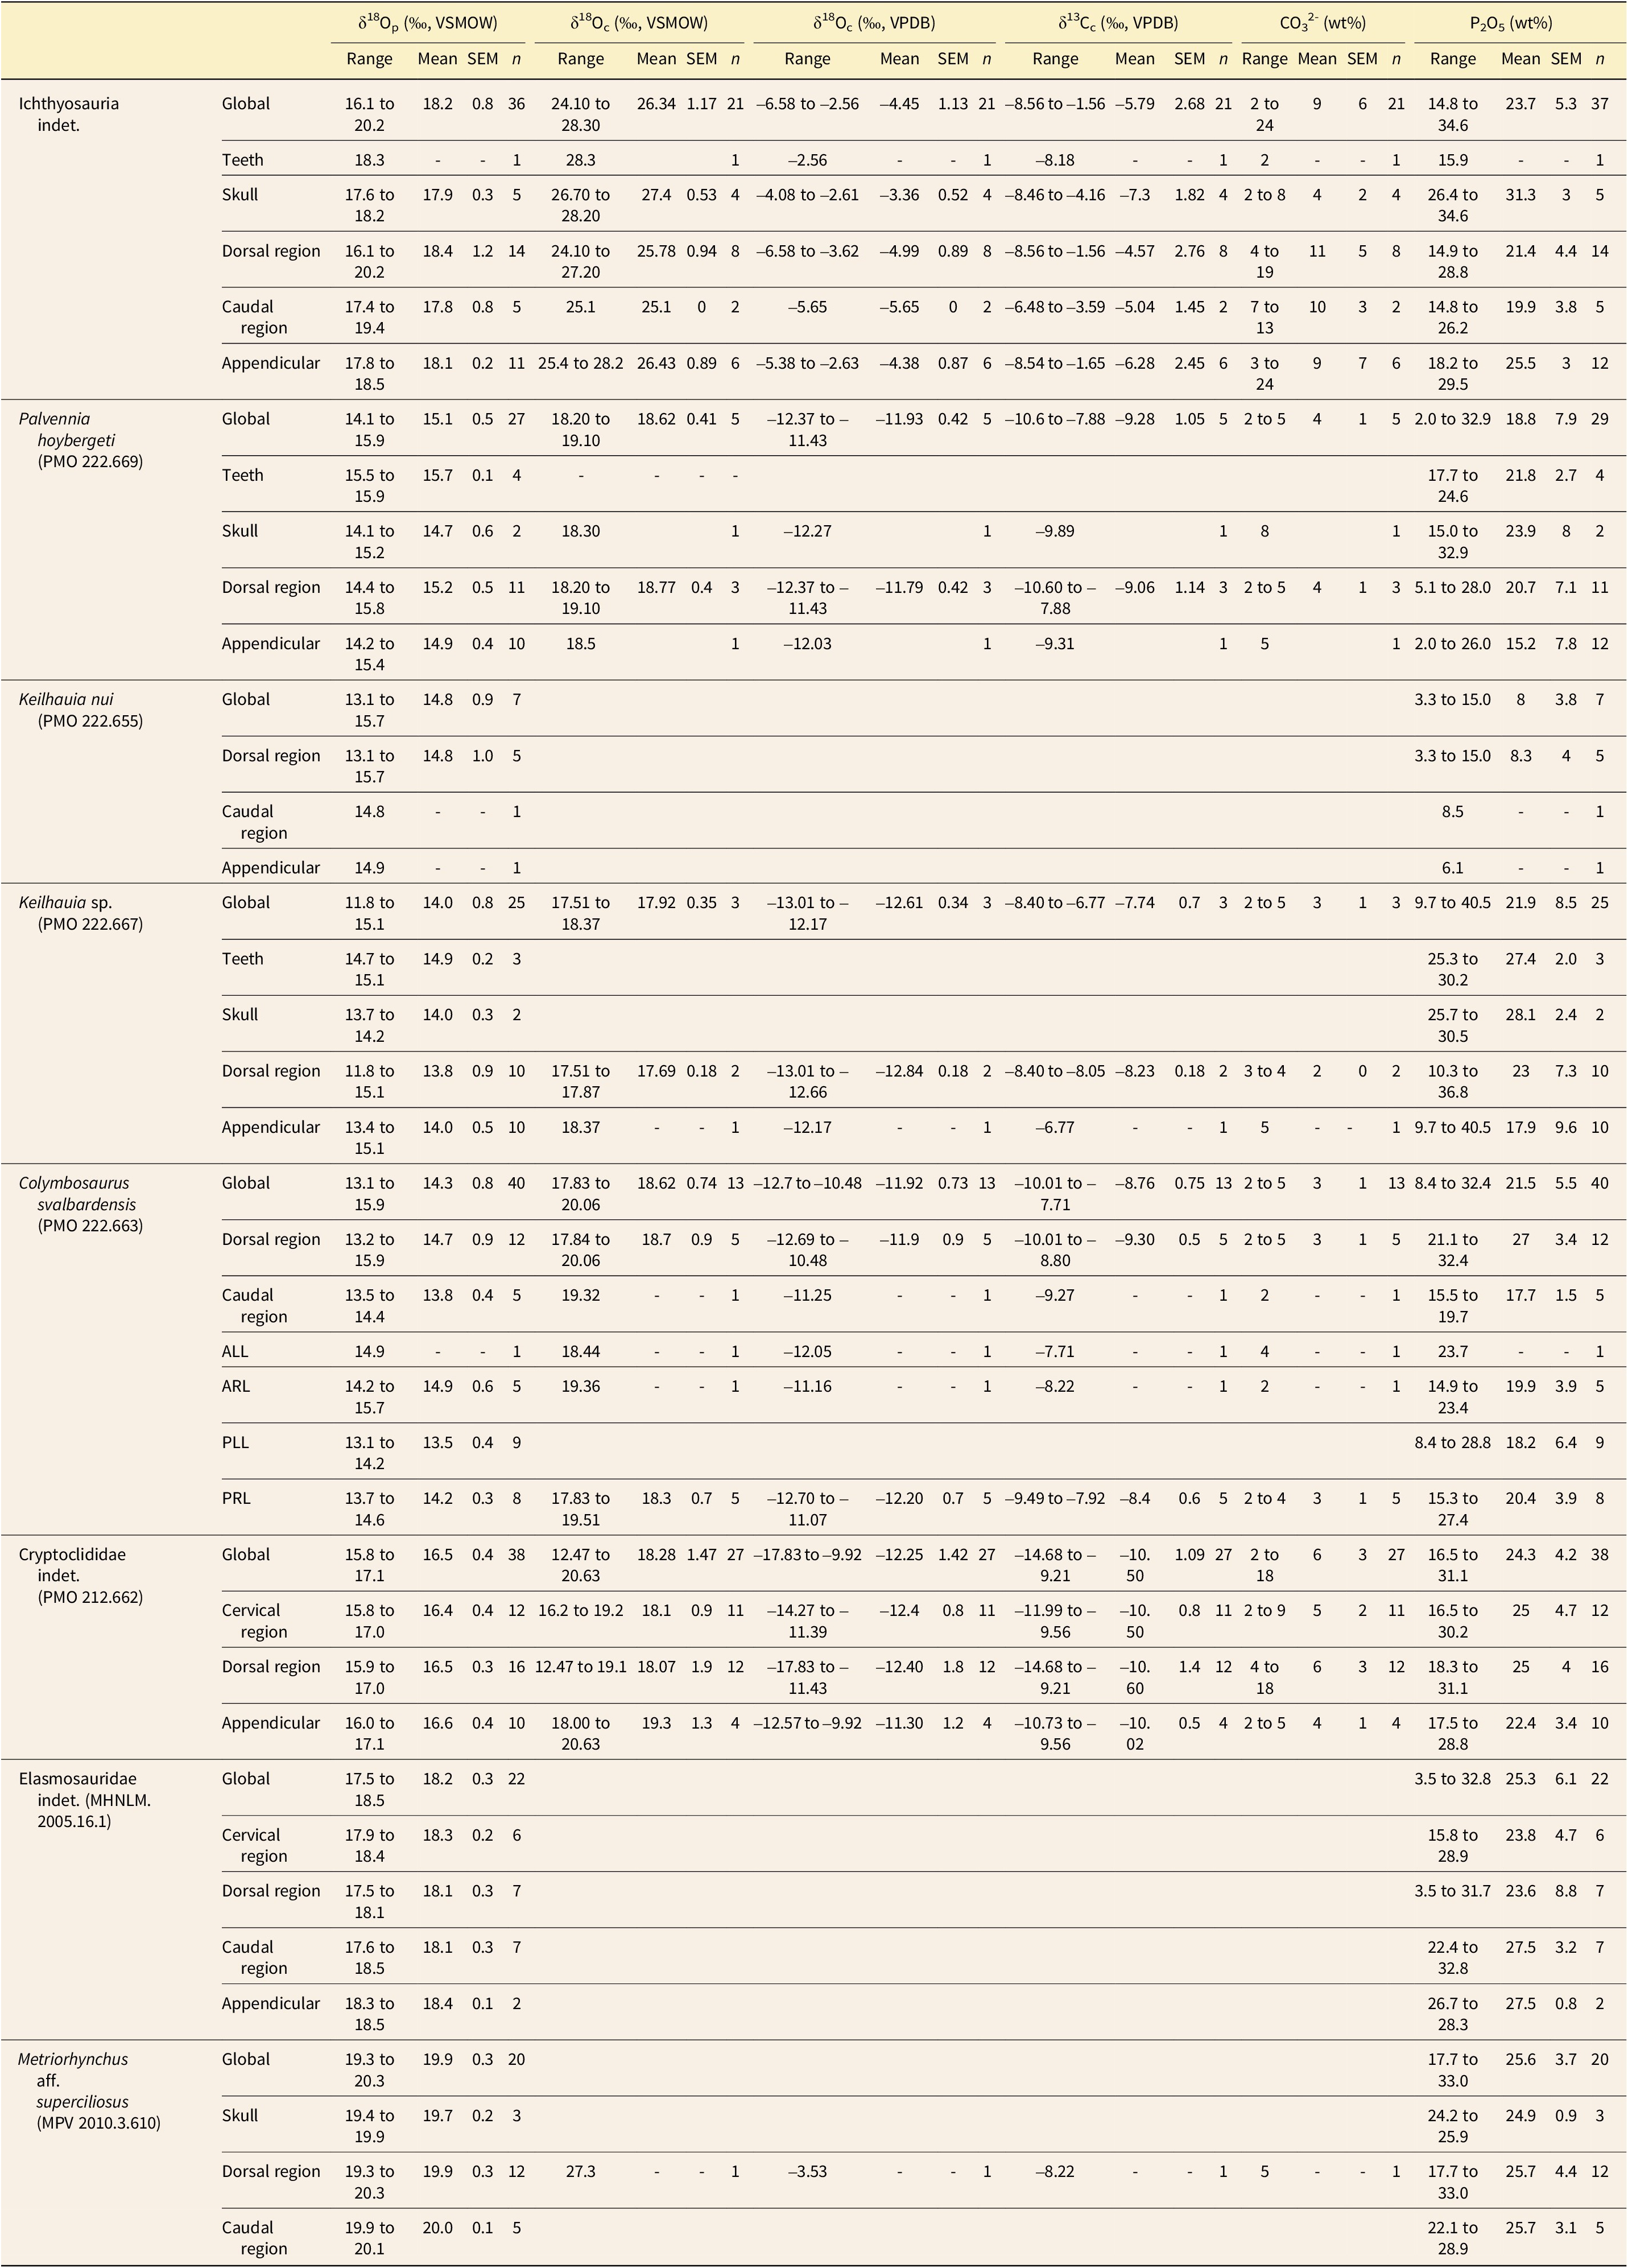
A total of 218 δ18Op values were acquired from 4 ichthyosaurs, 3 plesiosaurs, and 1 Metriorhynchus aff. superciliosus specimen in order to map regional heterothermies and reassess body temperatures. Almost all samples from each specimen could be analyzed, except a few samples that failed to yield silver phosphate after wet chemistry preparation, especially from the specimen of Keilhauia nui (PMO 222.655). P2O5 content expressed in weight percentage (wt%) and measured oxygen isotope composition from the phosphate group of each bone and tooth of all the specimens are reported in Supplementary Table 1 and synthetized in Table 2. P2O5 content for all specimens ranged from 2.0% to 40.5% (Table 2), with more than 90% of the values ranging from 15.3% to 40.5%. These results are consistent with the %P2O5 measured for the skeletal and dental remains of modern marine vertebrates (26.0 ± 4.4%, range: [15.3, 33.92], n = 27; Nemliher et al. Reference Nemliher, Baturin, Kallaste and Murdmaa2004). No significant differences were observed between the fossil deposits (Supplementary Figure 1A) or between specimens if we exclude the Keilhauia nui specimen (PMO 222.655), for which the percentage of P2O5 is significantly lower (Mann-Whitney-Wilcoxon test, p-value < 0.001; Supplementary Figure 1B). Globally, there are no significant differences in P2O5 content along the skeletal region, except for the Ichthyosauria indet. and Colymbosaurus svalbardensis specimens (Mann-Whitney-Wilcoxon test, p-value < 0.05; Supplementary Figure 2). Finally, no strong relationship between P2O5 content and δ18Op values is observed in Ichthyosauria and in Plesiosauria specimens (Pearson correlation test, r = 0.32; Supplementary Figure 3).
Synthesis of isotopic values (δ18Op, δ18Oc, δ13Cc) and CO32− and P2O5 content (wt%) of the bone and tooth bioapatite of the specimens of Ichthyosauria, Plesiosauria, and Metriorhynchidae. Abbreviations: ARL, anterior right limb; ALL, anterior left limb; PRL, posterior right limb; and PLL posterior left limb.

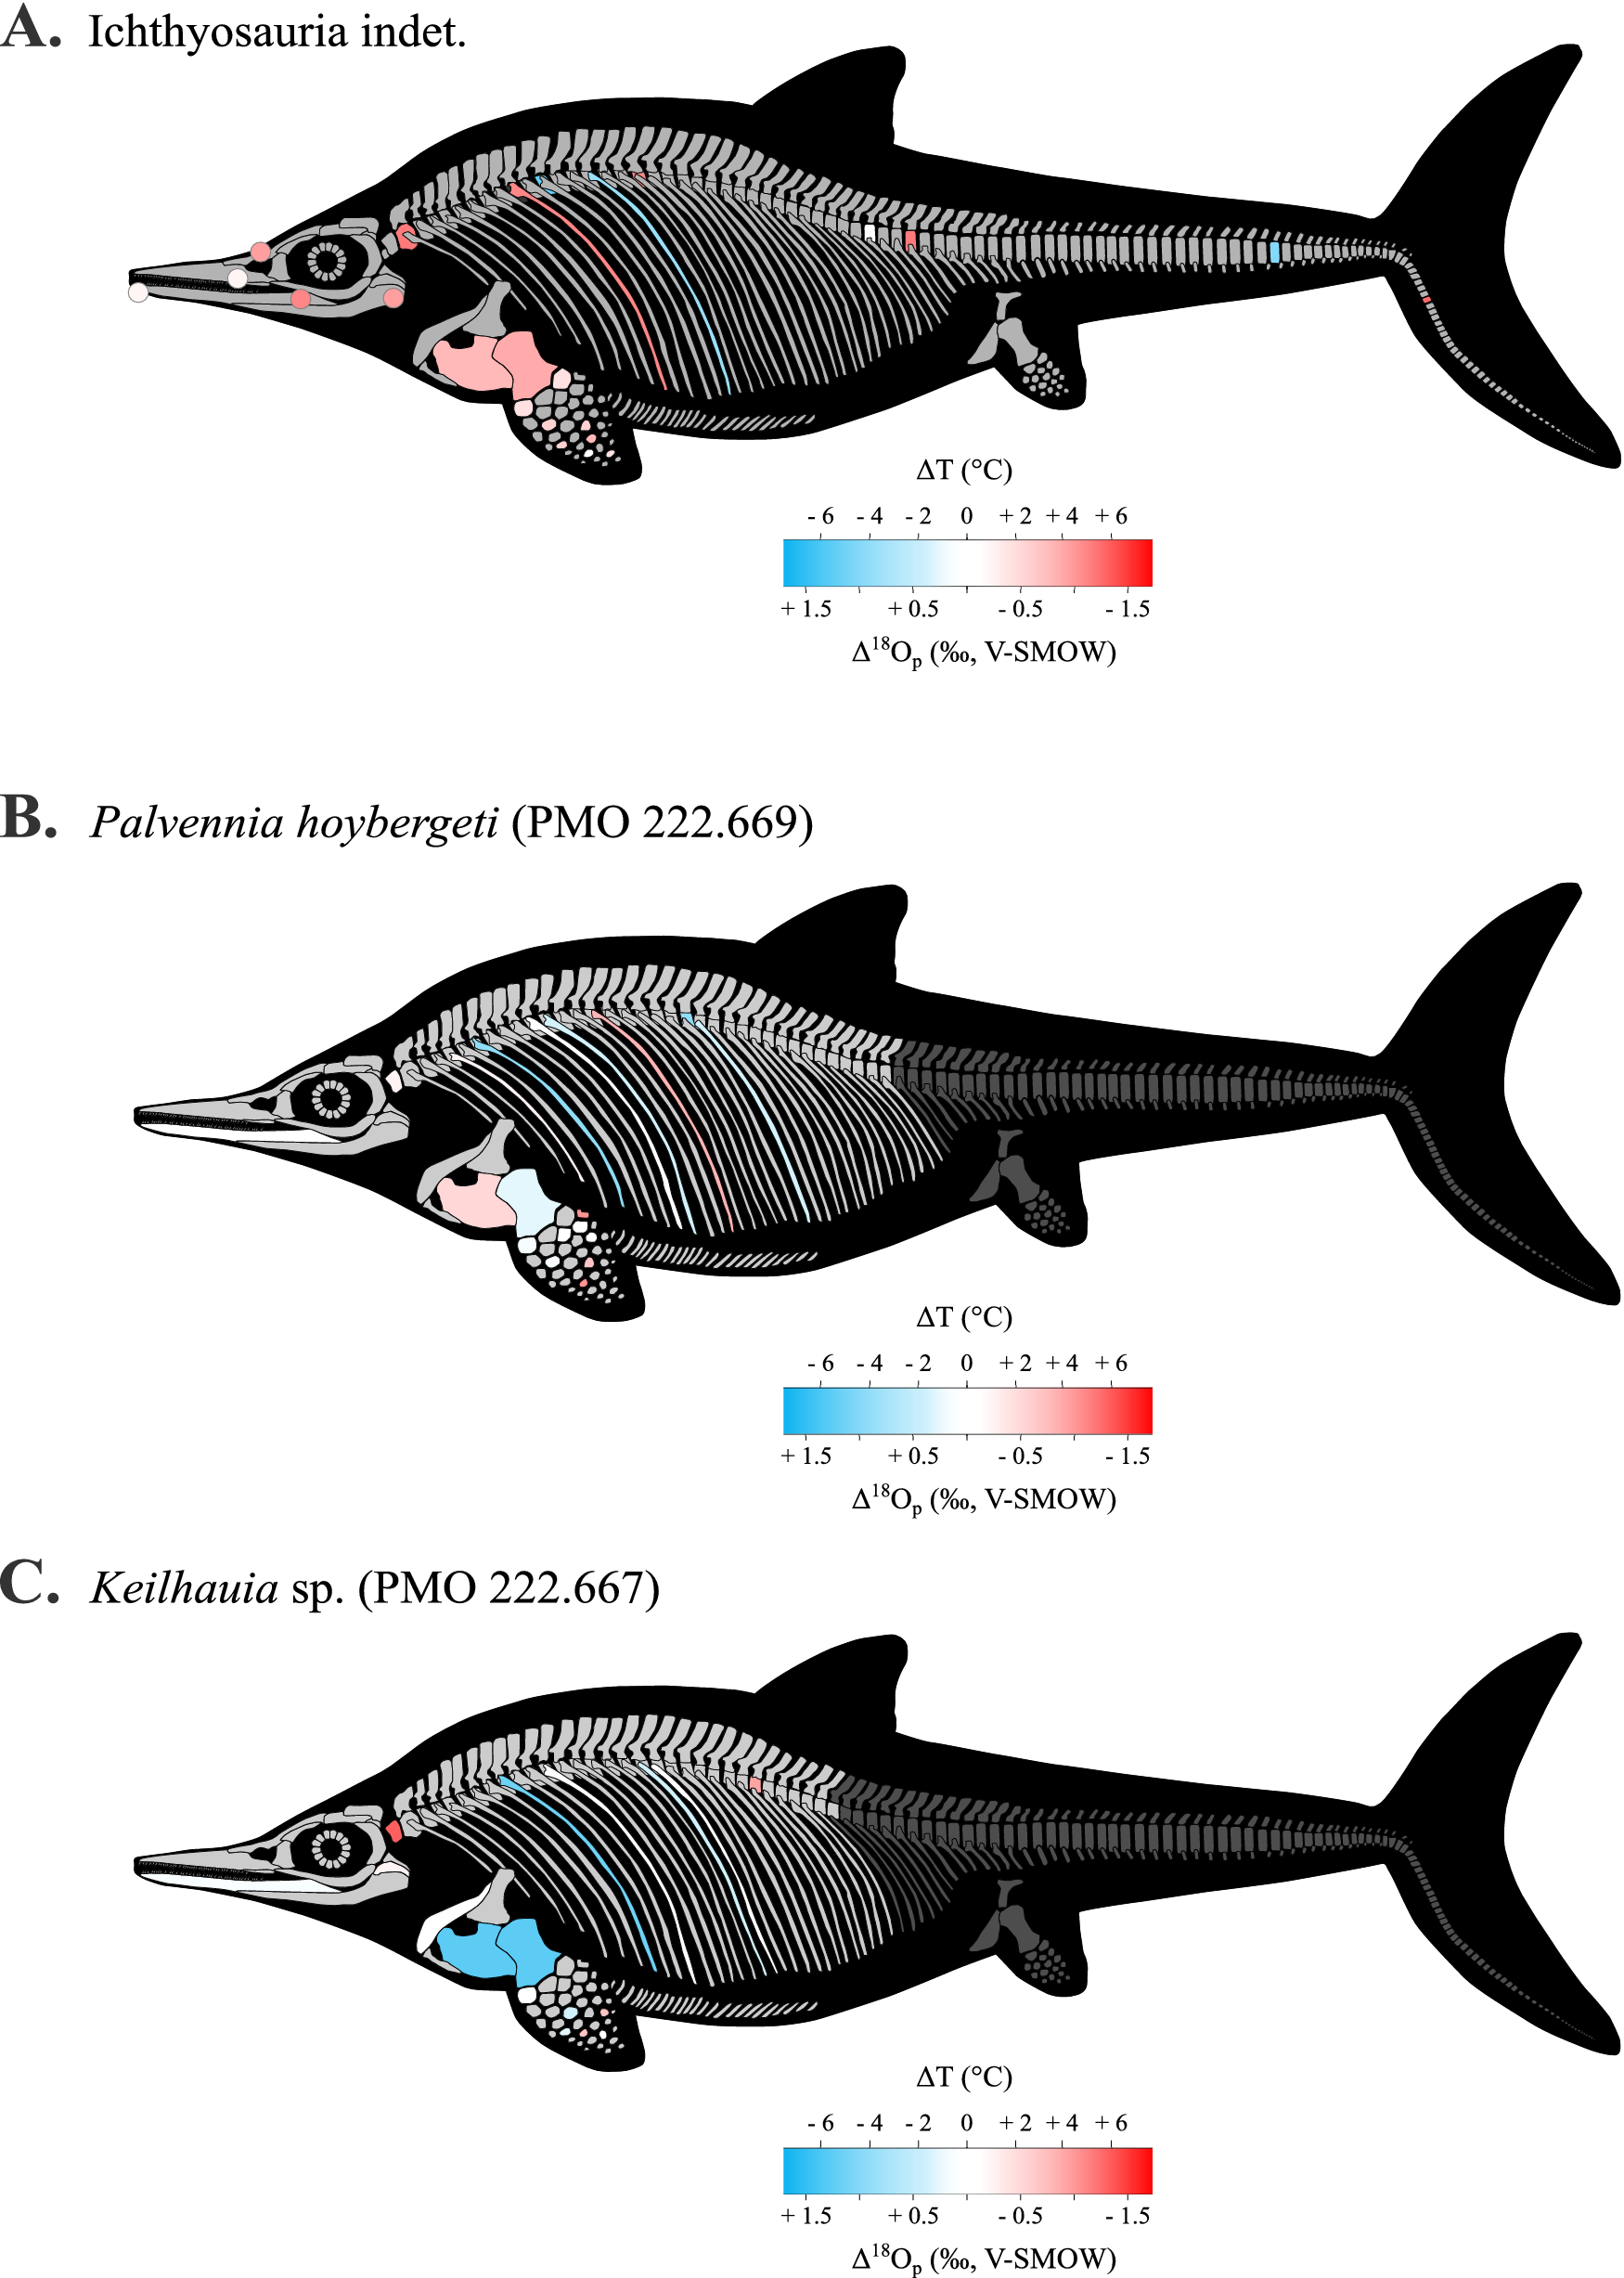
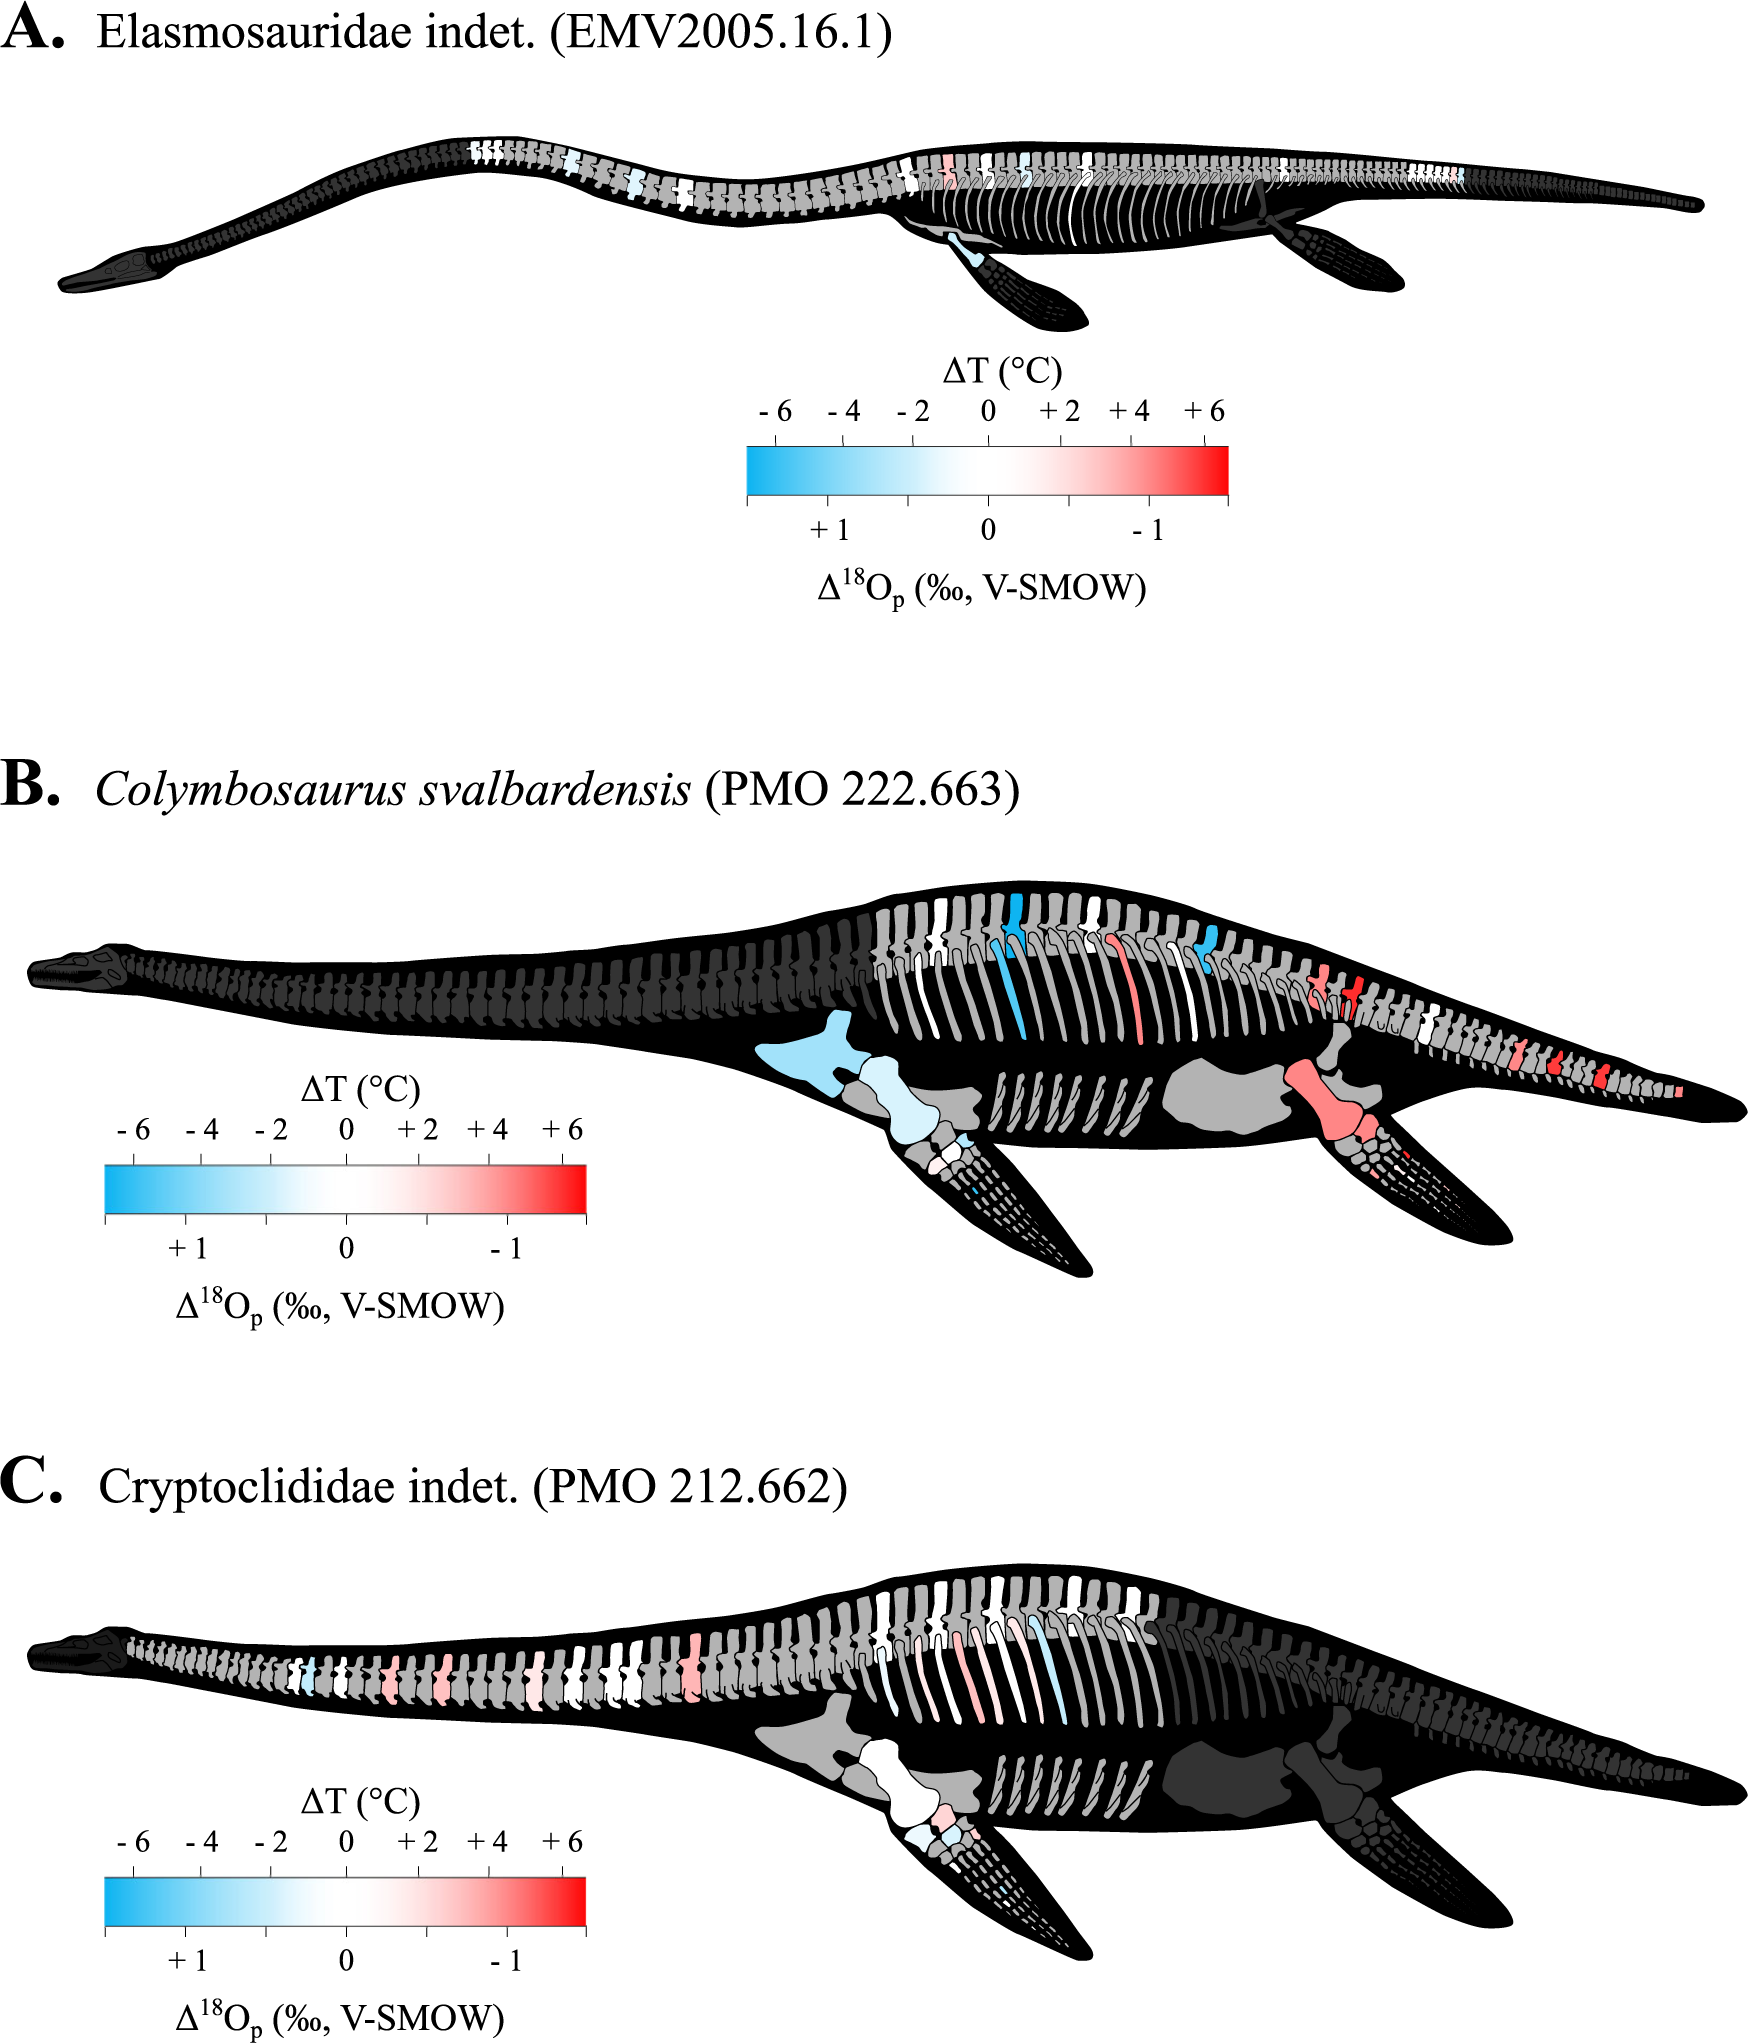
The intraskeletal variability of δ18Op is illustrated in Figures 1, 2, and 3, respectively for Ichthyosauria, Plesiosauria, and Metriorhynchidae. The Hypsocormus tooth recovered from the same stratigraphic layer as the specimen of Ichthyosauria indet. from Les Ardilles yielded a δ18Op value of 18.1 ± 0.2‰, and the δ18Op values of the Metriorhynchidae teeth VN6 and VN7 equaled 21.4 ± 0.2‰ and 19.8 ± 0.2‰, respectively (Supplementary Table 2). Intraskeletal variability in δ18Op values was observed for all the specimens of Ichthyosauria, the specimen of Kimmerosaurus sp., and the specimen of Metriorhynchus aff. superciliosus, but these differences are not significant between body regions (Mann-Whitney-Wilcoxon test, p-value > 0.05; Fig. 4). However, a trend seems to emerge in specimen PMO 222.667 of Keilhauia sp. and Palvennia hoybergeti specimen PMO 222.669, in which the teeth have overall higher δ18Op values than those of the bones, but the statistical significance of this observation could not be tested because of the small number of samples for each set (n < 5 for teeth). The only significant differences in δ18Op values along body regions observed are in the Colymbosaurus svalbardensis (PMO 222.663) specimen. Mann-Whitney-Wilcoxon statistical test results (p-value < 0.05; Fig. 4) clearly indicate that skeletal elements in the anterior part of the skeleton (dorsal vertebrae, ribs, left and right forelimbs) have significantly higher δ18Op values than skeletal elements in the posterior part (left and right hindlimbs and caudal vertebrae).
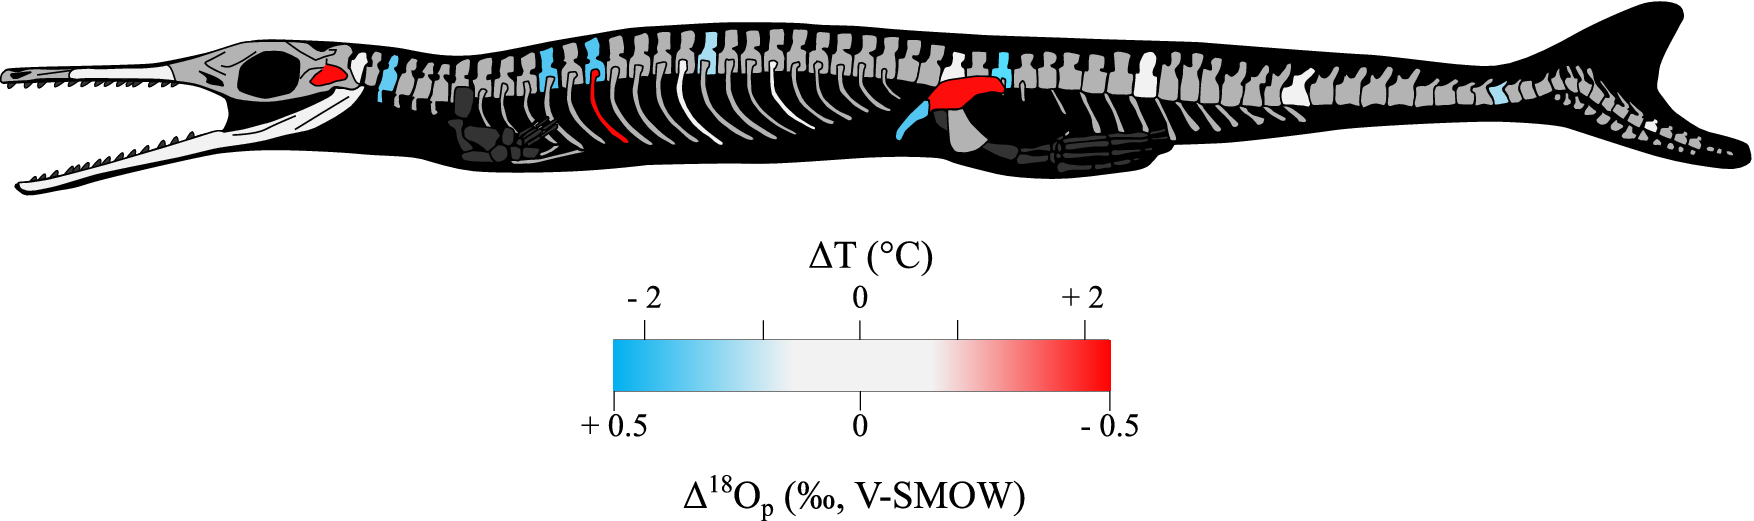
Regional heterothermies in ichthyosaurs. Phosphate oxygen isotope and temperature variability within the skeleton from A, the specimen of Ichthyosauria indet., B, the specimen of Palvennia hoybergeti (PMO 222.669), and C, the specimen of Keilhauia sp. (PMO 222.667). Color in bones corresponds to the δ18Op difference between bone and the midrange value, (δ18Op-max + δ18Op-min)/2, of the skeleton. For paired skeletal elements, the mean value is illustrated. Available skeletal elements are shown in light gray, while unavailable elements and skeletal elements with potentially altered δ18Op values are shown in dark gray. Skeletal elements (e.g., “limb bones”; Supplementary Table 1) with precise location unknown are not illustrated, while the locations of vertebrae, ribs, and phalanges that have not been found in articulation have been established arbitrarily. The representation of the organisms is not to scale.

Regional heterothermies in plesiosaurs. Phosphate oxygen isotope and temperature variability within the skeleton from A, the specimen of Elasmosauridae indet. (MHNLM.2005.16.1), B, the specimen of Colymbosaurus svalbardensis (PMO 222.663), and C, the specimen of Cryptoclididae indet. (PMO 212.662). Color in bones corresponds to the δ18Op difference between bone and the midrange value, (δ18Op-max + δ18Op-min)/2, of the skeleton. For paired skeletal elements, the mean value is illustrated. Available skeletal elements are shown in light gray, while unavailable elements and skeletal elements with potentially altered δ18Op values are shown in dark gray. Skeletal elements (e.g., “limb bones”; Supplementary Table 1) with precise location unknown are not illustrated, while the location of vertebrae, ribs, and phalanges that have not been found in articulation have been established arbitrarily. The representation of the specimens is not to scale.

Regional heterothermies in Metriorhynchus aff. superciliosus. Phosphate oxygen isotope and temperature variability within the skeleton from the specimen of Metriorhynchus aff. superciliosus (MPV 2010.3.610). Color in bones corresponds to the δ18Op difference between bone and the midrange value, (δ18Op-max + δ18Op-min)/2, of the skeleton. When both vertebrae centra and neural spine were measured, the mean value is illustrated. Available skeletal elements are shown in light gray, while unavailable elements are shown in dark gray. The representation of the specimen is not to scale.

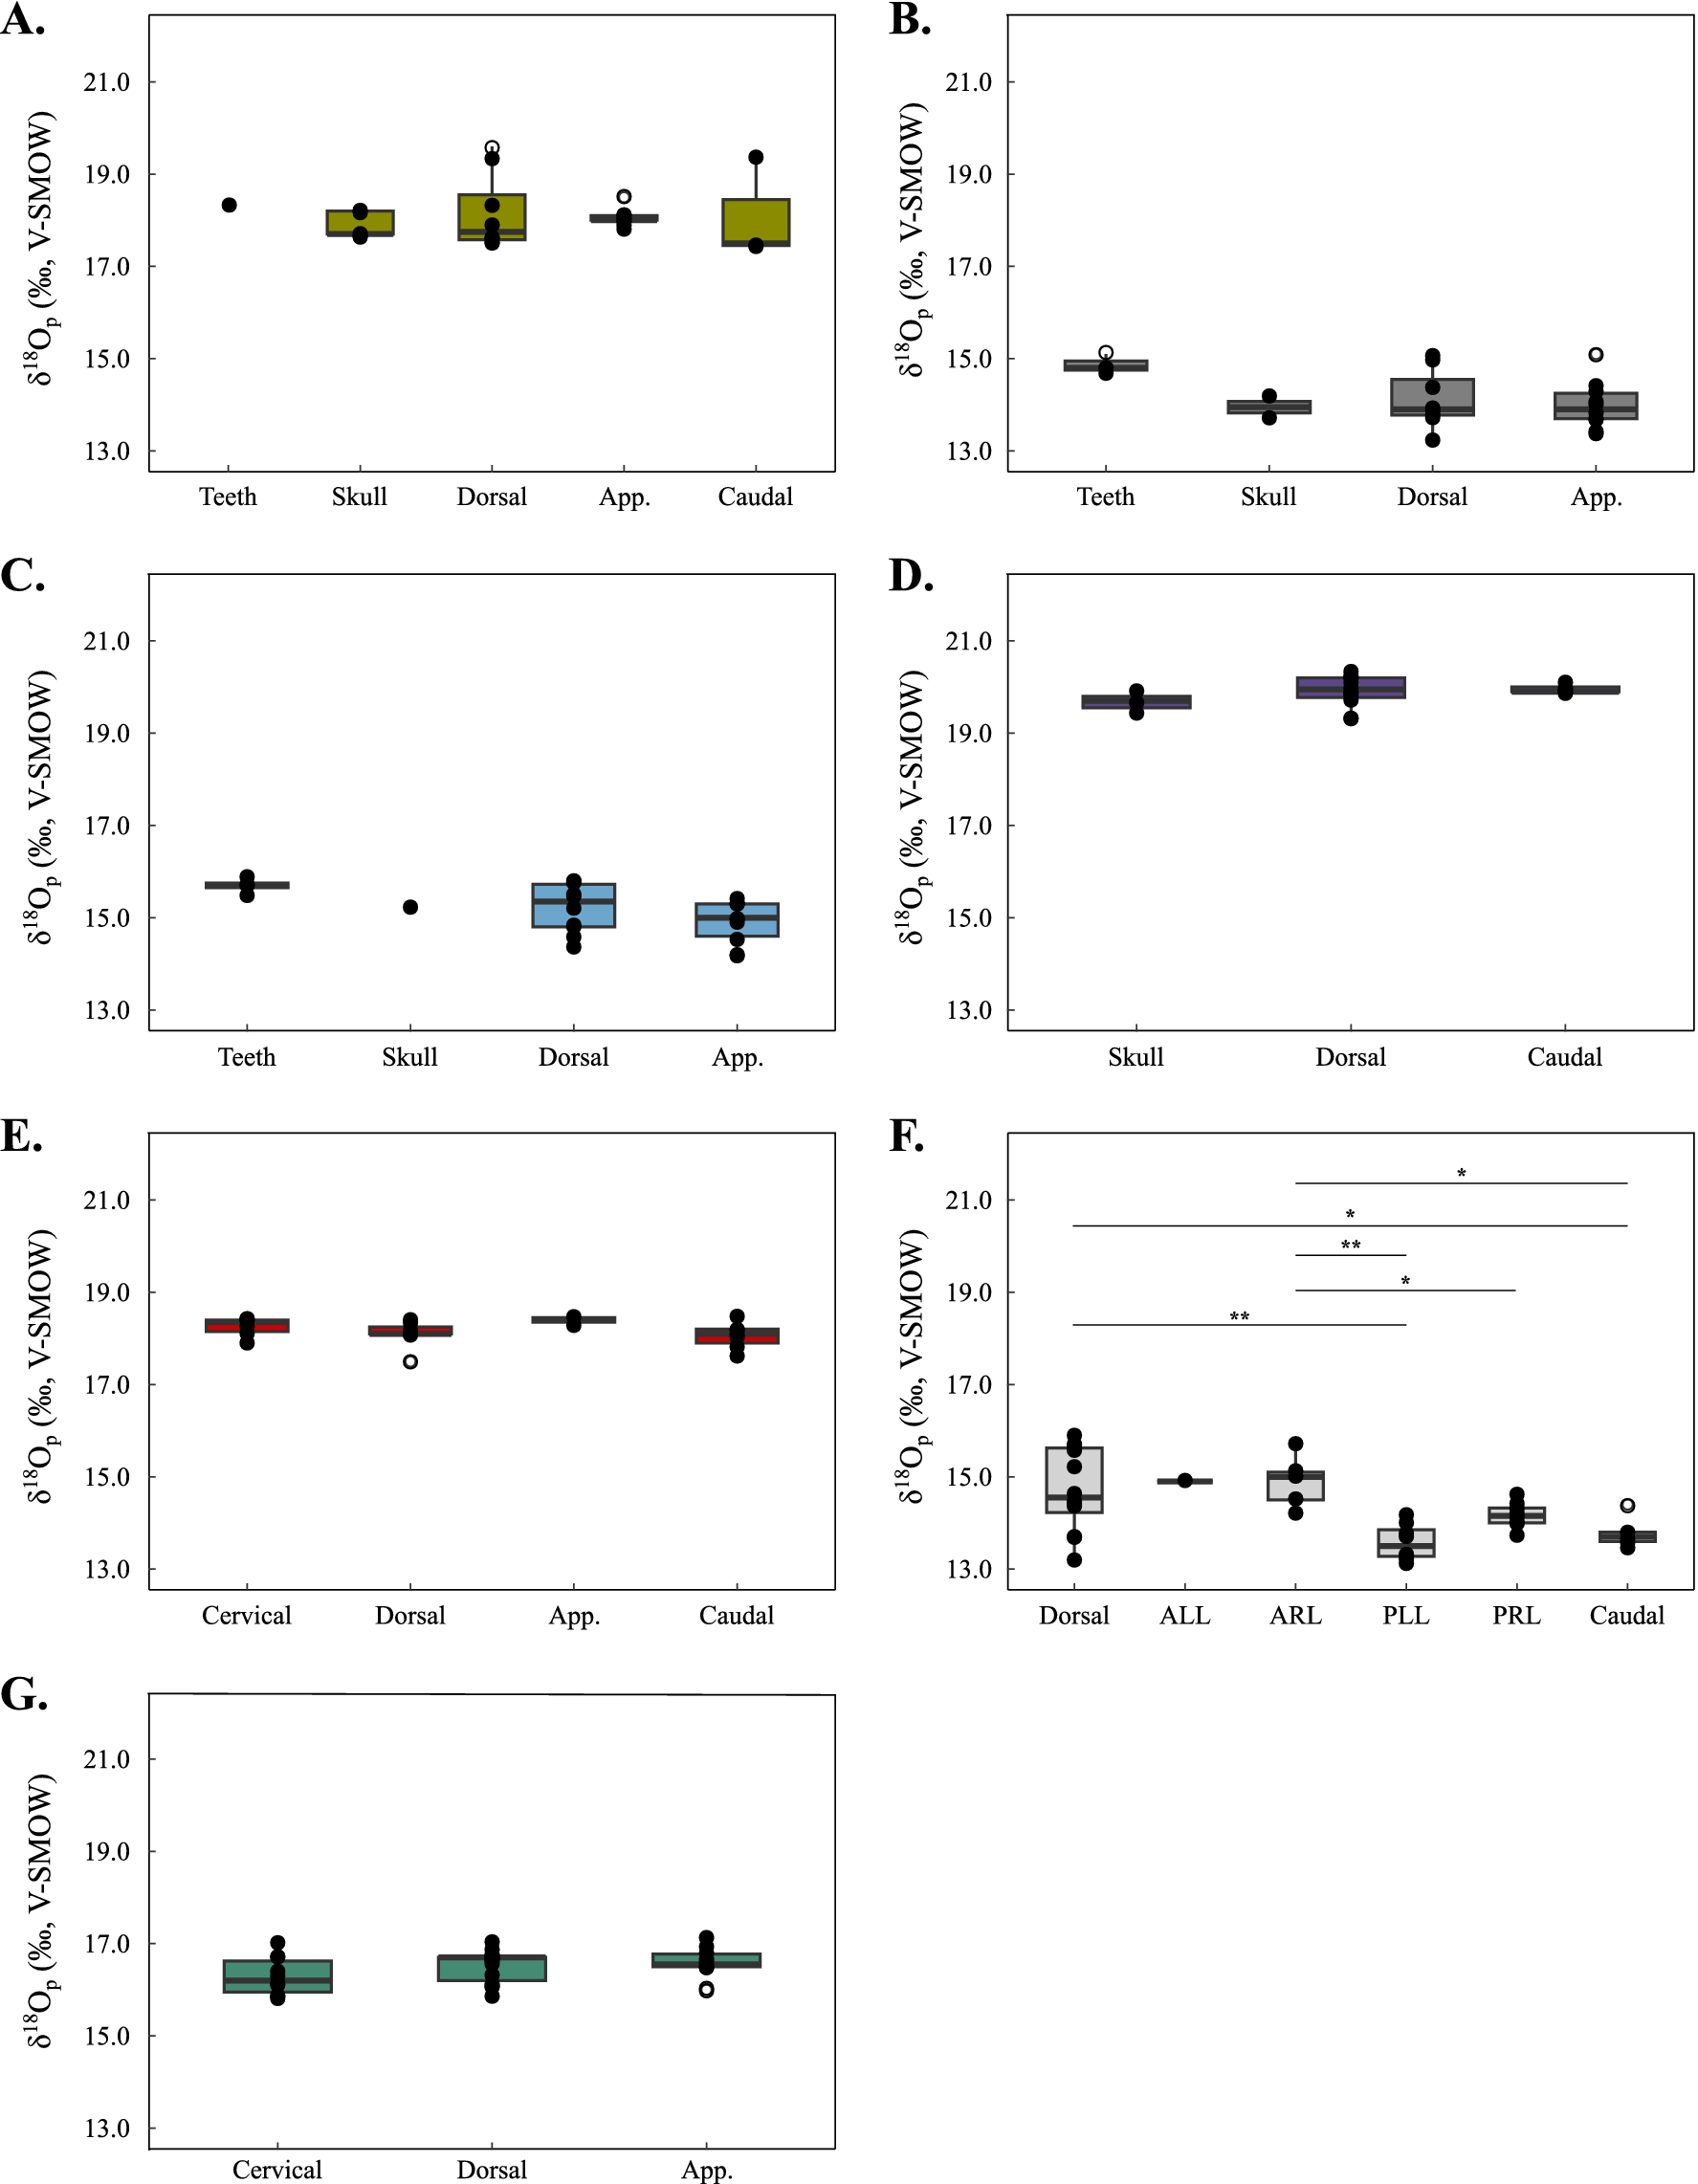
Box plots showing the δ18Op value distribution of bones sets for the specimens of Ichthyosauria (A, Ichthyosauria indet.; B, Keilhauia sp.; C, Palvennia hoybergeti), Metriorhynchus aff. superciliosus (D) and Plesiosauria (E, Elasmosauridae indet.; F, Colymbosaurus svalbardensis; and G, Cryptoclididae indet.). Asterisks indicate the significance of the observed differences between pair of groups: *p-value < 0.05; **p-value < 0.01; ***p-value < 0.001. Outliers are plotted as white circles. The horizontal bars in the boxes correspond to the medians and the whiskers to the minimum and maximum values. The average analytical error for each bone analyzed is on the order of 0.3‰. Abbreviations: App., Appendicular region; ALL, anterior left limb; ARL, anterior right limb; PLL, posterior left limb; PRL, posterior right limb.

Plesiosaur specimens (Colymbosaurus svalbardensis, Cryptoclididae indet.) have been recovered in articulation (Vincent et al. Reference Vincent, Bardet and Morel2007; Delsett et al. Reference Delsett, Novis, Roberts, Koevoets, Hammer, Druckenmiller and Hurum2016); consequently, the relation between δ18Op values and distance from the trunk was investigated (Fig. 5A). No relationship between δ18Op values and position in the limbs (Colymbosaurus svalbardensis, Cryptoclididae indet.) or for the vertebral position in the neck (Cryptoclididae indet., Elasmosauridae indet.) was observed (Fig. 5B). To summarize, phosphate oxygen isotope compositions reveal variations for all studied Mesozoic marine reptiles (from 1.0‰ to 4.1‰), comparable to those observed in present-day marine vertebrates (from 1.5‰ to 2.8‰; Séon et al. Reference Séon, Amiot, Suan, Lécuyer, Fourel, Demaret, Vinçon-Laugier, Charbonnier and Vincent2022), and for most there are no significant differences in δ18Op from the individual skeletal regions.
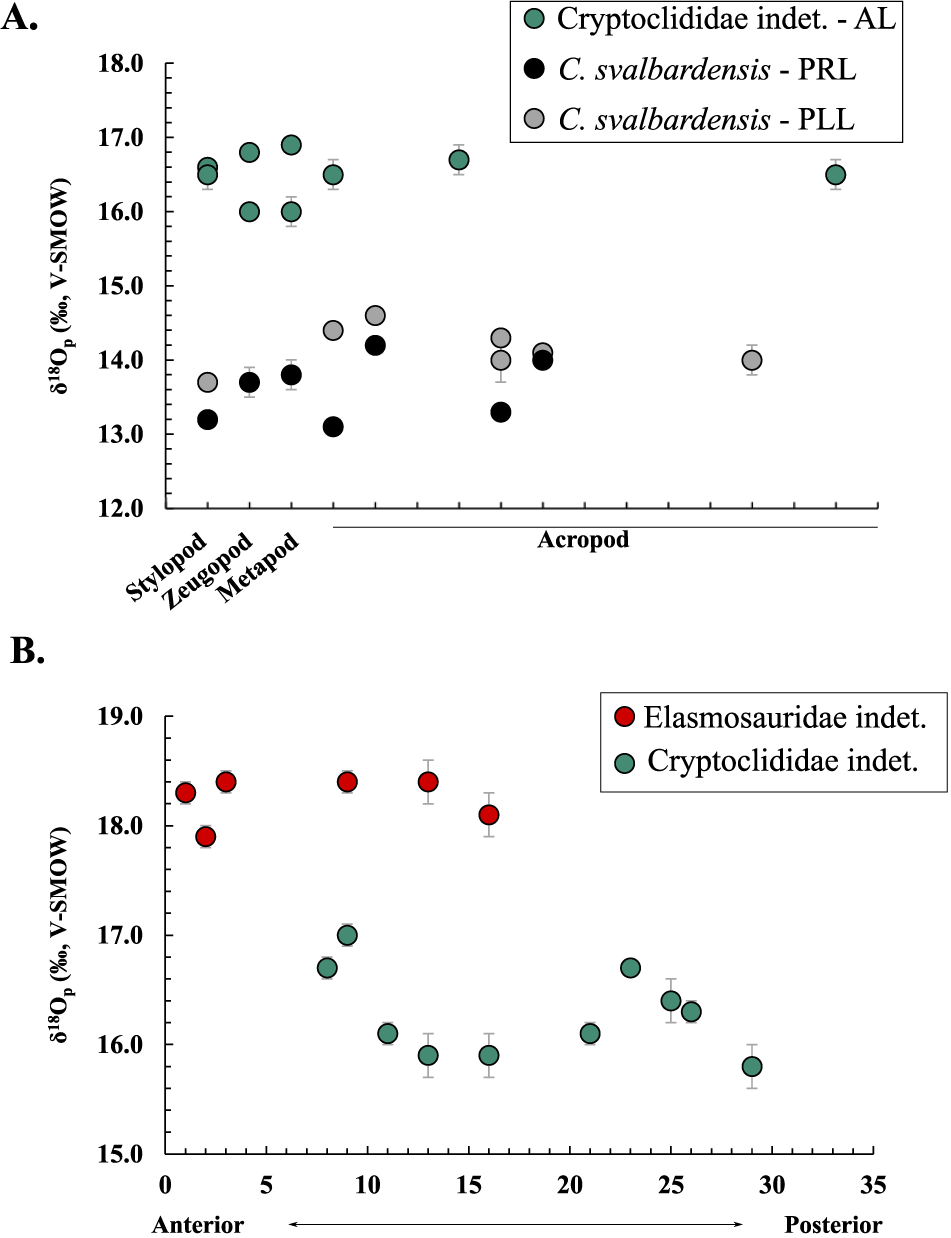
A, δ18Op values (‰, VSMOW) according to bone position within the limb for the specimen of Cryptoclididae indet. and the specimen of Colymbosaurus svalbardensis. Stylopod set corresponds to the femur or the humerus, Zeugopod set to radius and ulna or tibia and fibula, Metapod set to metacarpals or metatarsals, and Acropod set to phalanges. Abbreviations: AL, Anterior limb indet.; PRL, posterior right limb; PLL, posterior left limb. B, δ18Op values (‰, VSMOW) according to position of the vertebra within the cervical region for the specimen of Elasmosauridae indet. and the specimen of Cryptoclididae indet.

Carbonate Bioapatite Oxygen and Carbon Isotope Compositions (δ18Oc and δ13Cc) and Carbonate Content (wt%)
Oxygen and carbon isotope compositions of the carbonate group of bioapatite as well as carbonate content were measured to assess the preservation of the oxygen isotope composition of the phosphate group. All the values are reported in Supplementary Table 1, a synthesis is provided in Table 2 for each specimen, with a graphical representation in Figure 6. The tooth from the pachycormid fish Hypsocormus sp. recovered from the same stratigraphic layer as the specimen of Ichthyosauria indet. yielded a δ18Oc value equal to 27.30 ± 0.20‰ (VSMOW), a δ13Cc value equal to −4.27 ± 0.15‰ (VPDB), and a carbonate content of 4%. The δ18Oc of calcite recrystallization sampled in the dorsal vertebra of the specimen of Ichthyosauria indet. from Les Ardilles is equal to 24.20 ± 0.10‰ (VSMOW) and to −0.10 ± 0.10‰ (VPDB) for δ13Cc.
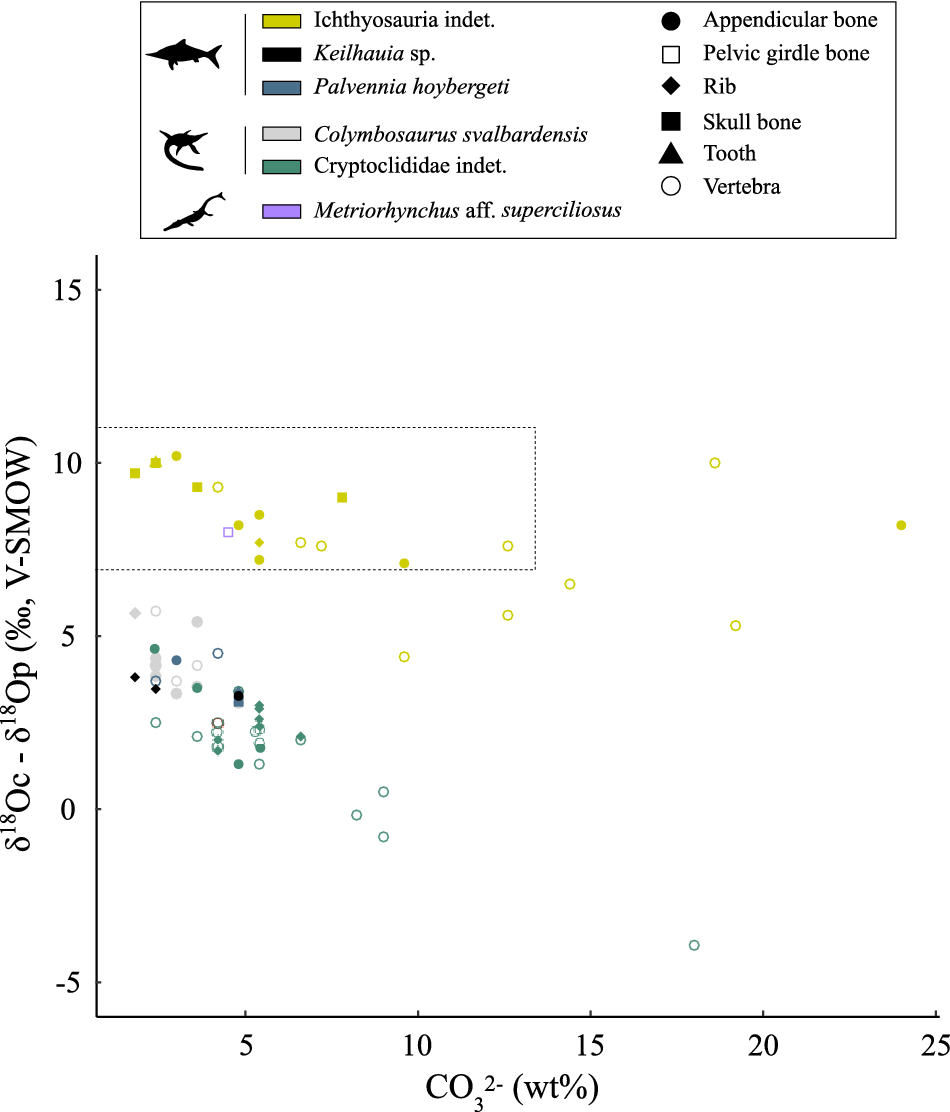
The δ18Oc − δ18Op differences between teeth and bone types plotted against carbonate content (wt%) of bioapatite. The dashed rectangle zone corresponds to the combination of parameters that would indicate a potential biological preservation of the oxygen isotope composition of the bioapatite of teeth and bones. Silhouettes were made by Gareth Monger for Ichthyosauria and Metriorhynchidae and T. Michael Keesey for Plesiosauria. Images downloaded from PhyloPic and used under a CCBY 3.0 license: https://creativecommons.org/licenses/by/3.0.

Mineralogical Characteristics of Bones and Teeth from Mesozoic Marine Reptiles
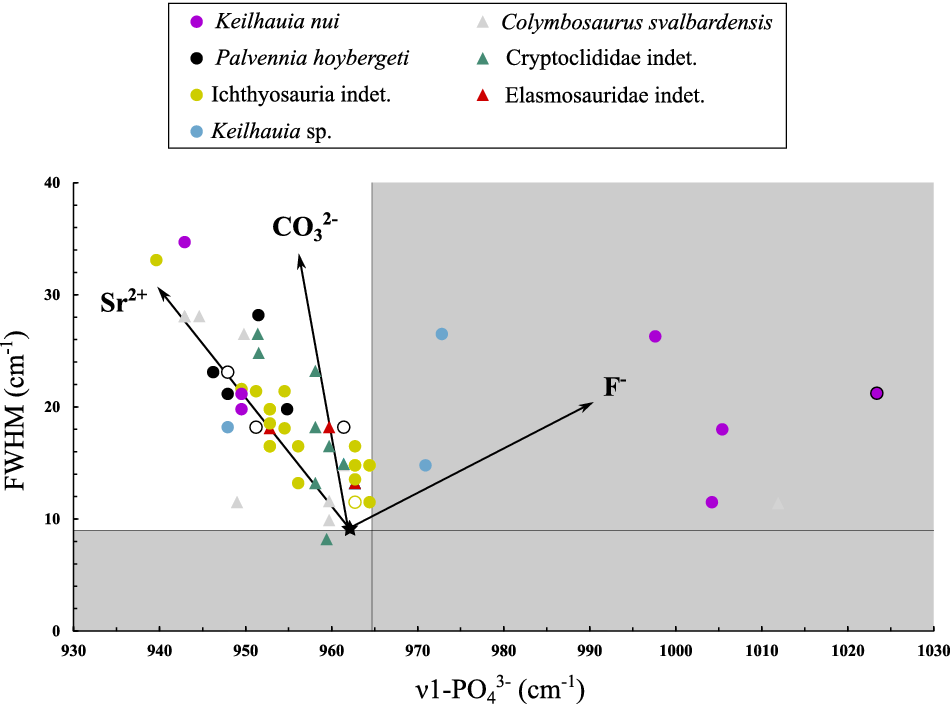
Raman spectroscopy was used to assess possible mineralogical changes associated with fossilization and diagenetic processes. The Raman spectral parameters from ichthyosaurian and plesiosaurian bone elements and teeth are reported in Supplementary Table 3 and illustrated in Figure 7. The values of position of the ν1(PO43−) stretching band range from 939.6 cm−1 to 1023.4 cm−1, whereas FWHM values range from 8.2 cm−1 to 34.7 cm−1 (Supplementary Table 3). No significant differences in ν1(PO43−) stretching band values between individuals is observed (Mann-Whitney-Wilcoxon statistical test, p-value > 0.05), although some skeletal elements of the specimen of Keilhauia nui appear to have higher values. The Raman results indicate that there is little mineralogical change in the skeletal elements, except for some bone elements belonging to the Keilhauia nui, the Keilhauia sp., and the Colymbosaurus svalbardensis specimens.
The ν1(PO43−) stretching band position and full width at half maximum (FWHM) measured for Ichthyosauria and Plesiosauria bones and teeth (Supplementary Table 3). Empty symbols represent enamel samples, while solid symbols represent bone samples. The gray zone corresponds to the combination of parameters that would indicate a mineralogical alteration of the bioapatite of teeth and bones. The black arrows indicate the evolution of the position of the ν1(PO43−) stretching band position and the FWHM depending on the type of ionic substitution within the bioapatite (Thomas et al. Reference Thomas, McGoverin, Fordyce, Frew and Gordon2011).

Ichthyosauria, Plesiosauria, and Metriorhynchidae Body Temperature
Ichthyosauria, Plesiosauria, and Metriorhynchidae body temperature estimates were compared to environmental paleotemperatures, which range from 14 ± 2°C (Slottsmøya Member, Spitsberg, 65.5°N) to 34 ± 1°C (Les Ardilles, France, 34.5°N; Supplementary Table 2). Ichthyosauria, Plesiosauria, and Metriorhynchidae body temperature estimates are available in Supplementary Table 2 and reported against corresponding sea-water temperature estimates in Figure 8.
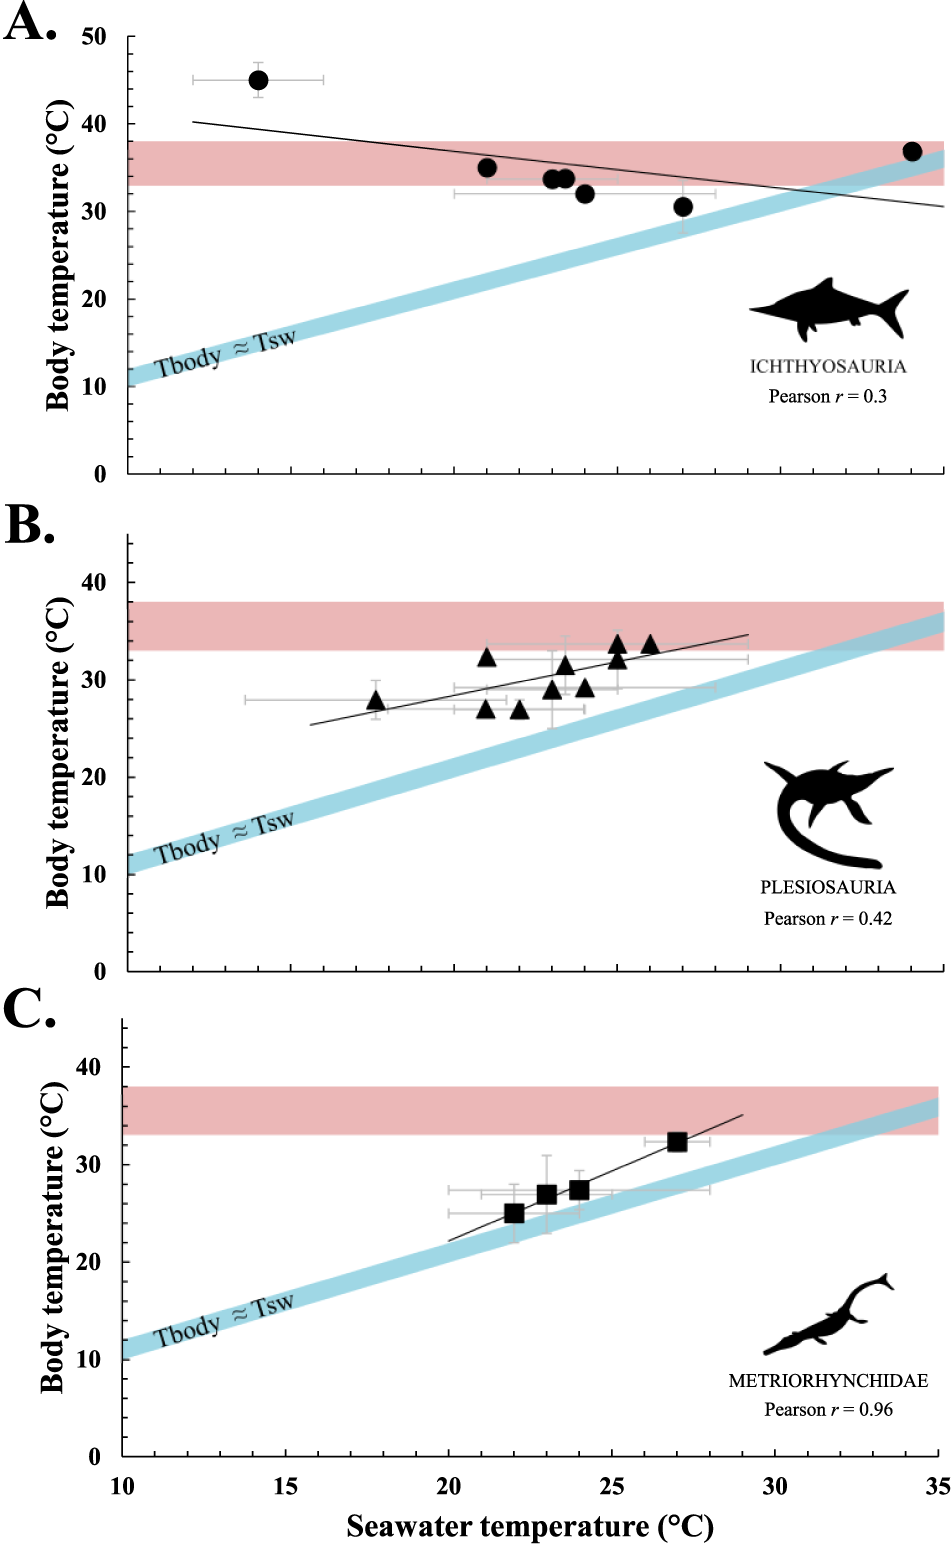
Body temperature estimates of Ichthyosauria (A), Plesiosauria (B), and Metriorhynchidae (C) from tooth enamel δ18Op values (new data in Supplementary Table 1 and published data in Supplementary Table 2) reported against environmental seawater temperature of their living environments. The body temperature range of extant homeothermic endotherm Cetacea is illustrated in red (Morrison Reference Morrison1962; Hampton et al. Reference Hampton, Whittow, Szekerczes and Rutherford1971; Yeates and Houser Reference Yeates and Houser2008), while the body temperature range shown in blue corresponds to the temperature range of a strictly ectothermic poikilothermic model organism whose body temperature is equal to the environmental temperature +2°C. Body and environmental temperatures were calculated using the equation of Lécuyer et al. (Reference Lécuyer, Amiot, Touzeau and Trotter2013) and considering the latitudinal gradient of δ18Osw values of Alberti et al. (Reference Alberti, Leshno, Fürsich, Edelman-Furstenberg, Andersen and Garbe-Schönberg2020) and an 18O-enrichment of body water relative to environmental water of +0.8 ± 0.9‰ for Mesozoic marine reptiles (Séon et al. Reference Séon2023). Silhouettes were made by Gareth Monger for Ichthyosauria and Metriorhynchidae and T. Michael Keesey for Plesiosauria. Images downloaded from PhyloPic and used under a CCBY 3.0 license: https://creativecommons.org/licenses/by/3.0.

Our estimates indicate that ichthyosaurs had body temperatures ranging from 31°C to 45°C, close to extant Cetacea (Morrison Reference Morrison1962; Hampton et al. Reference Hampton, Whittow, Szekerczes and Rutherford1971; Yeates and Houser Reference Yeates and Houser2008; Fig. 8A) and systematically higher than those of the seawater in which they lived (between 3°C and 31°C higher; Supplementary Table 2). No relationship is observed between Ichthyosauria body temperatures and environmental oceanic temperatures (Pearson correlation test, r = 0.3; Fig. 8A). Plesiosauria body temperature range from 27°C to 34°C; these estimates are, as for Ichthyosauria, higher than those of their environment (between 5°C and 11°C; Supplementary Table 2) and correlate moderately with environmental temperatures (Pearson correlation test, r = 0.42; Fig. 8B). The estimated body temperatures of Metriorhynchidae, ranging from 25°C to 32°C, are 3°C to 5°C higher than environmental temperatures (Supplementary Table 2), while being highly correlated (Pearson correlation test, r = 0.96; Fig. 8C).
Discussion
Preservation of the Biological δ18Op Values
Before discussing the thermophysiological significance of the δ18Op values of bone and tooth bioapatite, pristine preservation of the isotope record needs to be assessed. Biotic and abiotic processes leading to the decomposition, burial, and fossilization of living organisms may alter the pristine isotope composition of bioapatite through processes of secondary precipitation, ion adsorption, or dissolution–recrystallization of bioapatite (Kolodny et al. Reference Kolodny, Luz, Sander and Clemens1996; Blake et al. Reference Blake, O’Neil and Garcia1997; Trueman et al. Reference Trueman, Chenery, Eberth and Spiro2003; Zazzo et al. Reference Zazzo, Lécuyer and Mariotti2004a,Reference Zazzo, Lécuyer, Sheppard, Grandjean and Mariottib). Although no method can definitely demonstrate whether the original isotope compositions have been preserved, several ways to assess the preservation state of the oxygen isotope record have been proposed (Iacumin et al. Reference Iacumin, Bocherens, Mariotti and Longinelli1996; Kolodny et al. Reference Kolodny, Luz, Sander and Clemens1996; Fricke et al. Reference Fricke, Clyde, O’Neil and Gingerich1998; Lécuyer et al. Reference Lécuyer, Bogey, Garcia, Grandjean, Barrat, Floquet, Bardet and Pereda-Superbiola2003; Pucéat et al. Reference Pucéat, Reynard and Lécuyer2004; Zazzo et al. Reference Zazzo, Lécuyer and Mariotti2004a,Reference Zazzo, Lécuyer, Sheppard, Grandjean and Mariottib; Tütken et al. Reference Tütken, Vennemann and Pfretzschner2008; Keenan Reference Keenan2016; Lécuyer and Flandrois Reference Lécuyer and Flandrois2023; Turner-Walker et al. Reference Turner-Walker, Galiacho, Armentano and Hsu2023).
In general, enamel is widely considered to be more resistant to diagenetic processes compared with bones (e.g., Lowenstam and Weiner Reference Lowenstam and Weiner1989; Sillen and LeGeros Reference Sillen and LeGeros1991; Kohn et al. Reference Kohn, Schoeninger and Barker1999; Lee-Thorp and Sponheimer Reference Lee-Thorp and Sponheimer2003; Gehler et al. Reference Gehler, Tütken and Pack2011), as it possesses a high crystallinity index, being composed of 95% bioapatite crystals. In addition, bioapatite crystals are larger and more compact than those in bone (Pasteris et al. Reference Pasteris, Wopenka and Valsami-Jones2008). As a result, the space between the crystals is reduced, limiting fluid circulation, interaction with bacterial and microbial organisms, and precipitation of secondary minerals (LeGeros Reference LeGeros1981; Driessens and Verbeeck Reference Driessens and Verbeeck1990). The precipitation of secondary minerals leads to mineralogical changes observable through mineralogical characterization methods such as Raman spectroscopy. According to Thomas et al. (Reference Thomas, Fordyce, Frew and Gordon2007, Reference Thomas, McGoverin, Fordyce, Frew and Gordon2011), bones and teeth altered by diagenetic processes have peak widths (FWHM) of ν1(PO43−) at half height of less than 9 cm−1 and band positions of ν1(PO43−) greater than 964.7 cm−1. Among the analyzed samples, few skeletal elements have parameters that might suggest that they are mineralogically altered (Fig. 6), including different type of bones (skull bones, vertebrae, and phalanges) from specimens of Palvennia hoybergeti, Keilhauia nui, and Colymbosaurus svalbardensis. The sandy appearance of the remains from the Keilhauia nui specimen could explain why so few silver phosphate crystals were recovered at the end of the chemical preparation. Their low P2O5 content compared with the other specimens from the same stratigraphic layer and the mineralogical change observed by Raman spectroscopy would indicate the presence of bone alteration (Table 2, Supplementary Fig. 1B).
To assess the effect of diagenetic processes on the oxygen isotope composition of the bones and the teeth, we used the difference between oxygen isotope compositions of biogenic bioapatite phosphate and corresponding structural carbonate (δ18Oc − δ18Op), the carbonate content (CO32− %wt) of bioapatite, and the carbon isotope composition of bioapatite structural carbonate (δ13Cc) (Fig. 6). Samples that have either δ18Oc − δ18Op differences lower than +7‰ and higher than +11‰ (Iacumin et al. Reference Iacumin, Bocherens, Mariotti and Longinelli1996; Pellegrini et al. Reference Pellegrini, Lee-Thorp and Donahue2011; Sisma-Ventura et al. Reference Sisma-Ventura, Tütken, Peters, Bialik, Zohar and Pack2019) or a carbonate content higher than +13.4% must be regarded with caution, as they may reflect a potential diagenetic alteration (Brudevold and Soremark Reference Brudevold and Soremark1967; Vennemann et al. Reference Vennemann, Hegner, Cliff and Benz2001; McElderry et al. Reference McElderry, Zhu, Mroue, Xu, Pavan, Fang, Zhao, McNerny, Kohn and Franceschi2013; Wingender et al. Reference Wingender, Azuma, Krywka, Zaslansky, Boyle and Deymier2021). All the samples from Ichthyosauria, Plesiosauria, and Metriorhynchidae have δ18Oc − δ18Op differences lower than the critical value of +11‰, but most of them are below +7‰. Nonetheless, some of them possess carbonate content greater than +13.4%, especially those from bones belonging to the specimen of Ichthyosauria indet. from Les Ardilles (Fig. 6), in line with the secondary calcite mineralization observed during sampling. Moreover, a trend is observed between carbonate contents and δ18Oc values considering the tooth δ18Oc value as the pristine biological signal and that of the secondary calcite mineralization, which would form the diagenetic end-member (Supplementary Fig. 4). This relationship also highlights the link between the occurrence of high carbonate content and the ultrastructure (e.g., connected porosity) of the bones, here the vertebrae, as among all the skeletal elements analyzed in the specimen of Ichthyosauria indet., six (n = 6) are vertebrae and two (n = 2) are limb bones. These skeletal elements are among the bones with the highest porosities within Ichthyosauria (Anderson et al. Reference Anderson, Druckenmiller, Erickson and Maxwell2019).
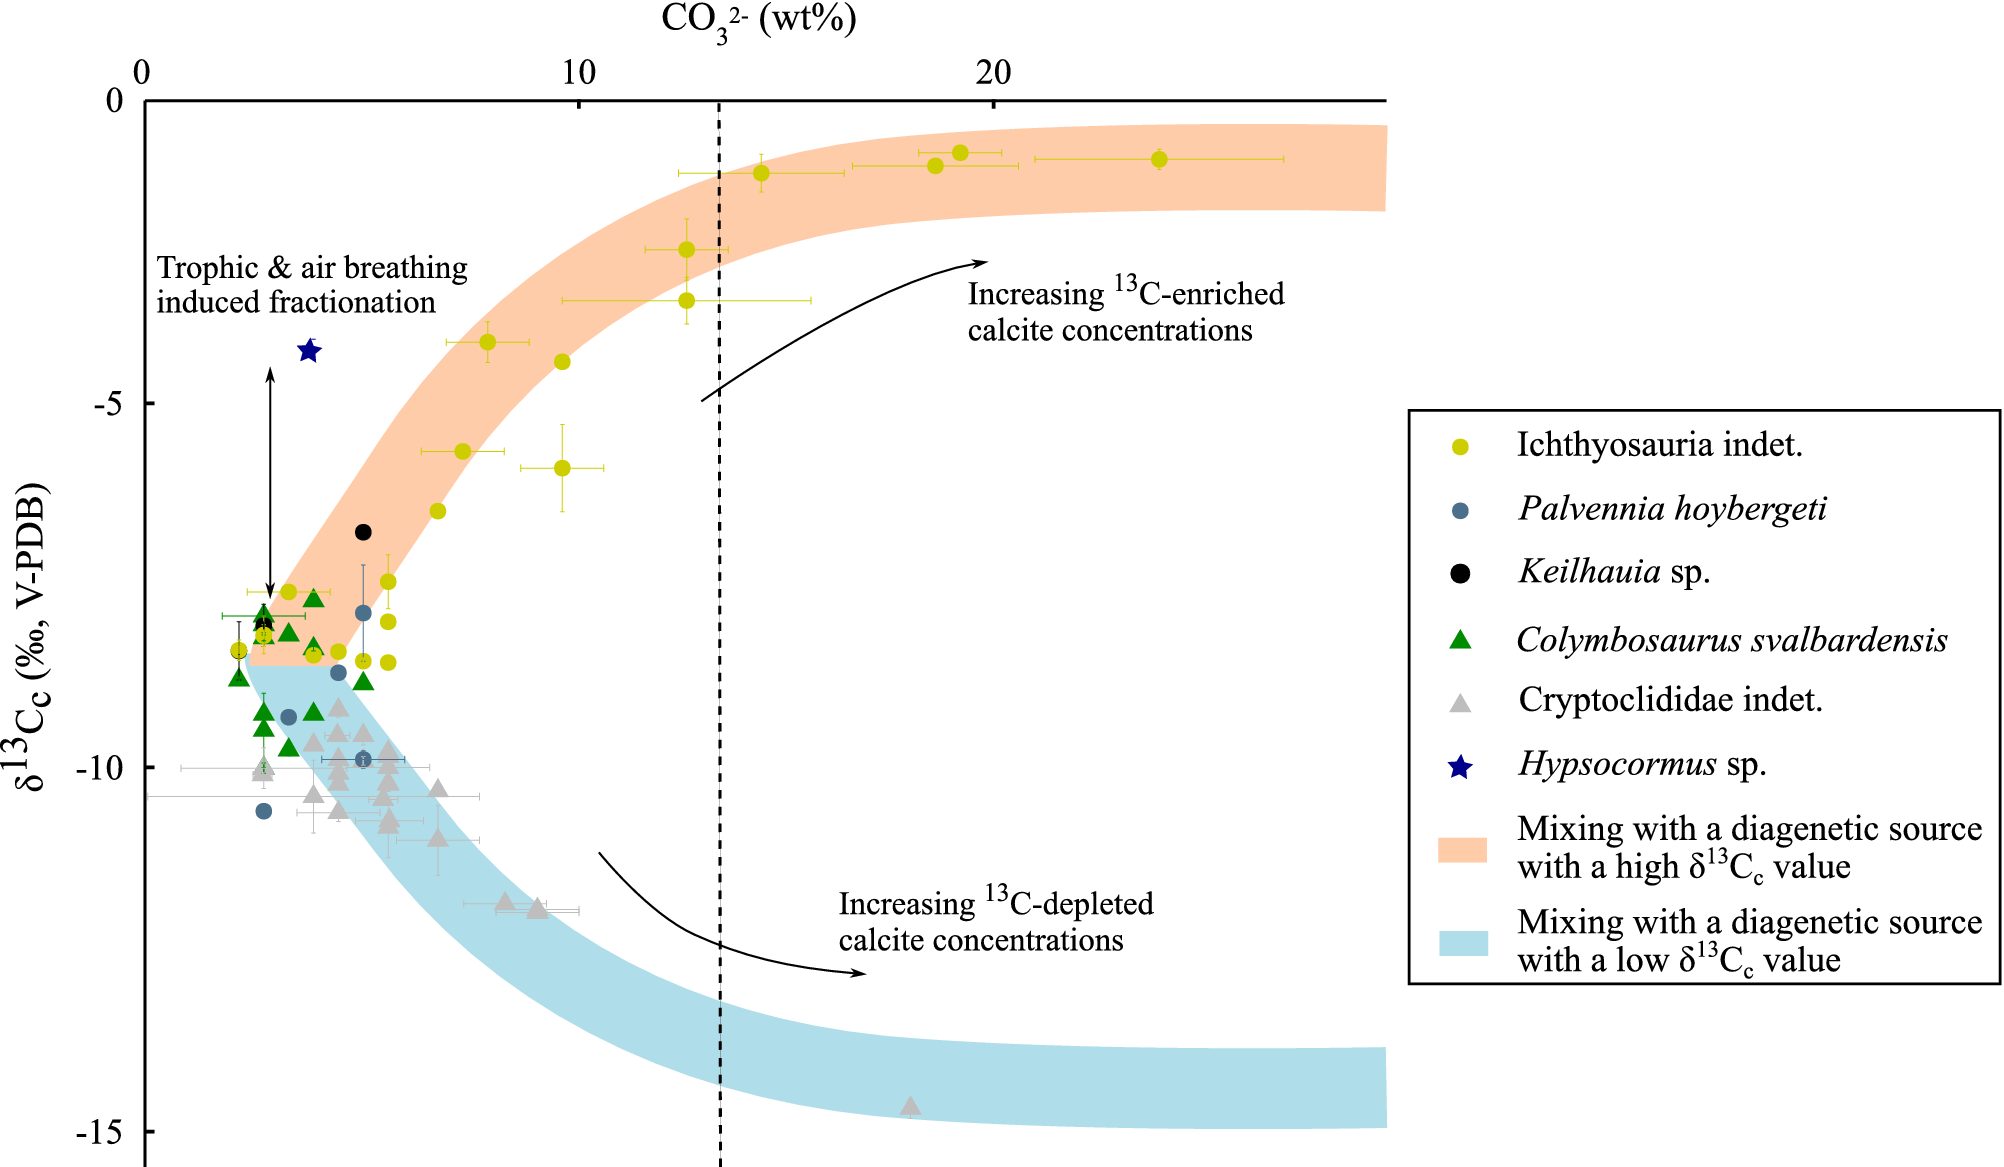
Finally, most of the δ13Cc values, when plotted against CO32− (wt%), conform to two different mixing lines. In the specimen of Cryptoclididae indet. from Spitsbergen, the data point to variable amounts of secondary calcite with δ13Cc values of −15‰ (Fig. 9), which indicates a 13C-depleted organic carbon source typical of the sulfate reduction zone (Meister and Reyes Reference Meister and Reyes2019). In the specimen of Ichthyosauria indet., the data point to variable amounts of more 13C-enriched secondary calcite with δ13Cc values of ~0‰, in agreement with the value of −0.1‰ measured on intra-bone calcite sampled from the same specimen. These higher isotopic values could either reflect an early precipitation of calcium carbonate close to the sediment–seawater interface with a significant seawater influence or formation below the sulfate reduction zone close to a 13C-enriched methanogenic CO2 source (Meister and Reyes Reference Meister and Reyes2019). In both specimens, δ13Cc values point to an almost identical, well-preserved end-member with low CO32− contents (<10%) and δ13Cc values of −8‰ to −10‰ VPDB dominated by structural bioapatite carbonates. The range of δ13Cc values recorded for these CO32−-poor samples of marine reptiles are identical to that previously reported for ancient air-breathing vertebrates (Séon et al. Reference Séon, Amiot, Martin, Young, Middleton, Fourel, Picot, Valentin and Lécuyer2020), but substantially lower than the δ13Cc values recorded in the pachycormid Hypsocormus sp. teeth measured from Les Ardilles and from coeval fossil fishes (−5.47‰ to +3.15‰ VPDB; Séon et al. Reference Séon, Amiot, Martin, Young, Middleton, Fourel, Picot, Valentin and Lécuyer2020). As expected, air-breathing reptiles have lower δ13Cc values than fish. In fact, the δ13C values of air-breathing reptiles mainly reflect those of their diet, with isotopic fractionation depending on their digestive physiology (Passey et al. Reference Passey, Robinson, Ayliffe, Cerling, Sponheimer, Dearing, Roeder and Ehleringer2005). In fish, on the other hand, the δ13C values of carbonate come from the diet, but also from the contribution of a large amount of dissolved inorganic carbon in the surrounding water (McConnaughey et al. Reference McConnaughey, Burdett, Whelan and Paull1997), which has a high δ13C value (~0‰ to 2‰; Santos et al. Reference Santos, Ferguson, Acaylar, Johnson, Griffin and Druffel2011). These features demonstrate that, despite the different taphonomic history suggested by the diagenetic δ13Cc values at the two sites, the geochemical signature of the CO32−-poor samples is preserved and hence paleobiologically informative.
The δ13Cc values (‰, VPDB) of bone elements and teeth in ichthyosaurs and plesiosaurs as a function of carbonate content (wt%). The values corresponding to the Hypsocormus sp. tooth found in the same stratigraphic layer as the Ichthyosauria indet. specimen are also plotted. The dotted line marks the boundary between mineralized elements with a carbonate content greater than or less than +13.4%.

From here on, based on the evidence provided by mineralogical and isotope proxies, we assume that δ18Op values from most of the Ichthyosauria, Plesiosauria, and Metriorhynchidae samples, except the Keilhauia nui specimen (PMO 222.655), have kept at least a significant part of their original oxygen isotope compositions and might be interpreted in terms of thermophysiology. As a precaution, we removed all the skeletal elements for which doubt was expressed regarding the preservation of the original isotopic signal (mineralogical, carbonate content, and isotope clues; Supplementary Table 1).
Intraskeletal Body Temperature Distribution in Ichthyosauria, Plesiosauria, and Metriorhynchidae
The oxygen isotope composition of air-breathing aquatic tetrapods is controlled by their body temperatures, the proportion and isotopic composition of metabolic and drinking waters, and the breathing-induced isotope enrichment factor relative to these sources of waters. The possible occurrence of salt glands in at least some taxa of Metriorhynchidae (Fernández and Gasparini Reference Fernández and Gasparini2000, Reference Fernández and Gasparini2008; Gandola et al. Reference Gandola, Buffetaut, Monaghan and Dyke2006; Cowgill et al. Reference Cowgill, Fls, Schwab, Walsh, Witmer, Herrera, Dollman, Turner and Brusatte2023), Ichthyosauria (Wahl Reference Wahl2012; Campos et al. Reference Campos, Fernández and Herrera2020; Massare et al. Reference Massare, Wahl and Lomax2021), and Plesiosauria (Buchy et al. Reference Buchy, Frey and Salisbury2006; O’Gorman and Gasparini Reference O’Gorman and Gasparini2013; Páramo-Fonseca et al. Reference Páramo-Fonseca, Benavides-Cabra and Gutiérrez2019) indicates that they would have been able to drink seawater to maintain their water balance. We thus consider that seawater was the main source of water and thus oxygen, as is the case in extant reptiles with salt glands (Rash and Lillywhite Reference Rash and Lillywhite2019). Because the δ18Osw value influencing δ18Op values can vary over time and specific regions, the timing of oxygen incorporation into the bone and tooth bioapatite needs to be identified to accurately compare the δ18Op values of different skeletal elements and identify potential regional heterothermies.
Similar to most reptiles, Ichthyosauria, Plesiosauria, and Metriorhynchidae continuously replaced their teeth. According to the studies conducted by Kear et al. (Reference Kear, Larsson, Lindgren and Kundrat2017) and Maxwell et al. (Reference Maxwell, Caldwell and Lamoureux2011a,Reference Maxwell, Caldwell, Lamoureux and Budneyb, Reference Maxwell, Caldwell and Lamoureux2012), the mineralization time for the teeth was estimated to be at most 2 to 3 years for plesiosaurs and approximately 1 year for ichthyosaurs. Although there is currently no available information regarding the tooth renewal time of Metriorhynchidae, it can be assumed that it was comparable to that of extant crocodylomorphs, which is approximately 3 to 15 months (Erickson Reference Erickson1996; Finger et al. Reference Finger, Thomson and Isberg2019). In Ichthyosauria and Plesiosauria, bones underwent regular remodeling throughout life, as evidenced by studies conducted by Kolb et al. (Reference Kolb, Sánchez-Villagra and Scheyer2011), Delsett and Hurum (Reference Delsett and Hurum2012), Houssaye et al. (Reference Houssaye, Scheyer, Kolb, Fischer and Sander2014), and O’Keefe et al. (Reference O’Keefe, Sander, Wintrich and Werning2019). For the Metriorhynchidae, cyclical growth marks in some bones indicate little bone remodeling and lack of or few secondary osteons (Hua and de Buffrénil Reference Hua and de Buffrénil1996; de Buffrénil et al. Reference de Buffrénil, Laurin, Jouve, de Buffrénil, de Ricqlès, Zylberberg and Padian2021); thus, the time recorded in the bones is likely to be slightly longer. The δ18Op values of the teeth and bones of Ichthyosauria, Plesiosauria, and Metriorhynchidae can be compared, as these tissues record a period ranging from one to several years. Furthermore, the annual and seasonal fluctuations in modern δ18Osw values in the open ocean and the depositional environments in which the marine reptiles studied were discovered (Hammer et al. Reference Hammer, Nakrem, Little, Hryniewicz, Sandy, Hurum, Druckenmiller, Knutsen and Høyberget2011; Lebrun and Courville Reference Lebrun and Courville2013; Delsett et al. Reference Delsett, Novis, Roberts, Koevoets, Hammer, Druckenmiller and Hurum2016) are typically only a few tenths of a per mille (~ ±0.5‰; LeGrande and Schmidt Reference LeGrande and Schmidt2006), so this alone cannot fully explain the observed intraindividual δ18Op variations in ichthyosaurs and plesiosaurs of more than 1‰ to 3‰. Thus, we postulate that the δ18Op variability recorded in bones and teeth from the Ichthyosauria, Plesiosauria, and Metriorhynchidae studied mostly reflects temperature variations. Nevertheless, this supposition is contingent upon the absence of migration for these animals. It is possible that migrations between high and low latitudes, as well as between open-marine environments and restricted or brackish environments, may exert a considerable influence in intraskeletal δ18Op variability. A further limitation of this study is the lack of information available regarding the migratory patterns of these taxa, which precludes an investigation into this possibility.
Assuming that the temporal variation in the oxygen isotope composition of the body water of Ichthyosauria, Plesiosauria, and Metriorhynchidae is approximately constant over time, as was shown in modern vertebrates (cetaceans: Séon et al. Reference Séon2023; sheep: Green et al. Reference Green, Olack and Colman2018), we can infer the range of mineralization temperatures across their bodies using the δ18Op values of the geochemically best-preserved skeletal elements. Thus, using the equation of Lécuyer et al. (Reference Lécuyer, Amiot, Touzeau and Trotter2013), we obtain a mineralization temperature range of approximately 8°C to 12°C for Ichthyosauria (Fig. 1), 4°C to 12°C for Plesiosauria (Fig. 2), and on the order of 4°C to 5°C for Metriorhynchus aff. superciliosus (Fig. 3). In comparison, the mineralization temperature range of skeletal elements estimated from bone δ18Op is around 8°C to 12°C for extant homeothermic endotherms Cetacea and Pinnipedia, 10°C for poikilothermic endotherm Atlantic bluefin tuna, and 15°C for poikilothermic endotherm swordfish (Séon et al. Reference Séon, Amiot, Suan, Lécuyer, Fourel, Demaret, Vinçon-Laugier, Charbonnier and Vincent2022, Reference Séon, Amiot, Suan, Lécuyer, Fourel, Vinçon-Laugier, Charbonnier and Vincent2024), while direct measurement of body temperature range for poikilothermic ectotherms such as crocodiles and turtles has been estimated to be ~10°C (Dunham et al. Reference Dunham, Grant and Overall1989; Markwick Reference Markwick1998). Note that for specimens of Elasmosauridae indet. and Metriorhynchus aff. superciliosus, we were unable to analyze distal skeletal elements belonging to the appendicular skeleton (not preserved), which may explain why the mineralization temperature ranges for these specimens are narrower than for the other analyzed taxa (Figs. 2, 3). For all specimens, the comparison between the different skeletal regions does not allow us to identify heterothermies in Mesozoic marine reptiles. Indeed, we did not observe the expected colder limbs and tails and differences in neck temperatures in Plesiosauria. This could, in part, be the result of a homogenization of the δ18Op values of bones, or at least a reduction in the original differences, by the various postmortem diagenetic processes and not detected by the methods used here (Raman spectroscopy, δ18Oc − δ18Op offset), as has been hypothesized previously by other authors who have studied the intraskeletal variations in the δ18O of extinct organisms (Barrick and Showers Reference Barrick and Showers1994). Significant differences in δ18Op values of the dorsal region (vertebrae, ribs, girdle bones) and the limbs are only observed for the specimen of Colymbosaurus svalbardensis (Fig. 4). However, the differences observed are contrary to what we would have expected. This would indicate a higher average temperature of mineralization of the hindlimbs compared with the skeletal elements of the trunk (vertebrae, ribs, pectoral, and pelvic bones). In the specimen of Colymbosaurus svalbardensis (PMO 222.663), skeletal elements of the anterior region (dorsal vertebrae, ribs, left and right forelimbs) have significantly higher values than those of the posterior region (left and right hindlimbs and caudal vertebrae). These significant differences in δ18Op appear unusual in terms of thermoregulatory strategies and could be the result of a preservation difference between the more weathered anterior and posterior skeletal elements of the specimen (Delsett et al. Reference Delsett, Novis, Roberts, Koevoets, Hammer, Druckenmiller and Hurum2016). Regarding the limbs of Plesiosauria, the osteo-histological study carried out by Delsett and Hurum (Reference Delsett and Hurum2012) on two specimens of Colymbosaurus svalbardensis (PMO 216.838, PMO 216.377) indicates that the most distal limb bone elements display growth striations, perhaps resulting from cyclic growth. In our study, our data reveal no clear relationship between δ18Op values and the position of the skeletal element within the limb (Fig. 5A). Thus, no body temperature gradient can be identified in the limb of Plesiosauria based on the geochemical approach. An identical conclusion can be drawn regarding the possible presence of a temperature gradient in the neck of Plesiosauria, as our detailed mapping of the cervical region shows no relationship between δ18Op and vertebral position (Fig. 5B). Finally, the only systematic trend recorded in our dataset concerns teeth, which, when analyzed alongside bones from the same organism, exhibit higher δ18Op values than the bones, including skull elements located close to the analyzed teeth in Keilhauia sp. specimen PMO 222.667 and Palvennia hoybergeti specimen PMO 222.669 (Fig. 4). Interestingly, similar observations have been made in odontocetes (Barrick et al. Reference Barrick, Fischer, Kolodny, Luz and Bohaska1992; Séon et al. Reference Séon, Amiot, Suan, Lécuyer, Fourel, Demaret, Vinçon-Laugier, Charbonnier and Vincent2022), which would indicate that teeth mineralize at lower temperatures than skull bones (lack of insulating tissue on the rostrum). However, the number of teeth analyzed makes it impossible to determine whether these differences are significant or not. Furthermore, in the monophyodont odontocetes, there is the influence of lactation, which probably includes uncertainties in the interpretation of odontocete tooth δ18Op and makes them incomparable with Ichthyosauria. On the other hand, Séon et al. (Reference Séon, Amiot, Suan, Lécuyer, Fourel, Demaret, Vinçon-Laugier, Charbonnier and Vincent2022) observed no δ18Op differences between teeth and skull bones in the polyphyodont Atlantic bluefin tuna. Differences in δ18Op values between teeth and bones in Ichthyosauria could be explained by a difference in mineralization temperature at the rostrum of about 3°C to 4°C, but the lower number of values available for each of these observation series means that we must be cautious about such considerations. Indeed, the observed higher values from the teeth could also result from differences in isotopic preservation between tooth enamel and bones.
Reassessment of Ichthyosauria, Plesiosauria, and Metriorhynchidae Body Temperature and Thermoregulatory Strategies
Previous isotope-based reconstructions of extinct marine reptile body temperatures opted for an 18O-enrichment of body water relative to drinking water of +2‰ (Bernard et al. Reference Bernard, Lécuyer, Vincent, Amiot, Bardet, Buffetaut and Cuny2010; Séon et al. Reference Séon, Amiot, Martin, Young, Middleton, Fourel, Picot, Valentin and Lécuyer2020; Leuzinger et al. Reference Leuzinger, Kocsis, Luz, Vennemann, Ulyanov and Fernández2023), originally estimated by Amiot et al. (Reference Amiot, Lécuyer, Escarguel, Billon-Bruyat, Buffetaut, Langlois, Martin, Martineau and Mazin2007) from body fluids of young Nile crocodiles (Crocodylus niloticus), and Barrick et al. (Reference Barrick, Fischer and Showers1999) for turtles (Chrysemys sp.). These species have a semiaquatic ecology, low body mass (1.2 kg to 5 kg), and relatively low metabolic rates. We therefore consider that a +2‰ enrichment of body water relative to environmental water may not be the most appropriate value for Mesozoic fully marine reptiles. We considered instead the +0.8 ± 0.9‰ enrichment value measured by Séon et al. (Reference Séon2023) for fully aquatic air-breathing vertebrates (Orcinus orca and Tursiops truncatus; 150 to 3600 kg), which appears more appropriate considering the ecology, the size, and the putative thermo-metabolism of the Ichthyosauria, Plesiosauria, and Metriorhynchidae studied here.
To reassess Ichthyosauria, Plesiosauria, and Metriorhynchidae body temperatures, we have favored the use of tooth enamel, as its robustness against diagenetic alteration has been demonstrated in previous studies (Lowenstam and Weiner Reference Lowenstam and Weiner1989; Sillen and LeGeros Reference Sillen and LeGeros1991; Kohn et al. Reference Kohn, Schoeninger and Barker1999; Lee-Thorp and Sponheimer Reference Lee-Thorp and Sponheimer2003; Gehler et al. Reference Gehler, Tütken and Pack2011). A last important change in our work relative to previous studies is the use of a spatially variable δ18Osw values calculated using the hemispheric gradient proposed by Alberti et al. (Reference Alberti, Leshno, Fürsich, Edelman-Furstenberg, Andersen and Garbe-Schönberg2020). This gradient places δ18Osw highest values in subtropical areas subject to high evaporation and lowest values in high-latitude seas receiving high fluvial input from surrounding large continental areas, consistent with both modeling (Zhou et al. Reference Zhou, Poulsen, Pollard and White2008) and empirical evidence (Letulle et al. Reference Letulle, Suan, Daëron, Rogov, Lécuyer, Vinçon-Laugier, Reynard, Montagnac, Lutikov and Schlögl2022). We thus consider this scenario as far more realistic than the δ18Osw hypothesis used previously (Bernard et al. Reference Bernard, Lécuyer, Vincent, Amiot, Bardet, Buffetaut and Cuny2010; Séon et al. Reference Séon, Amiot, Martin, Young, Middleton, Fourel, Picot, Valentin and Lécuyer2020). Together, the use of revised values and spatial changes in δ18Osw values produce new body temperature estimates of Ichthyosauria, Plesiosauria, and Metriorhynchidae that are 3°C to 6°C lower than estimated previously (Bernard et al. Reference Bernard, Lécuyer, Vincent, Amiot, Bardet, Buffetaut and Cuny2010; Séon et al. Reference Séon, Amiot, Martin, Young, Middleton, Fourel, Picot, Valentin and Lécuyer2020; Supplementary Table 2, Supplementary Fig. 5).
According to our new estimates, Ichthyosauria maintained their body temperatures at a constant value well above environmental values (Fig. 8A) and can be considered as homeothermic endotherms, consistent with previous isotope-based studies (Bernard et al. Reference Bernard, Lécuyer, Vincent, Amiot, Bardet, Buffetaut and Cuny2010; Séon et al. Reference Séon, Amiot, Suan, Lécuyer, Fourel, Demaret, Vinçon-Laugier, Charbonnier and Vincent2022). Nevertheless, the body temperature values estimated (45 ± 2°C) for the ichthyosaurs of the Slottsmøya Member (Palvennia hoybergeti and Keilhauia sp.) are higher than those of present-day homeothermic endothermic marine vertebrates, based on a δ18Osw value of −1.5‰ from the equation of Alberti et al. (Reference Alberti, Leshno, Fürsich, Edelman-Furstenberg, Andersen and Garbe-Schönberg2020). However, this equation is calibrated between 0° and 40°N, and it is probable that this δ18Osw value of −1.5‰ is overestimated, given that ocean basins such as the Arctic Ocean at the time were landlocked and were therefore likely to be subject to freshwater input from precipitation runoff. Estimates from numerical modeling for the middle Cretaceous indicate δ18Osw values of −5 ± 2‰ for this region (Zhou et al. Reference Zhou, Poulsen, Pollard and White2008). Based on this modeled δ18Osw value, the estimated body temperature of ichthyosaurs from the Slottsmøya Member would have been 31 ± 4°C, confirming the homeothermic and endothermic nature of Ichthyosauria. In contrast to previous studies, however, our results indicate that Plesiosauria, as well as Metriorhynchidae, had body temperatures higher than but covarying with environmental temperatures, and hence should be considered poikilothermic endotherms. We note that the estimated Metriorhynchidae body temperatures are closer to those of their environmental values than in Plesiosauria (Fig. 8B,C). These thermoregulatory strategies are largely consistent with other indices linked to paleobiogeography, morphology, locomotion, and estimated metabolic rates.
Indeed, Ichthyosauria would have been able to live in high-latitude environments (Delsett et al. Reference Delsett, Novis, Roberts, Koevoets, Hammer, Druckenmiller and Hurum2016; Rogov et al. Reference Rogov, Zverkov, Zakharov and Arkhangelsky2019) where ocean paleotemperatures were too low for ectothermic turtles and crocodylomorphs to survive, as evidenced by their absence in high-latitude deposits from the same stratigraphic levels (Rich et al. Reference Rich, Vickers-Rich and Gangloff2002; Bardet et al. Reference Bardet, Falconnet, Fischer, Houssaye, Jouve, Suberbiola, Pérez-García, Rage and Vincent2014). This would have been greatly facilitated by their high metabolic rates (de Buffrénil and Mazin Reference de Buffrénil and Mazin1990; Nakajima et al. Reference Nakajima, Houssaye and Endo2014; Anderson et al. Reference Anderson, Druckenmiller, Erickson and Maxwell2019) and their fusiform morphology, which is very effective in limiting heat loss to the environment (Innes et al. Reference Innes, Worthy, Lavigne and Ronald1990; Gearty et al. Reference Gearty, McClain and Payne2018), coupled with a subcutaneous layer of adipose tissue reducing thermal conductivity (Lindgren et al. Reference Lindgren, Sjövall, Thiel, Zheng, Ito, Wakamatsu, Hauff, Kear, Engdahl and Alwmark2018; Delsett et al. Reference Delsett, Friis, Kölbl-Ebert and Hurum2022). Nevertheless, this could only be the case for the most recent ichthyosaurs in the evolution of the lineage, such as parvipelvian and thunniform ichthyosaurs of the Ophthalmosauridae family. Indeed, primitive Ichthyosauria had more anguiliform morphologies and, as far as we know, no adipose tissue has been found in these specimens (Motani Reference Motani2005; Moon and Stubbs Reference Moon and Stubbs2020).
For Plesiosauria, the characterization of their thermoregulatory strategy is more ambiguous, and our results differ interestingly from those for ichthyosaurs and to some extent contrast with previous studies (Bernard et al. Reference Bernard, Lécuyer, Vincent, Amiot, Bardet, Buffetaut and Cuny2010; Séon et al. Reference Séon, Amiot, Martin, Young, Middleton, Fourel, Picot, Valentin and Lécuyer2020; Leuzinger et al. Reference Leuzinger, Kocsis, Luz, Vennemann, Ulyanov and Fernández2023). High metabolic rates close to those of modern endotherms are supported by the plesiosaurs’ paleobiogeographic distribution (Bardet et al. Reference Bardet, Falconnet, Fischer, Houssaye, Jouve, Suberbiola, Pérez-García, Rage and Vincent2014; Delsett et al. Reference Delsett, Novis, Roberts, Koevoets, Hammer, Druckenmiller and Hurum2016; Zverkov et al. Reference Zverkov, Grigoriev and Danilov2021), osteo-histological evidence (Wiffen et al. Reference Wiffen, De Buffrénil, De Ricqlès and Mazin1995; Kear Reference Kear2006a; Delsett and Hurum Reference Delsett and Hurum2012; Fleischle et al. Reference Fleischle, Wintrich and Sander2018; O’Keefe et al. Reference O’Keefe, Sander, Wintrich and Werning2019; Sander and Wintrich Reference Sander, Wintrich, de Buffrénil, de Ricqlès, Zylberberg and Padian2021), and the identification and quantification of compounds resulting from the degradation of lipids and carbohydrates by infrared spectroscopy (Wiemann et al. Reference Wiemann, Menéndez, Crawford, Fabbri, Gauthier, Hull, Norell and Briggs2022). So far, no evidence for a subcutaneous layer of adipose tissue has been reported in Plesiosauria, but this might be a sampling artifact, as specimens exhibiting soft-tissue preservation are exceptionally rare (Vincent et al. Reference Vincent, Allemand, Taylor, Suan and Maxwell2017). On the other hand, our new data from teeth show that their body temperatures covaried to some extend with environmental temperatures. One possible explanation that may reconcile these apparently contradictory observations is that Plesiosauria produced heat through their locomotor muscles. This heat production strategy is indeed used by sea turtles with the same type of locomotion and enables them to have core body temperatures higher than the rest of the body (Standora et al. Reference Standora, Spotila and Foley1982; Sato et al. Reference Sato, Sakamoto, Matsuzawa, Tanaka and Naito1994). The heat generated by muscle contraction may then partly be conserved by the inertia of their body mass (gigantothermy), as in the case of leatherback turtles (Paladino et al. Reference Paladino, O’Connor and Spotila1990; Sato Reference Sato2014), whose bone histology studies show evidence of elevated growth rate and high metabolic rate (Nakajima et al. Reference Nakajima, Houssaye and Endo2014; Wilson Reference Wilson2023). The existence of a comparable heat production system in Plesiosauria may thus partly explain the recorded difference between their body temperatures and their environments as well as their inability to maintain their body temperature at a constant level in the thermally least favorable environments (high latitudes).
Metriorhynchidae differed from the previous two in terms of their geographic distribution, which was restricted to tropical zones (Bardet et al. Reference Bardet, Falconnet, Fischer, Houssaye, Jouve, Suberbiola, Pérez-García, Rage and Vincent2014), and show osteo-histological features (Hua and de Buffrénil Reference Hua and de Buffrénil1996; de Buffrénil et al. Reference de Buffrénil, Laurin, Jouve, de Buffrénil, de Ricqlès, Zylberberg and Padian2021) indicative of a poikilothermic ectothermic thermoregulatory strategy. While Metriorhynchidae were initially considered to be active hunters (Massare Reference Massare1987; Young and de Andrade Reference Young and de Andrade2009; de Andrade et al. Reference de Andrade, Young, Desojo and Brusatte2010; Young et al. Reference Young, Brusatte, De Andrade, Desojo, Beatty, Steel, Fernández, Sakamoto, Ruiz-Omeñaca and Schoch2012), it was later postulated that some species could also have been scavengers and opportunists (Hua et al. Reference Hua, Liston and Tabouelle2024), a strategy that does not require the production of long and intense efforts, in agreement with the estimates of their movement speed (Massare Reference Massare1988; Massare et al. Reference Massare, Maddock, Bone, Rayner, Maddock, Bone and Rayner1994; Gutarra et al. Reference Gutarra, Stubbs, Moon, Heighton and Benton2023). Although their body temperatures have been considered as slightly higher than those of their environments (Séon et al. Reference Séon, Amiot, Martin, Young, Middleton, Fourel, Picot, Valentin and Lécuyer2020), our revised estimates point to much lower differences than previously estimated. Interestingly, Gienger et al. (Reference Gienger, Brien, Tracy, Manolis, Webb, Seymour and Christian2017) showed that the standard metabolic rate values measured in saltwater crocodiles (Crocodylus porosus) are 36% higher than those of other taxa such as American alligator (Alligator mississippiensis) or freshwater crocodile (Crocodylus johnstoni). However, this difference in metabolic rate is not visible in the osteo-histological sections taken from these species (de Buffrénil et al. Reference de Buffrénil, Laurin, Jouve, de Buffrénil, de Ricqlès, Zylberberg and Padian2021). Metriorhynchidae may therefore have had a higher metabolic rate, but this difference would not be recorded in bone tissue. We therefore speculate that the production of metabolic heat could have been linked to vital organs such as intestines or liver as well as the locomotor muscles, which, as in tuna, would have been internalized and close to the spinal column and would have limited heat loss to the surrounding aquatic environment (Graham and Dickson Reference Graham and Dickson2004).
Conclusion
The reassessment of oxygen isotope–based body temperature estimates of Ichthyosauria, Plesiosauria, and Metriorhynchidae have led to a reconsideration of their thermoregulatory strategies. The intraskeletal δ18Op variability in four specimens of Ichthyosauria, three specimens of Plesiosauria, and one specimen of Metriorhynchus aff. superciliosus did not allow us to characterize and locate regional heterothermies. This may be due to the impact of diagenetic processes on the original oxygen isotope composition of bone bioapatite. The newly measured δ18Op from the teeth of Ichthyosauria specimens from high paleolatitudes confirms that these organisms had body temperatures higher than those of their living environments and were probably homeothermic endotherms with body temperature ranging between 31°C and 37°C. In contrast to Ichthyosauria, it appears that the body temperatures of Plesiosauria and Metriorhynchidae were influenced by changes in environmental temperatures. Therefore, they were most likely poikilothermic endotherms, such as some extant sea turtles and tunas. Nevertheless, the thermoregulatory strategy of Metriorhynchidae remains difficult to characterize, because their body temperature estimates are very close to those of their environments, and they could be defined as either poikilothermic endotherms or poikilothermic ectotherms. Further investigations are needed to clearly define their thermoregulatory strategy. Finally, the independency of Ichthyosauria body temperatures relative to environmental temperatures, confirmed by our study, places these organisms as promising tracers of spatiotemporal changes in δ18Osw values that could allow for improved Mesozoic paleoclimate reconstructions.
Acknowledgments
Stable isotope measurements were performed at the Plateforme d’Ecologie Isotopique du Laboratoire d’Ecologie des Hydrosystèmes Naturels et Anthropisés (LEHNA, UMR5023, Université Claude Bernard Lyon 1, Lyon, France) and Raman spectroscopy analyses at the Plateforme de Spectroscopie Raman du Laboratoire de Géologie de Lyon (LGL-TPE, UMR5276, Université Claude Bernard Lyon 1). The authors warmly thank the heads and the people responsible for the collection of the Natural History Museum of Oslo, Norway, M. Fouché and S. Rajaofera from the Muséum d’Histoire Naturelle d’Auxerre, France, N. Morel from the Muséum d’Histoire Naturelle Le Mans, and Laurent Picot from the Paléospace museum for allowing us to sample specimens in their respective collections. This study was funded by the ANR-OXYMORE (grant no. ANR-18-CE31-0020) and the project 335111 of the Norwegian Research Council. The authors would like to thank the two reviewers for their helpful comments, which helped to improve the article.
Competing Interests
The authors declare no competing interests.
Data Availability Statement
The detailed datasets produced and used for analysis are included as Supplementary Information and Figures on Zenodo (https://zenodo.org/records/14172945), while Supplementary Tables are available on Dryad (https://doi.org/10.5061/dryad.8gtht76zf).

 Open access