


Typical to Western societies(Reference Godfray, Aveyard and Garnett1,Reference Cocking, Walton and Kehoe2) , 79 % of Finnish men and 26 % of women exceed the nutritional recommendation of consuming no more than 500 g/week of red and processed meat (RPM)(Reference Valsta, Kaartinen and Tapanainen3,4) . This amount far exceeds the recommendation of the Planetary Health Diet (RPM max 196 g/week) by the EAT-Lancet Commission(Reference Willett, Rockström and Loken5). The Commission states that there is a need to decrease the consumption of animal-based protein and increase the consumption of plant-based protein to support the transition towards more sustainable food systems as well as healthier diets(Reference Willett, Rockström and Loken5). Plant-based diets have been associated with a lower risk of chronic diseases, such as obesity, type 2 diabetes, CVD and certain cancers, which may be attributable to higher intakes of nutritionally beneficial substances such as fibre(Reference Melina, Craig and Levin6,Reference Neufingerl and Eilander7) . On the other hand, plant-based diets may lead to lower intakes of nutrients important for maintaining bone health such as vitamin D and Ca(Reference Neufingerl and Eilander7,Reference Tucker8) . Their insufficiency can lead to bone loss through prolonged secondary hyperparathyroidism(Reference Christodoulou, Goula and Ververidis9). Recent meta-analyses have shown that both vegetarians and vegans have lower bone mineral content at the lumbar spine and femoral neck than omnivores, and vegans also have higher fracture rates(Reference Iguacel, Miguel-Berges and Gómez-Bruton10,Reference Li, Li and Wu11) . Thus, there is concern about whether more predominantly plant-based diets compromise bone health.
In addition to vitamin D and Ca, adequate protein intake is fundamental for maintaining bone health throughout life(Reference Bonjour12,Reference Ding, Cain and Davis13) . Protein contributes to bone mineralisation by enhancing intestinal Ca absorption and augmenting circulating concentrations of insulin-like growth factor I, which in turn stimulates osteoblastic function and bone formation(Reference Giustina, Mazziotti and Canalis14–Reference Darling, Millward and Lanham-New16). Furthermore, whether plant and animal protein sources contribute equally to bone health remains unknown. Most of the randomised controlled trials on plant protein and bone health have been carried out on soya protein, which is not generalisable to other protein sources(Reference Weaver17). A systematic review and meta-analysis investigating the effects of animal and plant (soya) protein did not find any differences in bone mineral density at various sites or in bone turnover in adults(Reference Shams-White and Chung18). In our previous 12-week randomised controlled trial using a whole-diet approach, partial replacement of animal-based proteins with various plant-based proteins (cereals, nuts, seeds, different pulses and green legumes, not only soya) accelerated bone turnover in healthy adults(Reference Itkonen, Päivärinta and Pellinen19). However, the observed results were most likely due to lower vitamin D and Ca intake in the intervention group receiving more plant proteins, leaving the role of protein and amino acids (AA) unclear.
Both cell and animal studies suggest that dietary protein could also directly affect bone metabolism via the actions of individual AA exerting a variety of different effects in bone metabolism(Reference Bihuniak and Insogna15). In many plant-based protein sources, lysine and sulfurous AA (methionine and cysteine) contents are low compared with protein synthesis requirements(Reference Schmidt, Rinaldi and Scalbert20,Reference Herreman, Nommensen and Pennings21) , but e.g. arginine is generally found in both animal- and plant-based sources. Lysine can be the limiting AA, especially if a plant-based diet comprises solely cereal protein(Reference Mariotti and Gardner22). Studies have shown that methionine can improve bone density and decrease osteoclast activity, whereas lysine and arginine have positive effects on Ca absorption and osteoblast collagen synthesis as well as on osteoblast proliferation(Reference Bihuniak and Insogna15). They can also reduce concentrations of the resorptive cytokine IL-6, which can be beneficial for bone formation(Reference Bihuniak and Insogna15). Thus, even partial replacement of animal protein with plant-based protein can alter AA intakes and lead to consequences to bone health. Accordingly, there is concern about whether higher plant protein intake will lead to inadequate intake of protein and essential AA in addition to the question of lower bioavailability(Reference de Gavelle, Huneau and Bianchi23). To date, the evidence regarding the effects of protein sources and their AA on bone health is inconclusive(Reference Ding, Cain and Davis13,Reference Deane, Bass and Crossland24) .
It is important to investigate ways to implement sustainable dietary changes, e.g. by increasing the amount of legumes in the diet especially among men because they consume RPM excessively(Reference Valsta, Kaartinen and Tapanainen3). However, as adherence to a diet containing more plant protein may cause a risk for bone health, we aimed to investigate whether partial replacement of RPM with non-soya legumes changes bone turnover, mineral metabolism and AA intakes in healthy working-aged men in a 6-week randomised trial. Moreover, we assessed whether intake of individual AA from different protein sources plays a role in bone turnover. To our knowledge, this is a unique approach because AA intakes particularly in randomised studies are rarely available.
Subjects and methods
Study design
The BeanMan intervention study was a 6-week randomised clinical trial conducted between September and December 2020 at the Department of Food and Nutrition, University of Helsinki, Finland. The trial was part of the large multidisciplinary project Leg4Life (Legumes for Sustainable Food System and Healthy Life, www.leg4life.fi). The study was partly controlled, non-blinded and carried out in a parallel design with participants randomly allocated to two equal-sized intervention groups. Intervention diets differed in the amount of RPM and legumes, and the intervention foods in both diets provided 25 % of total protein intake.
Study participants and randomisation
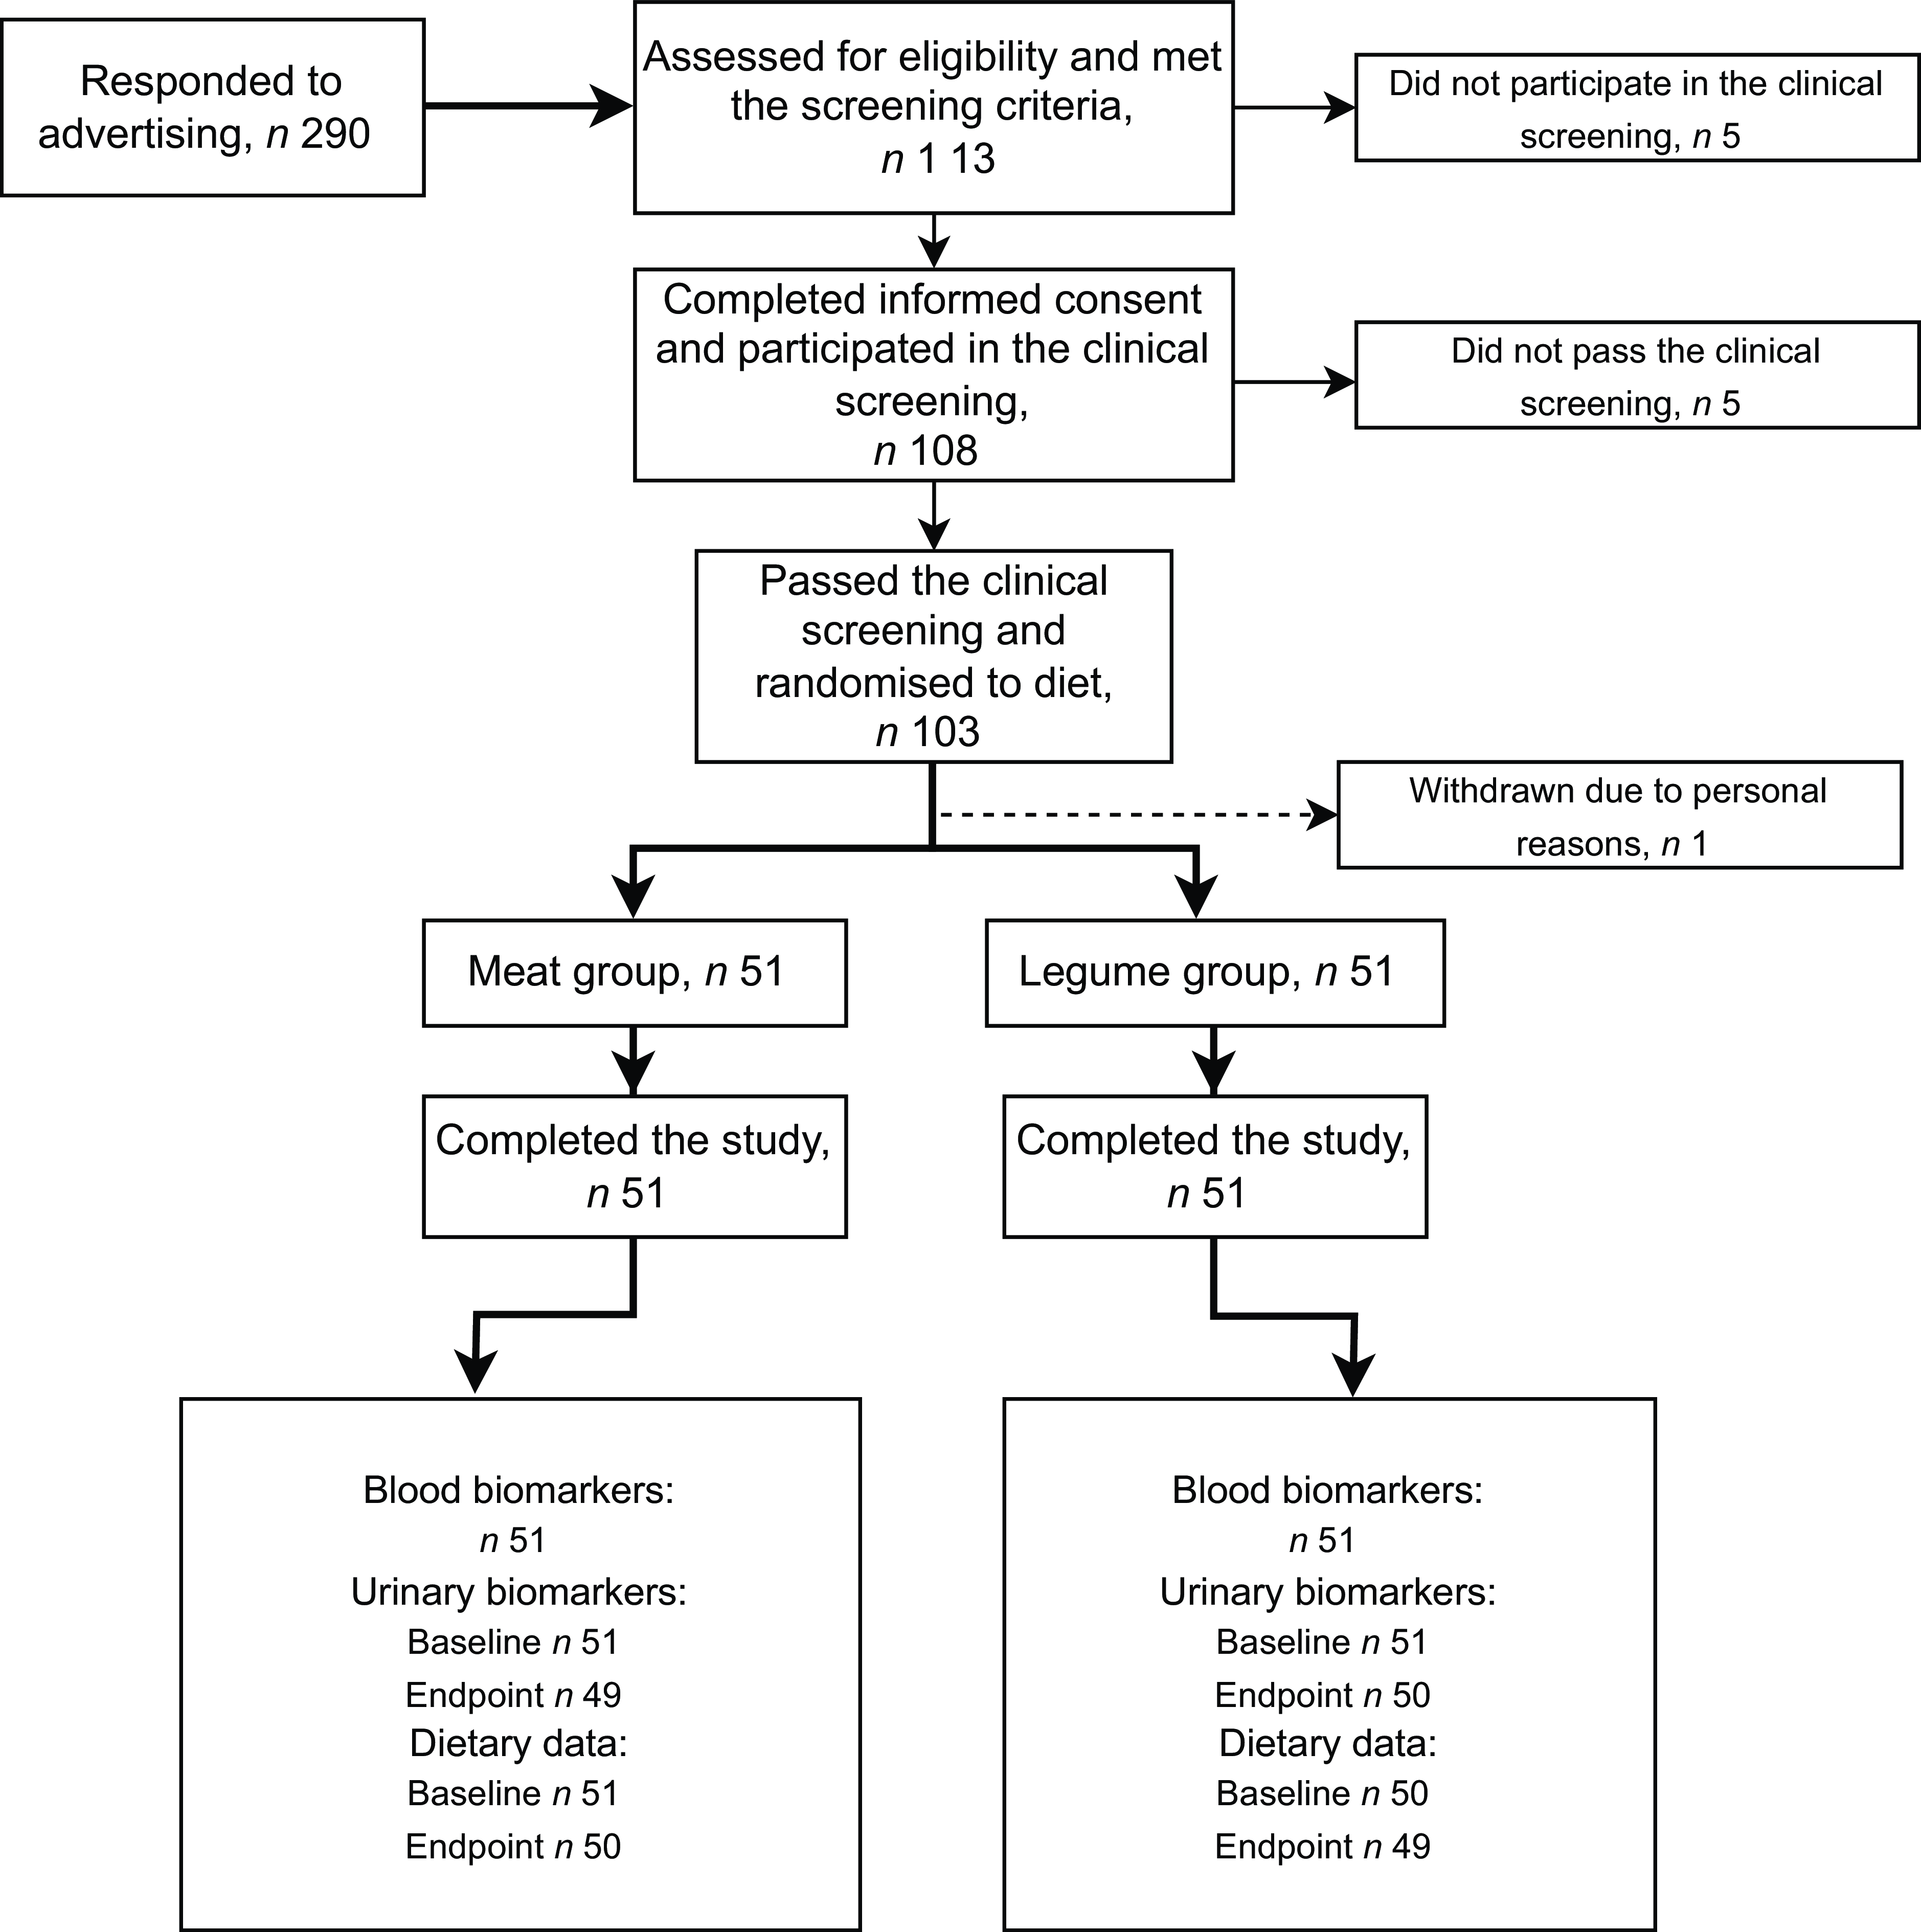
The participants were recruited through advertisements at the Leg4Life website, social media channels and university mailing lists. Study participants were healthy omnivorous men aged 20–65 years meeting eligibility criteria. Altogether 290 men responded to study advertisement, and 113 of them met the screening criteria interviewed by telephone, when also age of the potential participant was asked (Fig. 1). Exclusion criteria were inflammatory bowel disease, irritable bowel syndrome, coeliac disease, diabetes requiring medication, disorder of endocrine system or lipid metabolism, liver or kidney disease, cancer, regular or past (last three months) use of antibiotics, statin medication, allergies to the foods provided in the study, eating disorder, regular highly burdensome physical activity, smoking or snuff use, excessive high risk alcohol use (23–24 portions per week or more(25)) and due to the COVID-19 situation, travelling abroad within 14 d prior to the research visits. Altogether 108 men participated in the clinical screening at the research unit, where whole blood fingertip samples were taken after an overnight fast (10–12 h), and weight and height were measured for calculating BMI. Inclusion criteria based on clinical screening included fasting glucose concentration < 7 mmol/l, total cholesterol concentration <6·5 mmol/l and BMI 18·5–35 kg/m2. Altogether 103 men passed the screening, and one participant withdrew before the intervention (Fig. 1). Discontinuation of use of nutritional supplements was advised 2 weeks prior to the intervention. Only Finnish-speaking participants were recruited since the official language of the study was Finnish.
Flow diagram of the study of healthy men consuming diets that differed in proportions of red meat and legumes for six weeks. The meat group consumed 760 g of boneless and cooked red and processed meat per week, corresponding to 25 % of total protein intake. The legume group consumed legume-based products, corresponding to 20 % of total protein intake, and 200 g of red and processed meat per week, corresponding to 5 % of total protein intake. Endpoint dietary data were collected during the last week of the intervention. For urinary ANCOVA, n 49 for meat group, n 50 for legume group.
Recruitment of the participants was continued from the beginning of September until the last screening visits in mid-October 2020 when the adequate number of subjects was achieved. The research coordinator generated the allocation sequence and randomly assigned the eligible participants to the intervention groups within a similar deviation of age. The intervention was carried out staggered so that participants started their 6-week intervention period during six consecutive weeks between mid-September and October 2020. Equal numbers of participants in each diet group (See Intervention diets) started the intervention period each week. The minimum gap between the clinical screening and the start of the intervention was 5 days, generally being 1–2 weeks.
Intervention diets
Participants were randomised into two intervention diet groups differing in the amount of RPM and legumes. One group (‘Meat’) was supplemented with 760 g of cooked and boneless RPM per week, which represents the average consumption of RPM of Finnish men in terms of quantity and quality(Reference Valsta, Kaartinen and Tapanainen3). In such diet, the average protein intake is 98 g/d, corresponding to 18 % of energy intake and 25 % of total protein intake. The other group (‘Legume’) was supplemented with legumes and RPM such that 20 % of the total protein originated from non-soya legumes (mainly faba bean and pea-based products, also some green legumes) and 5 % from RPM (200 g of RPM per week, the upper limit of the Planetary Health Diet(Reference Willett, Rockström and Loken5)). Participants were advised not to include other RPM or significant amounts of legumes in their diet other than the products distributed in the study. The rest of the diet or energy intake was not controlled, and the participants followed their habitual diets. Participants received their intervention food items weekly either by visiting the research centre or through food delivery to the home or workplace. Food recipes were provided to help with implementation of the diets. The intervention food items were advised to be consumed within the instructed time period at home: fresh foods during the upcoming week and frozen foods that were all given at the first food delivery or pick up according to specific instructions. Due to the nature of the intervention, blinding was not possible.
Background characteristics of participants
The BuddyCare mobile patient monitoring and interaction application (version 4·39·0) that was specifically adapted for the BeanMan Study (https://www.buddyhealthcare.com/en/) was activated for the eligible participants during the clinical screening visit, and participants were advised to fill in a background questionnaire including questions on, e.g. age, education, physical activity, use of medications and dietary supplements and alcohol consumption. The question related to leisure-time physical activity recorded the frequency (times per week) of physical activity inducing shortness of breath and sweating. Workload was recorded by the type of work (sedentary/manual labour/unemployed). Alcohol consumption was recorded as frequency of consumption and number of servings consumed, e.g. one serving (12 g of 100 % alcohol) corresponds to a bottle (0·33 l) of medium strong beer, 12 cl of wine or 4 cl of spirits. Weight was measured at baseline and endpoint visits, and for the BMI calculation (weight (kg)/height (m2)), height measured at clinical screening was used (only baseline BMI reported in this paper). Estimated glomerular filtration rate describing kidney function was calculated using the CKD-EPI formula(Reference Levey, Stevens and Schmid26) based on participant’s age and serum creatinine concentration measured at the baseline and endpoint visits (only baseline estimated glomerular filtration rate reported in this paper).
Measurement of biochemical markers
Fasting blood samples (10–12 h) and 24-hour urine samples were collected at baseline and endpoint of the study and stored at −70°C and −20°C until analysis, respectively. MicroVue enzyme-linked immunoassay kits (Quidel) were used to analyse bone formation with bone-specific alkaline phosphatase (BAP) and bone resorption with tartrate-resistant acid phosphatase 5b (TRAP5b) concentrations in serum and intact fibroblast growth factor 23 (FGF23) concentrations in plasma at the Department of Food and Nutrition, University of Helsinki, Finland. Plasma intact PTH and serum total 25-hydroxyvitamin D (S-25(OH)D) concentrations were analysed by immunochemiluminometric method with Siemens Atellica® IM1600 analyser (Siemens) at Helsinki University Central Hospital Laboratories (Huslab), Helsinki, Finland. Serum calcium (S-Ca), phosphate (S-Pi) and creatinine (used for estimated glomerular filtration rate calculation) as well as urinary Ca, phosphorus, creatinine and urea concentrations were analysed using a photometric method by Indiko automatic analyser (Thermo Clinical Labsystems Oy) at the Department of Food and Nutrition, University of Helsinki, Finland. Intra-assay CV were ≤ 6·8 % for BAP, ≤ 3·5 % for TRAP5b, 4 % for PTH, < 3·9 % for FGF23, < 3·8 % for S-Ca and S-Pi and < 4·6 for urinary variables. Interassay CV were 4·8 % for BAP, 2·8 % for TRAP5b, 6 % for PTH, < 5·8 % for FGF23, < 3·8 % for S-Ca and S-Pi and < 4·6 for urinary variables. For S-25(OH)D, inter-assay CV were 12 % for the low control and 6 % for the high control, and the accuracy was assessed using an external quality control program (Bio-Rad External Quality Assurance Service) monthly. Urinary excretions were calculated based on urinary volume and collection time. The collection times and volumes were not available from three subjects at the endpoint of the study (meat group n 2, legume group n 1). Urea excretion was used to calculate nitrogen excretion and then protein excretion using Maroni’s formula(Reference Maroni, Steinman and Mitch27):
Urinary protein = (Urinary nitrogen (g/d) + 0·031 × body weight (kg)) × 6·25.
Nutrient intake analyses
For dietary data collection, participants kept a food record for 3 weekdays and one weekend day prior to the intervention period and during the last week of the intervention. Participants received video instructions for filling in the food records and estimating portion sizes through the BuddyCare mobile application. Written instructions were also provided, and an online portion size estimation booklet was available(Reference Lehtisalo, Lindström and Nieminen28). Food records were reviewed by an educated nutritionist when returned, and any missing information was requested from participants. At baseline, one participant kept the food record for longer (five days) than the instructed 4 days. At the endpoint, 4-day food records were analysed for 95 participants, 3-day records for 3 participants and 2-day record for 1 participant. The food records of one participant (in the legume group) at baseline and three participants (meat group n 1, legume group n 2) at endpoint were not available. Nutrient intakes were analysed with AromiDiet nutrient calculation software (version 14.10.2, CGI Inc., www.cgi.com), which is based on the Finnish food composition database Fineli® (release 19), administrated by the Finnish Institute for Health and Welfare, and the Synkka database (Synkka product information service, GS1 Finland Oy, https://gs1.fi/en/our-services/synkka-product-information-service) that includes nutritional values of certain convenience foods. Daily means of energy, macronutrients, vitamin D, Ca and phosphorus intakes as well as molar calcium-to-phosphorus ratio were calculated at baseline and endpoint of the study.
AA intakes (mg/kg body weight/day) were calculated at the endpoint of the intervention. AA composition database of selected food items consumed in the study was created based on the following criteria: (1) items exceeding a total protein intake of 25 g in the whole study population from the 4-d food records (n 286) or (2) items with protein contents > 20 g of protein per 100 g of product (n 33). An additional forty food items were included since the data were readily available from an unpublished database collected previously. AA compositions were obtained from the Finnish Food Composition Database Fineli® (release 20, not yet publicly available) (n 281), the USDA National Nutrient Database for Standard Reference Legacy (release 2018) (n 17) and the manufacturers (n 7). AA data were not readily available for some food items, such as processed legume-based products, ready-made meals and breads, and therefore, the AA compositions were calculated based on individual ingredients in the estimated recipes (n 54, data sources Fineli® and USDA). AA composition data and dietary data were combined using RStudio version 4·1·0. (R Core Team, Vienna, Austria). The database of 359 food items covered AA intakes equalling 90·5 % of total protein intake among the whole study population, whereas 1090 food items in total were reported in the food records.
Sample size estimation
This study was based on the secondary outcomes of the BeanMan intervention study, the main aim of which was to investigate the effects of replacing RPM with legumes on biomarkers for colorectal cancer, type 2 diabetes and CVD as well as on nutrient intakes and nutritional status. The power calculation was based on data from our previous 12-week intervention study(Reference Päivärinta, Itkonen and Pellinen29,Reference Pellinen, Päivärinta and Isotalo30) . Sample size was determined to show the effects of the intervention on fecal heme-derived N-nitroso compounds and serum transcobalamin II-bound vitamin B12 concentrations. The power calculation showed that n 50 per group would be sufficient to show a statistical difference between intervention groups at the end of the intervention period with a 95 % CI and a statistical power of 0·80. No sample size calculations for bone turnover or mineral metabolism were carried out.
Statistical analyses
Statistical analyses were performed with SPSS Statistics versions 27 and 28 (IBM, New York, NY, USA). Normality of the data was assessed using the Kolmogorov–Smirnov test. Variables were log10-transformed to improve normality, if needed. BAP, TRAP5b, S-25(OH)D, P-PTH, P-iFGF23, urinary excretions and all nutrient data except calcium-to-phosphorus ratio were log10-transformed. Data are presented as means and sds or SEMs. All tests were considered significant at P < 0·05.
Differences in bone turnover and mineral metabolism marker concentrations between the diet groups were analysed by ANCOVA, adjusted for baseline values. In addition, BMI, energy intake, protein intake, PTH and S-Pi were tested as covariates, but this did not change the significance of the results. Differences in nutrient intakes between the groups were analysed by independent samples t test. Within-group changes in biomarkers between baseline and endpoint were tested by paired-samples t test. We performed statistical analyses on biomarkers also without those participants who did not return their food records (baseline n 1, endpoint n 3), and the results remained the same.
AA intakes (mg/kg body weight/d) correlated strongly with energy intake (data not shown), and as the differing energy intakes between the groups confounded the results, the AA intakes were analysed so that energy intake was taken into account as a covariate (ANCOVA). The whole data were used to calculate Spearman correlation coefficients between bone and mineral metabolism markers and energy, Ca, vitamin D, protein and individual AA intakes. In addition, partial correlations were calculated for log10-transformed variables, controlled for energy intake.
Results
Participant characteristics
The background characteristics of the participants are presented in Table 1. All 102 participants completed the study. The participants were on average middle-aged, slightly overweight and physically active at least two times per week with sedentary workload, had normal kidney function(Reference Levey, Stevens and Schmid26) and consumed alcohol moderately(25). Most (71 %) of the participants had an academic degree.
Background characteristics of the healthy men consuming either a diet containing 760 g of red and processed meat per week (25 % of total protein intake) or a diet containing 20 % of total protein from legumes and 200 g of red and processed meat (5 % of total protein intake) per week for six weeks

* Percentages for categorical variables.
† CKD-EPI formula(Reference Levey, Stevens and Schmid26).
‡ One alcohol serving (12 grams of 100 % alcohol), e.g. to 0.33 l medium strong beer, 12 cl wine or 4 cl spirits.
Effects on bone turnover and mineral metabolism
Figure 2 shows the effects of the intervention on biomarkers in blood. No differences in bone formation (BAP) or bone resorption (TRAP5b) markers were observed between the diet groups (P = 0·875–0·950). Bone turnover marker concentrations did not change during the study period (P = 0·209–0·356). PTH, FGF23, 25(OH)D, S-Ca or S-Pi concentrations did not differ between the groups (P = 0·282–0·813). PTH and FGF23 concentrations increased (P ≤ 0·006) and 25(OH)D concentrations decreased significantly in both groups during the intervention (P ≤ 0·043). S-Ca concentrations remained similar throughout the intervention in both groups (P = 0·185–0·330), whereas S-Pi concentrations increased significantly in the meat group (P = 0·022; legume group P = 0·789). See online Supplementary Table 1 for detailed information. At the baseline of the study, 35·3 % of the subjects in the meat group (n 18) and 33·3 % in the legume group (n 17) had insufficient vitamin D status, i.e. 25(OH)D < 50 nmol/l(31), whereas at the endpoint the percentages were 45·1 % (n 23) and 41·2 % (n 21), respectively. Urinary excretions of Ca, phosphorus or creatinine did not differ between the groups (P = 0·086–0·114, data not shown).
Circulating concentrations of (a) serum bone-specific alkaline phosphatase (BAP), (b) serum tartrate-resistant acid phosphatase 5b (TRAP5b), (c) plasma intact parathyroid hormone (iPTH), (d) serum 25-hydroxyvitamin D (25(OH)D), (e) plasma intact fibroblast growth factor 23 (iFGF23), (f) serum phosphorus (S-Pi) and (g) serum Ca (S-Ca) of healthy men consuming diets that differed in the proportions of red meat and legumes for six weeks. P values describing the differences between diet groups at the endpoint are from ANCOVA (adjusted for baseline). *Indicates a within-group difference between baseline and endpoint at P < 0·05 (paired-samples t test). The meat group (n 51) consumed 760 g of boneless and cooked red and processed meat per week, corresponding to 25 % of total protein intake. The legume group (n 51) consumed legume-based products, corresponding to 20 % of total protein intake, and 200 g of red and processed meat per week, corresponding to 5 % of total protein intake. Values are means and standard errors.

Effects on nutrient and amino acid intakes
Based on food records, the realised share of total protein intake from RPM was 26·3 % in the meat group and 4·6 % in the legume group, respectively, the share of non-soya legumes in the legume group being 22·7 %. Table 2 describes energy and nutrient intakes in the diet groups. Energy intake was significantly higher in the legume group (P = 0·022). Protein, carbohydrate or fat (E%) intakes did not differ between the groups (P = 0·230–0·655). Urinary protein excretion was similar in both groups (P = 0·234) (online Supplementary Table 1). Ca (mg/d or mg/MJ) and vitamin D intakes (μg/d or μg/MJ) and molar calcium-to-phosphorus ratios were similar in both groups (P > 0·05). Phosphorus intake as mg/d was higher in the legume group (P = 0·011), whereas no differences were present when presented per MJ (P = 0·301).
Energy and nutrient intakes of the healthy men consuming either a diet containing 760 g of red and processed meat per week (25 % of total protein intake) or a diet containing 20 % of total protein from legumes and 200 g of red and processed meat (5 % of total protein intake) per week for six weeks

P values for nutrient intake were analysed with independent samples t test. Log10-transformed variables were used except for calcium-to-phosphorus ratio. Endpoint dietary data were collected during the last week of the intervention.
* Endpoint dietary data n 50.
† Baseline dietary data n 50, endpoint n 49.
Figure 3 presents AA intakes of participants at the end of the intervention. Of the essential AA, the meat group had higher methionine and histidine intakes (P ≤ 0·042), whereas the legume group had higher phenylalanine intake (P = 0·010). Regarding the non-essential AAs, arginine and asparagine and aspartic acid intakes were higher in the legume group (P ≤ 0·013). Intakes of other AA did not differ between the diet groups (P > 0·05). Mean essential AA requirements were met in both groups(32). In the legume group, there was one subject who did not meet the methionine requirement (due to low energy intake); all other subjects met all the essential AA requirements.
Amino acid intakes (mg/kg body weight (bw)/d) of the healthy men consuming diets that differed in the proportions of red meat and legumes for 6 weeks. The data were collected during the last week of the intervention. *Indicates a difference between the groups (P < 0·05, ANCOVA, adjusted for energy intake). Horizontal lines indicate essential amino acid requirement(32). The meat group (n 50) consumed 760 g of boneless and cooked red and processed meat per week, corresponding to 25 % of total protein intake. The legume group (n 49) consumed legume-based products, corresponding to 20 % of total protein intake, and 200 g of red and processed meat per week and corresponding to 5 % of total protein intake. Values are means and standard deviations. Asn/Asp, asparagine/aspartic acid; Gln/Glu, glutamine/glutamic acid.

Correlations between amino acid intakes and bone turnover and mineral metabolism
Online Supplementary Tables 2 and 3 show Spearman and partial correlations (controlled for energy intake) between bone turnover markers and PTH and the intakes of protein, Ca, vitamin D and AA for the whole study population. Correlations between AA and 25(OH)D, FGF23, S-Pi and S-Ca were not significant (data not shown). BAP, TRAP5b or PTH did not correlate with protein, Ca or vitamin D intake (P > 0·05). Adjustment for energy intake did not change the significance of the results. TRAP5b correlated positively with arginine, glutamine and glutamic acid and phenylalanine (r = 0·215–0·219, P = 0·030–0·032), but controlling for energy intake removed the significance. PTH and certain AA (cysteine, glutamine and glutamic acid, leucine, phenylalanine, proline and valine) correlated negatively (r = –0·199–0·260, P = 0·009–0·048). When controlling for energy intake, the correlations between PTH and cysteine, glutamine and glutamic acid and proline remained significant (r = –0·199–0·249, P = 0·015–0·049).
Discussion
In this 6-week randomised clinical intervention study, we examined the effects of partial replacement of RPM with non-soya legumes on bone turnover and mineral metabolism in healthy Finnish working-aged men. Furthermore, we addressed whether changes in AA intakes by the diets contributed to bone turnover. We did not find any differences in bone formation or resorption when 20 % of total protein intake originated from legumes instead of RPM and when the amount of RPM was at the upper limit of the Planetary Health Diet (200 g/week)(Reference Willett, Rockström and Loken5). However, in both intervention groups consuming either legumes or RPM to a great extent, 25(OH)D decreased and PTH increased. Intakes of methionine and histidine were higher in the meat group, whereas intakes of phenylalanine, asparagine, and arginine were higher in the legume group. The mean essential AA intakes, however, met the requirements in both groups(32). While AA intakes did not correlate with bone turnover markers, some negative correlations were observed between PTH and individual AAs.
Whether the source of protein matters with respect to bone health has been debated(Reference Weaver17,Reference Shams-White and Chung18) . In this study, total protein intake was not compromised, as both intervention groups, on average, met the protein recommendations (10–20 E%(31)), and no differences in protein intake or excretion between the groups at endpoint emerged. This was not a surprise since the dietary change was moderate; the intervention accounted for only 25 % of total protein intake and the remaining 75 % was not controlled and the amount of protein provided was equal in the groups. A recent meta-analysis of seven RCT with 633 healthy peri- or post-menopausal women did not find any differences between animal and soya protein with respect to bone mineral density or bone turnover markers(Reference Shams-White and Chung18). Also, systematic reviews and meta-analyses regarding protein sources and fracture risk found no differences between animal and plant protein sources(Reference Rizzoli, Biver and Bonjour33,Reference Darling, Manders and Sahni34) . Results of the meta-analyses and systematic reviews cannot be generalised to other plant proteins since the main plant protein studied was soya. Soya includes all essential AA required for human needs in adequate amounts, whereas other plant protein sources do not(Reference Gorissen, Crombag and Senden35). Regarding bone turnover markers, our results are in line with a previous 4-day cross-over trial in healthy American women comparing meat and soya protein in which bone turnover was unaffected, but serum PTH concentrations were higher during the soya protein diet than during the meat protein diet(Reference Kerstetter, Wall and O’Brien36). Interestingly, a cross-over study comparing high- and low-meat diets for 8 weeks did not find any effects on biomarkers of bone metabolism in healthy American postmenopausal women(Reference Roughead, Johnson and Lykken37). While our results are consistent with the previous systematic reviews and meta-analyses, as no differences were observed in bone turnover when RPM was partially replaced with legumes, in our earlier study, we observed harmful changes in bone turnover after 12 weeks when dietary animal protein was partially replaced with plant protein(Reference Itkonen, Päivärinta and Pellinen19). However, the role of protein and AA remained unclear, but the change in dietary protein composition was much larger than in our current study, from 70 % of animal protein (TPI) to 70 % of plant protein (TPI). In addition, in this previous study, the proportion of male participants was only 20 %; thus, potential sex differences in the effects of protein sources on bone warrant further investigation.
Dietary protein can directly affect bone metabolism via the actions of individual AA, which are most likely to play a particularly significant role in bone metabolism. Mechanistic in vitro studies suggest that several AA, such as arginine, lysine, tryptophan, phenylalanine and tyrosine, have specific mechanisms in bone metabolism(Reference Bihuniak and Insogna15). In our study, the meat group had higher intakes of the essential AA methionine and histidine, whereas the legume group had higher intakes of the essential AA phenylalanine and the non-essential AA arginine, asparagine and aspartic acid. Although mechanisms explaining how these individual AA may affect bone metabolism have been established(Reference Bihuniak and Insogna15), the differences in the intakes of these AA in the present study did not translate into differences in bone turnover markers. This can be due to various reasons; differences between the groups may not have been clinically significant, and the amounts of AA in these diets were moderate. In addition, the mean AA intakes were adequate according to the requirements(32), and intakes exceeding the requirements in moderate amounts may not provide a further advantage regarding bone health. Furthermore, the bone turnover markers BAP and TRAP5b did not correlate with protein and AA intakes, indicating no direct association between intakes of protein and AA and bone formation or resorption. Interestingly, PTH concentrations correlated negatively with cysteine, glutamine, glutamic acid and proline. Overall, however, the correlations were not strong (maximum significant values r = –0·25). To confirm our results regarding the correlations, a larger dataset is required.
Plant-based diets may lead to lower intakes of vitamin D and Ca(Reference Neufingerl and Eilander7,Reference Tucker8) , which can compromise bone health. The diets in the present study should not have influenced Ca or vitamin D intakes, as the diets were only controlled for RPM and legume intakes, which are not elemental sources of these nutrients; we observed no differences in Ca and vitamin D intakes or in the calcium-to-phosphorus ratio between the groups. In our previous study(Reference Itkonen, Päivärinta and Pellinen19), the accelerated bone turnover after 12 weeks on a diet where 70 % of total protein intake originated from plant-based sources compared with a diet where 70 % of total protein intake was of animal origin was most likely due to lower intakes of Ca and vitamin D as well as a lower dietary calcium-to-phosphorus ratio, which has also been shown to be harmful for bone(Reference Kemi, Kärkkäinen and Rita38,Reference Calvo, Moshfegh and Tucker39) . In that study, the amount of (fortified) dairy products, the source of vitamin D and Ca, was restricted(Reference Itkonen, Päivärinta and Pellinen19). This was not the case in the current study, where the mean intakes of vitamin D were almost in accordance with the recommendation (10 μg/d), and the recommended Ca intake (800 mg/d) was met in both groups(31).
Concentrations of bone formation (BAP) and bone resorption (TRAP5b) markers remained similar throughout the study, although 25(OH)D concentrations decreased significantly and PTH concentrations increased significantly in both groups. Presumably, some of the participants used vitamin D supplements prior to the intervention, and the decrease in 25(OH)D concentrations might be explained by the fact that during the intervention participants were not allowed to use any vitamin D or multivitamin supplements. Also, decreasing sunlight during the intervention (September–December, 60°N) most likely contributed to the decline in vitamin D status in both groups. Despite the decrease in 25(OH)D concentrations, mean concentrations were adequate (target > 50 nmol/l(31)); however, 45 % of the subjects in the meat group and 41 % in the legume group had inadequate vitamin D status at the study endpoint, the proportions being higher than at baseline (35 % and 33 %, respectively). An increase in PTH concentrations can be explained by the decrease in 25(OH)D concentrations causing a subsequent decrease in the active form of vitamin D, 1,25-dihydroxyvitamin D, which is an important regulator of PTH synthesis(Reference Bergwitz and Jüppner40). S-Ca and S-Pi concentrations are the main regulators of PTH(Reference Bergwitz and Jüppner40), and thus, the increase in S-Pi concentrations in the meat group could contribute to the rise of PTH. Nonetheless, this probably is not the only factor since PTH increased also within the legume group, whereas S-Pi concentrations remained similar. In addition, FGF23 concentrations increased in both groups, which may be related to the changes in 25(OH)D and PTH(Reference Bergwitz and Jüppner40).
The main strength of this study is that participants followed the intervention diets well based on the realised protein intakes. Furthermore, a zero dropout rate indicates that the diets were easy to implement and did not cause significant intestinal discomfort for the participants, which may be a challenge with legumes(Reference Winham and Hutchins41). Most of the participants had an academic degree, possibly making them more health conscious and compliant, decreasing the generalisability of the results. As only a minor part of the diet was controlled, the rest of the habitual diet may have compensated the limiting AA of plant protein sources. However, generally, AA intakes are rarely studied due to lack of AA composition data in national food composition databases(Reference Iguacel, Perez-Cornago and Schmidt42); thus, our approach is quite unique. Nevertheless, there are some limitations related to the assessment of AA intakes. Although the food items consumed in our study were carefully matched with appropriate foods when using the USDA database, the AA content of the selected foods may differ somewhat between the USA and Finland. Also, pea protein powder was a basic ingredient in many of the legume products given in the intervention; therefore, its AA content has a large effect on the total AA intake of the legume group. The duration of the study was 6 weeks, which may not be the most optimal to observe changes in bone turnover; however, we did not observe any differences in Ca or vitamin D intakes between the groups. Based on our previous study(Reference Itkonen, Päivärinta and Pellinen19), these nutrients were the main contributors to the changes in bone turnover. In addition, regarding the correlation analyses, the study might be underpowered. A longer washout period may have been needed to fully exclude the effect of the use of vitamin D supplements, and a more optimal time point for measuring bone turnover would have been winter with limited sunlight. A longer term study is required to assess whether these dietary changes are feasible to follow in the long run.
To conclude, partial replacement of RPM with non-soya legumes for six weeks did not negatively affect bone turnover or mineral metabolism markers in healthy working-aged Finnish men. When 20 % of the total protein intake originated from legumes instead of RPM, essential AA requirements were met on average and the intakes of Ca and vitamin D were unaffected. Intakes of some AA differed between the diet groups, but it seems that differing AA intakes did not contribute to bone turnover. Our results suggest that increasing the proportion of non-soya legumes and decreasing the proportion of RPM to the upper limit of the Planetary Health Diet are relatively easy to implement and safe from the perspective of bone health and average AA adequacy.
Acknowledgements
The volunteers of the BeanMan intervention study are warmly thanked for their contributions. We thank the food companies Apetit Plc, Atria Plc, HKScan Plc, Jalofoods/Oy Soya Ltd. and Verso Food Ltd. for providing foods for the intervention.
The Leg4Life (Legumes for Sustainable Food System and Healthy Life) project was supported by the Strategic Research Council at the Academy of Finland (A-M. P., Grant numbers 327 698, 352 481; S. M. grant number 352 483), the Juho Vainio Foundation (S. T. I.) and the Finnish Cultural Foundation (S. T. I.). The funders had no role in the design, analysis or writing of this article.
Author contributions were as follows: S. T. I., E. P. and A-M. P. designed the research; S. T. I., P. K., T. P., E. P., M. L. and A-M. P. conducted the research; S. T. I. and P. K. analysed the data and performed the statistical analysis; S. T. I. and P. K. drafted the manuscript; S. T. I., P. K., T. P., E. P., M. L., N. E. K., S. M. and A-M. P. worked on the manuscript and S. T. I. had the primary responsibility for final content. All authors read and approved the final manuscript.
None of the authors have any conflicts of interest. The funders had no role in the design, analysis or writing of this article.
The study was conducted according to the guidelines laid down in the Declaration of Helsinki, and written informed consent was obtained from all subjects. All procedures were approved by the Ethics Committee of the Helsinki and Uusimaa Hospital District (1789/2020). The study was registered at clinicaltrials.gov (NCT04599920).
Supplementary material
For supplementary material/s referred to in this article, please visit https://doi.org/10.1017/S0007114523001514


