

Language policies are associated with a great deal of debate, policy action, and conflict. The use of uniform languages can lower the cost of communication, facilitate education, and expand economic growth. This lesson is quickly learned by new immigrants whose academic and economic success depends critically on mastering the lingua franca of their new home. At the same time, attempts to impose official languages can meet considerable resistance, both because language is an important component of identity, and because learning a new language is difficult.Footnote 1 This article examines the consequences of language mismatch in education, that is, when students are taught in a language, usually an official state language, that differs from the mother tongue. Specifically, I ask if language mismatch benefits or hinders long-term educational achievement. Second, if language mismatch hinders long-term educational achievement, does fixing this mismatch by changing the medium of instruction to align with students’ mother tongue lead to catch-up in educational achievement?
If the language used in schools is the same as the learner's mother tongue, then educational achievement is greater as residents are more likely to enrol, understand instruction, and complete different levels of schooling. For instance, Hoyt Bleakley and Aimee Chin (Reference Bleakley and Aimee2004) find that childhood immigrants to the United States from English-speaking countries report significantly greater educational achievement compared to those from non-English backgrounds. Language fluency might also be key for unlocking future economic opportunities. For example, the returns to post-secondary education declined by half when Morocco switched from French to Arabic as the medium of instruction in schools, primarily because most organized economic activity was conducted in French (Angrist and Lavy Reference Angrist and Victor1997).Footnote 2 David Clingingsmith (Reference Clingingsmith2014) argues that economic growth in sectors where communication is relatively important increases the incentive to learn new languages. Consequently, growth of the manufacturing sector increased bilingualism in mid-century India, especially among minority language speakers.
Language mismatch might also influence education through the provision of public schools, although the direction of this effect is not clear. If speakers of the majority language control public spending, they might construct more schools in the areas where the language is spoken because of political patronage or shared preferences, leading to higher educational achievement. Conversely, school construction and spending on educational infrastructure might be directed at economically weaker regions. If minority language regions are also economically weaker, then these areas would experience greater improvements in education achievement.Footnote 3 Finally, language mismatch might be associated with greater migration if individuals who do not speak the official language of a region relocate to a different region seeking education or economic opportunities in their own language.
The main contribution of this article is to examine the effect of language mismatch on educational achievement using large-scale historical events in India. Primary schooling in India is largely in the official language of a state or province, both in the colonial period (before 1947) as well as in the modern era. Colonial-era provinces, especially in South India, were formed without regard to language, which resulted in some areas where schools taught in the same language as the mother tongue of the majority of students, and other areas where they did not. If the cost of completing formal education is lower when instructed in one's mother tongue, then I expect long-term educational attainment to be lower in districts that have a different majority language from the official language. This illustrates the degree to which variation in language explains persistent underachievement in education within countries.
In the immediate post-Independence era, the 1956 reorganization of South Indian states on strict linguistic lines aligned the majority language of districts with the official language of states, so that almost all children were taught in their mother tongue. As a result, a convergence in education levels between the previously aligned and misaligned districts helps us to understand whether “fixing” language policies through political reorganization can address persistent educational shortfalls.
India is a particularly appropriate setting for studying the impact of language since more than 1,600 languages are used in the country, with 22 languages claiming both wide speakership as well as constitutional recognition (Registrar General Reference General2001). The boundaries of modern Indian states correspond to the areas where these languages are used. Public schools offer instruction using the medium of the state language, and regulators, the judiciary and other arms of state governments use the state language for official correspondence with citizens. Thus, the setting permits comparison between multiple sets of major vernacular languages, each with tens of millions of speakers. As a result, the article circumvents the comparison of a colonial language, especially English, with a vernacular language which is troublesome both because then the returns from globalization cannot be isolated from pure language effects, and because populations who speak these languages are often systematically different.Footnote 4
There are two major empirical challenges in generating reliable estimates of the relationship between language mismatch and education. The primary challenge is that bivariate comparisons between communities that either speak or do not speak the official language might not yield unbiased estimates of the relationship between language mismatch and education because of, at least, two potential sources of endogeneity. First, individuals who do not speak the official language may move to ethnic enclaves where they do not need to learn a new language. Second, communities that recognize the link between speaking a different language and poorer economic outcomes may form their own political units. For example, linguistic minorities in countries such as Spain, Canada, and Cameroon launched separatist movements based on language. Thus, unbiased estimates require exogenous matching between languages and communities.
The pattern of British conquest and province formation in the eighteenth century helps generate such estimates. Provincial boundaries in British India were determined either by the sequence of British military conquest, with provinces cobbled together from various districts as imperial rule extended from the coasts into the hinterland, or when the British decided to leave native rulers in place. I argue that this process was largely exogenous to linguistic concerns, leading to the inclusion of some districts in provinces where the district's numerically dominant mother tongue language was the same as the official language of the province (henceforth, a “majority” district), and other districts in provinces where it was not (a “minority” district). If mother tongue instruction facilitates schooling, then historically majority districts should have had better educational outcomes compared to historically minority districts. Insofar that educational achievement persists over generations, minority districts could experience poorer educational outcomes even up to modern times, indicating the persistent effects of language mismatch.Footnote 5
In 1955, the States Reorganization Commission recommended forming new states strictly on linguistic lines, a principle which the central government followed while redrawing state boundaries in 1956, 1960, 1966, and 1971 (Govt. of India 1955). After reorganization, new state boundaries consisted of those districts where the major language was the same as the official language of the state. A policy change in all the new states was extending the official language as the medium of instruction in schools and for all state business. Thus, a natural experiment is set up where each district was classified as either majority or minority before the reorganization by historical accident, and reassigned as majority after the reorganization. I expect that growth rates for each of the measures for educational achievement should be higher in historically minority districts after reorganization, as these districts “catch-up” after integrating into co-linguistic states.
The second major empirical challenge is separating the impact of language mismatch from other characteristics of ethnicity and culture that are correlated with language.Footnote 6 Figure 1 shows that minority districts are largely North and West of matched districts, which might suggest other systematic economic, geopolitical, and cultural differences between these types of districts. I account for these differences using three strategies. I examine the historical record, which suggests that the British themselves were uncertain about the social and cultural characteristics of the regions they were conquering. There is no evidence that East India Company officials in the late eighteenth century anticipated mass education efforts that commenced nearly 50 years later. In addition, I try to account for the most obvious sources of differences between minority and majority districts, controlling for a number of geographical and social characteristics, as well as state fixed effects in the regressions. The model explains a large part of the variation in the outcome variables, which assuages concerns associated with potentially omitted variables. Finally, the empirical strategy relies on multiple, logically orthogonal tests that provide consistent evidence that mismatched language is the basis of worse educational outcomes.
MINORITY AND MAJORITY DISTRICTS

Using a district level panel dataset based on the Census of India, I find that shared language potentially lowers communication costs and increases educational achievement rates, and that language mismatch for minority districts is associated with lower rates of educational achievement. The impact is greater on primary and secondary schooling, which is conducted in the vernacular. Specifically, the literacy rate in minority districts is estimated to be 18.0 percent lower than majority districts, and the middle school completion rate 25.2 percent lower. In contrast, although the fraction of college graduates in minority districts is 20.1 percent smaller, this coefficient is not robust across specifications. This finding is not surprising since the medium of instruction in most universities is English. While the precise channel that explains these findings is difficult to pinpoint, the analysis suggests that lower costs of comprehension when instruction is in the same language as the mother tongue is the main factor responsible for the results.
The reorganization of states in 1956 on linguistic lines reversed the impact of historical shortcomings in educational achievement. Minority districts experienced greater growth in educational achievement after reorganization as they caught up with majority districts. The basic test comparing minority and majority districts finds 46.8 percent higher matriculation growth rates in previously minority districts. However, minority districts achieved parity with the majority districts only by 1991, or about two generations later. So while realigning mother tongue with the medium of instruction can alleviate educational shortfalls, this process is long and points to the persistent effects of institutional arrangements.
HISTORICAL BACKGROUND
British Conquest of India
Commencing in 1757, when the East India Company gained control over the province of Bengal, British colonial rule in India lasted 190 years. From 1757 to 1857, the East India Company extended its control over the rest of India. The Company's administration ended with the mutiny of 1857, after which India was directly ruled as part of the British Empire. In South India, the Company had obtained feudal control over the Coromandel coast from the Nawab of Carnatic in 1640. The geographically contiguous areas around the trading post of Fort St. George (later called Madras and now Chennai) formed the Madras Presidency. In Western India, seven islands acquired from Portugal as part of a royal dowry in 1661 became the city of Bombay (now Mumbai). This and subsequent territorial acquisitions in Western India, notably the Maratha territories obtained in 1817–1818, were integrated to form the Bombay Presidency.
In addition to direct rule by the British government, a number of regions were indirectly ruled through the agency of native kings and princes. The major princely states in peninsular India were Hyderabad, Mysore, and Travancore. Lakshmi Iyer (Reference Iyer2010) shows that the British were selective about the regions annexed for direct rule.Footnote 7 Therefore, a key concern for the empirical analysis in subsequent sections is whether selection of regions administered directly was correlated with linguistic characteristics of those areas.
The main events that shaped the boundaries of colonial South India were the Anglo-Mysore Wars (1767 to 1799) between Tipu Sultan of Mysore and the British allied with the Marathas and the Nizam of Hyderabad. Mandar Oak and Anand Swamy (Reference Oak and Anand2012) describe the process of alliance formation and the pre-war commitments between the British, the Marathas and the Nizam on territorial division, arguing that the commitments were credible and not subject to post-war negotiations. After Tipu's defeat in the Third Anglo-Mysore war (1792), the Marathas regained Dharwad, the Gulbarga region was returned to the Nizam, and the British added Malabar, Salem, Bellary, and Anantapur to the Madras Presidency (see Figure 2).Footnote 8 Neither language nor social factors had a major role to play in determining colonial boundaries. Indeed, the report of Constitutional Reform Commission chaired by Secretary of State for India, Edwin Montagu, and the Viceroy of India, Lord Chelmsford, describing the process of both conquest and organization of the administrative structure of colonial India (Montagu and Chelmsford Reference Montagu and Frederic1918, p. 28) stated that “[T]he present map of British India was shaped by the military, political or administrative exigencies or conveniences of the moment, and with small regard to the natural affinities or wishes of the people.”
LOCATION MAP OF SOUTH INDIA

This sentiment was echoed 12 years later by the Simon Commission (Simon Reference Simon1930, p. 54) established to review the constitutional structure of British India, “there were in India only a number of administrative areas [which had] grown up almost haphazard as the result of conquest, supersession of former rulers or administrative convenience.” The commission recommended reorganization of states to enable more coherent administration.
Despite the Simon Commission's recommendations, the colonial government undertook no systematic reorganization of administrative units before the end of British rule in India in 1947. The provincial boundaries of independent India in 1947 reflected geographical continuity in the pattern of British military conquest in the eighteenth and nineteenth centuries, with little consideration towards the cultural or social characteristics that united or divided the provinces.
Education Provision in Colonial India
Education in India before 1757 followed indigenous systems without standardization or significant state patronage and was restricted to the social and economic elites (Acharya Reference Acharya1978). As East India Company officials focused on administration of conquered territories in the eighteenth century, they introduced formal education both to train potential employees for clerical positions as well as to create acceptance of Western traditions and colonial rule (Evans Reference Evans2002). A rich debate emerged on the language of instruction in government-aided schools between the Orientalists, who favored instruction in English, and the Vernaculars, who advocated instruction in local languages. Inspired by Thomas Babington Macaulay's (Reference Macaulay and Sharp1835) famous Minute on Indian Education, Governor-General Lord William Bentinck decided to use English as the medium of instruction in mass education. However, instruction exclusively in English proved expensive with very few English language teachers or materials. Consequently, in 1854 Lord Dalhousie accepted Wood's recommendations (outlined in his Despatch, which Radhakrishnan (Reference Radhakrishnan1948) called the “Magna Carta of English Education in India”) to adopt vernacular languages for instruction in primary and secondary schools and use English for higher education (Windhausen Reference Windhausen1964; Evans Reference Evans2002).Footnote 9
The British government established universities in Calcutta, Bombay, and Madras starting from 1857 (Radhakrishnan Reference Radhakrishnan1948) and the medium of instruction was English (Annamalai Reference Annamalai, Tsui and Tollefson2004). Growing demand for higher and professional education led to the establishment of the University of Allahabad in 1887, as well as 21 other universities in the twentieth century. With the exception of Osmania University in Hyderabad where undergraduate classes were taught in Urdu, the medium of instruction remained English (Radhakrishnan Reference Radhakrishnan1948).
Teacher Training
Prior to 1854, formal teacher training was sparse.Footnote 10 Systematic teacher training was initiated in the vernacular in Bengal, Madras, and the Northwest provinces only after the Despatch of 1854 (Nurullah and Naik Reference Nurullah and Jayant1951). In Bombay, no separate teacher training institutes were established, instead, teacher training was conducted in the regular colleges of the Presidency for both Anglo-vernacular and vernacular schools. By 1881–1882, 9,314 teachers were employed in the Bombay Presidency, and 553 undergoing training. In Bombay, candidates already possessed general education, and were willing to undergo training for three years for better prospects. However, in Madras, candidates lacked education and were often unwilling to undergo long and rigorous training. Nonetheless, by 1881–1882, 500 teachers were trained annually at 32 training schools in Madras.
Following the report of the Indian Education Commission in 1882 (Hunter Reference Hunter1883), the Provincial governments accepted primary responsibility for teacher training. Consequently, teacher training facilities expanded considerably, with 926 training institutions for men (with enrollment of 22,774) and 146 for women operating in British India by 1921. Of these, only five were private, unaided institutions, indicating the extent of government control of teacher training.
After Independence in 1947, the school system expanded considerably, and teacher quality dropped concurrently with greater numbers. The report of the 2nd All India Educational Survey reports that 34.2 percent teachers had not completed matriculation, yet were employed in primary, middle, and secondary schools (NCERT Reference Munshi1967). Of the remaining, 38.4 percent passed matriculation while 15.9 percent had graduate or post-graduate qualifications. A significant fraction had “other” qualifications in music, craft, or physical education.
Reorganization of Indian States
Although the Indian National Congress, the main nationalist party, endorsed the principle of the linguistic provinces, India's Independence accompanied by Partition on religious lines dampened enthusiasm for further division on an ethnic or cultural basis (Guha Reference Guha2008). The death of an activist demanding a separate state for Telugu speakers, however, led to the formation of Andhra Pradesh from the Telugu speaking districts of Hyderabad and Madras state along with the formation of the States Reorganization Commission (Govt. of India 1955). This commission recommended redrawing state boundaries entirely on linguistic principles, explicitly recognizing the role of shared language in reducing transaction costs stating that “Indian states, if linguistically constituted, will be able to achieve internal cohesiveness because language is a vehicle for communion of thoughts” (p. 35), especially through vernacular education in schools, leading to increasing administrative links within the state because “linguistic homogeneity as an important factor conducive to administrative convenience and efficiency” (p. 46). The modern states of Andhra Pradesh, Karnataka, Kerala, and Tamil Nadu were formed in 1956, Maharashtra and Gujarat in 1960, and Haryana, Himachal Pradesh, and Nagaland in 1965 and 1970, and taught in the vernacular at the school level.
Using language data from the 1951 census, Table 1 shows that the commission followed the linguistic majority rule for every district. Telugu was the most common mother tongue in all districts assigned to Andhra Pradesh, Kannada in each district assigned to Karnataka, Malayalam in every district to Kerala and Tamil in districts to Tamil Nadu. This rules out both the possibility of bargaining or unobserved district characteristics influencing the reorganization exercise. The Online Appendix contains details on changes to medium of instruction in government-operated schools after states’ reorganization.
DATA DESCRIPTION
The primary source of data is the decadal Census of India conducted by the Ministry of Home Affairs of the Government of India. I use the 1951, 1961, 1971, 1981, and 1991 waves of the Census. Data at the district level from the last four waves has been compiled into a panel by Reeve Vanneman and Douglas Barnes (Reference Vanneman and Douglas2000) and contains data on population characteristics such as literacy, educational achievement, and source of livelihood. Each variable is reported separately for all persons, men, rural residents, and rural male residents in the district. In addition, the 1981 and 1991 Census contain data on the number of schools and colleges at the district level.
The Vanneman and Barnes (Reference Vanneman and Douglas2000) dataset is augmented with data on mother tongue, education, religion, and caste composition from the 1951 Census of India. This allows me to measure the baseline rates of educational achievement before 1956, and estimate the difference in outcomes as a result of the language change. The sources of the data are the economic tables and the district census handbooks. While the economic tables report population size variables for all 321 districts in 1951, the district census handbooks report a more detailed set of variables, including educational achievement measures, for 140 districts.Footnote 11
VERIFICATION OF LANGUAGE-BASED REORGANIZATION

Notes: This table verifies that the allocation of districts to states in the 1956 reorganization was strictly on linguistic lines. “N.A.” indicates data not available.
Source: Census of India 1951.
The 1951 and 1961 Census asked respondents about their mother-tongue, described in the census forms as the language “first spoken by the individual from the cradle.” In addition, Census forms in all waves defined literacy as the “ability to read and write in any language.” Since this definition is not specific to literacy in either the mother-tongue or the state's official language, mechanical differences in literacy levels as a result of redefining literacy when a district is reassigned from one state to another are ruled out.
I include a number of district-level geographic controls that might impact educational attainment since India is primarily an agricultural economy. The Indian Meteorological Department (IMD) provides monthly rainfall readings at the subdivision level.Footnote 12 I calculate the mean and variance of the aggregate rainfall in the months of January and July for each census decade and include these four measures in the dataset. Also added are district level indicators for various soil types, especially the fraction of land which is either wasteland or under forests (Department of Land Resources Reference Debnath2011), along with the latitude, longitude, and elevation of the district headquarters.
The study is restricted to districts situated in the modern states of South India for four reasons. First, the initial wave of reorganization in 1956 only took place in South India. In subsequent waves, states bargained over districts and therefore the natural experiment is not as clean.Footnote 13 Second, documented changes in district boundaries between 1971 and 2001 were by and large in North India, whereas district boundaries in South India have remained relatively stable over time (Kumar and Somanathan Reference Kumar and Rohini2009). Third, South India contained only three large princely states (Travancore, Hyderabad, and Mysore) where education policies are well documented in contrast to North India. Finally, the modern states of Andhra Pradesh, Karnataka, Kerala, and Tamil Nadu exhibit significant diversity in major languages (unlike North India where Hindi is widespread), allowing for cleaner identification of the effects of language on economic outcomes.
The language used by the majority of residents within a district identifies it as either a “majority” or a “minority” district (see Table 2). In a majority district, the district's majority language is the same as the province's official language (also used as the medium of instruction in schools) in the colonial era. In a minority district, the majority language of the district is different from the official medium of school instruction. After reorganization, minority districts were assigned to a state formed on the basis of its language, which was then uniformly used as the medium of instruction in schools within the state. Figure 1 shows how each modern district is classified.
The dataset yields 335 district-year observations (67 districts each observed decadally five times from 1951 to 1991), with only few missing observations for various dependent variables. Table 3 summarizes some of the variables of interest. Among time-invariant characteristics, 22 out of 67 districts are minority districts, 40 percent have some coastal boundary and nearly 63 percent of the districts were directly ruled by the British. The table also reports the mean altitude (1116.3 feet), latitude (13.6°N), and longitude (77.5°E) of districts’ headquarters. Time varying characteristics reported in Table 3 include the fraction of Scheduled Castes (14.3 percent) and Scheduled Tribes (3.0 percent) in the population, the cumulative literacy rate over time (37.0 percent) and the literacy rate by various cohorts.Footnote 14 Younger cohorts report higher literacy levels which is consistent with the expansion of basic education over time.Footnote 15 Completion rates decline for higher education levels, with 25.8 percent of the population completing primary school, 6 percent matriculating high school, and only 1.2 percent graduating from college. On average, 13.2 percent of a district's land is wasteland and 5.6 percent under forest cover.
EMPIRICAL ANALYSIS
The objective here is to estimate the impact of education in the mother tongue (or not) on educational outcomes. The classification of a district as a historically minority language or majority language district depends on the exogenous province formation by the British.Footnote 16 The subsequent assignment of districts to states in 1956 is on strict linguistic lines. Therefore, the difference in outcomes between minority and majority districts, as well as the difference in growth rates after reorganization is used to establish the impact of language mismatch on educational outcomes.
DISTRICT ALLOCATION

Notes: This table shows the allocation of each 1951 district before and after 1956 and the classification as a minority or majority district.
Source: Census of India, 1951–1991 and various Acts of Parliament specifying district assignment in states’ reorganization.
SUMMARY STATISTICS

Notes: This table shows the summary statistics of the final dataset. Each observation is a district-year, and the sample is pooled over the 1951, 1961, 1971, 1981, and 1991 census waves.
Sources: Census of India 1951–1991, Indian Meteorological Department and Ministry of Rural Development (Government of India).
If the mother tongue of a district is the same as the medium of instruction used in schools, then more students are likely to enrol in school and achieve basic literacy. I also expect greater rates of completion for subsequent levels of schooling (primary school, middle school, high school, and college) both, because the supply of students from earlier stages increases, and because the demand for schooling increases when students understand instruction better. Later, I estimate a first differences model of the impact of minority status on educational outcomes.
Jess Benhabib and Mark M. Spiegel (Reference Benhabib and Mark2005) develop a model where countries above a threshold level of human capital “catch-up” with technologically advanced countries once they are able to access technology as well. If language is a “social technology,” then districts should experience catch-up growth in educational achievement after reassignment corrects the language mismatch. I test for whether minority districts experience greater growth in educational achievement rates by estimating a difference-in-difference of the impact of minority versus majority districts on educational outcomes before and after reorganization.
Do Minority Districts Have Persistently Poorer Outcomes?
First, I examine whether districts with historical minority language status have persistently poorer educational outcomes. In addition to testing for differences between minority and majority districts, I conduct three robustness checks. The first robustness exercise estimates a first differences model restricting the sample to the set of minority and majority districts that border each other. The second check uses the exogenously determined linguistic distance between the district's majority language and the language used as the medium of instruction in schools. I expect that increasing linguistic distance within minority districts will lead to relatively poorer economic outcomes. Third, I expect that outcomes will be relatively worse in districts where the fraction of minority language speakers is large compared to districts where the number of speakers of each language is more evenly matched.
Test Using Minority Status
Since data on district-level economic and social characteristics before province formation is not available, the key identifying assumption is that the initial assignment of districts as minority or majority districts is uncorrelated with outcomes, as discussed earlier. The estimation equation is
where yit represents log of outcomes. I expect systematic differences between minority and majority districts. minorityi is an indicator variable that is 1 if district i is a minority district, and 0 otherwise. Thus, the main coefficient of interest is β1 , which represents the marginal impact of being a linguistically mismatched district before the reorganization of states. The specification does not include district fixed effects because minorityi is constant over time. Hence, I introduce Z i, which is a vector of time-invariant district characteristics such as a coastal dummy and the altitude of the district headquarters, all of which can potentially impact yit . Figure 1 shows that minority districts are geographically clustered in the North and West. To capture this aspect of geography, I include the longitude and latitude of the district headquarters. Also included in Z i is a dummy variable that indicates whether a district was under direct British rule or ruled indirectly through the agency of a princely state.Footnote 17 This dummy accounts for factors that are unobserved in the data, such as politics, that might have caused educational provision to be different across minority and majority districts.Footnote 18
equation (1) includes a vector of observed time-varying district characteristics X it that consists of the average and standard deviation in January and July rainfall over the decade, the fraction of terrain that is forested or wasteland, logs of the total and rural population of the district in the previous decade, and the fraction of residents who are from historically disadvantaged Scheduled Caste and Scheduled Tribe backgrounds.Footnote 19 Political factors that influence available resources for education are controlled by the fraction of time in the decade that the state government's party was the same as the central government party. Decade fixed effects (decadet ) account for observed and unobserved decade characteristics that affect outcomes for all districts. State fixed effects (statei ) control for state characteristics such as attitudes and cultural influences that are constant over time. State-time trends (δit ) control for linear time trends in the educational achievement for each state. Finally, unobserved characteristics are clustered by district.
I expect that majority language districts will have higher rates of literacy, middle school completion, and matriculation rates, that is, β1 < 0 for these outcomes. While the qualitative impact on graduation rates predicted by the theory are the same, the coefficients for these outcomes might be less robust since English is commonly used as the medium of instruction in higher education, mitigating the impact of historical differences in language use.
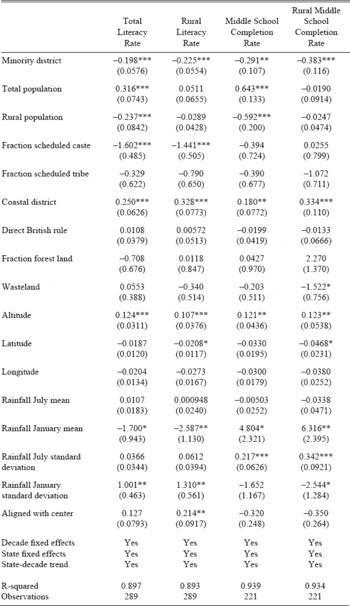
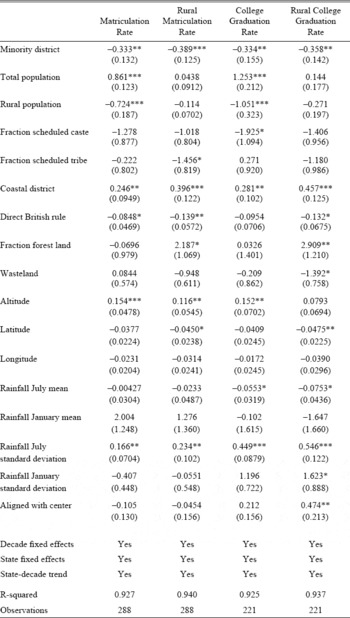
Table 4a presents results from estimating equation (1) with total literacy rate, rural literacy rate, middle school completion rate, and rural middle school completion rate as outcome variables. Table 4b continues using the same specification to present estimates when matriculation rates, rural matriculation rates, college graduation rates, and rural graduation rates are the outcome variables. In Table 4a, the coefficients for literacy rates are negative (−0.198 for total literacy and −0.225 for literacy in rural areas, p<0.01). Since the dependent variable is log transformed, taking the exponential of these coefficients implies that the total and rural literacy rates in minority districts are 18.0 percent and 20.1 percent lower than the corresponding rates in majority districts. Similarly, the differences in middle school completion and matriculation rates are, after exponential transformation of the coefficients, even larger (25.2 percent and 28.3 percent lower in minority districts than majority districts). In college graduation rates, the fraction of graduates in minority districts is 28.3 percent smaller than majority districts. The increasing gap as the level of education increases is potentially due to sequentially lower supply of students at the next level. Figures 3a and 3b show log of literacy and college graduation rates separately for every decade from 1951 to 1991. These show visually that the difference between minority and majority districts persists for every year in the decade, although the difference diminishes over time.
Thus, the test of first differences between minority and majority language districts offers evidence that historical language mismatch has a persistent impact on modern educational outcomes. These results can be placed in context of other programs to boost education such as India's school subsidies for girls (National Programme for Education of Girls at the Elementary Level) which increased enrolment by 3 percentage points (Debnath Reference Debnath2013), the Indonesian INPRES school building program which increased schooling by 0.12 to 0.19 years (Duflo Reference Duflo2001), and Mexico's Progresa program which increased enrolment up to 11.1 percent (Schultz Reference Schultz2004).
RESULT FOR EDUCATION IN MINORITY VERSUS MAJORITY DISTRICTS (A)
*= Significant at the 0.10 level.
** = Significant at the 0.05 level.
*** = Significant at the 0.01 level.
Notes: This table reports the coefficients obtained from estimating equation (1) with various measures of educational achievement as outcome variables. Each observation is a district-year, and the sample is pooled over the 1951, 1961, 1971, 1981, and 1991 census waves. Robust standard errors in parentheses are clustered at the district level.
Sources: Census of India 1951–1991, Indian Meteorological Department and Ministry of Rural Development (Government of India).
Test Using Border Districts
One concern is that these results are driven by omitted variables. To address this, I follow the strategy presented in Abhijit Banerjee and Iyer (Reference Banerjee and Lakshmi2005) and estimate equation (1) on a sample of 37 districts that share a geographical border but differ in classification as minority or majority districts (Figure 4). Since these districts are arguably similar on unobserved characteristics compared to districts far from each other, this strategy helps mitigate omitted variable bias.
Table 5 shows larger and more precisely estimated differences between historically minority and majority districts in education achievement rates (28.5 percent, p<0.01 for literacy; 32 percent, p<0.01 for middle school completion; 29.5 percent, p<0.05 for matriculation; 25.7 percent, p>0.10 for graduation). Thus, the robustness test using a restricted sample of districts bordering each other suggests that omitted variables do not drive this result, and that the language status of the district directly affects economic outcomes.
Test Using Linguistic Distance Measure
Another potential concern is that language may be systematically correlated with cultural or social differences, so the findings represent cultural rather than linguistic differences between minority and majority districts. To address this concern, I propose using a measure of linguistic distance that is logically orthogonal to educational outcomes. This measure, developed by M. Paul Lewis, Gary F. Simons, and Charles D. Fennig (Reference Lewis and Gary2009), is constructed by counting the number of nodes between each pair of languages on the family tree of Indo-European and Dravidian languages.Footnote 20 More nodes between a pair of languages imply greater difficulty for a speaker of one language to learn another language and vice versa, and translates into a higher score for linguistic distance. For example, in Figure 5, Tamil and Malayalam are close to each other on the family tree, implying that learning one language is relatively easy for speakers of the other language. This ease is captured by the pairwise linguistic distance of three between the two languages. On the other hand, Telugu speakers find it difficult to understand or learn Kannada and vice versa, which is represented by a pairwise linguistic distance of six.
RESULT FOR EDUCATION IN MINORITY VERSUS MAJORITY DISTRICTS (B)
= Significant at the 0.10 level.
= Significant at the 0.05 level.
= Significant at the 0.01 level.
Notes: This table reports the coefficients obtained from estimating equation (1) with various measures of educational achievement as outcome variables. Each observation is a district-year, and the sample is pooled over the 1951, 1961, 1971, 1981, and 1991 census waves. Robust standard errors in parentheses are clustered at the district level.
Sources: Census of India 1951–1991, Indian Meteorological Department and Ministry of Rural Development (Government of India).
Table 6 reports the linguistic distance between each pair of Scheduled Indian languages, where the average pairwise distance between the four relevant South Indian languages is 5.83.Footnote 21 Using the data from Table 6, I assign a linguistic distance measure to each minority district based on the pair of languages dominant in the state that the district was assigned to before and after reorganization (see Figure 6). I specify a model where the linguistic distance Li is interacted with the minorityi dummy in equation (1). Note that equation (2) does not contain a separate levels term for linguistic distance since the variable is relevant only for minority language districts.
TOTAL LITERACY BY YEAR

COLLEGE GRADUATION RATE BY YEAR

SUB-SAMPLE OF NEIGHBORING MINORITY AND MAJORITY DISTRICTS

In this specification, β2 is the marginal impact of a unit increase in linguistic distance on outcomes in a minority district. I expect β2 to be negative as linguistic distance between the mother tongue and the official language makes it more difficult to complete various educational levels.
Table 7 presents ordinary least square (OLS) estimates of β2 using the same set of educational outcomes as the previous section. Note that since linguistic distance is an ordinal measure constructed by counting nodes on the language tree, β2 does not have direct economic interpretation. The estimates suggest that economic outcomes are less with increase in linguistic distance between the district's mother tongue and historical official language. Table 7 reports that a marginal increase in linguistic distance within minority districts decreases literacy and middle school completion rates (−0.035 and −0.062, respectively, p<0.05 for both). Matriculation rates are also lower in minority districts but the point estimate is small (−0.024) and statistically indistinguishable from the null. Since English is the medium of instruction at the tertiary level, linguistic distance between vernacular languages should not have an impact on graduation rates, as evidenced by the small positive coefficient on college graduation (0.026, p>0.10). Conversely, the larger and more precisely estimated impact of linguistic distance on primary and middle school education compared to higher education suggests that language effects manifest themselves early in the education process when mother tongue teaching is more important.
RESULT FOR EDUCATION IN MINORITY VERSUS MAJORITY DISTRICTS (BORDER DISTRICTS TEST)

= Significant at the 0.10 level.
= Significant at the 0.05 level.
= Significant at the 0.01 level.
Notes: This table reports OLS coefficients corresponding to β 1 from equation (1) which estimates the impact of minority language status on various measures of educational achievement. Each observation is a district-year, and the sample is pooled over the 1951, 1961, 1971, 1981, and 1991 census waves. Robust standard errors in parentheses are clustered at the district level.
Sources: Census of India 1951–1991, Indian Meteorological Department and Ministry of Rural Development (Government of India).
CONSTRUCTION OF LINGUISTIC DISTANCE

LINGUISTIC DISTANCE MEASURE

Notes: This table shows the pairwise linguistic distance between major Indian languages.
Source: http://www.ethnologue.com and author's calculations.
LINGUISTIC DISTANCE BY DISTRICT

RESULTS FOR EDUCATIONAL OUTCOMES BY LINGUISTIC DISTANCE

= Significant at the 0.10 level.
= Significant at the 0.05 level.
= Significant at the 0.01 level.
Notes: This table reports OLS coefficients corresponding to β 2 from equation (2) which estimates the impact of linguistic distance between the district's mother tongue and the language used in schools among minority districts on various measures of educational achievement. Each observation is a district-year, and the sample is pooled over the 1951, 1961, 1971, 1981, and 1991 census waves. Robust standard errors in parentheses are clustered at the district level.
Sources: Census of India 1951–1991, Indian Meteorological Department, Ministry of Rural Development (Government of India).
Test Using Minority Fraction Measure
The binary minority variable as defined and used in previous sections does not capture the intra-district mix of languages. I expect that minority districts that are more polarized (i.e., fewer speakers of the official language) will experience poorer educational outcomes than otherwise. Thus, I construct a continuous measure of minority status, MinorityFraction, that helps differentiate polarized districts where the state's minority language is spoken by a large fraction of residents from those districts where the number of minority and majority language speakers are more evenly matched.
In this definition, OfficialLang is the number of speakers of the official language of the pre-reorganization state where the district is located. MotherTongue is the number of speakers of the most popular language spoken in the district other than the state's official language. Hence, for minority districts, MotherTongue>OfficialLang and MinorityFraction>0. Additionally, a large positive value for MinorityFraction indicates that a large fraction of the population speaks the minority language compared to the state language whereas a small positive value implies that the two languages are spoken by relatively same number of district residents.
The 1951 Census reports the top three languages spoken in each district from which I calculate MinorityFraction for each district and use in equation (4).
In equation (4), β1 indicates the marginal impact of increasing the share of minority language speakers on outcome variable yit . Table 8 shows that districts with large minority language populations suffer from greater shortfalls in educational attainment. A unit increase in MinorityFraction is associated with 7.6 percent decrease in literacy rates, 12.6 percent lower middle school completion rates, and 12.9 percent lower matriculation rates (p<0.05 for all). The decrease in college graduation is 13.4 percent (p<0.10). Thus, districts that were more polarized in 1951 experienced significantly poorer educational outcomes in the post-Independence period, suggesting that language mis-alignment had a persistent impact on educational outcomes.
Plausible Channels
In this section, I examine various mechanisms through which language might affect educational achievement. Although it is difficult to pinpoint the precise channel with the available data, I rule out the effects on occupational choice, provision of public schools, and inter-district migration on educational outcomes, suggesting the primacy of factors within the school, such as the medium of education, in determining educational achievement.
A mechanism through which language might influence educational attainment is through access to new occupations and business networks. If communication intensive occupations (such as those in the secondary and tertiary sectors) require knowing the majority language of the state or province, then returns to education will be greater for individuals who live in majority districts. However, Online Appendix Table 6 shows no significant differences in the occupational structure between the minority and majority districts. This suggests that districts’ historical language status did not persistently affect occupational structure. Hence, access to communication-intensive occupations or business networks is unlikely to be a major channel to motivate greater investments in education.
RESULTS FOR EDUCATIONAL OUTCOMES USING MinorityFraction

= Significant at the 0.10 level.
= Significant at the 0.05 level.
= Significant at the 0.01 level.
Notes: This table reports OLS coefficients corresponding to β 1 in equation (4) which estimates the effect of increasing fraction of speakers whose mother tongue is different than the official language on educational achievement. Each observation is a district-year, and the sample is pooled over the 1951, 1961, 1971, 1981, and 1991 census waves. Robust standard errors in parentheses are clustered at the district level.
Sources: Census of India 1951–1991, Indian Meteorological Department, Ministry of Rural Development (Government of India).
The second mechanism is the impact of public investments, especially school building, on educational attainment. State governments, which control primary and secondary education in India, might invest in minority language areas with relatively lower educational achievement to spur improvements in schooling completion rates.Footnote 22 Alternatively, if representatives from majority language districts are more likely to form the government, they may reward constituents with more educational infrastructure. Online Appendix Table 7 reports differences in the presence of various school types in minority versus majority districts. Although all coefficients are negative, suggesting fewer schools in minority language districts, these cannot be statistically differentiated from the null. Thus, while I cannot conclusively rule out the role of public investments to explain differences in educational achievement, the empirical evidence for this channel is also weak.
Finally, I examine the impact of inter-district migration. Language policies might impact educational outcomes if individuals in minority districts who are more motivated to study migrate to majority districts, enrol in schools and complete increasing levels of education. To estimate the impact of this channel, I use the same specifications presented earlier. Along with total migration, I also include the male migration rate as the dependent variable since men are more likely to migrate in search of work than entire families. Online Appendix Table 8 shows that the coefficients for the minority variable are all small and statistically insignificant, which is consistent with other empirical studies that do not find significant inter-district migration in India over this period (Munshi and Rosenzweig Reference Munshi and Mark2009). This suggests that districts’ historical linguistic status did not have much impact on migration and inter-district migration is an unlikely channel through which language influences educational outcomes.
Catch up after Reorganization
The panel structure of the dataset and the timing of the 1956 reorganization can be used to test for the catch-up hypothesis among minority districts after reassignment.Footnote 23 Only those districts for which 1951 census data is available are included. The estimation equation is
where yit represents an educational outcome as measured in each census wave from 1951 to 1991. Postt is an indicator variable that is 0 if the year is 1951 and 1 otherwise. Hence, the coefficient β3 represents the marginal impact of the 1956 reassignment on minority language districts. The key identifying assumption is that in the absence of the reorganization, there would be no systematic differences in the trend of yit between minority and majority districts. I expect greater increase in enrolment and completion of formal education among minority language districts after reorganization.
RESULT FOR EDUCATION BEFORE AND AFTER REORGANIZATION IN MINORITY VERSUS MAJORITY DISTRICTS

* = Significant at the 0.10 level.
** = Significant at the 0.05 level.
*** = Significant at the 0.01 level.
Notes: This table reports the impact of language on educational achievement before and after the 1956 reorganization of Indian states. Each observation is a district-year, and the sample is pooled over the 1951, 1961, 1971, 1981, and 1991 census waves. Robust standard errors in parentheses are clustered at the district level.
Sources: Census of India 1951–1991, Indian Meteorological Department, Ministry of Rural Development (Government of India).
The results in Table 9 show that reassignment had a large and significant impact on literacy, middle school completion, and matriculation rates. Minority districts experienced higher growth rates than majority districts. Specifically, the growth rate was 36.9 percent higher for literacy, 55.6 percent greater for middle school completion, 60 percent for matriculation, and 50.9 percent for college graduation. Figure 3a shows that the difference in literacy between minority and majority districts is large before reorganization and diminishing after 1956, suggesting that alignment of a district's mother tongue with the state's official language is positively associated with enrolment in schooling. However, Figure 3b does not show much change in college graduation rates between 1951 and 1961, and minority and majority districts converge on this measure only in later decades. This is not surprising, since changing the medium of instruction in 1956 is unlikely to change the supply of potential college students by 1961. Instead, increases in schooling in the 1950s and 1960s as a result of the reorganization of states will impact university-level education by 1970 at the earliest.
RESULT FOR EDUCATION OUTCOMES BEFORE AND AFTER REORGANIZATION BY LINGUISTIC DISTANCE

* = Significant at the 0.10 level.
** = Significant at the 0.05 level.
*** = Significant at the 0.01 level.
Notes: This table reports the impact of language on educational achievement before and after the 1956 reorganization of Indian states. Each observation is a district-year, and the sample is pooled over the 1951, 1961, 1971, 1981, and 1991 census waves. Robust standard errors in parentheses are clustered at the district level.
Sources: Census of India 1951–1991, Indian Meteorological Department, Ministry of Rural Development (Government of India).
In Table 10, I report coefficients associated with a specification where minorityi is interacted with Postt and Li . Consistent with previous results, all coefficients associated with literacy, middle school completion, matriculation, and graduation rates suggest that districts where the mother tongue was linguistically distant from the official language before 1956 benefitted more from reorganization, and higher education improved as a result of instruction in the mother tongue. Finally, the coefficient associated with MinorityFraction interacted with Postt is consistent with findings reported in Tables 9 and 10.Footnote 24
DISCUSSION
The historian Ramachandra Guha argued that the reorganization of Indian states was a transformative event in the life of a young republic (Guha Reference Guha2008). It recognized and accommodated the development of a wide array of languages and associated cultural traditions while maintaining a federal and democratic polity. In this article, I not only demonstrate that colonial-era provinces which mixed together linguistic minority and majority areas led to differences in long-term educational outcomes, but also that language-based reorganization of state boundaries might have remedied these differences.
The magnitude of educational differences between districts that do and do not speak the official language is large, indicating that historical factors can dominate government policies or private remedies aimed at alleviating educational shortfalls. Nonetheless, catch up by minority districts after reorganization suggests that historical mismatches can be remedied through large scale political changes.
These results should be read with a number of caveats. First, just because I analyze the effects of language mismatch in this setting does not imply that these findings can be readily generalized for all situations. While I argue based on institutional characteristics that the results could be representative of other contexts, researchers should be cautious extending these findings to other languages, nations, or educational levels or systems. For instance, other educational systems might feature much more intense multilingual instruction that mitigates the impact of language mismatch. So the strength of language effects that I find might represent upper bounds compared to other educational systems.
Second, while I examine educational achievement in school completion rates, due to data limitations I do not estimate the impact of language mismatch on a wide range of additional outcome variables, including choice of subjects and test scores that the education literature deems important. Similarly, variables such as earnings are unexamined due to data limitations.
Third, the article does not outline a comprehensive model of the influence of language effects on educational outcomes. Absent a comprehensive mechanism or the ability to conduct experiments, I cannot evaluate the impact of specific policies (such as multiple language instruction or sorting students by mother tongue within a district) to improve student outcomes. Finally, this article does not account for bilingualism, multilingualism, and language shift, especially with increasing use of English in the last century.
Nonetheless, this article has implications on new state formation in India. After 1971, a number of Union Territories (areas administered by the central government) converted to formal statehood. More significantly, three new states—Chhattisgarh, Jharkhand, and Uttaranchal—were carved out in 2000 from larger states on the basis of distinct culture of these regions; a fourth state Telangana separated from Andhra Pradesh in 2014. The results presented in this article indicate that new states formed on the basis of shared language might experience better educational outcomes.


