


Non-technical Summary
The placement of landmarks or points on three-dimensional (3D) digital fossils allows for the visualization and characterization of shape. Eublastoidea, an ancient (443–251 million years ago) echinoderm (e.g., sea urchins) group, is an ideal group for such analysis, because they are composed of skeletal elements whose connections are inherited and easily identifiable on all species. Herein, we use 3D landmarks on fossil echinoderms to investigate relationships, change through time, and whether the varying proportions of skeletal elements that produce the animals’ overall shapes are distinguishable in morphospace. The plating around the animals’ mouths (oral plates) shows visible patterns in morphospace, while other ratios examined show no disambiguation in morphospace. Applying modern analytical methods to previously explored questions allows for an updated understanding of this important echinoderm group and provides a framework for others to assess echinoderms in a similar manner.
Introduction
When approaching questions regarding morphological disparity and morphospace occupation patterns, one of two approaches is typically used. The first approach is in terms of discrete or categorical characters, typically utilized in phylogenetic analysis of morphology. The second approach is through the use of geometric morphometrics, in which morphology is characterized by quantitative variation in shape and proportion (Foote Reference Foote1991; Lawing and Polly Reference Lawing and Polly2009; Ferron et al. Reference Ferron, Martínez-Pérez, Rahman, Selles de Lucas, Botella and Donoghue2020; Deline Reference Deline2021). Geometric morphometrics utilizes homologous features to quantitatively characterize variation in shape and proportions (Ferron et al. Reference Ferron, Martínez-Pérez, Rahman, Selles de Lucas, Botella and Donoghue2020). Three-dimensional geometric morphometrics (3D GMM) allows for the placement of landmarks on all sides of the fossil, compared with a single (two-dimensional [2D]) view, and is a powerful analytical method that compares the 3D objects through Cartesian coordinates of geometric points, including landmarks or semilandmarks (Polly and Motz Reference Polly and Motz2016). Three-dimensional geometric morphometrics is widely used for its ability to exclude the issue of size in order to focus purely on shape, in addition to the simplicity of Cartesian coordinate data (Lawing and Polly Reference Lawing and Polly2009; Polly and Motz Reference Polly and Motz2016). Fossils preserve morphological information across time and space, the utilization of 3D GMM provides a method for exploring macroevolutionary trends in morphology (Vitek Reference Vitek2013; Jones et al. Reference Jones, Benitez, Angielczyk and Pierce2018).
Morphological diversity, or disparity, of fossil organisms is the primary source of data used to explore patterns of disparity, evolution, and diversity through time (e.g., Lawing and Polly Reference Lawing and Polly2009; Lopez Carranza and Carlson Reference López Carranza and Carlson2019; Ferron et al. Reference Ferron, Martínez-Pérez, Rahman, Selles de Lucas, Botella and Donoghue2020; Deline Reference Deline2021). As such, it is important to understand the homologous skeletal elements that produce the overall gross morphology. Quantifying differences in disparity allows for better understanding of evolutionary changes in speciation, anatomical change within a lineage, and trends toward morphological forms or features (Lawing and Polly Reference Lawing and Polly2009; Deline Reference Deline2021).
Echinoderms are model organisms for the study of morphological disparity due to their ecological and taxonomic diversity, as well as their wide range of morphological features and body plans (for a full summary of recent advances, see Deline Reference Deline2021). Much of the previous work regarding echinoderm morphology has utilized 2D geometric and traditional morphometric analysis, and more recent work (e.g., Stöhr et al. Reference Stöhr, Clark, Thuy and Darroch2019; Goharimanesh et al. Reference Goharimanesh, Ghassemzadeh, De Kegel, Van Hoorebeke, Stöhr, Mirshamsi and Adriaens2022) has employed 3D GMM to investigate modern ophiuroid arm plates. The advancement of computational abilities, such as 3D GMM, allows for a more detailed view of the intrinsically complex body plan of any given organism. Herein, we use 3D GMM to reassess the understanding of gross morphology in Eublastoidea, a Paleozoic echinoderm clade with a conservative body plan, consisting of organized plate circlets that are identifiable on all species. We hypothesize that the use of an increased number of landmarks and new methodologies will provide a more detailed assessment of eublastoid shape than previous work. We anticipate that using plate circlet ratios will be more morphologically informative than using general shape types. We also expect that many eublastoid taxonomic assignments will display a degree of morphological overlap aligning with previous work suggesting the classification requires reevaluation. This study is the first to produce reproducible results using 3D GMM on fossil echinoderms and provides a framework for future work exploring echinoderm disparity using 3D techniques.
Eublastoidea as a Model System
The homology of Echinodermata skeletal elements (ossicles and plates) has been evaluated extensively over the past 50 years. There are two main hypotheses: extraxial-axial theory (EAT; Mooi et al. Reference Mooi, Bruno, Didier, David, Guille and Feral1994) and universal elemental homology (UEH; Sumrall and Waters Reference Sumrall and Waters2012). The primary goal of EAT is to uncover high-level body organization homology across Echinodermata, whereas UEH was developed specifically to further understand the oral plating of blastozoan echinoderms. Eublastoids, a blastozoan group, are complex organisms that inhabited shallow ocean waters from the Silurian to the Permian (443 to 251 Ma). They displayed bilateral symmetry, and their visceral mass was encased by interlocking plates of calcium carbonate that can be sorted into three primary circlets: radial, deltoid, and basal (Beaver Reference Beaver, Moore and Moore1967). These plates, usually 18–21 in total, can be identified on all species of eublastoids (Beaver Reference Beaver, Moore and Moore1967). The plate junctions are considered homologous across all species of eublastoids, making them ideal landmark locations for geometric morphometric analysis (Foote Reference Foote1991; Deline Reference Deline2021). Eublastoid deltoids are identified as oral plates in the UEH framework and are homologous to oral plates in other blastozoans such as rhombiferans and diploporitans (Sumrall and Waters Reference Sumrall and Waters2012). The majority of eublastoid literature refers to these plates as deltoids, and we will follow this nomenclature herein. Additionally, their hard, well-sutured, calcitic bodies preserve well through time and are therefore abundant in the fossil record (Brett et al. Reference Brett, Moffat and Taylor1997). Due to their wide temporal distribution, abundance, and conservative skeletal elements, eublastoids are an ideal group to investigate changes through time and space (Foote Reference Foote1991; Bauer Reference Bauer2021). Changes in thecal morphology can indicate variations in biologically significant parameters, such as generic richness and speciation or extinction rates.
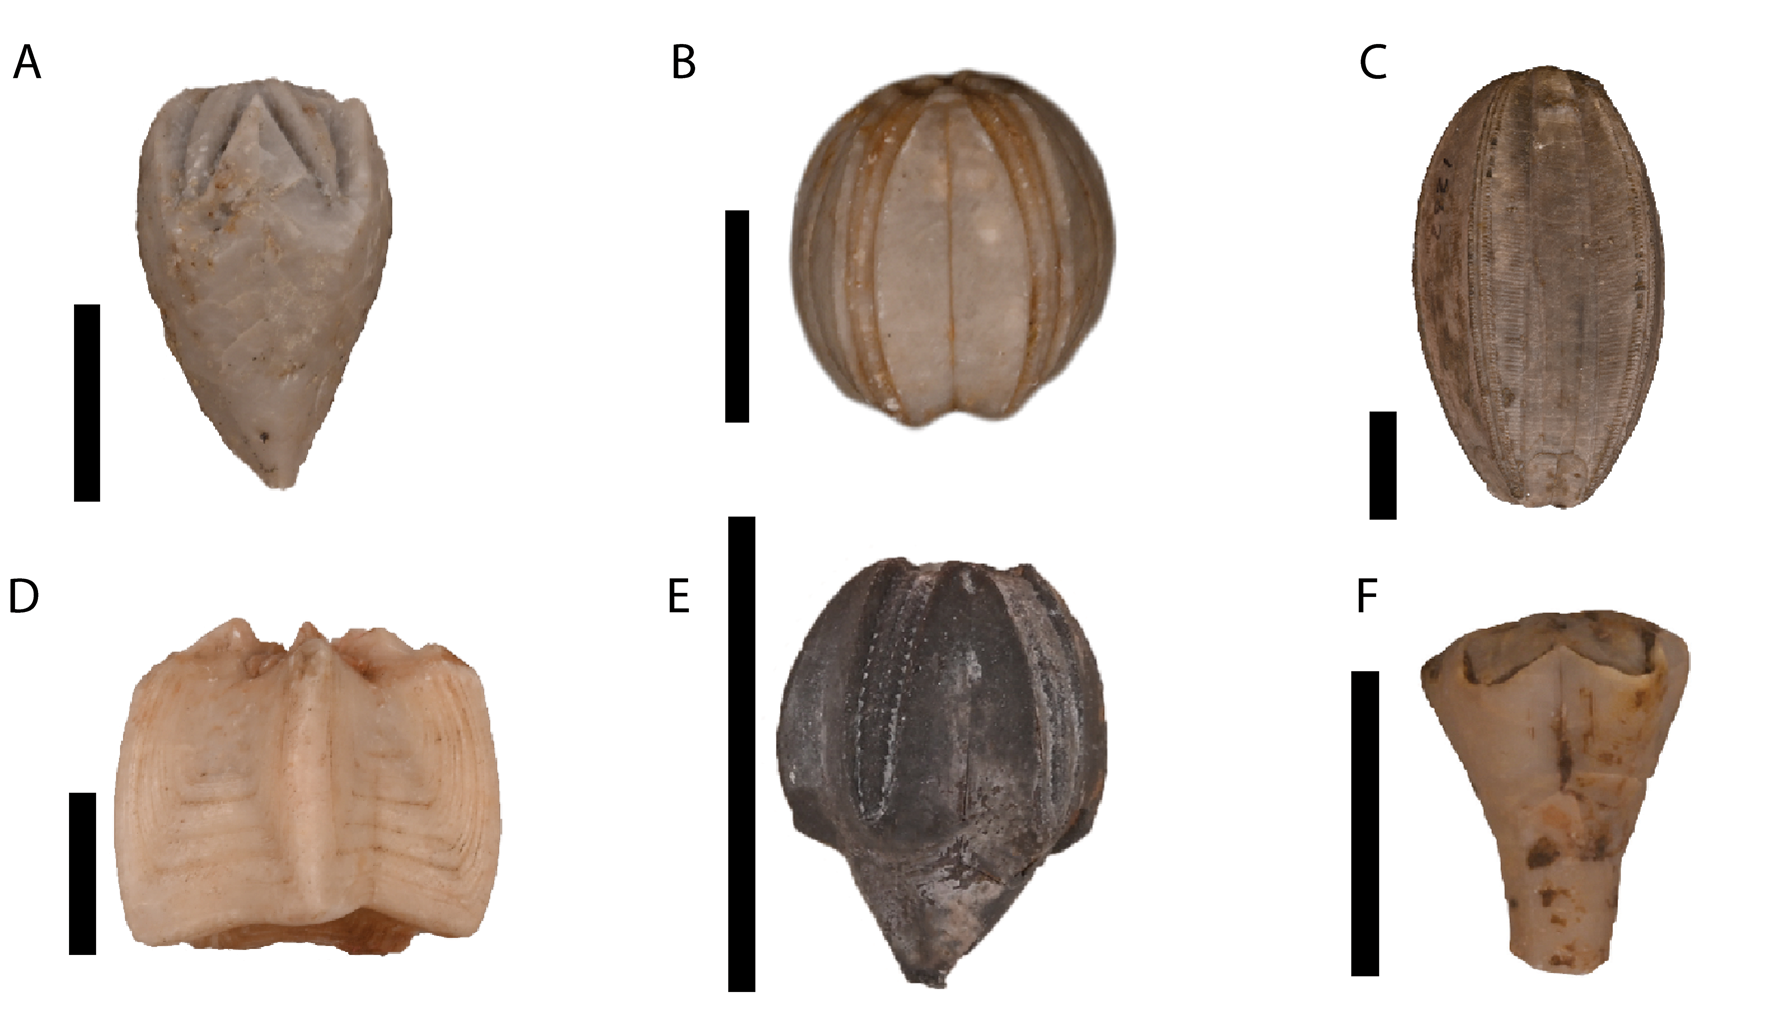
Eublastoid taxonomy is rooted in morphology, including aspects of overall shape (Deline Reference Deline2021). Beaver (Reference Beaver, Moore and Moore1967) provided distinctions of shapes into several groups: (1) pyriform, (2) globose, (3) elongate globose, and (4) vase-like (Fig. 1). These shape types have been used previously as characters to estimate the evolutionary history of the group (e.g., Breimer and Macurda Reference Breimer and Macurda1972; Atwood Reference Atwood2013). In addition to these previously described shapes, herein we add elongate vase shape type (Fig. 1F). The elongate vase shape is superficially similar to pyriform and vase-like, with the main differences being that the ambulacra and deltoids are isolated on the oral surface. Foote (Reference Foote1991) organized and described eublastoid data based on overall theca shape (Foote Reference Foote1991: fig. 2). However, the underlying homology of these broad shape types has never been explicitly explored—therefore, they may not be useful phylogenetic characters.
A representative sample of eublastoid species included in this study, representing range in overall shape morphology. A, Phaenoschisma laeviculus (UMMP IP 58665), an example of pyriform shape; B, Globoblastus norwoodi (UMMP IP 47833), an example of globose shape; C, Placoblastus obovatus (UMMP IP 1262), an example of elongate globose shape; D, Timoroblastus coronatus (UMMP IP 59768), an example of vase-like shape; E, Hyperoblastus goldringae (UMMP IP 62008), an example of godoniform (Waters et al. Reference Waters, Horowitz and Macurda1985); F, Cryptoschisma schultzii (UMMP IP 60614), an example of elongate vase shape. Scale bars, 1 cm.
Measurements of skeletal components have proven to be a useful tool in understanding morphology and ontogeny of eublastoids (e.g., Macurda Reference Macurda1966, Reference Macurda1983). One key aspect of eublastoid ontogeny is the growth of their calcite plates in three orthogonal directions (Macurda Reference Macurda1966). Measurements of plate dimensions allow for the description of the magnitude and direction of growth in a specimen. Additional studies have used measurements of respiratory structure folds to understand growth through ontogeny (Dexter et al. Reference Dexter, Sumrall and McKinney2009) and to delineate different growth trajectories between pyriform and godoniform Pentremites species (Waters et al. Reference Waters, Horowitz and Macurda1985). Previous work (e.g., Waters et al. Reference Waters, Horowitz and Macurda1985) has used a ratio of the “vault,” or the part of the theca containing the ambulacra, and the “pelvis,” or the aboral-most portion of the theca within the genus Pentremites. This ratio has been used to distinguish ontogenetic stages (Macurda Reference Macurda1964). However, it was found to not be useful for delineating species (Waters et al. Reference Waters, Horowitz and Macurda1985).
Taxonomic revision and assessment of Eublastoidea have resulted in significant revisions to our understanding of groupings, and many of these studies (e.g., Horowitz et al. Reference Horowitz, Macurda and Waters1986; Waters and Horowitz Reference Waters and Horowitz1993) suggest that additional work is needed, as many groups have been reassessed as polyphyletic rather than monophyletic. Evolutionary and taxonomic studies of eublastoids have traditionally been done by examining species at the order level (e.g., Waters and Horowitz Reference Waters and Horowitz1993). However, analyses conducted at the ordinal level can be problematic, as Fissiculata is paraphyletic, whereas Spiraculata is polyphyletic (Breimer and Macurda Reference Breimer and Macurda1972; Horowitz et al. Reference Horowitz, Macurda and Waters1986), indicating that a holistic analysis of taxa may be beneficial in reexamining taxonomic groupings.
Herein we build upon the previous body of literature by using a modern approach, 3D GMM, as a framework to visualize and evaluate multiple parameters related to eublastoids, including taxonomic assignment, gross morphology, approximately 200 Myr temporal range, and measurement and ratio data. We will dissect the relationship between overall morphology and visible plate circlet proportions as a way to quantify morphology among species and evaluate morphological occupation of different taxonomic groupings.
Previous Work Quantitatively Examining Eublastoid Morphology
Foote (Reference Foote1991) investigated the correlation between morphological and taxonomic diversity within the class Eublastoidea by analyzing 113 specimens spanning 85 species within 45 genera. Eight landmarks were placed on one ray (ambulacrum or petaloid feeding structure) of each eublastoid. Foote (Reference Foote1991) visualized components (PC 1–PC 3), and separated the specimens by taxonomic order (Fissiculata and Spiraculata) in addition to including Macurdablastus uniplicatus, which was previously thought to have been the earliest known true eublastoid. However, M. uniplicatus falls outside the group Eublastoidea and is therefore not considered a “true blastoid” (i.e., eublastoid), but it does fit within the inclusive Blastoidea that contains closely related echinoderms such as coronoids and Lysocystites (Donovan and Paul Reference Donovan and Paul1985; Bauer et al. Reference Bauer, Waters and Sumrall2019).
In addition to separating the specimens by order, Foote (Reference Foote1991) also separated the specimens by chronostratigraphic interval on individual plots with the corresponding landmark data. This visualization was useful, because it allowed for an examination of the secondary peak in eublastoid diversity documented in the Permian. In addition to the principal component (PC) plots, Foote (Reference Foote1991) also included a generic richness plot for all of Eublastoidea against chronostratigraphic intervals. Our study works to expand upon Foote's (Reference Foote1991) data through the inclusion of 3D landmarks.
Materials and Methodology
The University of Michigan Museum of Paleontology's (UMMP) Invertebrate Paleontology collection houses eublastoid specimens that have been included in critical morphological (Foote Reference Foote1991) and ontogenetic (Macurda Reference Macurda1966, Reference Macurda1979) studies. To build upon this work, we produced a set of 3D models that represent eublastoid taxonomic richness. Geometric morphometrics was implemented due to its ability to compare 3D shapes and variations between specimens compared with 2D landmark techniques.
Specimen Selection
We selected 64 specimens spanning 52 species within 26 genera for this study. The specimens selected represent 14 fissiculate and 12 spiraculate genera. Currently, there are 38 genera within the order Fissiculata and 51 genera within the order Spiraculata (Macurda Reference Macurda1983; Horowitz et al. Reference Horowitz, Macurda and Waters1986). Our data represents 32.56% of fissiculates and 26.21% of spiraculates (Table 1). Several species (e.g.,. Hyperoblastus filosa) are represented by numerous specimens. This was done to ensure a comprehensive representation of intraspecific variation. Specimens were chosen based on their preservation quality in addition to their size. Intact and undeformed eublastoids are necessary to run a successful morphometric analysis, and only those were chosen for this project. Additionally, a lack of matrix is necessary, because additional material will interfere with plate junction identification in addition to warping the geometric morphometric analysis of the specimen. Only specimens that were 1 cm or greater in height were chosen, as specimens shorter than that would not reconstruct properly due to photogrammetric method restrictions.
Sample size comparison to total eublastoid data as gathered from Macurda (Reference Macurda1983) and Waters and Horowitz (Reference Waters and Horowitz1993). The data are separated first by amounts of families in each defined order, then by genera. “Total” indicates the total number of families or genera currently assigned based on the name on the left most column of each row. For ease of comparison, an additional “Percentage” section is added to compare Foote (Reference Foote1991) and this study in terms of taxonomic spread of each sample size.

Photogrammetry
Specimens were imaged with a Nikon D810 DSLR with a 60 mm lens. Models were reconstructed utilizing RealityCapture (Epic Games 2021). MeshLab (Cignoni et al. Reference Cignoni, Callieri, Corsini, Dellepiane, Ganovelli, Guido, Scarano, De Chiara and Erra2008) was used for model postprocessing, including cleaning and scaling the models. All of the digital specimens included were scaled to their actual size. Digital models were downsampled (reduction of triangles in mesh model) to decrease the file size and increase computational ease of landmarking. For consistency, the digital/virtual eublastoids were oriented in Blender, a 3D editing software, with their oral side pointing toward the positive z-axis and their basal ends pointing toward the negative z-axis. This way, all of the digital specimens are oriented in the same way and open in our landmarking software uniformly. Initially, 80 specimens were selected and imaged for reconstruction. However, 16 specimens did not reconstruct due to size or issues with the software finding tie points on the model from our image stack, so they were excluded from the final sample size of 64. The 3D models are available for viewing and re-use on the University of Michigan Online Fossil Repository (UMORF; https://umorf.ummp.lsa.umich.edu).
Lateral View Measurements
Measurements were taken of each specimen to consider proportions of skeletal elements generating overall shape in order to obtain a more comprehensive understanding of how deltoid, radial, and basal plates can constitute varying amounts of the theca. Specimens were photographed with a Nikon D810 DSLR or Nikon Z series with a 60 mm lens in lateral view. Once the images were taken, they were imported into ImageJ (Rasband Reference Rasband1997–2018; Abràmoff et al. Reference Abràmoff, Magalhães and Ram2004; Schneider et al. Reference Schneider, Rasband and Eliceiri2012). Measurements were taken of the total height of each specimen, as well as for each plate circlet and ambulacrum length (Fig. 2). Each plate was measured from top (oral surface) to bottom (stem facet). For the deltoid/radial plate junctions, the deltoid was measured first, followed by the radials, starting where the deltoid plate measurement ended. This method was also applied to the radial/basal plate junctions. Invaginated basal plates—those that are “tucked up” into a dimple on the aboral-most surface and cannot be seen in lateral view—were given a height measurement of 0.00 cm. Each measurement was taken three times by both authors. When measurements were not within 0.1 cm, the specimens were remeasured. The average was used for generating ratios used in subsequent visualizations (see Supplementary Material 1 for all data).
An example of lateral view measurements on Pentremites sp. (UMMP 54118) taken in ImageJ using the measuring tool. Measurements were taken starting at the oral surface with the deltoid circlet and ending at the lowest point of the respective circlet. Dashed lines indicate plate boundaries; measurements are indicated as follows: d = deltoid/oral; r = radial; b = basal; and h = total height. Scale bar, 1 cm.

Placing Landmarks and Analysis
Sixteen landmarks (Fig. 3, Table 2) were identified for this study, building upon the eight employed by Foote (Reference Foote1991). Foote (Reference Foote1991) placed all plate boundary and ambulacra-specific landmarks solely on the A radial in order to reduce redundancy. However, we were concerned that this minimal list of landmarks is insufficient for this study due to the inclusion of aberrant and/or unusually shaped eublastoids, such as the genus Eleutherocrinus, which lacks a stem and equally developed ambulacra (Millendorf Reference Millendorf1979). To obtain a better understanding of morphology through the landmarks alone, it was necessary to include plate junction and ambulacra-specific landmarks on the A radial, B radial, and C radial (Fig. 3). One of the landmarks from Foote (Reference Foote1991) was negated (the most adoral point on the AB deltoid) in order to reduce redundancy. Two additional landmarks were placed on each specimen in addition to the expansion of Foote (Reference Foote1991). One was placed on the direct center of the oral opening and the other was placed at the center point of where the anal opening touches the deltoid plate above (O7 from Sumrall and Waters Reference Sumrall and Waters2012). In addition to expanding the landmark set from Foote (Reference Foote1991), we also culled our data to match the landmarks analyzed in Foote (Reference Foote1991).
Generalized eublastoid theca showing 16 fixed landmarks as described in text from different views on a generalized eublastoid. Ambulacra (petaloid structures used for feeding) are named with letters. The A-ray is in the 12 o'clock position, and the other four rays are labeled B through E in a clockwise fashion. The A and B radials are depicted in lateral view to show the positioning of the landmarks. Major plate circlets are denoted on the figure: r = radial; d = deltoid; and b = basal. Radial, deltoid, and basal plates are denoted with r, d, and b, respectively. Image redrafted and modified from Foote (Reference Foote1991).

Description of 16 landmarks placed on each specimen. It is denoted whether or not the landmark originated from Foote (Reference Foote1991).

Initially, it was intended to utilize semilandmarks to provide further understanding of eublastoid morphospace occupation. After landmarking our data, we attempted to apply semilandmarks to our dataset using the R package geomorph (Adams et al. Reference Adams, Collyer, Kaliontzopoulou and Baken2021; R Core Team 2023). However, when semilandmarks were applied and analyzed using this package, the consensus shape of the included specimens was warped and folded in on itself, the loadings on all PCs were less than 5%, and minimal patterns or trends were observed within the PCs. The semilandmarks were seemingly falling through the mesh. The developer was contacted but is no longer able to support the package; future work will employ landmarking using Slicer 3D. Therefore, implementing semilandmarks that do not degrade the data would be insightful, but fall outside the timeline for this project.
The 3D virtual fossils were imported into RStudio (RStudio Team 2020) for landmark placement and analysis. Landmarks were placed using the R package geomorph (Adams et al. Reference Adams, Collyer, Kaliontzopoulou and Baken2021) and dependency packages. This produced an output .nts file of landmark coordinate data that was used in subsequent analyses. After placing the 16 fixed landmarks on all 64 viable virtual specimens, we collated these data and analyzed them using RStudio (RStudio Team 2020). We used geomorph to produce a Procrustes distance means plot that was used to determine whether any outliers are present in the dataset. Then, a thin plate spline (TPS) was produced to compare consensus shape between specimens. Each point on the TPS represents the generalized shift of landmarks from the consensus shape. A general Procrustes analysis (GPA) was applied to our landmark dataset to standardize the dataset to make points comparable by translating models to the origin, scaling the models, and rotating them to most closely align the coordinates of corresponding landmark points (Adams et al. Reference Adams, Collyer, Kaliontzopoulou and Baken2021). The GPA standardized dataset was then analyzed through a principal component analysis (PCA), which was also executed through the geomorph package. The R script that was used for landmarking and analysis can be found in Supplementary Material 2. The coordinates for the PCA produced by geomorph were then imported into another package, ggplot2, for visualization (Wickham Reference Wickham2016).
Another dataset (Supplementary Material 3) was generated with additional information related to various aspects of the specimens to use as a visualization tool alongside the resulting eublastoid morphospace occupation. Ordinal and familial assignments in addition to geologic time period data were gathered from specimen labels and the UMMP database. We generated ratios from the plate circlet measurements taken. The ratios included were: deltoid:total height, deltoid:radial height, radial:total height, radial:basal height, basal:total height, and deltoid + radial:basal, and ambulacra:(total height − ambulacra height), referred to as vault:pelvis in previous literature. Additionally, overall shape types, as described by Beaver (Reference Beaver, Moore and Moore1967) and Waters et al. (Reference Waters, Horowitz and Macurda1985), were included in our dataset (Supplementary Material 3) along with a new shape, elongate vase. The elongate vase shape is superficially similar to pyriform and vase-like. For the elongate vase shape, the ambulacra and deltoids are isolated on the oral surface, whereas pyriform and vase-like ambulacra and deltoids extend along the sides and can be seen in lateral view (Fig. 1).
We analyzed the statistical significance of our data through the use of the ProcD.lm function (Anderson Reference Anderson2001) in the geomorph package (Adams et al. Reference Adams, Collyer, Kaliontzopoulou and Baken2021). ProcD.lm performs a Procrustes analysis of variance (ANOVA) to evaluate statistical hypotheses describing patterns in shape variation and covariation for PCAs (Anderson and Braak Reference Anderson and Braak2003). We used this function to analyze both our data and data from Foote (Reference Foote1991). The ANOVA produces a Pr(>F) value, which is equivalent to a p-value. If a Pr(>F) value is less than 0.05, the null hypothesis of the ANOVA is rejected, and the findings are therefore considered statistically significant (Supplementary Material 4). The results that were found to be statistically significant were also subjected to a post hoc pairwise comparison to determine which groups within each parameter were significantly different (Supplementary Material 6).
Data from Foote (Reference Foote1991) were kindly provided to us for reproduction with our methodology. Foote provided a larger dataset than what was initially utilized in 1991: 175 specimens; of those, 113 were included in his 1991 work. We mapped and analyzed 109, excluding the Macurdablastus uniplicatus, because this specimen is not a member of the clade Eublastoidea (see Bauer et al. Reference Bauer, Waters and Sumrall2019), and two outliers discovered during our assessment of the data (UMP034/UMMP 51547 and USN032/USNM 455893). We also ran an ANOVA test using the ProcD.lm function (Anderson Reference Anderson2001). The comparison will be presented in the “Discussion.”
Results
The PCA produced 41 resulting vectors, with 54.06% of the variance in the dataset being accounted for on PC 1 and 24.78% of the variance accounted for on PC 2. The remaining components accounted for 6% or less. We analyzed three visualizations of the data; PC 1 compared with PC 2, PC 3, and PC 4 (Fig. 4); we will refer to the different components throughout as “PC” with the appropriate number.
Initial visualizations of the first four principal components of the 64 specimens. The x-axis is consistently the component that accounts for the most variance, component 1 (54.06%). A, Components 1 and 2 accounted for the most variance at 79.16%; B, components 1 and 3 accounted for 60.27% variance; and C, components 1 and 4 accounted for 59.03% variance. Point shapes on the plots align with the assigned taxonomic families of the specimens and will remain as such throughout the manuscript.

Taxonomic Separation
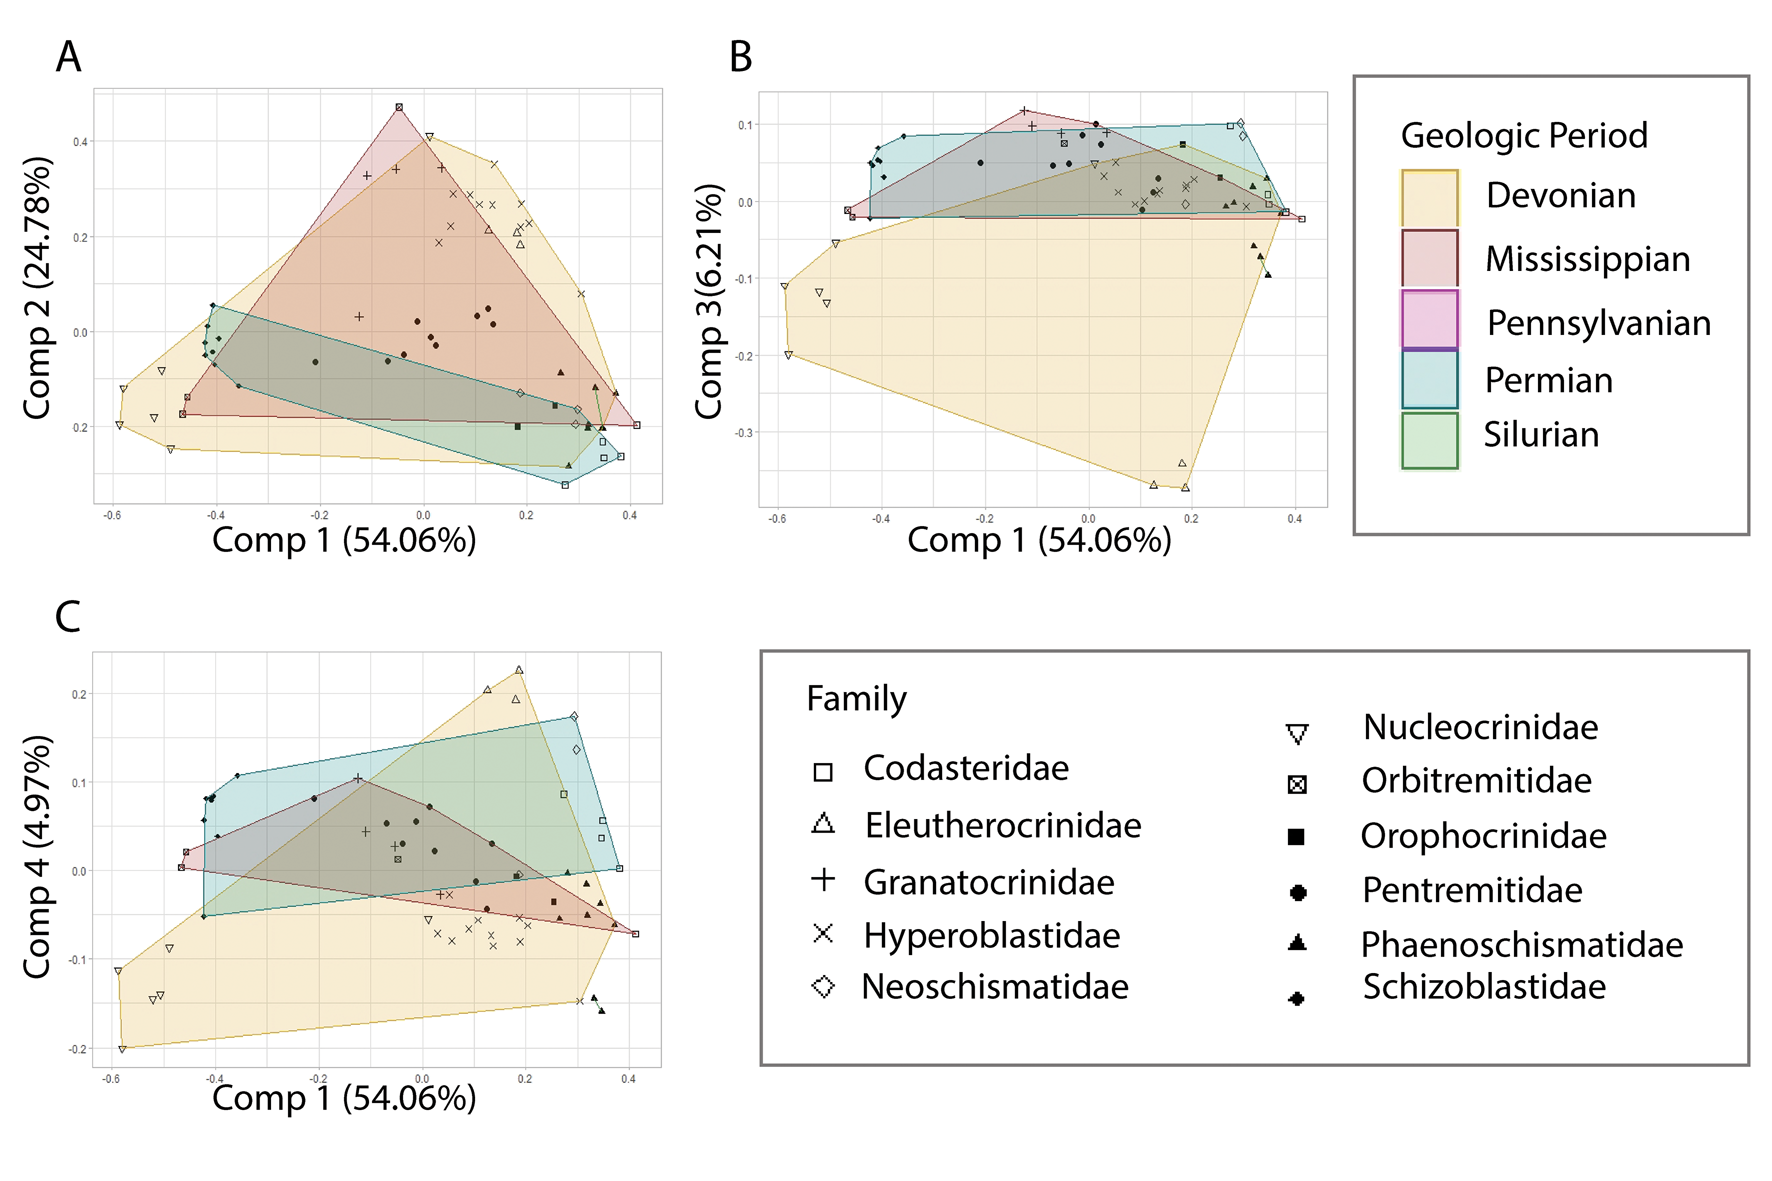
Visualization of the two previously ascribed eublastoid orders, Fissiculata and Spiraculata, shows distinction in morphospace. Fissiculata occupies a restricted area in the negative region of PC 2, whereas Spiraculata occupies a large, broad area in the more positive region of PC 2 (Fig. 5A). Ordinal assignment visualized using component 1 as x consistently and examining components 3 and 4 demonstrates minor overlap in morphospace. Alternative ordinal assignments were also visualized (Fig. 5D–F). Granatocrinida, Nucleocrinida, and Pentremitida demonstrate overlap in morphospace, while Fissiculata is isolated. Few families are isolated in morphospace when PC 1 and PC 2 are compared (Fig. 5G–I), and many have some amount of overlap with other groups. Two families are completely isolated in morphospace, Pentremitidae and Codasteridae. Families belonging to the order Fissiculata show distinct separation within the Fissiculata cluster in the lower right quadrant. Nucleocrinidae occupies the largest amount of morphospace and overlaps with several other families (Schizoblastidae, Orbitremitidae, and Granatocinidae). Pentremitidae occupies a completely isolated area of morphospace, located in the center of the plot. Eleutherocrinidae occupies a restricted region in morphospace and is completely encapsulated by the Hyperoblastidae convex hull. This distinction of Eleutherocrinidae is consistent with the other components examined as well. The positive-most points on PC 2 belong to Orbitremitidae and Nucleocrinidae. These two specimens seem to be outliers within their familial morphospace region. Families, again, occupied distinct regions in morphospace when visualizing component 1 as x and examining components 3 and 4 (Fig. 5G–I). Again, Eleutherocrinidae occupied a very distinct and isolated region in morphospace. Multiple families, Nucleocrinidae, Phaenoschismatidae, Codasteridae, and Eleutherocrinidae, are completely isolated in morphospace. The ANOVA produced by ProcD.lm indicated 0.016 as the p-value, suggesting the families are statistically different (Supplementary Material 4). Post hoc pairwise comparison suggests that Orophocrinidae is largely driving the results, with it being most different 80% of the time, and Phaenoschismatidae being the primary driver the remaining 20% (see Supplementary Material 6 for full pairwise output).
Principal component analysis with ordinal data from Supplementary Material 3 mapped on the plot as convex hulls to examine morphological spread. Component 1 is consistently the x-axis, and the y-axis changes across each plot. Ordinal assignment (A–C) was analyzed. Components 1 and 2 show complete isolation; components 1 and 3 show some overlap of the two orders, with the aberrant eleutherocrinids pulling Spiraculata far across morphospace; and components 1 and 4 also indicate overlap in morphospace. Alternate ordinal assignment (D–F) was also analyzed, with all plots showing varying degrees of overlap among Pentremitida, Nucleocrinida, and Granatocrinida. Point shapes and convex hulls (G–I) on the plots align with the assigned taxonomic families. Familial assignments depict large degrees of overlap, with Pentremitidae occupying a central region in morphospace.

Geologic Time Separation
The dataset temporally spans the Silurian to Permian. The species temporal bin was used to visualize the variation in morphology at different intervals in time. The resulting visualization for components 1 through 4 shows that Devonian-, Mississippian-, and Permian-aged specimens occupied a broad range of morphospace with a large degree of overlap (Fig. 6). The Devonian spans the greatest amount of morphospace followed by the Mississippian and Permian. The Silurian was completely isolated when PC 1 and PC 4 were compared; however, this could be due to the small sample size. Both the Silurian and the Pennsylvanian have small sample sizes, being represented by two and one data points respectively. Therefore, morphospace occupation for these temporal bins could not be confidently assessed with so few specimens. This trend is seen across all compared components, and the resulting p-value was 0.607 (Supplementary Material 4), suggesting that this parameter was not statistically significant.
Principal component analysis with data from Supplementary Material 3 mapped on the plots to examine variations in morphospace occupation between geologic periods. The Devonian consistently occupies the largest amount of morphospace (A–C). The nucleocrinids and eleutherocrinids produce the large spread of the Devonian convex hull seen (B, C). The Mississippian and Permian convex hulls show large changes between the various components. The Silurian is represented by two Phaenoschismatidae individuals. The Pennsylvanian is represented by a single Pentremitidae and is denoted by a pink point (A–C). Point shapes on the plots align with the assigned taxonomic families.
Shape Type
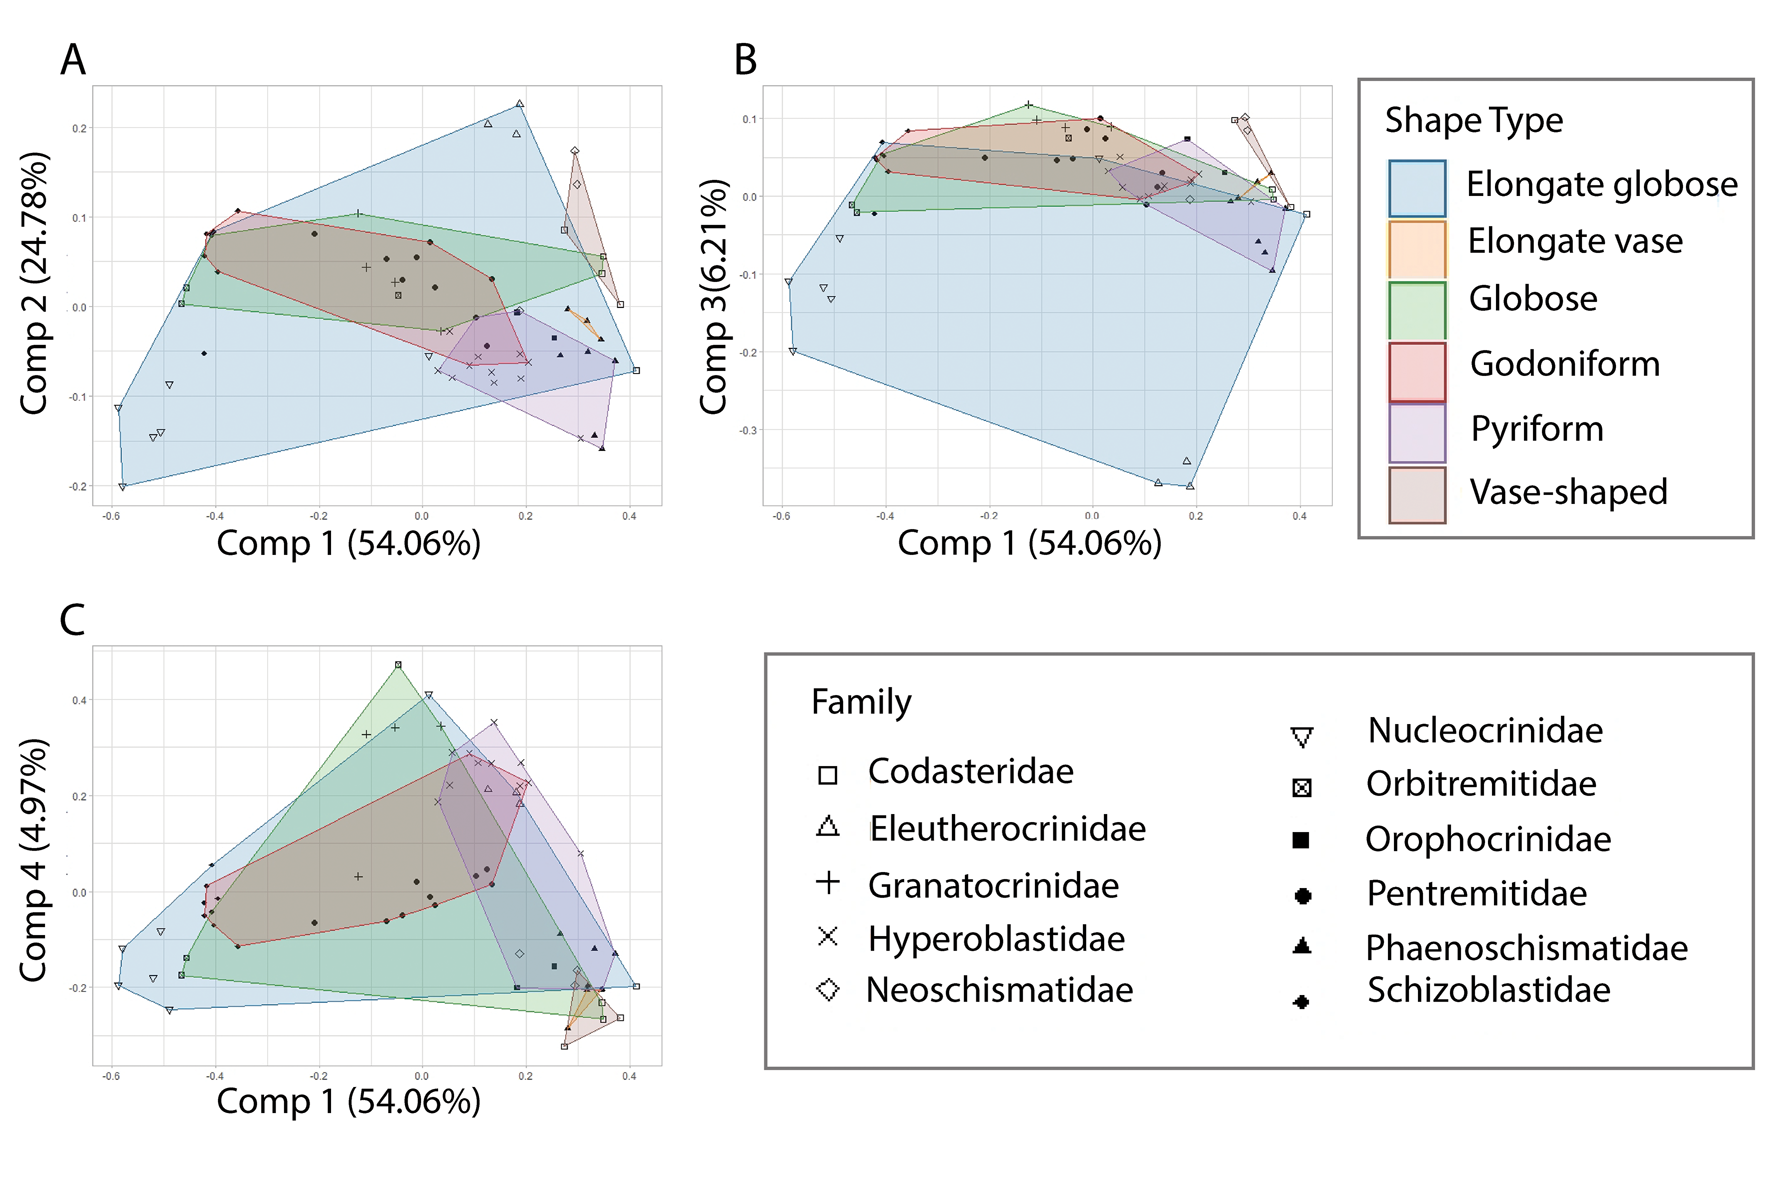
Shape types have been used to delineate eublastoids in species descriptions and assessments of evolutionary relationships (Breimer and Macurda Reference Breimer and Macurda1972; Atwood Reference Atwood2013). Similar to temporal information, the shape types were used as mapping characteristics overlaid onto the established morphospace. These results suggest no individual shape type is completely isolated in morphospace (Fig. 7). The shape types globose and elongate globose occupy an overlapping, broad range. The globose shape type overlaps with every other shape type. Pyriform also occupies a large range, but is mostly restricted to the positive-most side of PC 1. Elongate vase and vase-like shape types occupy the most restricted areas of morphospace; however, they have the fewest occurrences. Elongate vase and vase-like shape types occupy a restricted area in the lower right quadrant. The low number of occurrences could influence the restricted areas of morphospace occupation. These results are largely consistent across the components compared, and the resulting p-value was 0.121 (Supplementary Material 4), indicating that this parameter was not statistically significant.
Principal component analysis with data from Supplementary Material 3 mapped on the plot as convex hulls to examine variations relating to overall shape types as described by Beaver (Reference Beaver, Moore and Moore1967) and Waters et al. (Reference Waters, Horowitz and Macurda1985). A, Components 1 and 2 depict nearly complete overlap of shape types. B and C show increased spread of elongate globose, again pulled by nucleocrinids and eleutherocrinids. Point shapes on the plots align with the assigned taxonomic families.
Measurement Data
Vault:Pelvis Comparison
Vault:pelvis has been used in previous literature (Macurda Reference Macurda1964; Waters et al. Reference Waters, Horowitz and Macurda1985) to describe Pentremites growth patterns. Vault height can be quantified in two ways: the sum of the radial and deltoid plate heights or the ambulacra height in lateral view. The pelvis was computed by subtracting the vault height from the total height of each individual. The first way we mapped vault:pelvis was according to ambulacrum length, which did not show any significant patterns in morphospace occupation when PC 1 was compared with PC 2, PC 3, or PC 4 (Fig. 8A–C). Examination of other components also did not show any trends in morphospace, and the p-value was 0.961, indicating this parameter was not statistically significant (Supplementary Material 4).
Principal component analysis with ratio data from Supplementary Material 3 mapped on the plot to examine variations relating to vault:pelvis as described by others does not show any variation in morphospace (A–C). D–F, Our modified vault:pelvis ratio using plate circlet measurements of basal:deltoid + radial height shows one cluster of note, all Phaenoschismatidae species. Ratio plots (G–L) show a general trend of decreasing deltoid:total (G–I) or deltoid:radial ratio (J–L), or increasing deltoid length, moving left to right. Two nucleocrinids, a group known for unusually large deltoids, in the lower right-hand corner show notable distinction on both plots.
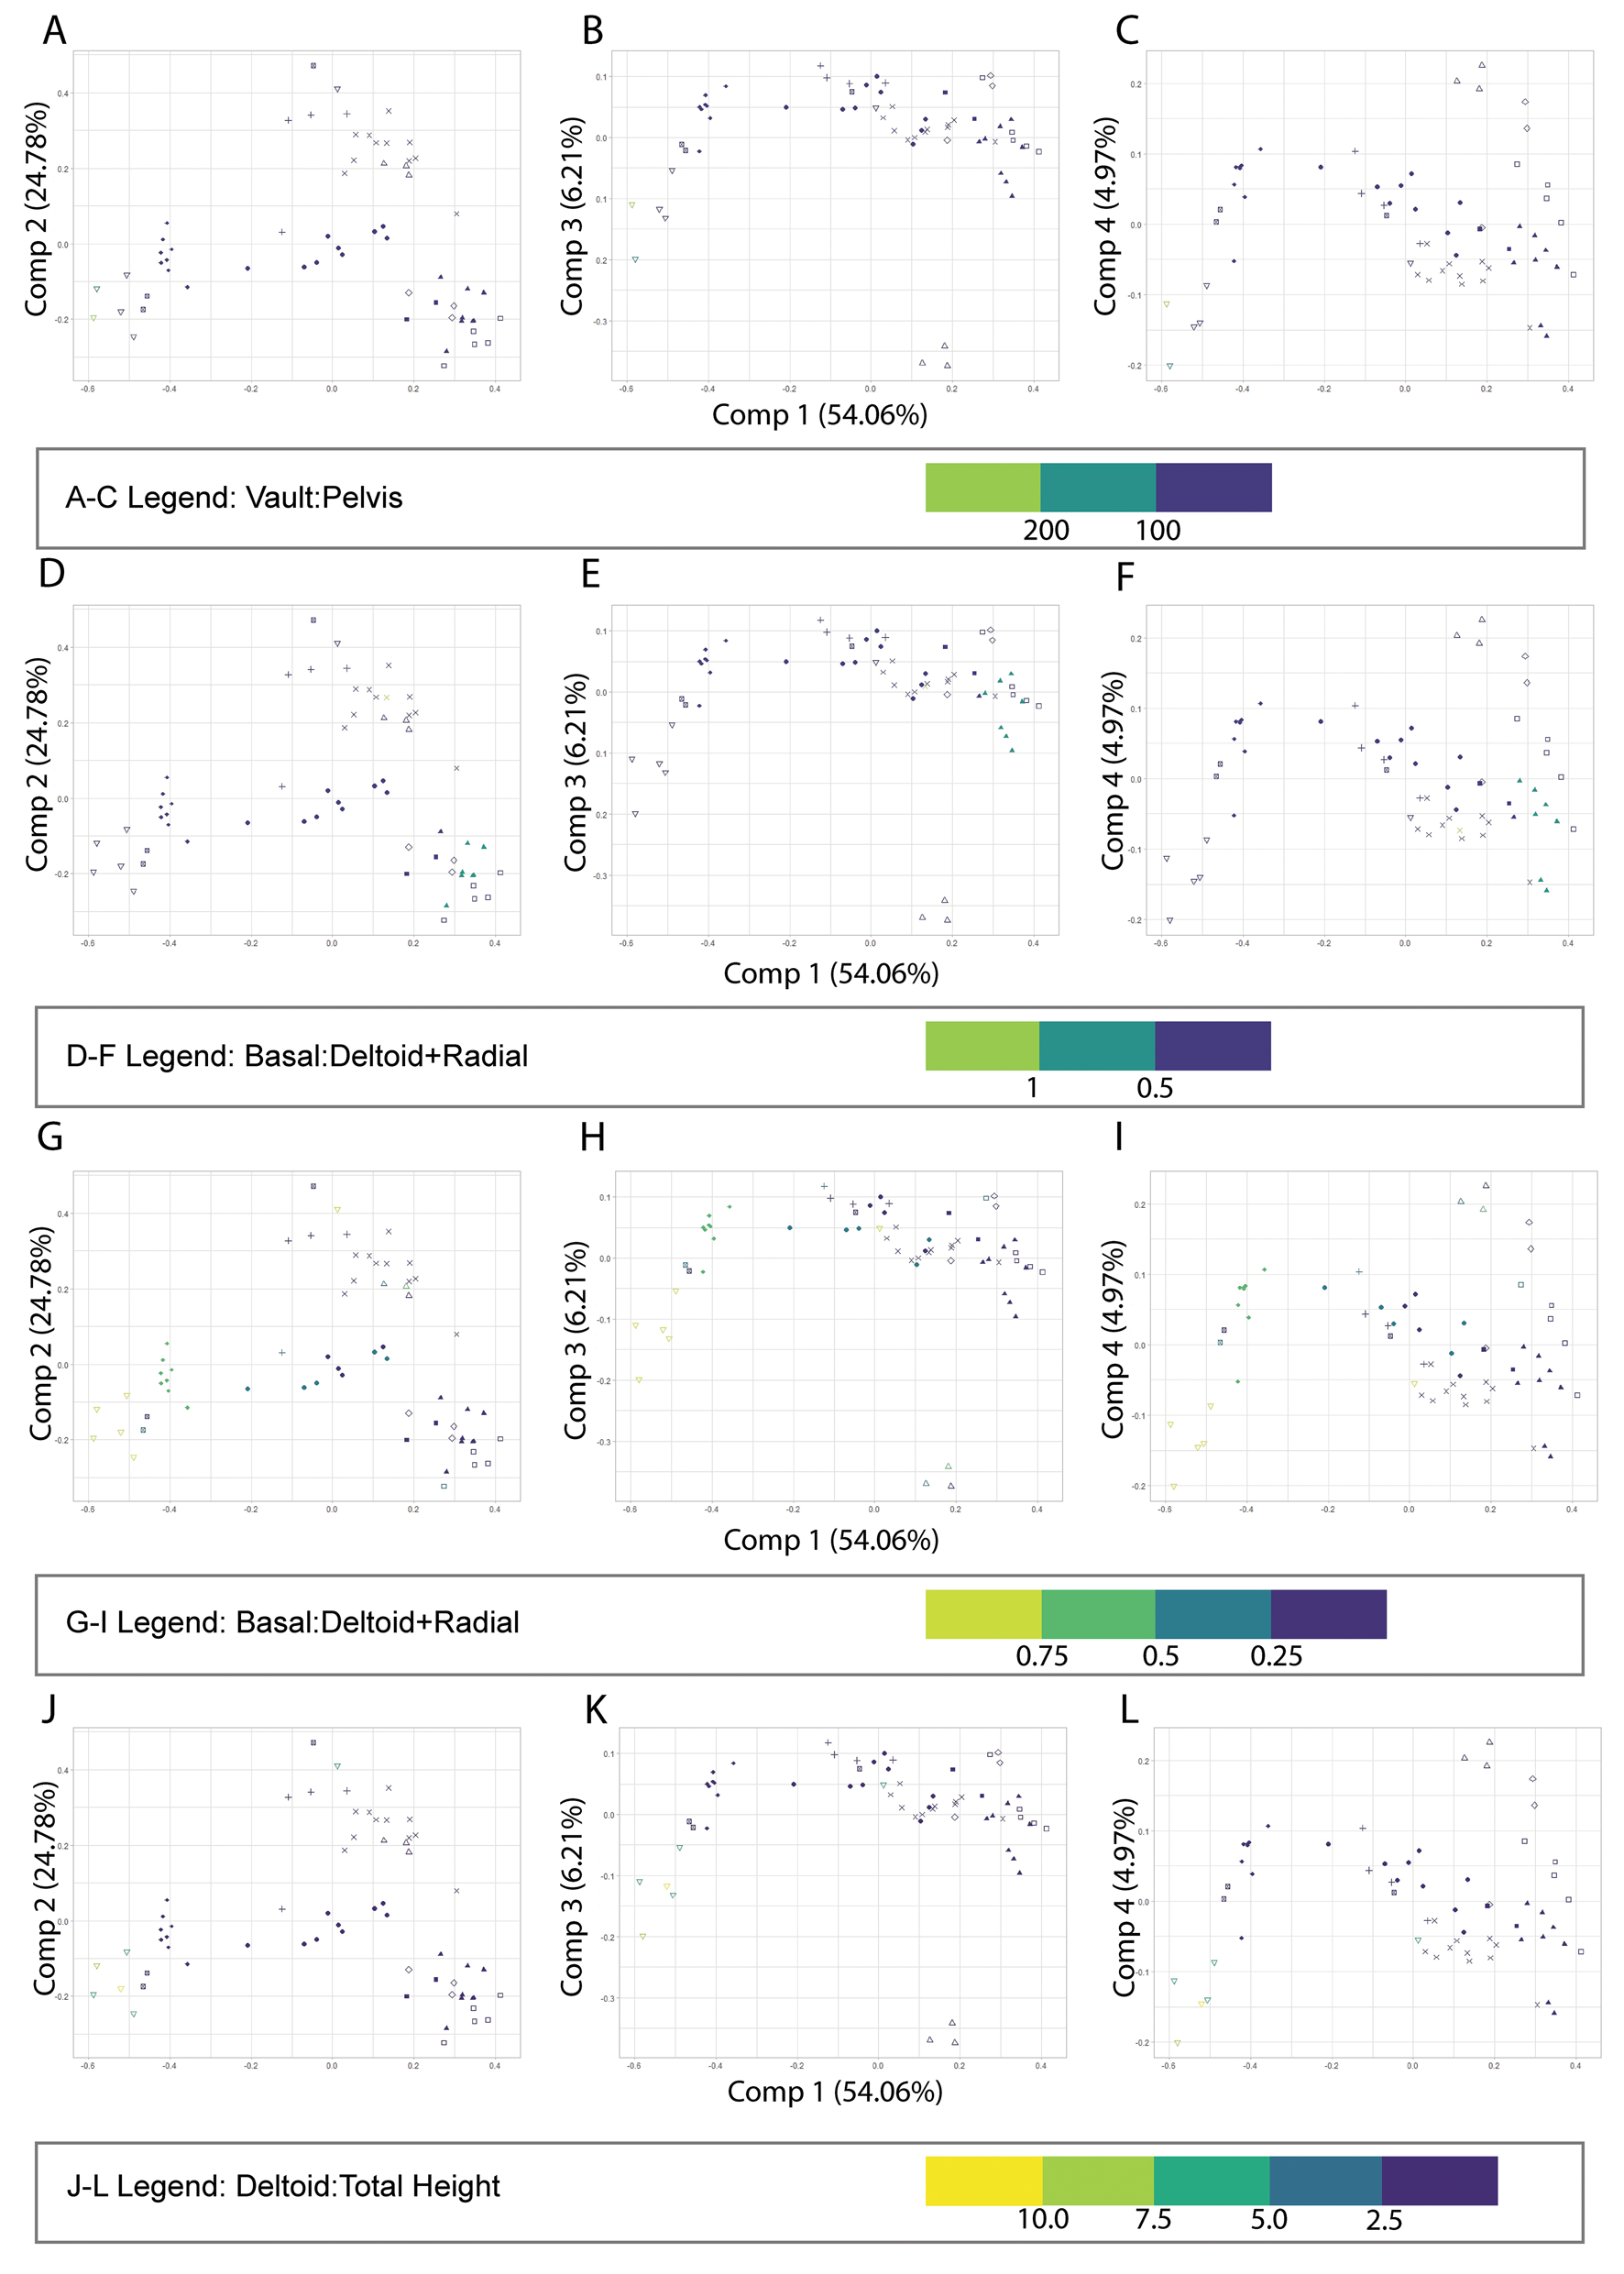
Because some blastoids possess invaginated basal plates, their basal circlet height in lateral view is 0. Instead, the ratio was inverted to plot a pelvis to vault ratio. Therefore, the other PCA was mapped according to basal:deltoid + radial height. When basal height is compared with radial + deltoid heights, there is a very minimal trend of increasing value moving left to right across PC 1 (Fig. 8D–F). The resulting p-value was 0.073, indicating that this parameter was also not statistically significant.
Plate Circlet Ratio Separation
The PCA was visualized based on the plate circlet ratios produced from the lateral view measurements. The ratios were visualized on the morphospace plot using a gradient tool through the R package ggplot2 (Wickham Reference Wickham2016). The plots that showed the most distinct patterns in morphospace were the plots that included the deltoid and radial plate circlets, the deltoid to total height (d:h) and deltoid:radial (d:r) plots (Fig. 8G–L). On the d:h plot, there is a general trend of decreasing d:h across PC 1; this is also seen when PC 1 is compared with PC 3 and PC 4. On the d:r plot, there is a trend of decreasing value across PC 1; this trend is also seen when PC 1 is compared with PC 3 and PC 4. Other plots, such as basal to total height (b:h), show minor trends; however, none were statistically significant. The resulting p-values are as follows: deltoid:total height was 0.409, basal:total height was 0.082, radial:total height was 0.5005, deltoid:radial was 0.409, and deltoid:radial was 0.409.
Discussion
Previous work by Foote (Reference Foote1991) was intended to explore and evaluate morphological and taxonomic diversity through time. Herein we focus more heavily on the underlying homology that may be driving gross morphology. In comparison to the data used in Foote (Reference Foote1991), our dataset is smaller, with 64 specimens included compared with 113. Despite possessing a larger quantity of specimens, the taxonomic breadth of each dataset was comparable, as Foote (Reference Foote1991) included 44 genera to our 26, or 42.72% and 38.83%, respectively, of total eublastoid genera (~103; see Table 1 for a full comparison). The analysis by Foote (Reference Foote1991) included 6 landmarks, while we employed 16 landmarks with the intention of better capturing the more-aberrant forms. For example, Eleutherocrinus has a reduced “A” ambulacrum, so if landmarks only correspond to the unusual morphology, the other rays that are not reduced are unable to be appropriately compared with other taxa. To evaluate this, we also subsetted our landmark data to correspond to those outlined in Foote (Reference Foote1991; Fig. 9).
Comparative plot series, with A, D, G being the data presented herein; B, E, H, subsetted landmark data of the data herein to match the landmarks of Foote (Reference Foote1991); C, F, I, modified Foote (Reference Foote1991) data using the same methodology presented herein. All points represent assigned taxonomic families, and additional legends indicate the parameter being mapped as convex hulls on the plots. The top row includes taxonomic orders, the second row includes alternate orders as defined in Waters and Horowitz (Reference Waters and Horowitz1993), and the third row represents geologic time periods. For simplicity, all plots represent component 1 on the x-axis and component 2 on the y-axis. All data are available in the associated Supplementary Material.

Taxonomic Separation
Because taxonomic descriptions are largely rooted in morphology, it is critical to investigate morphospace occupation of previously assigned taxonomic groupings. Much of the work on eublastoid taxonomy and systematics occurred in the 1960s–1980s (e.g., Fay Reference Fay1961; Beaver Reference Beaver, Moore and Moore1967; Breimer and Macurda Reference Breimer and Macurda1972; Macurda Reference Macurda1983) and is based on expert knowledge using methods and information available at the time. Our results suggest that limited taxonomic differences in Eublastoidea are represented in morphospace, but there are few distinct groupings. Distinction, or isolation in morphospace, would be a strong indicator of taxonomic separation, because morphology is often a by-product of phylogenetic relationships (Deline Reference Deline2021).
The orders Fissiculata and Spiraculata have been suggested to require revision, as Spiraculata has been interpreted as polyphyletic (Waters and Horowitz Reference Waters and Horowitz1993; Bauer et al. Reference Bauer, Waters and Sumrall2019). Foote (Reference Foote1991) found that Spiraculata and Fissiculata cannot be analyzed as separate clades; however, they do occupy relatively distinct regions in morphospace with minor overlap (see Foote Reference Foote1991: fig. 2). Our results suggest that Fissiculata and Spiraculata occupy distinct regions in morphospace when examining PC 1 and PC 2 (Fig. 5A). When PC 1 is compared with PC 3 and PC 4, the Fissiculata and Spiraculata data points occupy slightly overlapping regions in morphospace (Fig. 5B,C). When PC 1 and PC 2 for our subsetted dataset are compared, Fissiculata is completely enveloped within Spiraculata (Fig. 9B). Where our data suggest isolation between Fissiculata and Spiraculata (Fig. 9A), the modified Foote (Reference Foote1991) dataset depicts overlap between the two (Fig. 9B). The lack of overlap in our data could be due to the smaller number of fissiculate specimens. Our subset data and the modified Foote (Reference Foote1991) dataset both produced statistically significant ANOVA results and were then analyzed via pairwise comparison, which resulted in similar values of difference between the two orders (see Supplementary Materials 4 and 6). Additionally, we mapped alternative orders that include Fissiculata, Granatocrinida, Nucleocrinida, and Pentremitida (Figs. 5D–F, 9D–F). These orders are derived from Bather (Reference Bather1899) and redefined in Waters and Horowitz (Reference Waters and Horowitz1993). In the three datasets—our landmarks, our subsetted landmarks, and the modified Foote (Reference Foote1991) data—Pentremitida is located centrally in morphospace, and the resulting pairwise comparison suggests this taxonomic assignment is not a substantial driver of difference within the dataset (Supplementary Material 6). This is of interest, as Pentremitida has been described as highly variable and has the most species described, therefore, it being located centrally and overlapping other orders supports previous work (e.g., Galloway and Kaska Reference Galloway and Kaska1957). In both our and the modified Foote (Reference Foote1991) datasets, Nucleocrinida displayed the least amount of overlap, and the resulting pairwise comparison suggests this taxonomic assignment is a substantial driver of difference within the dataset, particularly in comparison to Fissiculata (Supplementary Material 6). To reconsider the ordinal morphological separation of eublastoids, a more in-depth coverage of both fissiculates and spiraculates is necessary. The addition of missing genera so that each order has a higher percentage represented could lead to better insight into the full morphological spread of Eublastoidea.
Eublastoid family data were gathered from Waters and Horowitz (Reference Waters and Horowitz1993) for the spiraculate species and Macurda (Reference Macurda1983) for the fissiculate species. It would be expected for families to show some overlap with taxa that may be aligned as sister groups. Many families occupy distinct regions in morphospace with varying degrees of overlap. Notably, Pentremitidae occupies an isolated, sizable region in the center of the morphospace plot for all three datasets. This large variation in Pentremitidae is known and has been studied previously (Galloway and Kaska Reference Galloway and Kaska1957; Waters Reference Waters1977; Waters et al. Reference Waters, Horowitz and Macurda1985; Horowitz et al. Reference Horowitz, Macurda and Waters1986). Through the use of harmonic Fourier series, Waters (Reference Waters1977) suggested that feeding mechanisms and selection pressures relating to feeding could cause high variability in thecal shape and morphology. Therefore, Pentremitidae being in the center of all three PCAs further supports this work. The modified Foote (Reference Foote1991) data showed the most overlap among families in the same areas where Fissiculata and Spiraculata overlapped. Within our dataset, two fissiculate families, Orophocrinidae and Phaenoschismatidae, were found to be driving the significant differences in morphospace. Interestingly, these families occupy a similar area of morphospace (Fig. 5). However, in the subset of our data and the modified Foote (Reference Foote1991) dataset, there is a notable increase in many of the family comparisons (Supplementary Material 6). As neither dataset captures all eublastoid species, a more comprehensive or even more targeted morphometric work on, within, and between family differences would be beneficial.
Geologic Time Separation
Separating the specimens by geologic interval is beneficial, as it aids in understanding whether different plate types constituted more or less of the thecal body across time. The shape and distribution of organisms within morphospace can aid in understanding drivers of large-scale morphological changes (Deline Reference Deline2021). Additionally, separating specimens by stratigraphic intervals could tell us about the impact of biogeographic isolation on eublastoids. Our data (complete and subsetted) suggest a small shift in morphospace occupation from the Devonian to Mississippian and a larger reduction in morphospace occupation from the Mississippian to the Permian (Fig. 6). Comparing our data with the modified data from Foote (Reference Foote1991), we see a similar decrease in morphological variation throughout time, especially into the Permian (Fig. 9I). This is evident in Foote's modified data, despite his dataset containing approximately 1.7 times the number of specimens from the Permian compared with our data (26 vs. 15). For both plots, the Silurian occupied the smallest morphospace area; this could be due to a small sample size from each time period for both datasets.
Evolutionary history of eublastoids has previously been described through the use of taxonomic abundance as occurring in three phases that are punctuated by diversification, radiation, and extinction (Waters Reference Waters, Paul and Smith1988). A recent biogeographic study of eublastoids (Bauer Reference Bauer2021) reanalyzed lineage diversity using an estimated phylogenetic hypothesis as a framework rather than taxonomic counts. This work suggested the peak lineage diversity occurred in the Devonian, with a secondary peak in the Mississippian followed by a steady decline (see Bauer Reference Bauer2021: fig. 3). Our results support the findings of Bauer (Reference Bauer2021) from a morphological spread perspective, which is inherently linked to phylogeny. There is a large expansion of eublastoid forms into and through the Devonian, followed by a wide burst of speciation in the Mississippian that produced the highest abundance of eublastoids, but many of the morphological forms had been established in the Devonian. The use of homologous landmarks for visualization and exploration of shifts through major geologic intervals provides a useful companion to considering diversity and rate of change through time utilizing phylogenies as a framework.
Shape Type
The PCA depicting shape type showed a high degree of overlap (Fig. 7). These general shape types may be superficially useful, but the high degree of overlap in morphospace suggests that they are not morphologically distinct. Shape type may be useful for species descriptions but should not be the only descriptor of morphology; additional skeletal details are required for a more accurate description of shape. As such, generalized shape types should not be included as characters in phylogenetic analyses as they are not rooted in homology nor are there easily explained character transformations between types. This was expected, as a genus (e.g., Pentremites or Deltoblastus) may produce multiple shape types but have similar plate proportions. The important aspect is the character transformations of the individual skeletal elements that produce the overall shape (Sumrall and Waters Reference Sumrall and Waters2012). Utilizing this characteristic for analysis of the modified data from Foote (Reference Foote1991) was difficult, because this information (individual skeletal elements that produce overall shape) was not present in the initial dataset, and we did not have access to images of all specimens included. Therefore, we had to use secondary resources to identify shape type for as many specimens as possible. Unfortunately, we were unable to identify a shape type for 41 specimens. Both plots showed high degrees of overlap among shape types (Supplementary Material 5). This further suggests that shape type is a superficial way of describing blastoids and is not useful in taxonomic delineation.
Plate Circlet Ratio Separation
Our results demonstrate that the examination of individual skeletal elements and their proportions to one another are more useful for exploring what is driving the general shape descriptions. Specifically, the deltoid and radial plate circlets showed the most distinct patterns in morphospace occupation (Fig. 8G–L). Deltoid (or oral; see Sumrall and Waters Reference Sumrall and Waters2012) plates are unique in their variation in lateral view measurements. This is due to the variety of forms that deltoid plates take in some species such as Angioblastus, which has small deltoids restricted to the oral surface, or Nucleocrinus, which has incredibly elongated deltoids that make up most of the thecal shape. The deltoid plate ratios are seemingly driving morphospace separation on PC 1. This is noted in the trend of high to low d:h across PC 1. This makes sense, as the deltoid plates are critically important, because they generate the frame of the mouth in eublastoids and are homologous to other blastozoans via the UEH model defined by Sumrall and Waters (Reference Sumrall and Waters2012). Additionally, the radial plate circlets are of interest, as this circlet encases the feeding structure. The radial plate circlet is also located between both the deltoid and basal plate circlets, and its growth is dependent on the other circlets. The radial plate ratios also seem to drive morphospace separation on PC 1, which is noted by a trend of high to low d:r values across PC 1. Additionally, our results agree with previous work (Foote Reference Foote1991) that vault:pelvis measurement is not indicative of any major trends in morphospace occupation on large scales but may be useful for intraspecific examination.
Conclusion
Three-dimensional geometric morphometrics provides a useful foundation to examine patterns in relation to morphological variation (Lawing and Polly Reference Lawing and Polly2009; Vitek Reference Vitek2013; Deline Reference Deline2021). The application of 3D GMM to the fossil record, specifically, is significant, as the incorporation of fossils allows for the analysis of macroevolutionary trends across time and space (Vitek Reference Vitek2013; Jones et al. Reference Jones, Benitez, Angielczyk and Pierce2018). Eublastoidea is an ideal candidate for 3D GMM due to its robust fossil history, homologous plate junctions, and body of previous studies (Foote Reference Foote1991; Deline Reference Deline2021).
Our findings suggest that previously ascribed shape “types” may be useful for general description but should not be used in formal analysis. Eublastoid ordinal assignments show conflicting results, which supports previous work indicating these are likely not monophyletic groupings. Fissiculata and Spiraculata occupy distinct regions in morphospace when PC 1 and PC 2 are compared. However, when compared with PC 3 and PC 4, the two orders occupy overlapping regions in morphospace. Some familial assignments occupy distinct regions in morphospace; these are the groups with unusual morphology that are likely valid families, including Nucleocrinidae and Eleutherocrinidae. Generally, our work suggests that there is an abundance of avenues for future studies evaluating the validity of eublastoid taxonomy. Our work supports previous work in showcasing a continual decrease in morphological variation through geologic time. There is a relationship between plate ratio and eublastoid family, specifically the deltoid and radial plate circlets, due to the extreme variation of the deltoid plates and the position of the radial plates (between the deltoid and basal plate circlets). Interestingly, invaginated basal plates were distributed across morphospace and did not show any clear trends, indicating that this feature is likely homoplastic and should be tested in future phylogenetic estimations. Spiraculates plot in a broad spread for each ratio; this showcases the wide variety in morphological forms attributed to this likely polyphyletic order.
From this work, it seems that the “statistical significance” is tied to the number of landmarks, but it is unclear where the threshold is, and it is well documented that ordination methods, such as PCA, are sensitive to input data (Foote Reference Foote1991; Deline Reference Deline2021). Future work should focus on several parameters: the number of individuals included, number of landmarks, and inclusion of semilandmarks.
This work expands the current body of research on extinct echinoderms by showcasing their utility in evaluating various parameters (e.g., time, measurements) in the framework of 3D GMM and provides a basis for visualizations that considers how disparity changes throughout time. It is critical that previous work be examined with updated methodologies, as the results of reanalyzing Foote (Reference Foote1991) produced different patterns than the initial results. Additionally, we identified outliers that may have skewed the initial results. The number of landmarks implemented will need to be more thoroughly examined, as there are some very apparent differences in morphospace occupation when comparing the same dataset with varying numbers of landmarks, but the overall patterns are largely the same. Generally, taxonomic assignments need to be more rigorously evaluated and considered in a quantitative framework, ensuring that the work is reproducible by others and the historical knowledge of loosely inferred relationships based on features can be evaluated.
Supplemental Material
Supplemental Material 1: All measurement data from side view analysis of eublastoid specimens. Measurements were all conducted in ImageJ and scaled in centimeters. Measurements were taken starting at the oral surface and moving aborally (toward the stem facet) in order to negate overlap of measurements. Each set of measurements was taken three times by two people (Person 1 and 2). Once this was complete, if there was disagreement or considerable variation between each Person's set of measurements then the specimen was measured again by Person 1. Any blank measurements were left intentionally as the specimen was unable to be properly landmarked or was determined to be an outlier in the initial analyses, leading to the removal of the specimen from the final dataset. Averages of lateral view measurements are provided on the second tab.
Supplemental Material 2: 64 .nts files from landmarking in geomorph that were then used for analysis in R. R script used for landmarking, reading in files, and running analyses also included.
Supplemental Material 3: Additional data related to various aspects of the specimens to use as a visualization tool alongside the resulting eublastoid morphospace occupation. This includes: catalog number, taxon name, taxonomic assignments, shape type, range, and generated ratios from data in Supplemental Material 1.
Supplemental Material 4: Procrustes ANOVA test results from the geomorph procD.lm function. This includes results from: our dataset, our dataset with subset landmarks, and the modified Foote (Reference Foote1991) dataset.
Supplemental Material 5: Data modified from Foote (Reference Foote1991) including: .nts files for landmarks coordinates, additional visualization data related to specimens, scripts used for data processing, and output files related to outliers found.
Supplemental Material 6: Parameters that were found to be statistically significant from the ANOVA test were also analyzed using a pairwise comparison to better elucidate what elements were driving the significance. This is split into three sections: full data set, subsest data set, and the modified Foote (Reference Foote1991) dataset. The value of 0 indicates complete similarity and increasing values represent two items being more dissimilar from one another.
Acknowledgments
This paper has benefited from comments on previous versions by: two anonymous reviewers, M. Foote, J. Crampton, S. Sheffield, M. Limbeck, A. Lam, A. Crane, G. Fabbri, R. Cory, and J. A. Wilson. A. Rountrey provided technical support with the University of Michigan Online Fossil Repository (UMORF), which hosts the virtual specimens, as well as from S. Ocon, who provided valuable assistance early on with R troubleshooting.
Competing Interests
The authors declare none.
Data Availability Statement
Data are available from the Dryad Digital Repository: https://doi.org/10.5061/dryad.0p2ngf26g.


 Open access