


1. Introduction
The impact of drops on solids occurs in many different contexts, in both natural phenomena and industrial applications (Yarin Reference Yarin2006; Josserand & Thoroddsen Reference Josserand and Thoroddsen2016). Most research has focused on understanding the ensuing splashing, spreading, coating or cooling of the solid. The entrapment of minute air bubbles under the drop is also of practical importance in additive manufacturing and device fabrication using micro-printing (Kwon et al. Reference Kwon, Yang, Martin, Castrejón-Garcia, Castrejón-Pita and Castrejón-Pita2016; Lohse Reference Lohse2022). The initial contact dynamics occurs on extremely fine length and time scales, which have become observable only in the last couple of decades with the latest advances in high-speed video technology. The viscous stress in the micrometre-thick air film, between the solid and the bottom of the drop, deforms the free surface to form a dimple, making the first contact between liquid and solid occur along a ring, thereby entrapping a small disc of air (Chandra & Avedisian Reference Chandra and Avedisian1991; Thoroddsen et al. Reference Thoroddsen, Etoh, Takehara, Ootsuka and Hatsuki2005). The dimple shape and thickness have been modelled successfully by neglecting the surface tension, drop viscosity and gravity (Mandre, Mani & Brenner Reference Mandre, Mani and Brenner2009; Hicks & Purvis Reference Hicks and Purvis2010). High-speed interferometry allows direct measurements of the thickness profile of the air disc, using multi-wavelength interferometry (de Ruiter et al. Reference de Ruiter, Oh, van den Ende and Mugele2012; Van der Veen et al. Reference Van der Veen, Tran, Lohse and Sun2012) or by tracking the individual fringes with time (Li & Thoroddsen Reference Li and Thoroddsen2015).
Surface roughness greatly affects the air entrapment, with nanoparticle-laden surface coatings stabilizing and pinning thin air films (Bird et al. Reference Bird, Dhiman, Kwon and Varanasi2013; Liu et al. Reference Liu, Moevius, Xu, Qian, Yeomans and Wang2014; Gauthier et al. Reference Gauthier, Symon, Clanet and Quéré2015; Gilet & Bourouiba Reference Gilet and Bourouiba2015; Langley et al. Reference Langley, Li, Vakarelski and Thoroddsen2018), or even pulls out polymer filaments from the rebounding drop (Yang et al. Reference Yang, Zhang, Shi, Al Julaih, Mishra, Di Fabrizio and Thoroddsen2022). The first contact of the drop is sensitive to the most minuscule roughness, revealed by a ring of micro-bubbles left behind when impacting on a glass of roughness as small as 10 nm. Only on an atomically smooth, freshly-cleaved mica surface are such micro-bubbles absent (Li, Vakarelski & Thoroddsen Reference Li, Vakarelski and Thoroddsen2015).
Low impact velocities can lead to the drop gliding on the air layer without early contact (Kolinski et al. Reference Kolinski, Rubinstein, Mandre, Brenner and Weitz2012). Large drop viscosity leads to similar gliding, with eventual contacts and entrapment of myriad micro-bubbles (Langley, Li & Thoroddsen Reference Langley, Li and Thoroddsen2017). The size of the central air disc depends strongly on the surrounding air pressure (Li et al. Reference Li, Langley, Tian, Hicks and Thoroddsen2017), and at high impact velocities, the gas exhibits strong compressibility (Mandre et al. Reference Mandre, Mani and Brenner2009; Mani, Mandre & Brenner Reference Mani, Mandre and Brenner2010; Liu, Tan & Xu Reference Liu, Tan and Xu2013; Li & Thoroddsen Reference Li and Thoroddsen2015).
While most impact experiments have used pure liquid drops, industrial applications often involve emulsions or suspensions. The early study of Prunet-Foch et al. (Reference Prunet-Foch, Legay, Vignes-Adler and Delmotte1998) took snapshots of the impact of oil emulsions used for cooling steel, seeing fine radial jets from the lamella. The impact of compound drops on solid surfaces has been studied for relatively large dispersed droplets (Liu et al. Reference Liu, Zhang, Gao, Lu and Ding2018; Zhang, Li & Thoroddsen Reference Zhang, Li and Thoroddsen2020; Blanken et al. Reference Blanken, Saleem, Thoraval and Antonini2021). Herein, the impacts use freshly formed emulsions, so the dispersed phase has not formed lenses on the free surface of the larger drop. The influence of these lenses on the wetting of the solid has been studied in Damak et al. (Reference Damak, de Ruiter, Panat and Varanasi2022). However, the first contact of drops of fine emulsions has not been studied.
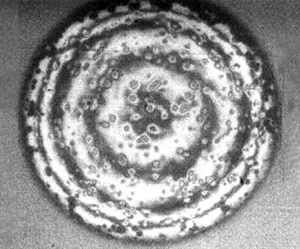
Herein, we present experiments showing the first contacts during the impact of a drop containing minute emulsion droplets. We use ultra-high-speed time-resolved interferometry to observe the early air layer thickness and local contact dynamics during the impact. This allows us to track the evolution of the interface shapes under the drop bottom, as well as capturing the emergence of the emulsion spikes. The bottom interface morphology becomes starkly different depending on the impact velocity, as is shown in figure 1. When the impact Weber number  $We_d = \rho R_b V^2/\sigma$ is less than a critical value $We_d^* \sim 15$, as in figure 1(a), the fringes are axisymmetric and similar to those for an impact of a pure water drop. In contrast for an impact Weber number above this $We_d^*$, local spikes appear and are clearly evident in the fringe pattern shown in figure 1(b), for $We_d = 40$.
Comparison of drop impacts below and above the critical Weber number  $We_d^* = \rho R_b V^2/\sigma \simeq 15$, for spike formation. Interferometric images of the central air disc under a drop impacting on a smooth solid glass surface, (a) for impact Weber number $We_d = 8$ ( $V=0.3\,\mathrm {m}\,\mathrm {s}^{-1}$), and (b) for $We_d = 40$ ( $V=0.8\,\mathrm {m}\,\mathrm {s}^{-1}$), showing numerous local spikes sticking out of the free surface. (c) Enlarged views show local fringes of two typical spikes formed by the oil droplets sticking out of the main drop. The spike dimensions are obtained from the local fringe data and are traced in the corresponding colours. The scale bars are $100\,\mathrm {\mu }$m long.

2. Experiments
2.1. Imaging set-up
We use an ultra-high-speed video camera (Kirana, Specialised Imaging, Tring, UK; see Crooks et al. Reference Crooks, Marsh, Turchetta, Taylor, Chan, Lahav and Fenigstein2013) for time-resolved imaging of the very early contact dynamics of an emulsion drop impacting on an ultra-smooth Corning 7980 fused silica wafer of surface roughness 5Å. A long-distance microscope (Leica Z16 APO) with adjustable magnification achieves a spatial resolution down to  $1.08\,\mathrm {\mu }$m px $^{-1}$. The impact is viewed from below through the Corning wafer, by using a bottom beam splitter, as sketched in figure 2. Each one of the 180 frames of the vertically mounted Kirana is illuminated by a separate pulsed diode-laser (SI-LUX640), with adjustable pulse duration between 80 and 200 ns, thereby freezing any fringe motions. The monochromatic red illumination has wavelength $\lambda = 640$ nm. The reflective interferometry gives a thickness resolution $\lambda /4=160$ nm between adjacent dark and bright fringes. The absolute thickness of the air film is obtained by tracking the fringes between numerous frames until the first contact with the solid, which gives the zero reference (Li & Thoroddsen Reference Li and Thoroddsen2015).
Schematic of the experiment set-up, with definitions of  $H^*$, $h_s$, $h_b$, $L$,
$L$,  $V$,
$V$,  $R_b$ and $r_s$. Here, $H^*$ is the centreline height measured from the solid surface when the drop base flattens, $h_s$ is the spike tip height and $h_b$ is the spike base height measured from the solid surface, $L$ is the radius of the air disc when the drop makes contact with the solid surface, $R_b$ is the radius of curvature of the drop before it starts to deform, and $r_c$ is the radius of curvature of the spike tip. Parameter $H_{d}$ (not shown here) is the impact height from which the drop is released. The image on the right shows how $R_b$ and $V$ are obtained from the side-view video camera, using a frame taken $10\,\mathrm {\mu }$s before impact. The white overlay is the drop outline $610\,\mathrm {\mu }$s before impact.

The axisymmetric drop shape and velocity at impact are obtained from the side view recorded at 100 kfps using a Phantom 2511 high-speed CMOS video camera. An image-generated trigger signal from the Phantom is used for timing the Kirana camera, at rates up to 7 million fps. This gives interframe times as small as 143 ns.
2.2. Emulsion drop
We use immiscible oil-in-water emulsions for the drops. The emulsions are generated using a tip sonicator (UP100H, Hielscher Ultrasonics) applied to a 5 wt % oil–water mixture. The emulsions are made in small volume batches of 80 ml with the addition of  $20\,\mathrm {\mu }$l of Tween-80 surfactant to stabilize the dispersed oil droplets. The addition of surfactant also ensures that the dispersed oil droplets ( $r_o = 200\unicode{x2013}700$ nm in size, as measured using a zeta-sizer, Malvern Zetasizer Nano ZS) remain inside the mother drop (at least for the first few minutes) and do not form lenses on the surface (see figure 10). However, after a sufficiently long waiting time (more than 15 min), the oil droplets can eventually form lenses on the surface. Hence all experiments described here are performed with fresh batches of emulsions. To avoid coalescence from shear when the emulsion is pushed through long tubing (Tian et al. Reference Tian, Yang, Thoroddsen and Elsaadawy2022), a small amount of emulsion was sucked from the batch into the release syringe, from which drops were subsequently released from the nozzle within a short amount of time ( ${\simeq }20$ s). A food dye ( $5\,\mathrm {\mu }$l, 0.0625 by volume) is added to the water to reduce secondary internal light reflections from the upper drop surface. A variety of other oils, over a range of different densities, were used in the preliminary experiment. Their properties are listed in table 1.
3. Results and discussion
3.1. Effects of  $\Delta \rho$ between the continuous and dispersed phases

The continuous phase of the drop is in all cases water with surfactant, while the composition of the dispersed minute droplets was varied in the exploratory early experiments. Figure 3(a) shows interference fringes during the impact of the various oil-in-water emulsion drops on an ultra-smooth glass surface, at relatively large  $V\simeq 2.3$ m s $^{-1}$, which is above the critical $We_d^*$. The snapshots are shown at the instant when the drop makes the outer ring contact with the solid surface. For different densities of oil, the initial contact dynamics exhibited are quite different. When a pure drop approaches the solid surface, it decelerates rapidly, and its bottom deforms into a dimple leading to the ring of contact, entrapping an air disc (Thoroddsen et al. Reference Thoroddsen, Etoh, Takehara, Ootsuka and Hatsuki2005; Van der Veen et al. Reference Van der Veen, Tran, Lohse and Sun2012). The resulting interferometric fringes are axisymmetric, as seen for the water drop (second from left in figure 3a). In contrast, the presence of nanodroplets near the free surface of the drop leads to formation of multiple localized spikes, distributed randomly in the azimuthal direction, as shown in figure 3(a) for the HT710, GPL100 and PP1 emulsions. However, the spikes form only when the density of the oil is larger than that of the water in the continuous phase, i.e. $\rho _{oil}>\rho _w$. This is most clearly evident by comparing the smooth fringes for HT510 where $\Delta \rho = \rho _{oil}-\rho _w\simeq -100$ kg m $^{-3}$ with the heavily spiked surface for HT710 where $\Delta \rho \simeq +100$ kg m $^{-3}$. Note that all other liquid properties for HT710 and HT510 are identical.
(a) Comparison of air film morphologies for impacts of drops of different emulsion types. Bottom views show the interference fringe patterns during the impact of different oil–water emulsions, with volume fraction  $\phi =0.05$, with a relatively large impact velocity $V \simeq 2.3\,\mathrm {m}\,\mathrm {s}^{-1}$. From left to right: the different dispersed phase oil droplets differ in density from the bulk phase by ${\Delta } \rho = \rho _{oil}- \rho _w \simeq -100, 0, 100, 680, 800$ kg m $^{-3}$. The water drop (second from left) has surfactant added and therefore the same surface tension as the other oily emulsion drops. Table 1 lists the properties of the different emulsions. (b) Impact of the HT710–water emulsion ( ${\Delta } \rho = 100$ kg m $^{-3}$) over a range of impact velocities, showing the transition from axisymmetric shapes to spike formation at the larger impact velocities. For the smallest $V$, the drop is greatly deformed by the pinch-off oscillations, showing a flat central spot. The bounded rectangles marked by brown stars indicate areas where the image has been interpolated to fill in for dead pixels. The scale bars are all $50\,\mathrm {\mu }$m long in (a,b).

The above observations raise the question of whether the oil droplets penetrate through the air–water free surface. To clarify this, we examined a pendent drop of the various oil-in-water emulsions using an inverted microscope with monochromatic light source (see figure 10). The interference pattern from drops pendent on a nozzle reveals that the nanodroplets are not at the surface but very close to it, with a thin water film stabilized by surfactant, and any dimple in the surface, to balance the weight, would be smaller than a pixel (Lhuissier & Villermaux Reference Lhuissier and Villermaux2012; Zhang et al. Reference Zhang, Li and Thoroddsen2020); in the absence of surfactant, the nanodroplets will contact the interface and form lenses immediately. In what follows, the experiments will focus exclusively on the HT710–water (5 % by volume) emulsion, which contains heavier dispersed-phase droplets with  $\Delta \rho = +100$ kg m $^{-3}$ and where local spiky contacts are consistently observed. Only figure 6(b) and § 3.3 include different liquids to assess the importance of viscous stress.
3.2. Drop deceleration and spike formation
Experiments are conducted for different impact release heights ranging from  $5$ to $700\,\mathrm {mm}$, with the corresponding impact velocities $V= 0.035$ to $3.44\,\mathrm {m}\,\mathrm {s}^{-1}$, and $We_d = 0.06$ to $680$. Figure 4 shows a few frames from high-speed video interferometry under the impacting emulsion drop, which allow us to determine the early deformation of the drop surface and the exact thickness of the air film as well as the spikes, as shown below, after introducing some theoretical considerations.
Frame sequence, from a 5 Mfps interferometric video clip, showing the early contact dynamics of an emulsion drop impacting on a smooth solid surface. Time  $t=0$ marks the instant when the drop makes the outer ring contact entrapping the air disc. The drop, with $R_b=2.30\,\mathrm {mm}$, approaches the surface with impact velocity $V= 1.39\,\mathrm {m}\,\mathrm {s}^{-1}$, giving $We_d =120$, $St =4.65\times 10^{-6}$ and $\varepsilon ^{-1} = 1.14$. The arrow points at a spike shown in a later figure. Some of the spikes make contact with the solid in the last image, forming black dots. See also movie 1 in supplementary material available at https://doi.org/10.1017/jfm.2024.1070.

The centreline thickness  $H^*_I$ of the air layer, when the drop begins to deform, is given by balancing the inertial pressure gradient in the drop with the lubricating gas pressure needed to drive out the radial air flow in the narrow gap (Mandre et al. Reference Mandre, Mani and Brenner2009; Hicks & Purvis Reference Hicks and Purvis2010; Mani et al. Reference Mani, Mandre and Brenner2010):
 \begin{equation} H^*_I\sim R_b\,St^{2/3}, \end{equation}
where the Stokes number is  $St=\mu _g/(\rho _l V R_b)$, with $\mu _g$ the dynamic viscosity of the air, and $\rho _l$ the density of the liquid. Note that $R_b$ is the bottom radius of curvature of the drop just before the impact. Figure 5(b) shows the measured height $H^*_I$, when the drop bottom starts to flatten, for different impact velocities $V$, expressed in terms of the Stokes number. The experimental values are compared with the incompressible theory $H^*_I$ (3.1), with a proportionality constant $4.3$, taken from figure 2(a) in Mandre et al. (Reference Mandre, Mani and Brenner2009). The prefactors can be expected to differ, as their theory is formulated for an impact in two dimensions. The empirical value 3.4 from the experiments of Li & Thoroddsen (Reference Li and Thoroddsen2015) fits slightly better.
(a) Typical spike shapes for the emulsion drop impacting on a solid surface with  $V=0.94\,\mathrm {m}\,\mathrm {s}^{-1}$, where $We_d = 43$, $St= 9.26 \times 10^{-6}$, $H^*_I= 2.54\,\mathrm {\mu }$m, and $\varepsilon ^{-1}= 0.42$. The cross symbol indicates the profile of the air layer entrapped under the mother drop, at the instant of first ring contact. Only a few of the spikes are shown protruding from the drop into the air layer, with instantaneous profiles extracted from the interferometric data. The different symbols are used for individual spikes to avoid confusion in their overlap regions. The nanodroplet spikes penetrate up to $2\,\mathrm {\mu }$m into the air film. (b) The measured centreline height $H^*_I$ as a function of Stokes number, for the HT710–water emulsion. The solid line is the theoretical prediction for the height of the air sheet (3.1) from Mani et al. (Reference Mani, Mandre and Brenner2010). (c) Dimensionless air film centreline thickness, as a function of compressibility parameter $\varepsilon$. The thinning of the air layer due to the compressibility agrees well with the empirical power law $4.2\varepsilon ^{0.40}$ obtained by Li & Thoroddsen (Reference Li and Thoroddsen2015), which is closer to the adiabatic compression than the isothermal one suggested in Mandre et al. (Reference Mandre, Mani and Brenner2009).

The compression of the gas is minimal at the lower impact velocities, but is present for the larger  $V$. This is characterized by the compressibility factor $\varepsilon$ derived by Mandre et al. (Reference Mandre, Mani and Brenner2009), which for $V=0.035\unicode{x2013}3.44$ m s $^{-1}$ is in the range $\varepsilon ^{-1} = (R_b \mu _g^{-1} V^7 \rho _{\ell }^4 )^{1/3}/P_o = 0.33\unicode{x2013}10$, where air compressibility becomes significant only when $\varepsilon ^{-1} > 2$, which here corresponds to $V > 1.8$ m s $^{-1}$. This velocity is well above that needed for the spike formation, as shown in figures 1 and 3. Compressibility therefore does not control the spike formation, even though it affects the overall air film thickness at higher impact velocities, as shown in figure 5(c).
Figure 5(a) shows a typical profile of an air disc entrapped under the impacting emulsion drop with some spikes included. The emulsion nanodroplet spikes penetrate here into the air film as far as  $s\simeq 2\,\mathrm {\mu }$m. The centreline thickness of the air layer at the instant of the ring contact $H^*\simeq 4.3\,\mathrm {\mu }$m. The deceleration phase duration, from start of deformation until the ring of contact, lasts only ${\simeq }15\,\mathrm {\mu }$s. The spikes make local contact with the surface subsequent to the ring of contact of the drop, as seen in the last image in figure 4. Considering the length of spikes extending to $s \simeq 2\,\mathrm {\mu }$m, the spikes could contact the solid before the ring, thereby affecting the air-entrapment patterns. However, the spikes should first appear where the surface deceleration is largest, i.e. in a region slightly away from the axis of symmetry.
The deceleration of the bottom of the drop can be calculated from the time rate of change in the measured thickness of the air disc, using the interferometry. The absolute reference thickness is obtained by tracking the fringes backwards in time from the first ring of contact, as in Li & Thoroddsen (Reference Li and Thoroddsen2015). Figures 7(a,b) show the shape evolution in time, as it approaches the solid, forms a dimple and makes contact. The centreline height  $H^*$ of the air film with time can be extracted from such profiles, as shown in figure 6(a). These curves show how the air layer becomes thinner with increasing $V$, and also the strong rebound of the dimple before the ring contact, at $t=0$. The slope of the curves gives the velocity, and the curvature gives the deceleration of the drop surface. Figures 7(c,d) show this deceleration as a function of radius from the axis of symmetry, for $V=1.39$ m s $^{-1}$. The deceleration starts at approximately $15\,\mathrm {\mu }$s before contact, and reaches the maximum $8 \times 10^5$ m s $^{-2}$ at $t=-5.6\,\mathrm {\mu }$s. This maximum occurs at $r\simeq 0.3L$, thereafter moving radially with the kink in the surface. The maximum corresponds approximately with the location of the first spikes in figure 4.
(a) The centreline height  $H^*$ of the decelerating drop as a function of dimensionless time ( $t/t_R$), where $t_R = (\rho R_b^3/\sigma )^{1/2}$ is the capillary time based on the bottom radius of curvature of the drop. (b) The spikes appear on the surface when the inertia $\Delta \rho \,H^{max}_{tt} R_b$ of the nanodroplet overcomes the surface tension force $\sigma /r_s$. We show a log-log plot of the normalized maximum deceleration at the centreline $\Delta \rho \,H^{max}_{tt} R_b/(\sigma /r_s)$ as a function of the drop impact Weber number $We_d= \rho V^2 R_b/ \sigma$. The horizontal dashed line corresponds to $\Delta \rho \,H^{max}_{tt} R_b/(\sigma /r_s)=1$. The filled symbols indicate spike formation, while open symbols show the absence of spikes.

Shape deformation and deceleration of an emulsion drop impacting a solid surface, corresponding to figure 4. The bottom radius of curvature of the drop is  $R_b=2.30$ mm, and the velocity of impact is $V=1.39$ m s $^{-1}$, where $St=4.65\times 10^{-6}$, $H^*_I= 1.95\,\mathrm {\mu }$m and $\varepsilon ^{-1} = 1.14$. The thickness of the air layer is determined by following the fringes between frames, which are recorded at 5 Mfps. (a) Deformation of the droplet close to the solid surface. The lines are spaced by 400 ns, and the bottom line shows when the bottom curvature inverts and the dimple starts to form. (b) Formation of the dimple, the radially moving kink, and the contact with the solid surface. (c,d) Deceleration $H_{tt}$ profiles in the radial direction $r$ for different times $t$, as the drop decelerates.

The spikes form due to larger inertia of the denser nanodroplets during the rapid deceleration. The maximum centreline deceleration scales as  $H^{max}_{tt}\sim V^2 / H_I^*$, and over our two orders of magnitude range in $V$, we scan over more than four orders in the rate of deceleration, as $H_I^*$ also decreases. For the largest impact velocity in the experiments, we measure $H^{max}_{tt} \simeq 200\,000\,g$, where $g = 9.81\,\mathrm {m}\,\mathrm {s}^{-2}$ is the acceleration due to gravity, showing its irrelevance during the very rapid deceleration. The spikes appear only above a critical impact velocity (see figure 3b), where $We_d^* \simeq 15$ for our $\Delta \rho = 100$ kg m $^{-3}$. To form spikes, their inertia has to overcome the surface tension at the tip of the spike $\sim \sigma /r_s$. Therefore, $We_{tt} = \Delta \rho \,H^{max}_{tt} R_b /(\sigma /r_s)> 1$ is needed for spike formation, as seen in figure 6(b). Figure 6(b) includes results for dispersed PP1 droplets in water, where for spikes to appear, $We_{tt} \simeq 1.5$, while for the HT710 droplets in water, $We_{tt} \simeq 2.0$.
3.3. The role of viscous stress
The minute dispersed droplets must also overcome the viscous stress from the surrounding water of the continuous phase, for spikes to form. The disperse Reynolds number of a nanodroplet, with diameter  $1\,\mathrm {\mu }$m and moving at 1 m s $^{-1}$, is $Re_d=D_dV_d/\nu \simeq 1$, i.e. near the Stokes regime. However, the extreme deceleration is sufficient to overcome the viscous stress. Keep in mind that only the droplets closest to the free surface have sufficient time to emerge out of the surface to form the spikes. This is clear by their random formation and the relatively large distance between spikes. For the 5 % volume fraction of the $1\,\mathrm {\mu }$m droplets, inside the $D=4$ mm main drop, their average distance is $2.2\,\mathrm {\mu }$m, while the distance between spikes is of the order of $25\,\mathrm {\mu }$m. Therefore, only the droplets close to the outer surface will penetrate the free surface. Furthermore, the droplets will not move at the spike velocity within stationary water, but rather pull the water along, greatly deforming the free surface, thereby reducing the relative velocity and the viscous stress, by the presence of the stress-free free surface. In other words, they will not feel the full Stokes drag. To verify the $We_{tt}$ scaling, we have included the values for the much heavier PP1 droplets inside a water drop in figure 6(b).
To further test the importance of the viscous stress, a few experiments were conducted while mixing 60 % glycerin into the continuous water phase, to increase its viscosity by a factor of 16 to  $\mu _{WG} = 0.016$ Pa s. This also reduces $\Delta \rho$, vs the PP1 droplets, as listed in table 1. Figure 6(b) shows that viscosity now slows down the droplet motions, requiring larger impact velocity with the critical $We^*_d$ for spike formation, increasing to 42. The spikes also do not extend as far out of the free surface as for water, as is shown in figure 12 for similar Weber numbers. To characterize the relative strength of the viscous stress, for impacts at $We_c$, we form a Reynolds number based on the deceleration for the inertia and relative velocity of the spikes $V_s$ for the drag, i.e. $Re_{droplet} = \Delta \rho \,H_{tt}^{max} r_s^2 / (\mu V_s )$. For HT710/water and PP1/water, we have $Re_{droplet} \simeq 0.36$ and 0.44, while for the PP1/GW60 it is an order of magnitude smaller, $Re_{droplet} \simeq 0.024$, indicating the much larger viscous stress, which becomes more important than the surface tension, thereby increasing $We_c$ to 42.
3.4. Spiky contacts with the solid
Once the spikes are formed, it is of interest whether they touch the glass substrate. Figure 8(a) shows the evolution of the shape of a spike, for impact velocity  $V=1.39$ m s $^{-1}$. Figure 8(b) shows that the tip of the spike slows down in the laboratory frame of the solid surface, without touching it. However, as the impact velocity increases, the air disc becomes thinner and the spike tips move faster, easily penetrating and touching the solid when $V \geq 2.70$ m s $^{-1}$. This contact occurs before the outer ring, as seen in figure 8(c). This early contact of spikes with the solid verifies our assumption that they protrude out of the drop surface, rather than being dimples, which would give the same fringe patterns.
(a) The spike profiles from reflective interferometry, shown relative to the drop surface, at times before ring contact  $t=-6.4,-5.6,-3.8,-2.6,-1.8,0\,\mathrm {\mu }$s, for impact velocity $V=1.39$ m s $^{-1}$ and $We_d = 120$. The spike is at distance $r=47\,\mathrm {\mu }$m from the axis of symmetry, as marked by an arrow in figure 4. The solid lines are Gaussian fits. (b) The corresponding spike tip trajectory ( $\circ$) and drop surface ( $\times$), now shown relative to the glass surface. (c) The spike base and tip evolution for different impact velocities, rescaled with the capillary time $t_s$ and $H^*_I$. Higher velocity impact $V=2.70\,\mathrm {m}\,\mathrm {s}^{-1}$ leads to a thinner air layer $H^*_I= 0.8\,\mathrm {\mu }$m and $\varepsilon ^{-1} =5.14$, where $R_b=2.08\,\mathrm {mm}$. The spike makes contact with the solid surface at $t/t_s = -0.4$, slightly before the ring of contact of the main drop. The spike also touches for $V=3.44$ m s $^{-1}$.

What stops the spikes from touching the solid? The capillary pullback of the tip can be estimated from Taylor–Culick velocity as  $V_{\sigma } = \sqrt {\sigma / (\rho r_s)}$ (Hoepffner & Paré Reference Hoepffner and Paré2013; Pierson et al. Reference Pierson, Magnaudet, Soares and Popinet2020). Figure 9(a) shows that the spike tips are brought to rest for the lower impact velocities – the time is here normalized by the capillary-inertial time scale for the spike $t_s=\sqrt {\rho r_s^3/\sigma }$. A local Weber number $We_s =\rho h_{tt} r_s^2 /\sigma$ is a measure of the momentum compared to the surface tension force. Here, $h_{tt}$ is the maximum deceleration of spikes approaching the solid surface. The spikes make an early contact when the $We_s>2$ (see figure 9b).
(a) Dimensionless spike tip velocity ( $v_s/V_\sigma )$ as a function of dimensionless time $t/t_s$, evaluated from numerical derivatives of the polynomial fits in figure 8(c). The crosses indicate contact of the spike with the solid. (b) The local spike Weber number $We_s$ as a function of impact velocity $V$. The filled symbols indicate when the spikes contact the solid surface prior to the ring of contact.

Bottom view of pendent droplets from an inverted reflection confocal microscope (monochromatic light with wavelength  $\lambda = 488$ nm): (a) pure deionized water; (b) HT710–water (with surfactant Tween 80 added); (c) HT710–water (no surfactant).

In addition to the pullback by surface tension, when the tip of the spike approaches the solid, it will also feel extra lubrication pressure from the air, now on a much smaller length scale than for the original drop. Based on the theory of Mandre et al. (Reference Mandre, Mani and Brenner2009),  $H_I^* \simeq 3.4r_s\, St_{s}^{2/3}$ for $r_s \simeq 5\,\mathrm {\mu }$m and $v_s=2.05$ and 2.67 m s $^{-1}$; the lubrication air layer thickness $H^*_I$ where this local lubrication pressure appears should be only 230 and 195 nm, respectively, which approaches the resolution of our interferometric measurements. Forming a spike-tip Weber number $We_{tip}= \rho {v}^2_s r_s/\sigma$, with the maximum $v_s$, we see that for contact, $V\geq 2.70$ m s $^{-1}$, which corresponds to $We_{tip} \geq 1$.
4. Conclusions
Herein we have used high-speed video for imaging the local contact dynamics of an emulsion drop impacting on an ultra-smooth solid surface. As for pure liquid drops, the impact dynamics is controlled by the rapid deceleration brought on by the lubrication pressure in the air layer under its centre. We measure free-surface deceleration at the bottom of the drop as high as  $2 \times 10^6$ m s $^{-2}$. The density difference between the minute dispersed-phase oil droplets and the continuous water phase makes the two respond to the deceleration differently. If the oil is denser, here $\Delta \rho = \rho _{oil} - \rho _{w} = +100$ kg m $^{-3}$, then the fine droplets promote the formation of spikes that emerge from the drop surface. This occurs at a threshold impact velocity corresponding to $We_d \simeq 15$ and $St^{-1} \geq 6.923\times 10^4$. This transition occurs at a low impact velocity $V\sim 0.52$ m s $^{-1}$, where $\varepsilon ^{-1} \simeq 0.106$, and air compressibility is not significant. Figure 6(b) shows that $\Delta \rho \, H^{max}_{tt} r_s R_b/\sigma \simeq 1$ separates impacts with and without spike formation. For larger impact velocities ( $We_d\geq 430$), the spikes can make early local contacts before the outer ring contact. This occurs when the capillary pullback cannot overcome the large inertia of the spike tips. For larger $We_d$, the thinner air layer as well as the larger inertia favours these early local contacts of the spikes.
Supplementary material
A supplementary movie is available at https://doi.org/10.1017/jfm.2024.1070.
Acknowledgements
This study was supported by King Abdullah University of Science and Technology (KAUST) under grant nos URF/1/2621-01-01 and BAS/1/1352-01-01.
Declaration of interests
The authors report no conflict of interest.
Appendix A. Properties of the different oil-in-water emulsions
A variety of oils with a wide range of densities are used with a water–Tween 80 mixture.
Table 1 lists the various physical properties of these liquids.
Summary of liquid properties.

Appendix B. Interfaces of various drops
The bases of different pendent drops are viewed using an inverted Zeiss LSM 880 confocal microscope system (reflection mode, using a monochromatic light source of wavelength  $\lambda = 488$ nm with resolution down to $140$ nm laterally and $400$ nm axially). The interface of a pure water drop is clear and appears uniform without any patches (figure 10a). With the addition of surfactant (Tween 80), the emulsion oil droplets (HT710) remain inside the mother water drop and appear as diffraction-limited flickering dots (figure 10b). These oil droplets are ${\lesssim }0.5\,\mathrm {\mu }$m from the surface of the mother water drop. In contrast, in the absence of surfactant, the same emulsion drop appears patchy as the oil droplets form lenses on the water–air interface (figure 10c).
The time evolution of the minute-sized dispersed PP1 droplets inside a pendent drop of the viscous 60 % glycerin/water continuous phase is observed through an inverted microscope in figure 11. The interface is initially pristine, but with time, the minuscule droplets appear on the surface and form lenses at longer times. In contrast with HT710, where the diffraction-limited flickering appears almost immediately, at approximately half a minute, here for PP1/GW60 their first appearance took nearly  $3$ minutes. To be consistent, as in HT710, drops are released within a short time ${\simeq }20$ s. This leads to less pronounced spikes in PP1/GW60. However, in the case of PP1/water, spikes are well defined and larger with multiple fringes. A comparison of spiky air layers under similar impact conditions $(We_d \simeq 40)$ of PP1/water and PP1/GW60 is shown in figure 12.
Bottom views of a pendent droplet of PP1/GW60 emulsion through an inverted microscope.

Comparison of air layer morphologies under similar impact conditions:  $We_d\simeq 40$ for both PP1 in GW60 and PP1 in water.


 Open access