

Iodine deficiency is an important preventable cause of brain damage worldwide and remains a global health concern( Reference Andersson, Karumbunathan and Zimmermann 1 , 2 ). Switzerland implemented a model salt iodisation programme in 1922. Despite this long-standing programme and about 90 % household coverage with iodised salt, national surveys done in 1999, 2004, 2009 and 2015 (M Andersson, unpublished results) have suggested adequate iodine intakes in school-aged children but borderline inadequate iodine intakes in pregnant and breast-feeding mothers, weaning infants and women of reproductive age( Reference Andersson, Aeberli and Wüst 3 – Reference Zimmermann, Aeberli and Torresani 6 ).
Although iodised salt is the main iodine source in the Swiss diet, contributing to about 50 % of intake, milk and dairy products are also important sources, contributing to about 30–40 % of intake( 4 , Reference Haldimann, Bochud and Burnier 7 , Reference Haldimann, Alt and Blanc 8 ). In 2008, the Swiss Federal Office of Public Health launched a nationwide strategy to reduce the dietary salt intake in the Swiss population to prevent CVD( 9 ). The aim of this programme is to reduce per capita daily salt consumption from 9 to 5 g; thus, iodine intake from iodised salt could substantially decrease and the iodine contribution from milk and dairy products may become more important.
However, the iodine concentration in milk and dairy products varies widely, making them an unpredictable and unreliable source of dietary iodine( Reference Flachowsky, Franke and Meyer 10 ). In Switzerland, median milk iodine concentrations (MIC) in fresh milk reported from 1997 to 2012 ranged between 24 µg/kg (measured in summer) and 116 µg/kg (winter)( 4 ). The main influences on MIC are thought to be the iodine intake of the cows producing the milk and the level of iodine antagonists, for example thiocyanates, in the cows’ diet. However, because the diets of dairy cows are usually not optimised to meet their iodine requirements, their dietary iodine intake may fluctuate according to changing feeding practices (grazing season v. indoor season, type and amount for compound and mineral feeds, way of providing iodised salt) and type of farming (organic or conventional). Other potentially important sources of iodine in milk are residues from iodine-containing sanitisers used for teat dipping and cleaning of dairying machinery, as well as milk storage containers( Reference Flachowsky, Franke and Meyer 10 ).
European regulations, also implemented in Switzerland, allow a maximal dietary iodine level of 5 mg/kg diet (88 % DM) for dairy cows( 11 ); this threshold exceeds the estimated daily physiological requirement( 12 ) and the recommended intake level for dairy cows of 0·5 mg/kg DM( 13 ) by more than 10-fold. In Switzerland, the proportion of roughages, which includes most fresh, ensiled and dried forages that are rich in fibre and low in net energy, is traditionally high compared with other industrialised countries and there are governmental programmes promoting this practice( Reference Schmid and Lanz 14 ). The roughage diet is complemented by concentrates, which are fed to meet the cow’s additional requirements for protein and energy depending on the milk yield, as well as salt and vitamin/mineral mixtures( 13 , 15 ). Concentrates, as well as mineral mixtures and salts, may be fortified with calcium iodate (hexahydrate and anhydrous), potassium iodide or sodium iodide( 16 ). In Swiss organic farming, the maximum supplementation level for dairy cows is set at 0·6 mg iodine per kg DM diet, but can be adjusted up to 1·8 mg/kg DM diet if the diet is high in iodine antagonists. In addition, the proportion of concentrates in the diet must not exceed 10 % DM( Reference Bio 17 , Reference Schneider and Früh 18 ).
There are only limited data on the determinants of milk iodine in Swiss farming. If efforts to reduce salt intake in the Swiss population are successful, milk iodine is likely to become an increasingly important source of dietary iodine in the population. This may also be true for other countries in Europe. Thus, our research aims were to: (1) measure MIC of cows fed a forage-based diet from organic and conventional farms throughout Switzerland and the bordering Italian region of Aosta valley over four consecutive seasons; (2) measure iodine concentration in different feed components used; and using these data (3) identify the main determinants of MIC.
Methods
Study design
We invited thirty-three conventional and organic farmers throughout Switzerland and in the Aosta valley (North-West Italy) to participate in the survey. We defined ‘organic farms’ as those adhering to Bio Suisse standards( 19 ) and ‘conventional farms’ as those producing according to integrated production (IP Suisse)( 20 ) or those showing proof of ecological performance( 21 ). We primarily selected cantonal agricultural schools because they often implement detailed diet planning for their teaching activities. The inclusion criteria were as follows: (1) being a member of a Swiss breeding organisation (e.g. Swissherdbook, Holstein Schweiz, Braunvieh Schweiz) and willing to provide the monthly milk quality control reports; and (2) able to provide good quality information about feeding practices. Moreover, we aimed to pair organic and conventional farms geographically, to reduce regional differences in comparisons between these two types of farms. We made an initial visit to the farms in June 2015 and we collected milk samples at four subsequent sampling time points over four consecutive seasons (September, December, March and June), starting in September 2015 and ending in June 2016.
During the initial farm visit, we (1) delivered the sampling material and instructed farmers on the sampling methods; (2) collected all diet components including tap water samples; and (3) administered a general questionnaire regarding farm characteristics, farming and feeding practices and the use of iodine-containing disinfectants. This questionnaire was re-administered at each subsequent sampling time point to capture potential seasonal changes, and additional feed samples were collected if the diet components had changed. Farmers collected bulk milk samples in duplicate (50 ml) in the months September, December, March and June on the day of the monthly milk control by the respective breeding organisation. They sent them to the Laboratory of Human Nutrition at ETH Zurich by regular mail on the day of sampling. If the milk was used for cheese production (i.e. two daily milk collections), morning and evening bulk milks were collected and measured separately. Reports of milk production controls by the breeding organisations provided additional information on the characterisation of the herd at each sampling time point, such as number of animals, number of primiparous cows, days in milk, milk yield and milk composition (fat, protein and cell counts). The two farms in the Aosta valley were not affiliated to a Swiss breeding organisation and did not provide this information.
We classified the diet components into four groups: (1) forages (majority farm-grown) and concentrate ingredients (farm-grown or purchased) such as cereals, oilseed meals, other food industry by-products, tubers and roots; (2) commercial concentrates; (3) mineral mixtures; and (4) salts. We combined forages and concentrate ingredients because we presumed they were not fortified, thus low in iodine. These were estimated at the herd level. For each farm, we calculated two diet compositional plans, representing a typical summer and a typical winter diet, based on the provided information from the respective questionnaires. Missing information, such as nutrient composition used to formulate diets (energy, protein, minerals), originates from reference values( 22 ) and quantities were estimated in order to meet or exceed feeding recommendations for dairy cows according to Agroscope( 13 ). For the consumption of mineral mixtures and salts, if provided ad libitum, we estimated 100 and 50 g/d and cow, respectively( 13 ). To further investigate the effect of different ad libitum salt consumption levels, we tested three scenarios for salt intake, namely 30, 50 and 70 g/d and cow. For the iodine analysis of forages and concentrate ingredients, the individual components (e.g. hay, silages, grass, soyabean meal, wheat) were mixed according to the proportions specified in the diet compositional plan with the exception of seven farms, where we measured all components individually. Missing samples of forages or concentrate ingredients were computationally replaced by iodine measurements of mixtures of single feed types (e.g. wheat, maize, soyabean meal, potatoes, sugar beet pulp silage) from several farms. We measured the iodine concentration in all mixtures of forages and concentrate ingredients (summer and winter), commercial concentrates, mineral mixtures, a subset of salt samples, water samples and milk. For commercial concentrates and mineral mixtures where no samples were available, we either used the iodine concentration as stated on the product information sheet or we estimated an approximate native content from measured, non-fortified samples.
Chemical analyses
First, we freeze-dried the forages (Martin Christ). We milled all feed samples using a centrifugal mill equipped with a 0·5 or 0·25 mm sieve (Retsch) unless already in powder form when collected. We stored feed samples in 50-, 100-, 250- and 500-ml polyethylene low-density bottles with screw caps (Semadeni), milk samples in 50-ml polypropylene (PP) tubes with screw caps (Sarstedt) and water samples in 15-ml PP-tubes with screw caps (Semadeni) at −20°C until analysis. In addition, we analysed all feed samples for DM by drying at 105 °C for 12 h.
In commercial concentrates, mineral mixtures and milk samples, we measured iodine after alkaline extraction with tetramethylammonium hydroxide (TMAH) (Tama pure-AA TMAH 25 %; Tama) by multicollector inductively coupled plasma MS (ICP-MS) (Neptune; Thermo Finnigan) using isotope dilution analysis with 129I (Standard Reference Material 4949C; National Institute of Standards and Technology) and a tellurium standard (AppliChem) for mass bias correction based on the ICP-MS 129I isotope ratio method as described by Dold et al. ( Reference Dold, Baumgartner and Zeder 23 ). For samples of commercial concentrates and mineral mixtures, we diluted 250 mg of sample in 5 ml of ultrapure water (>18·2 MΩ×cm) before the addition of TMAH. We prepared and measured all samples in triplicate. Because of the high iodine content of the minerals, these samples had to be diluted ten times before analysis. We monitored the accuracy of the analyses using a laboratory feed control sample in each run of analysis, both at its native iodine content and spiked with 4 µg/g iodine. The recovery of the added 4 µg/g iodine for quality control of the commercial concentrate and mineral mixture samples was 3599 (sd 304) ng/g. Milk samples were defrosted overnight, thoroughly mixed using a homogeniser (Polytron PT 1200 E; Kinematica) and vortexed before analysis. We used certified whole milk powder (Standard Reference Material 1549a; National Institute of Standards and Technology) as control material with each run of analysis, and measured values (3275 (sd 118) ng/g) were within acceptable ranges as specified by the manufacturer. The mean intra-assay CV was 2·54 % and the mean inter-assay CV was 2·79 %.
We measured the iodine content in salt and water samples using the Pino modification( Reference Pino, Fang and Braverman 24 ) of the Sandell–Kolthoff reaction. We used laboratory-specific control samples (70 (sd 3) µg/l and 190 (sd 5) µg/l) for quality control.
We determined iodine in the mixtures of forages and concentrate ingredients by ICP-MS (Thermo Element-XR; Thermo Fisher Scientific) after microwave-induced combustion with a modified procedure from Mesko et al. ( Reference Mesko, Mello and Bizzi 25 ). We used the microwave reaction system Multiwave PRO (Anton Paar), which was equipped with eight high-pressure quartz vessels Q80 (NXQ80), commercial combustion quartz holders (Anton Paar) and a Rotor 8 NXQ80 (Anton Paar). We weighed between 150 and 200 mg of the sample and prepared pellets using a hydraulic press set at 5 tons (PerkinElmer). After placing the sample pellet on the quartz holder, we added 50 µl of a 1·5 mol/l ammonium nitrate solution (Grogg Chemie) directly onto the pellet for ignition and immerged the holder into the quartz vessel, which was previously filled with 6 ml of absorbing solution (50 mmol/l ammonium carbonate solution; Grogg Chemie). O2 was pressurised at 1800 kPa and the microwave programme was 1400 W for 15 min (sample combustion and reflux of absorbing solution). We transferred the absorption solution to 30-ml PP-tubes (Sarstedt) and diluted with ultrapure water up to 30 ml. A volume of 25 µl of a spike solution containing 1·37 mg of 129I in 0·01 mol/l sodium hydroxide (Suprapur®; Merck) was added. Then, 10 ml of this solution were transferred to a 10-ml PP-tube (Sarstedt) for the ICP-MS measurement. We used certified hay powder (Standard Reference Material BCR-129; Institute for Reference Materials and Measurement) for quality control. The certified hay powder was 173 (sd 6) ng/g and always within the acceptable range. The mean intra-assay CV was 2·59 % and the mean inter-assay CV was 3·63 %. After every ten samples, the 127I/129I-spike ratio was re-measured in a solution of 34 ng/ml 129I in 10 mmol/l ammonium carbonate. We applied the updated ratios in subsequent calculations. The interference of 129Xe on the 129I signal had to be corrected in the calculations. The correction factor 1·248, calculated from the natural abundances of 131Xe and 129Xe, was applied to correct the measured 129I signals:
 $$^{{129}} {\rm I}_{{{\rm corrected}}} \, {\equals}\, {}^{{129}}{\rm I}_{{{\rm measured}}} -1\! \cdot \! 248\, \times\! \: {}^{{131}}{\rm Xe}_{{{\rm measured}}} $$
For the iodine isotope ratio measurement (R) in the isotope-diluted sample, it follows from Equation (1) that the unknown mass of 127I in the forages and concentrate ingredients, expressed as $m_{{127_{{I, F}} }} $
, can be calculated as follows:
$m_{{127_{{I, F}} }} $
, can be calculated as follows:
 $$\eqalignno{m_{{127_{{{\rm I},{\rm }F}} }} \, &{\equals}\, m_{{129_{{\rm I}} }} \times \left[ {R\left( {{{{}_{{}}^{{127}} {\rm I}_{{{\rm measured}}} } \over {{}_{{}}^{{129}} {\rm I}_{{{\rm corrected}}} }}} \right)_{{{\rm Sample}}} {\minus}R\left( {{{{}_{{}}^{{127}} {\rm I}_{{{\rm measured}}} } \over {{}_{{}}^{{129}} {\rm I}_{{{\rm corrected}}} }}} \right)_{{{\rm Spike}}} } \right] \cr &\ \,\times {{M_{{127}} } \over {M_{{129}} }} \times {1 \over {m_{s} }}$$
with $m_{{129_{{\rm I}} }} $
representing the mass of added 129I, R representing the 127I/129I intensity ratios of the sample and spike solution, respectively, and m
s
the sample mass. M
127 and M
129 represent the molar masses of 127I and 129I, respectively.
$m_{{129_{{\rm I}} }} $
representing the mass of added 129I, R representing the 127I/129I intensity ratios of the sample and spike solution, respectively, and m
s
the sample mass. M
127 and M
129 represent the molar masses of 127I and 129I, respectively.
Statistical analyses
We performed data analyses on Excel (Microsoft Office Professional Plus 2016) and R statistical programming environment (version 3.3.1; R Core Team 2016, R Foundation for Statistical Computing) by using packages nlme ( Reference Pinheiro, Bates and DebRoy 26 ), multcomp ( Reference Hothorn, Bretz and Westfall 27 ) and lsmeans ( Reference Lenth 28 ). We used Powerpoint (Microsoft Office Professional Plus 2016) and the package ggplot2 ( Reference Wickham 29 ) in R for figures and graphs.
All iodine concentrations in mineral mixtures and commercial concentrates are the mean of independent triplicate analyses. Each milk, salt and water iodine value is the mean of independent duplicate analyses. If milk samples were collected twice daily, we weighted 55 % morning with 45 % evening bulk milk. Each iodine value of forages and concentrate ingredients is either the mean of an independent duplicate or a single analysis. Outliers (i.e. values below the 0·3rd percentile or above the 99·7th percentile) were not excluded from the analyses, as we felt the sample size was not large enough to identify outliers with certainty. We assessed data normality by testing the distribution of continuous variables against a normal distribution using the Shapiro–Wilk W-test. When departing significantly from normality (W<0·97), we applied logarithmic, square root or negative reciprocal, to correct upward skew, and chose the transformation that scored highest W and by visual inspection of the frequency plots. If none of the transformations was satisfactory, we used the untransformed data for the analysis and carefully evaluated the models’ residuals by using the Tukey–Anscombe plot. Values in the text and in tables are represented as mean values and standard deviations for normally distributed data and medians and min–max for log-transformed and non-normal data.
We used mixed-effects model (MEM) analysis to evaluate the effect of the following independent variables on MIC: (1) season (September, December, March, June); (2) farm type (organic, conventional); (3) region (Jura, Midland, Prealps/Alps); (4) dietary iodine (total iodine, forages/concentrate ingredients iodine, commercial concentrates iodine, mineral mixtures iodine and salts iodine); (5) herd characteristics (number of lactating animals, percentage of primiparous cows, herd’s average days in milk, herd’s average milk yield); (6) milk composition (fat content, protein content, cell count); (7) type of production (industry milk, cheese, milk from alpine grazing); (8) other farm characteristics (farm size, farm altitude); and (9) teat dipping with iodine-containing disinfectants (teat dipping applied before or after milking or both v. no teat dipping). At first, we tested the effect of each variable on MIC in univariate models. We integrated farm type as a covariate to control for the variability in MIC caused by farm type. Any between-farm differences in MIC caused by factors that were not surveyed but that could affect the analysis were controlled for by defining the farm identification number as a random variable in all models. We used Tukey’s correction or pairs method with least-squares means for comparison between levels. Last, variables that were identified as significant predictors of MIC (P<0·05) or showed a trend (P<0·1) in the univariate MEM were tested together in multivariate MEM. To achieve the minimal adequate model, we applied a stepwise backward deletion procedure by discarding variables that, when removed, did not significantly increase model deviance. We checked multicollinearity and excluded variables with estimates >0·3. Models’ residuals were visually inspected using the Tukey–Anscombe plot. For each model we provide the Bayesian information criterion for model over-parameterisation, the Akaike information criterion and, indicatively, the adjusted R 2 from regression analysis for goodness of the fit( Reference Vrieze 30 ). The level of significance was set at P<0·05.
Results
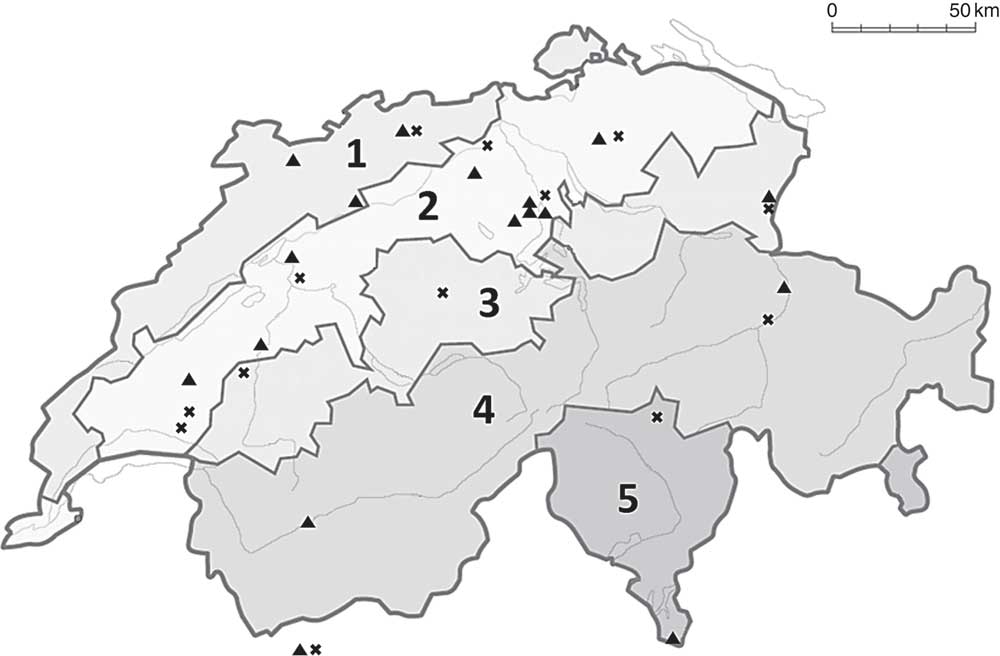
In total, twelve organic and twenty conventional farms completed the study (Fig. 1). One organic farm dropped out after the first sampling period and was excluded from the data analysis. Brown Swiss (n 15), Holstein (n 10), Red Holstein (n 11) and Simmental (n 10) were the most common breeds. However, twenty-four of the thirty-two farmers owned two to four different breeds including Kiwicross, Montbéliard, Simmental, Jersey, Aosta Red Pied and Aosta Chestnut. Because of the varying and multiple breed frequency across farms, we were unable to investigate the effect of breed on MIC. At the initial farm visit, we collected 309 feed samples (including forages and concentrate ingredients, commercial concentrates, mineral mixtures and salts), thirty-one water samples and completed thirty-two questionnaires (Table 1). We investigated the effect of teat cleaning/disinfection only after milking, as the number of observations of the application of iodine-containing disinfectants before milking were too few. We calculated sixty-two diet compositional plans (missing feeding information from one farm) and measured the iodine content of forty-four forages/concentrate ingredient mixtures, thirty-nine single forages and concentrate ingredients, ninety-one commercial concentrates, fifty-four mineral mixtures, a subset of eleven salt samples and twenty-nine water samples. Over the four consecutive seasons, we collected and measured the iodine concentration of 288 raw milk duplicate samples (either as morning, evening or pooled milk). After pooling of results from samples provided as morning and evening milk samples separately, we obtained 126 milk iodine values that were used for statistical analysis.
Map of Switzerland showing the locations of the thirty-two participating farms (×, organic; ▲, conventional). Regions are divided into (1) Jura, (2) Midland, (3) Prealps, (4) Alps and (5) south side of the Alps. For the analysis of the regional effect on milk iodine concentration, we clustered areas (3), (4) and (5) and the two farms in Aosta valley, Italy, as Alpine area (adapted from Luster et al.( Reference Luster, Zimmermann and Frey 31 )).
Characteristics of thirty-two participating farms (Percentages and numbers; mean values and standard deviations; medians and minimum–maximum)
* Proof of ecological performance.
† Integrated production.
‡ More than one option per farm possible.
§ n 3 farms only December supplied by hand.
|| n 4 farms not all seasons.
¶ Non-iodised or iodised at 30–100 parts per million.
** n 9 iodised.
†† n 1 iodised.
‡‡ Values are from four observations from each farm.
§§ n 21.
Iodine concentrations of forages and concentrate ingredients, commercial concentrates, mineral mixtures, salts and water
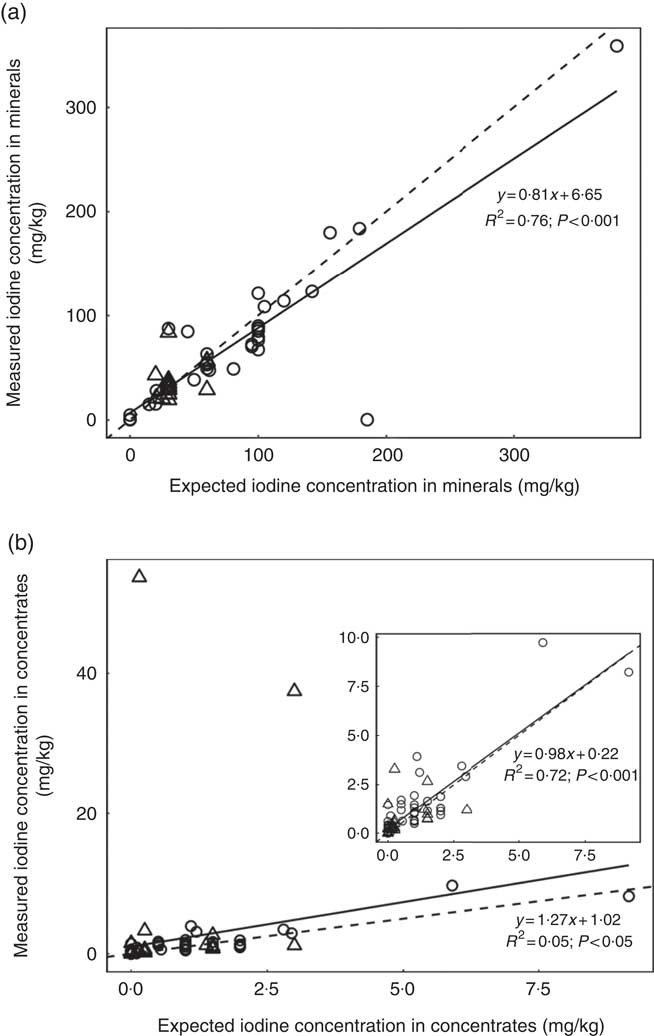
A subsample of thirty-nine forages and concentrate ingredients samples provided data on the native iodine concentration of the major components in the cows’ diet (Table 2). They ranged from 31 µg/kg DM in soyabean meal to 460 µg/kg DM in lucerne hay and was low compared with the iodine concentration of the fortified commercial concentrates, minerals and salts (Table 3). The iodine concentration of mineral mixtures agreed with the iodine content as stated on the labels (R 2=0·76, P<0·001; Fig. 2(a)). The iodine concentration of commercial concentrates poorly correlated with the labelled iodine concentration when including all sampled feeds (R 2=0·05, P<0·05; Fig. 2(b)). However, excluding two extreme outliers from organic farms improved the correlation (R 2=0·72, P<0·001; Fig. 2(b)). The median iodine concentration of salts fortified with 30 mg/kg (n 4) and unfortified salts (n 3) was 32·8 (min–max 32·5–34·7) and 0·0 (min–max 0·0–6·4) mg/kg, respectively. Iodine concentration of three iodised salt blocks (labelled as 100 mg iodine/kg) was highly variable with concentrations of 0·1, 25·6 and 74·3 mg/kg. Iodine concentrations of all water samples were below the detection limit of 6 µg/l.
(a) Linear regression analysis of expected (as labelled) v. measured mean iodine concentration from triplicate measurement in mineral mixture samples, by farm type (organic (![]() ) v. conventional (
) v. conventional (![]() )) (n 52). (b) Linear regression analysis of expected (as labelled) v. measured iodine concentration in commercial concentrates in triplicate measurement, by farm type (n 86). The inset graph shows the linear regression when two extreme outliers from two organic farms were excluded. For both feed categories, regression (
)) (n 52). (b) Linear regression analysis of expected (as labelled) v. measured iodine concentration in commercial concentrates in triplicate measurement, by farm type (n 86). The inset graph shows the linear regression when two extreme outliers from two organic farms were excluded. For both feed categories, regression (![]() ) and identity (
) and identity (![]() ) lines are shown. Expected values correspond to the declared iodine content on the labelling for mineral mixtures, but not for commercial concentrates. Iodine was analysed by inductively coupled plasma MS after extraction with tetramethylammonium hydroxide(
Reference Dold, Baumgartner and Zeder
23
).
) lines are shown. Expected values correspond to the declared iodine content on the labelling for mineral mixtures, but not for commercial concentrates. Iodine was analysed by inductively coupled plasma MS after extraction with tetramethylammonium hydroxide(
Reference Dold, Baumgartner and Zeder
23
).
Iodine content of selected forages and concentrate ingredients per kg DMFootnote * (Medians and minimum–maximum)
* Determination of iodine by inductively coupled plasma MS (ICP-MS) and oxygen combustion( Reference Mesko, Mello and Bizzi 25 ).
† Data provided by the measurement of one mixture; n is the number of samples in the mixture.
Estimated daily feed DM intake (n 62 diet compositional plans; summer and winter diets), feed iodine concentration and estimated daily iodine intake by diet component type, for all farms and by farm type (Mean values and standard deviations; medians and minimum–maximum)
MEM, mixed-effects model.
* Measured by inductively coupled plasma MS after O2 combustion( Reference Mesko, Mello and Bizzi 25 ).
† Measured by ICP-MS after tetramethylammonium hydroxide (TMAH) digestion( Reference Dold, Baumgartner and Zeder 23 ).
‡ Commercial concentrates significantly higher than salt (P<0·05). MEM with Tukey’s comparison for all pairwise comparisons.
§ Mineral mixtures significantly higher than forages and concentrate ingredients, commercial concentrates and salt (P<0·001). MEM with Tukey’s comparison for all pairwise comparisons.
|| Measured by Sandell–Kolthoff reaction with spectrophotometric detection( Reference Pino, Fang and Braverman 24 ); only a subset was measured.
¶ Mineral mixtures significantly higher than forages and concentrate ingredients, commercial concentrates and salt (P<0·001). MEM with least-square means (pairs method) for pairwise comparisons.
** Mineral mixtures significantly higher than salt (P<0·01) and significantly lower compared with mineral mixtures of conventional farms (P<0·001). MEM with least-square means (pairs method) for pairwise comparisons.
Iodine content of all feed components and contribution to cows’ iodine supply
Estimated daily iodine intakes through all four feed categories varied (Table 3). Overall, the estimated iodine intakes through mineral mixtures were higher compared with forages and concentrate ingredients (β=1·10, P<0·001), commercial concentrates (β=1·00, P<0·001) and salts (β=1·45, P<0·001). Also, the estimated iodine intakes through commercial concentrates were significantly higher (β=0·45, P<0·05) than salt. In conventional farms, iodine intakes from mineral mixtures were higher compared with forages and concentrate ingredients (β=1·52, P<0·001), commercial concentrates (β=1·45, P<0·001) and salts (β=1·81, P<0·001). In organic farms, however, iodine intakes from mineral mixtures were higher compared with salts (β=0·84, P=0·007) but not compared with forages and concentrate ingredients (β=0·40, P=0·63) and commercial concentrates (β=0·24, P=0·97). Overall, the estimated iodine intake through the mineral mixtures was significantly higher in conventional than organic farms (β=1·19, P<0·001).
Milk iodine concentration and its influencing factors
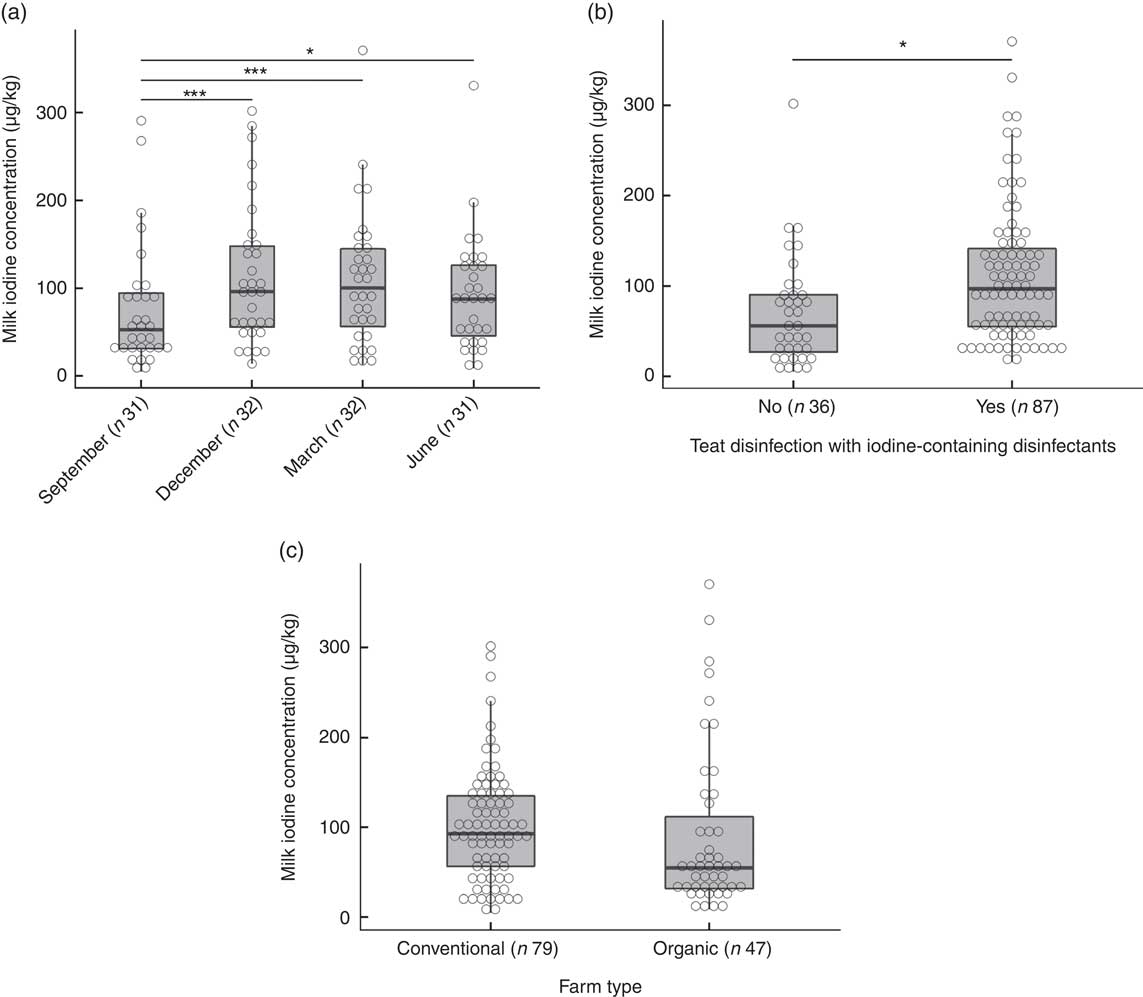
The overall median MIC was 87 (min–max 5–371) µg/l. On the basis of a P-value <0·1, we identified predictors of MIC as daily milk yield (β=0·19, P=0·097), number of animals (β=0·23, P=0·051), farm altitude (β=−0·24, P=0·090) and fat content of milk (β=0·22, P=0·005) (online Supplementary Table S1). By season, MIC was lowest in September (53 (min–max 5–291) µg/l) and highest in March (101 (min–max 13–371) µg/l) (P<0·001; Fig. 3(a)). The MIC from farms using iodine-containing teat disinfectants was 97 (min–max 16–371) µg/l, significantly higher than from farms not applying iodine-containing disinfection, where MIC was 56 (min–max 5–302) µg/l (β=0·87, P=0·002; Fig. 3(b)). MIC did not differ significantly between organic (55 (min–max 9–371) µg/l) and conventional (93 (min–max 5–302) µg/l) milk (β=−0·34, P=0·24; Fig. 3(c)), but mean daily milk yield of the farm (P<0·02) and farm altitude (P<0·05) both significantly differed between organic and conventional farming. Therefore, the variable farm type was also included in the multivariate MEM, despite not being a significant predictor of MIC in the univariate MEM. When tested in multivariate analysis, significant predictors of MIC were farm type (conventional farms higher than organic farms, β=−0·64, P<0·05), season (September lower than December/March, β=−0·68/−0·60, P<0·002) and disinfection with iodine-containing disinfectants (β=0·68, P<0·05) (Table 4). Variables not reported as significant independent predictors of MIC did not have explanatory power in the model or were removed to avoid collinearity. The regression model explained 24 % of the variability of MIC.
(a) Milk iodine concentration (MIC) by season. Level comparison by mixed-effect model analysis with Tukey’s correction with logarithmic-transformed MIC as a dependent variable; fixed factors were season and farm type, and the random factor was farm identification number (* P=0·05, *** P<0·001). (b) MIC by teat disinfection with iodine-containing disinfectants. Mixed-effect model analysis with logarithmic-transformed MIC as dependent variable; fixed factors were teat disinfection and farm type, and the random factor was farm identification number (* P<0·01). (c) MIC by farm type. Mixed-effect model analysis with logarithmic-transformed MIC as dependent variable; the fixed factor was farm type and the random factor was farm identification number. No significant difference.
Independent relations between milk iodine and potential predictors in milk samples from thirty-two farms in Switzerland by mixed-effect model analysisFootnote * (β-Coefficients with their standard errors)
* Model used log(milk iodine) as the continuous dependent variable; fixed factors were potential continuous or categorical predictors, and the random factor was the farm identification number. df=107; Akaike information criterion=280; Bayesian information criterion=305; multicollinearity coefficient <0·224; adjusted R 2=0·24; variables that were removed from the model were milk yield (at P=0·94), altitude of farm (at P=0·26) and log(milk fat content) (at P=0·49).
Discussion
The main finding of this study is that significant predictors of MIC collected in thirty-two farms throughout Switzerland and in Aosta valley were farm type, season and teat disinfection with iodine-containing disinfectants. Compared with results from previous studies in Switzerland, our year-round MIC (median 87 µg/l) was higher than in 1988/1989 (49 µg/l)( Reference Schällibaum 32 ) but lower than results from 1997–2012 (median 91–110 µg/l)( 4 , Reference Haldimann, Alt and Blanc 8 ) and lower than results from Swiss milk purchased at retail outlets (median 109 µg/l)( Reference Walther, Wechsler and Schlegel 33 ). Our year-round median MIC is also lower than that reported from other European countries where MIC is generally >100 µg/l( Reference Rey-Crespo, Miranda and López-Alonso 34 – Reference Nystrom, Brantsaeter and Erlund 38 ). On average, daily consumption of one glass (0·3 litres) of Swiss milk would contribute about 26 µg iodine – that is about 17 % of the recommended daily iodine allowance/intake for adults( 39 , 40 ).
Several studies have reported an effect of farm type on MIC, with consistently lower MIC in organic compared with conventional milk( Reference Rey-Crespo, Miranda and López-Alonso 34 , Reference Köhler, Fechner and Leiterer 36 , Reference Bath and Rayman 41 – Reference Rasmussen, Larsen and Ovesen 43 ). A recent study on Swiss Ultra-High-Temperature milk collected in two large-scale dairy producers found a 56 % higher median concentration in conventional compared with organic milk (111 v. 71 µg/l)( Reference Walther, Wechsler and Schlegel 33 ). In our study, the median MIC from conventional farms was about 69 % higher than that from organic farms, but this difference was not significant. Unlike in the multivariate MEM, this difference was not significant in the univariate analysis, most likely owing to the large variation of MIC at the farm level, which probably is reduced when milk from numerous producers is mixed in large-scale dairy industries( 4 , Reference Rey-Crespo, Miranda and López-Alonso 34 ). The lower median MIC in organic farming is likely explained by the lower upper limits for dietary iodine content for feeding of dairy cows (0·6 mg/kg DM diet as compared with 5 mg/kg diet (88 % DM/kg) in conventional farming)( Reference Schneider and Früh 18 ). This is supported by our results showing lower estimated intakes and lower iodine concentrations in mineral mixtures from organic farms compared with conventional farms. Nevertheless, there may also be other contributing factors such as differences in teat disinfection or in the amount of iodine antagonists in feed( Reference Bath and Rayman 41 , Reference Średnicka-Tober, Barański and Seal 44 ).
In our data, season had a significant effect on MIC, with the lowest MIC found in September and the highest in March. This agrees with previous studies reporting higher MIC in the winter months (November to April) compared with the summer months (May to October)( Reference Dahl, Opsahl and Meltzer 42 , Reference Soriguer, Gutierrez-Repiso and Gonzalez-Romero 45 – Reference Crnkić 55 ). Walther et al.( Reference Walther, Wechsler and Schlegel 33 ) reported highest and lowest MIC for organic (99 v. 42 µg/l; difference of 57 µg/l) and conventional (145 v. 75 µg/l; difference of 70 µg/l) UHT retail milk in January and August to October, respectively. Flachowsky et al.( Reference Flachowsky, Franke and Meyer 10 ) suggested that higher mineral supplementation and lower iodine antagonist contents in the winter diet contribute to higher MIC during winter. This hypothesis is supported by the calving pattern in Switzerland, with most calves born in winter (November to January) and the least calves born in summer (June to August)( 56 ). This implies higher milk yields in the winter season, with the maximal milk yield 1–2 months after calving, and thus intake of feed and minerals needs to increase during that period to meet their requirements( 13 ). Our data support this, as we found highest and lowest milk yields in March (26·3 (sd 4·3) kg/d) and September (23·6 (sd 5·7) kg/d), respectively. However, in our results, increased iodine intakes were not reflected in an increased MIC, likely owing to dilution because of increased milk yield. The effect of milk yield on MIC is uncertain( Reference Franke, Bruhn and Osland 57 , Reference Falkenberg, Tenhagen and Forderung 58 ), and recent studies from Moschini et al.( Reference Moschini, Battaglia and Beone 59 ) and Battaglia et al.( Reference Battaglia, Moschini and Giuberti 60 ) did not find a significant effect of milk yield on MIC.
Similar to our data, previous studies have reported an increased MIC when teat disinfectants were applied( Reference Falkenberg, Tenhagen and Forderung 58 , Reference Rasmussen, Galton and Petersson 61 – Reference Borucki Castro, Berthiaume and Robichaud 64 ). In our study, the median iodine content of the iodine-containing disinfectants collected on all farms was 5·0 (range 2·5–7·7) mg/ml, which was associated with about 73 % higher median MIC and an increase of about 41 µg/l in median MIC. This agrees with previous studies reporting an increase of 20 to 88 µg/l in median MIC as the median iodine content of iodine-containing disinfectants increased from 2·5 to 5 mg/ml( Reference Falkenberg, Tenhagen and Forderung 58 , Reference Rasmussen, Galton and Petersson 61 – Reference Borucki Castro, Berthiaume and Robichaud 64 ). During teat dipping, it is unclear whether iodine is absorbed through the skin and subsequently excreted into milk( Reference Conrad and Hemken 65 ) and/or the teat surface is contaminated causing iodine transfer into the milk during the milking process( Reference Rasmussen, Galton and Petersson 61 ).
It should be noted that about 75 % of the variability in MIC remained unexplained by our multivariate model. This is likely because of unmeasured and/or unrecognised sources of variance. In our heterogeneous sample, calculated iodine intake did not predict MIC, in contrast with previous studies that assessed iodine intake quantitatively( Reference Moschini, Battaglia and Beone 59 , Reference Battaglia, Moschini and Giuberti 60 , Reference Borucki Castro, Berthiaume and Robichaud 64 , Reference Franke, Meyer and Wagner 66 – Reference Borucki Castro, Berthiaume and Laffey 71 ). The iodine content of our forage and concentrate ingredient samples was similar to those reported by Schöne et al.( Reference Schone, Sporl and Leiterer 72 ), although we did not use the same sample preparation procedure (TMAH digestion v. oxygen combustion). There is a large range of iodine fortification levels in concentrates and mineral mixtures found on the Swiss market, similar to the situation in Germany( Reference Schone, Sporl and Leiterer 72 ). Moreover, daily mineral and concentrate feed quantities vary considerably, particularly for milk-yield-dependent supply of concentrates, leading to extremely variable iodine supplies to the cows. Also, we found a high variation in our triplicate analysis of iodine in the commercial concentrates and mineral mixtures, most likely owing to inhomogeneity of the iodine dispersal in these feed categories. Despite this, our results suggest that mineral mixtures are the most important iodine contributors in the cows’ diet in both conventional and organic farming.
Our study has several limitations. Although we directly analysed most feed types for their iodine content, it was difficult to estimate feed intake. Our method for investigating feeding practices (a questionnaire) delivered qualitative or semi-quantitative data. Semi-quantitative methods of intake assessment have their limitations, in particular when there is uncertainty in the definition of amounts offered from the different feed categories and/or in the concentration of iodine in the different feed categories. Offered amounts were often described as ‘a handful’, ‘ad libitum’, ‘milk yield dependent’, ‘weather dependent’, ‘hours grazing on pasture’ or by rough estimations (e.g. ‘30 % grass silage, 20 % maize silage, 50 % hay’). Especially for salt, intake data were poorly reported (ad libitum). Despite information on annual purchases, it was not possible to estimate the actual intake differentiated by season. When estimations based on the information given in the questionnaire were not possible, we calculated the diet according to energy and protein recommendations for dairy cows( 13 , 22 ) according to their milk yield. This was not possible when farmers fed concentrates that were either farm-own or products from small-scale producers; thus where information on energy and protein content was missing. Moreover, estimated diets probably do not completely reflect actual intakes because they are based on the assumption of an ‘optimised diet’, whereas in reality other factors such as market price or availability are decisive. We quantitatively assessed the iodine concentration in mixtures of all available forages and concentrate ingredients, commercial concentrates, mineral mixtures and salts, but for missing samples we relied on the concentration as stated on the label, which may not always be accurate as shown in our comparison of measured v. expected (i.e. labelled) iodine concentration, especially in concentrates. Feed samples were collected before milk collection had started, and thus we could not directly measure feed samples from the actual diet when MIC was assessed. Moreover, diet compositional plans were set up for the months of December and June only and not for the months of September and March. This decision was based on the larger number of feed samples and the higher quality of information about feeding practices gathered in December and June than in the transition periods in September and March, which strongly depend on weather conditions, feed availability and remaining conserved forage stocks from the previous season. Further, we did not include any measurement of iodine antagonists in feed samples in our study, which might influence MIC( Reference Franke, Meyer and Wagner 66 , Reference Franke, Meyer and Wagner 73 , Reference Troan, Dahl and Meltzer 74 ). These limitations likely explain the lack of a significant association between cows’ iodine intake and MIC in our study.
Our study has several strengths. To our knowledge, this is the first study in Switzerland where representative feed samples were collected to assess iodine sources in feeding practice. Moreover, this is also the first study that collected bulk milk samples at the farm level to assess variation of MIC within and across farms, as most previous studies reported MIC in processed milk available on the market (thus fat standardised, heat treated, homogenised, etc.). We measured all samples by ICP-MS, a sensitive and accurate method to determine iodine in complex sample matrices. We chose farms distributed throughout Switzerland to get a representative coverage, and farm selection was stratified by the most common farm type practices. We collaborated with agricultural schools and members of breeding organisations to increase compliance and data quality.
In conclusion, our findings clearly show the wide variation of MIC from farms throughout Switzerland and the neighbouring Aosta valley. Higher MIC is found in milk from conventional farms, in winter milk and when iodine-containing teat disinfectants are applied after milking. Mineral mixtures are the most important diet components contributing to dietary iodine, but their contribution varies across seasons. Our findings highlight the challenges of reducing variation in MIC to allow milk to become a more predictable iodine source in the Swiss diet across seasons. To achieve this, several measures could be considered, including the following: (1) a desirable iodine intake level should be defined and implemented considering the level of iodine antagonists in the diet (achievable if the concentration of iodine and iodine antagonists in feed is adequately characterised); (2) for targeted supplementation of iodine into the dairy cow’s diet, focus could be on setting levels of iodine in only one dietary source – this could be mineral mixtures or salt, and amounts offered could be defined (no ad libitum feeding); and (3) teat disinfection could be done using non-iodine-containing products.
Acknowledgements
The authors thank all farmers for their participation and cooperation. Special thanks go to Andreas Simonett for his assistance during the study implementation. The authors are grateful to Rafael Aubert, Hanna von Siebenthal and Ivraina Brändle for their assistance in laboratory analysis.
This study was funded by Swiss Federal Food Safety and Veterinary Office (grant no. 5.15.01).
I. H.-A., M. B. Z., M. Haldimann, P. S., J. B. and M. K. formulated the research question and designed the study; O. L. V., E. M. and J. B. carried out the field work and collected the samples; O. L. V., M. Haldimann, M. Hulmann and A. K. were responsible for laboratory analyses; O. L. V. and V. G. performed statistical analysis and O. L. V. wrote the first draft of the manuscript; all authors reviewed the manuscript.
The authors declare that there are no conflicts of interest.
Supplementary material
For supplementary material/s referred to in this article, please visit https://doi.org/10.1017/S0007114517003798


