


Various measures of obesity, particularly BMI and waist circumference (WC), have been used independently or combined with other criteria to define the metabolic syndrome (MetS). In 2001, WC was included in the MetS definition by the National Cholesterol Education Program (NCEP) Adult Treatment Panel III (ATP III)(1). Hence, the wide use of WC makes it currently the reference measurement in defining the central obesity component of MetS. MetS is a clustering of several cardiometabolic risk factors which are linked to increased all-cause and cardiovascular mortality(Reference Ford2–Reference Wassink, van der Graaf and Olijhoek5). Recently, studies suggested that while BMI and WC are both easily measurable indices of obesity, percentage total body fat may better predict MetS and future health risk. Percentage total body fat has frequently been used as the gold standard in receiver-operating characteristic (ROC) curve analyses examining the predictive value of various anthropometric measurements among children or adolescents(Reference Lazarus, Baur and Webb6–Reference Mei, Grummer-Strawn and Pietrobelli9) and among adults(Reference Taylor, Keil and Gold10, Reference Evans, Rowe and Racette11). Thus, we need larger databases with total body fat(Reference Svendsen12).
It is still debatable whether percentage total body fat mass (TtFM) is more valuable than the widely used anthropometric measures, particularly WC(Reference Richelsen and Pedersen13–Reference Bray, Jablonski and Fujimoto27), and virtually unknown whether percentage regional body fat among US adults has a higher value in predicting MetS and its components than WC or TtFM. Moreover, no previous studies have investigated appropriate cut-off points for those regional body fat indices that would have the highest predictive value of MetS and which cut-off point of WC best defines central obesity for each sociodemographic category such as sex–race groups(1, Reference Wang, Rimm and Stampfer28–Reference Zhu, Wang and Shen30).
The present study is one of few in a growing literature(Reference Tulloch-Reid, Williams and Looker17, Reference De Lorenzo, Mukherjee and Kadziola19, Reference Rissanen, Hamalainen and Vanninen21, Reference von Eyben, Mouritsen and Holm22, Reference Lee, Lee and Kim26) to examine the predictive value of dual-energy X-ray absorptiometry (DEXA) body fat indices as opposed to anthropometric indices for MetS and its components using baseline data collected in a large cohort study. A number of other recent studies have measured percentage body fat (total and regional) with other methods such as bioelectrical impedence and computed tomography and compared their predictive value to anthropometric measures against MetS components(Reference Tai, Ho and Fok14–Reference Warne, Charles and Hanson16, Reference Nagaya, Yoshida and Takahashi18, Reference Wannamethee, Shaper and Morris23–Reference Hyun, Kim and Jang25, Reference Bray, Jablonski and Fujimoto27). In the present study, we systematically compared the values of BMI and various regional body fat indices to WC and TtFM in predicting MetS and its components across sexes and sex–ethnic groups. Second, we estimated related cut-off points with optimal sensitivity and specificity for MetS, and assessed the association between various adiposity measures and MetS by estimating adjusted odds ratios.
Materials and methods
Setting and participants
The Healthy Aging in Neighborhoods of Diversity Across the Life Span (HANDLS) is a prospective longitudinal study of a baseline representative sample of African-Americans and whites between 30 and 64 years of age. Participants were recruited as a fixed cohort by household screenings from an area probability sample of twelve census segments in Baltimore City. Data were collected in two separate phases. Phase 1 consisted of screening, recruitment, a household interview (assessing sociodemographic information and physiological and psychological chronic exposure) and a first 24 h recall; phase 2 consisted of an in-depth examination in a mobile medical research vehicle (MRV) and included a second dietary assessment with a 24 h recall, psychometric measures (e.g. for depressive symptoms and cognitive function), anthropometric and body composition measurements.
Out of the targeted 4000 adults, 3724 were selected in the household survey at phase 1 from 2004 to 2008 (sample 1). Thus far, 2436 (65·4 %) had complete baseline phase 2 examinations by 2008 (sample 2). However, only about 53·2 % (sample 3A; n 1981) of those had complete DEXA scans. Moreover, complete metabolic outcome data were found among 88 % to 98 % of sample 3, depending on the metabolic parameter being measured. Sample 3B with complete data on DEXA scans and MetS (definition 1) components (n 1819) differed from the remainder of sample 1, by being older (mean age 48·2 (sd 9·1) v. 47·2 (sd 9·5) years, respectively; P < 0·05 based on t test), having a significantly higher proportion of women (57·0 % v. 52·6 %; P < 0·05 based on χ 2 test) and a larger proportion with poverty:income ratio (PIR) <125 % (47·0 % v. 35·8 %; P < 0·05 based on χ 2 test).
Body composition analysis
DEXA was performed using a Lunar DPX-IQ analyser (Lunar Corp., Madison, WI, USA). The total body scan measures both body composition and bone mineral density and yields results for the total body as well as specific regions. Several measures were of interest, including TtFM (total body fat mass as a percentage of total body mass) and body fat mass in specific regions, i.e. arms (AmFM), legs (LgFM), trunk (TrFM), ribs (RbFM), pelvis (PlFM) and spine (SpFM), as a percentage of total fat mass (TFM).
Anthropometric indices
Body weight and standing height were measured directly on a calibrated scale with a calibrated ruler set parallel to the top of the participant’s head. BMI (=weight/height2, kg/m2) was calculated for each subject. WC (in cm) was measured using a tape measure starting from the hip bone and wrapping around the waist at the level of the navel.
Metabolic outcome variables
Systolic and diastolic blood pressure
The average of right and left sitting blood pressure values was taken to represent each of systolic and diastolic blood pressure levels (SBP and DBP, respectively) for the present analyses. Blood pressure was measured non-invasively using the brachial artery auscultation method with an aneroid manometer, a stethoscope and an inflatable cuff.
Other metabolic risk factors
Following an overnight fast (generally at least 8 h, but for most 12 h), blood samples were drawn from an antecubital vein. Blood was collected first thing after consenting, after which breakfast was served. Total cholesterol (TC), HDL-cholesterol (HDL-C), TAG, uric acid and glucose were assessed using a spectrophotometer (AU5400 Immuno Chemistry Analyser; Olympus, Center Valley, PA, USA). Fasting serum insulin was analysed with a standard immunoassay test (Immulite® 2000 Immunoassay System; Siemens/DPC, Eschborn, Germany) and C-reactive protein (CRP) was analysed with an immunoturbidimeter (Nephelometer II; Siemens/Behring, Minsk, Republic of Belarus). Homeostasis model assessment–insulin resistance (HOMA-IR)(Reference Wallace, Levy and Matthews31) was computed, with a cut-off point of 2·61 reflecting high insulin resistance level as suggested elsewhere(Reference Matthews, Hosker and Rudenski32). Cut-offs for hyperuricaemia were >7 mg/dl in men and >6 mg/dl in women(33), while elevated CRP was defined as >2·11 mg/l(Reference Ridker, Cushman and Stampfer34).
Metabolic syndrome
Central obesity was defined as WC ≥ 102 cm (40 in.) for men or WC ≥ 88 cm (35 in.) for women(35). This is one of five components of the NCEP ATP III (2001) main definition of MetS (definition 1). Using this definition, MetS was positive when three or more of the following criteria screened as positive: (i) WC ≥ 102 cm for men or WC ≥ 88 cm for women; (ii) SBP/DBP ≥ 130/85 mmHg; (iii) fasting glucose ≥110 mg/dl; (iv) TAG ≥ 150 mg/dl; (v) HDL-C < 40 mg/dl for men or HDL-C < 50 mg/dl for women.
A second MetS definition (definition 2; the main one in our analysis) used criteria (ii), (iii) and (iv) of the first definition with a cut-off point of two or more instead of three or more positive components. This was done to produce a measure of MetS that is independent of adiposity. This definition was used for the target outcome in the ROC curve analysis, as was done by at least one previous study(Reference Bosy-Westphal, Geisler and Onur24).
Covariates
Other covariates were considered mainly as potential confounders or effect modifiers. These included age group, sex, race (white v. African-American), marital status (married v. unmarried), smoking status (ever v. never smoker) and self-reported use of medications for diabetes, hyperlipidaemia and hypertension diagnosis, based on the coding of the 9th edition of the International Statistical Classification of Diseases and Related Health Problems (ICD-9)(36). Socio-economic status was measured by completed years of education (categorized as: <high school, 0–8 years; high school, (9–12 years); >high school, 13+ years) and PIR (categorized as: below poverty, PIR < 125 %; above poverty, PIR ≥ 125 %).
Statistical analysis
The STATA statistical software package release 10·0 (Stata Corporation, College Station, TX, USA) was used to analyse data. All analyses were stratified by sex, and some by sex and race. We used the two-sided independent-samples t test to compare means across dichotomous variables (i.e. men v. women, white men v. African-American men, white women v. African-American women); the one-way ANOVA test for comparison of means across multilevel variables followed by post hoc analysis adjusted for multiple comparisons using the Bonferroni technique; and Peason’s χ 2 test to examine differences in proportions across categorical variables.
Sensitivity (proportion of true positives, i.e. proportion of cases correctly identified as meeting the conditions of MetS) and specificity (proportion of true negatives, i.e. proportion of non-cases correctly identified as not meeting MetS) were calculated to evaluate the accuracy of body fat and anthropometric indices in depicting MetS (definition 2), by creating ROC curves(Reference Albeck and Borgesen37, Reference Soreide38). The ROC curve is a graphical plot of sensitivity v. (1 - specificity) for a binary classifier system as its discrimination threshold is varied. The area beneath each ROC curve (AUC), a measure that is independent of classifier cut-off points, can range between 0 and 1 and be computed with its 95 % confidence interval.
An index positively associated with MetS would yield an AUC between 0·5 and 1·0. An AUC value of 0·7, for instance, has the following interpretation. If we randomly select from the MetS+ and MetS− groups, the value of that particular adiposity index will be greater in the MetS+ group 70 % of the time. Raw continuous values for each adiposity index were used for that purpose. When two or more empirical curves are constructed based on tests performed on the same individuals, statistical analysis on differences between curves must take into account the correlated nature of the data. To this end, a non-parametric approach to the analysis of areas under correlated ROC curves was performed, by using the theory on generalized U-statistics to generate an estimated covariance matrix(Reference DeLong, DeLong and Clarke-Pearson39). Additionally, P values were adjusted for multiple comparisons using the Bonferroni technique(Reference DeLong, DeLong and Clarke-Pearson39). The two reference measurements considered were WC (as it is incorporated in the original NCEP ATP III definition of MetS)(1) and TtFM (as it was suggested by various studies to be superior to other measures)(Reference Svendsen12). To ensure that all other test measures (e.g. BMI, DEXA measures) were positively associated with WC and TtFM, correlation coefficients were estimated (see Appendix 1). Measures that correlated negatively with either WC or TtFM were entered into the ROC curve analysis as their negative value.
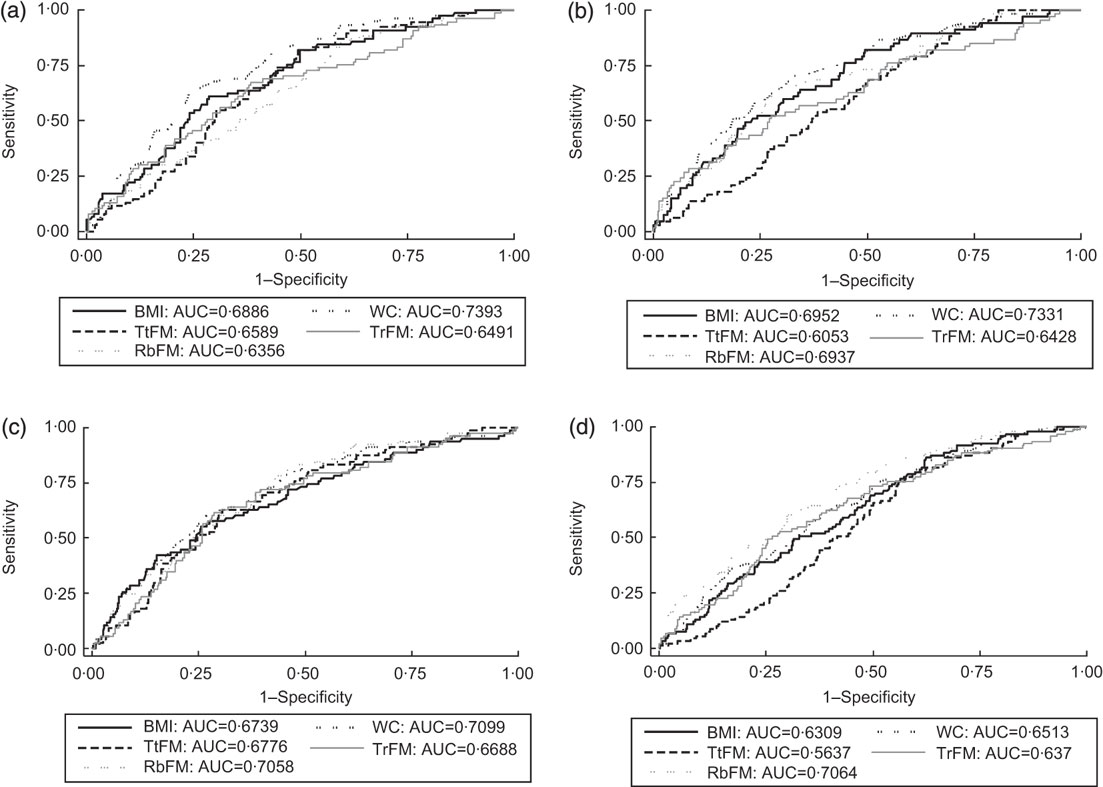
Optimal cut-off points for each adiposity index were derived from MetS (definition 2) ROC curve analysis using the highest sensitivity and specificity combination, corresponding to the smallest distance from the upper left-hand corner to the diagonal (see Fig. 1). Finally, using multivariate logistic regression analyses, binary adiposity indices (based on optimal cut-off points) as well as standardized Z-scores were modelled against MetS (definition 2). Following this analysis, a sensitivity analysis was conducted to examine the added value of DEXA measures over anthropometric measures, by combining multivariate logistic regression models with ROC curves. Changes in AUC between successive models of more than 10 % of the preceding model indicated appreciable added value. To this end, a series of three multiple logistic regression models was conducted per sex group to predict MetS (definition 2) with the following predictors: model 1, BMI plus WC; model 2, as model 1 plus all DEXA adiposity measures considered in previous analyses with a sex-specific cut-off point; model 3, as model 2 plus covariates. A type I error of 0·05 was considered in all analyses.
Receiver-operating characteristic (ROC) curves and areas under the ROC curves (AUC) for selected adiposity indices (WC, waist circumference; TtFM, percentage total body fat mass; RbFM, percentage rib fat mass; TrFM, percentage trunk fat mass) for the prediction of metabolic syndrome (definition 2, see text) across ethnic–sex groups: Healthy Aging in Neighborhoods of Diversity Across the Life Span (HANDLS) study. (a) White men: AUC BMI, TtFM and RbFM were significantly lower than those for WC. Taking TtFM as the reference measurement, WC had a significantly higher AUC. (b) White women: AUC for TtFM compared with WC was significantly lower, based on Bonferroni-corrected P value and taking WC as reference measurement. Both BMI and WC were superior to TtFM when taking the latter as reference measurement. (c) African-American men: all other AUC were not significantly different when taking WC and TtFM as reference measurement, respectively. (d) African-American women: AUC for TtFM compared with WC was significantly lower, based on Bonferroni-corrected P value and taking WC as reference measurement. WC, BMI and RbFM had better predictive value than TtFM, when TtFM was the reference measurement
Results
Characteristics of the study population
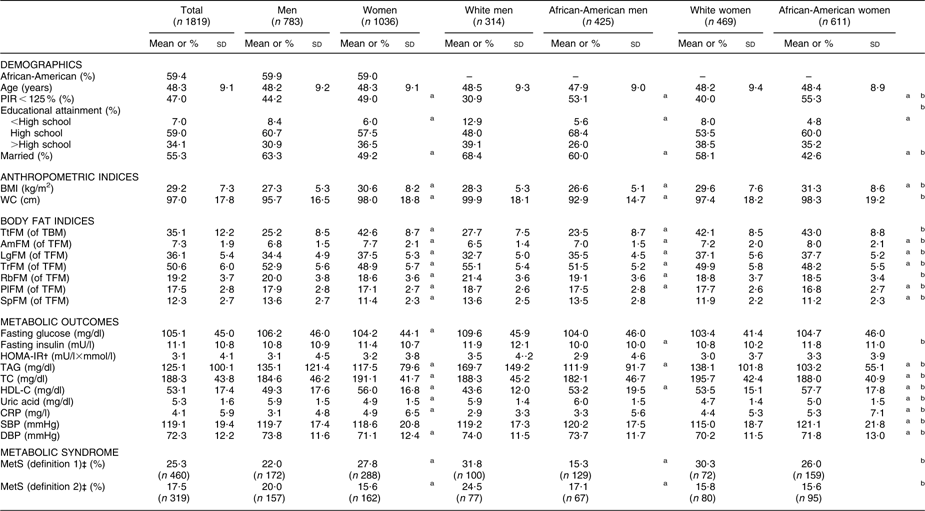
Study population characteristics are shown in Table 1. Men overall were more likely to be married compared with women, and whites more than African-Americans within each sex. PIR < 125 % proportions were significantly higher among women overall compared with men and higher among African-Americans compared with whites consistently for each sex. White men had the highest proportion in the >high school category and there was a wider racial gap among men (26·0 % v. 39·3 % in African-American v. white men) than among women (35·2 % v. 38·5 % in African-American v. white women). Mean BMI was highest among African-American women, while mean WC was highest among white men.
Study population characteristics (mean and standard deviation or percentage), by sex and by sex–race, among participants with complete data on DEXA scan measures and MetS (definition 1) components: HANDLS study
DEXA, dual-energy X-ray absorptiometry; MetS, metabolic syndrome; HANDLS, Healthy Aging in Neighborhoods of Diversity Across the Life Span; PIR, poverty:income ratio; WC, waist circumference; TtFM; percentage total body fat mass; TBM, total body mass; AmFM, percentage arm fat mass; TFM, total fat mass; LgFM, percentage leg fat mass; TrFM, percentage trunk fat mass; RbFM, percentage rib fat mass; PlFM, percentage pelvic fat mass; SpFM, percentage spine fat mass; HOMA-IR, homeostasis model assessment–insulin resistance; TC, total cholesterol; HDL-C, HDL cholesterol; CRP, C-reactive protein; SBP, systolic blood pressure; DBP, diastolic blood pressure.
aP < 0·05 for the null hypothesis that means or proportions are equal between sexes or between race groups within each sex (t test or χ 2 test).
bP < 0·05 for the null hypothesis that means or proportions are equal between sex–race groups, i.e. white men and African-American men, white women and African-American women (ANOVA test or χ 2 test).
†HOMA-IR is the product of the fasting values of glucose (G 0; expressed as mg/dl) and insulin (I 0, expressed as μU/ml), divided by a constant: I 0 × G 0/405.
‡Using definition 1, MetS was positive when three or more of the following criteria screened as positive. These criteria are derived from the National Cholesterol Education Program (NCEP) Adult Treatment Panel III (2001)(1). (i) Central obesity NCEP component: WC ≥ 102 cm for men and WC ≥ 88 cm for women; (ii) blood pressure NCEP component: SBP/DBP ≥ 130/85 mmHg; (iii) fasting glucose NCEP component: fasting glucose ≥ 110 mg/dl; (iv) dyslipidaemia–TAG NCEP component: TAG ≥ 150 mg/dl; (v) dyslipidaemia–HDL-C NCEP component: HDL-C < 40 mg/dl for men and HDL-C < 50 mg/dl for women. Using definition 2, MetS was positive when two or more of the preceding criteria screened positive excluding criteria (i) and (v).
Mean TtFM was significantly higher among women compared with men. Among men, whites had higher mean TtFM compared with African-Americans, while no ethnic differences were detected among women. Percentage regional fat mass from TFM was higher among women in two of the selected regions (AmFM and LgFM), but was lower in the other regions. Means of AmFM and LgFM were higher among African-American men than their white counterparts, while the reverse was true for TrFM, RbFM and PlFM. Similarly, mean AmFM and LgFM were higher among African-American women compared with their white counterparts, while the reverse was true for TrFM, PlFM and SpFM (Table 1).
Men had worse metabolic profiles than women for fasting glucose, TAG, HDL-C, uric acid and DBP. Women had worse profiles for TC and CRP (P < 0·05 based on t test between sex groups). Fasting insulin and lipid profiles (higher TAG and lower HDL-C) were worse among white men compared with African-American men. Among women, African-Americans had a worse profile than their white counterparts in terms of uric acid, CRP, SBP and DBP, whereas the reverse was true for TAG, TC and HDL-C (P < 0·05 based on t test between ethnic groups and within each sex; Table 1).
MetS (definition 1) was significantly more prevalent among women than men (27·8 % v. 22·0 %), whereas the reverse was true for MetS (definition 2). Moreover, racial differences in MetS (definitions 1 and 2) prevalence proportions were significant only among men, with whites having the higher prevalence (Table 1).
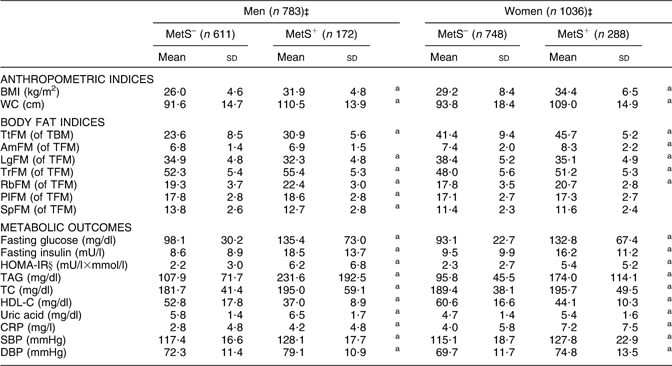
Using definition 1, men and women with MetS had significantly higher adiposity in most regions except LgFM (where the reverse was true) and AmFM (where no significant association was detected). All other metabolic outcomes and anthropometric measures were significantly higher in the MetS+ group compared with MetS– for both men and women (Table 2).
Adiposity indices and metabolic risk factors (mean and standard deviation), by MetS (definition 1)† and by sex: HANDLS study
MetS, metabolic syndrome; HANDLS, Healthy Aging in Neighborhoods of Diversity Across the Life Span; WC, waist circumference; TtFM; percentage total body fat mass; TBM, total body mass; AmFM, percentage arm fat mass; TFM, total fat mass; LgFM, percentage leg fat mass; TrFM, percentage trunk fat mass; RbFM, percentage rib fat mass; PlFM, percentage pelvic fat mass; SpFM, percentage spine fat mass; HOMA-IR, homeostasis model assessment–insulin resistance; TC, total cholesterol; HDL-C, HDL cholesterol; CRP, C-reactive protein; SBP, systolic blood pressure; DBP, diastolic blood pressure.
aP < 0·05 for the null hypothesis that means or proportions are equal between MetS groups within each sex (t test).
†See Table 1, footnote ‡, for details on MetS (definition 1).
‡Sample sizes varied depending on metabolic outcomes.
§See Table 1, footnote †, for details on HOMA-IR.
Receiver-operating characteristic curve analysis
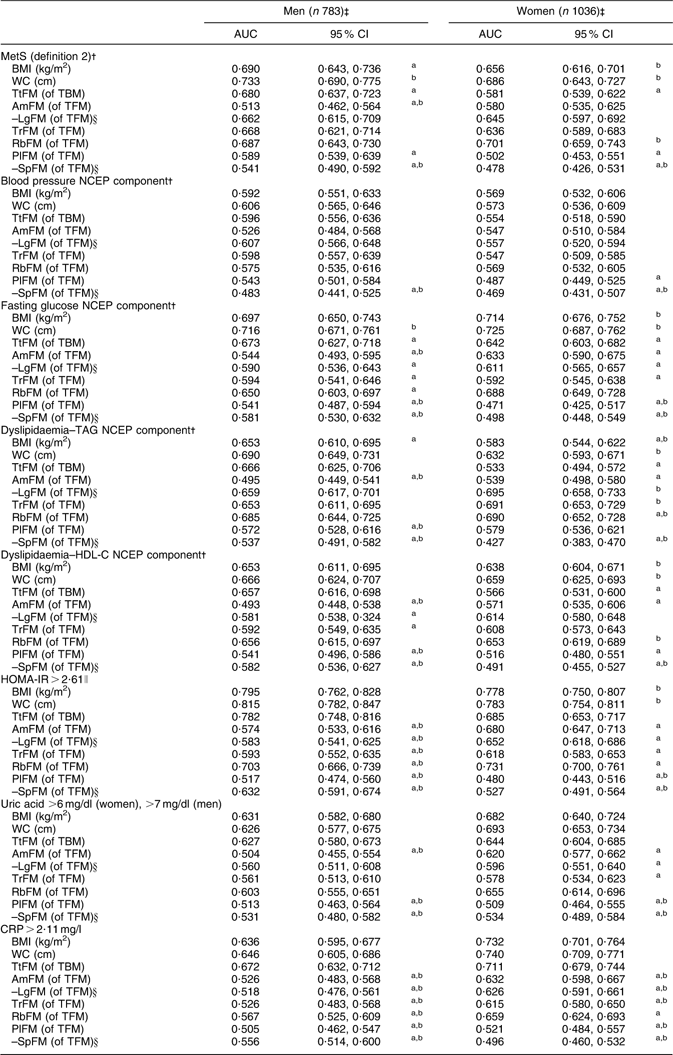
Using WC as the reference measurement, BMI, TtFM, AmFM, PlFM and –SpFM were all inferior predictors for MetS (definition 2) in men, based on Bonferroni-corrected P values comparing AUC (Table 3). In women, BMI and WC had equal value in predicting MetS, while TtFM, PlFM and –SpFM were inferior to WC. Using TtFM as the reference measurement, WC was a superior predictor of MetS (definition 2) for both sexes, while BMI was a superior predictor for this outcome only among women. RbFM was equally valuable as WC and TtFM among men, and was more valuable than TtFM among women.
ROC curve analysis (AUC and 95 % confidence interval) for MetS (definition 2)Footnote † and metabolic risk factors predicted by adiposity indices: HANDLS study
ROC, receiver-operating characteristic; AUC, area under the ROC curve; MetS, metabolic syndrome; HANDLS, Healthy Aging in Neighborhoods of Diversity Across the Life Span; WC, waist circumference; TtFM; percentage total body fat mass; TBM, total body mass; AmFM, percentage arm fat mass; TFM, total fat mass; LgFM, percentage leg fat mass; TrFM, percentage trunk fat mass; RbFM, percentage rib fat mass; PlFM, percentage pelvic fat mass; SpFM, percentage spine fat mass; NCEP, National Cholesterol Education Program; HDL-C, HDL cholesterol; HOMA-IR, homeostasis model assessment–insulin resistance; CRP, C-reactive protein.
a P < 0·05 for the null hypothesis that AUC for a specific test measure is the same as that of the reference measurement (WC, cm); Bonferroni adjustment for multiple comparisons was used.
b P < 0·05 for the null hypothesis that AUC for a specific test measure is the same as that of the alternative reference measurement (TfFM); Bonferroni adjustment for multiple comparisons was used.
† See Table 1, footnote ‡, for details on MetS (definition 2).
‡ Sample sizes varied depending on metabolic outcomes.
§ AUC values were obtained based on a ROC curve analysis in which LgFM and SpFM observed values were multiplied by –1.
∥ See Table 1, footnote †, for details on HOMA-IR.
Stratifying by sex–race groups and considering only WC, BMI, TtFM, TrFM and RbFM as test predictors, there were several main findings. First, among African-American men, all measures were equally predictive of MetS (definition 2). Second, among white men and women as well as African-American women, TtFM had a poorer predictive value compared with WC. Third, BMI had a lower predictive value than WC among white men only. Finally, RbFM but not TrFM had a higher predictive value than TtFM among African-American women, although RbFM had a lower predictive value than WC among white men (Figs 1(a) to (d)). A more detailed analysis with MetS (definition 2) and the other metabolic outcomes by sex–race groups is presented in Appendix 2.
Examining each NCEP component of MetS (Table 3), adiposity was a weak predictor of hypertension (AUC < 0·60) for most indicators. In contrast, elevated fasting glucose was best predicted by WC for both sexes, with significantly poorer predictive value observed for TtFM and most other regional fat indicators. Compared with TtFM (as reference measurement), BMI was a significantly better predictor among women, while AmFM was a poorer predictor among men. Moreover, for both sexes, PlFM and –SpFM were poorer predictors for this outcome. Examining dyslipidaemia–TAG as the target outcome, BMI, AmFM, –LgFM and –SpFM had inferior predictive values compared with WC for both sexes. However, among women, RbFM was shown to have superior predictive value to both WC and TtFM for this outcome, whereas TrFM and –LgFM were shown to be superior to TtFM only.
BMI, WC, TtFM and RbFM were the most highly and equally predictive of dyslipidaemia–HDL-C among men, while women’s WC and RbFM were better than TtFM at predicting that NCEP component. As for HOMA-IR, BMI, WC and TtFM were equally predictive among men, whereas BMI and WC were superior to TtFM among women. For uric acid and CRP, all three measures (BMI, WC and TtFM) were equally predictive of this outcome among both sexes.
Cut-off points and logistic regression analyses
Optimal cut-off points based on ROC curve analyses were higher among women than men in the case of BMI, WC, TtFM, AmFM and LgFM (Table 4). Among men, optimal cut-off points were generally lower among African-Americans, especially for BMI, WC and TtFM.
Optimal cut-off points for MetS (definition 2)Footnote † prediction with adiposity indices, and multivariate-adjusted odds ratios with 95 % confidence interval of MetS with binary adiposity indices: HANDLS study

MetS, metabolic syndrome; HANDLS, Healthy Aging in Neighborhoods of Diversity Across the Life Span; Sens, sensitivity; Spec, specificity; WC, waist circumference; TtFM; percentage total body fat mass; TBM, total body mass; AmFM, percentage arm fat mass; TFM, total fat mass; LgFM, percentage leg fat mass; TrFM, percentage trunk fat mass; RbFM, percentage rib fat mass; PlFM, percentage pelvic fat mass; SpFM, percentage spine fat mass.
a P < 0·05 for the null hypothesis that Loge(OR) = 0.
b P < 0·10 for the null hypothesis that Loge(OR) = 0.
c P < 0·05 for the null hypothesis that Loge(OR)men = Loge(OR)women.
† See Table 1, footnote ‡, for details on MetS (definition 2).
‡ OR were derived from a multivariate logistic regression model with binary outcome being MetS (definition 2, yes = 1, no = 0), main exposure being binary body fat or anthropometric index (>cut-off = 1 v. ≤cut-off = 0) and potential confounding factors adjusted for including age, race/ethnicity, poverty status, education level, marital status, smoking status and use of medications related to MetS. LgFM and SpFM were not multiplied by −1 in this particular analysis.
§ OR were derived from a multivariate logistic regression model with binary outcome being MetS (definition 2, yes = 1, no = 0), main exposure being binary body fat or anthropometric index (standardized Z-score) and potential confounding factors adjusted for including age, race/ethnicity, poverty status, education level, marital status, smoking status and use of medications related to MetS.
∥ Sens and Spec values were obtained based on a ROC curve analysis in which LgFM and SpFM observed values were multiplied by −1.
Elevated BMI (based on sex-specific optimal cut-off point) was associated with 2·41-fold higher prevalence odds of MetS (definition 2) among men and 1·86-fold higher prevalence odds among women, after controlling for sociodemographic factors, smoking status and use of medications. Among both sexes, an elevated WC (above the sex-specific cut-off) was associated with 2·37- to 2·95-fold higher prevalence odds of MetS (definition 2). Although the multivariate OR for elevated TtFM was 2·34 (95 % CI 1·56, 3·51) among men, this predictor was weaker among women with an OR of 1·39 (95 % CI 0·96, 2·02). For both sexes, elevated TrFM and RbFM significantly predicted MetS (definition 2). There were many findings regarding predictive value of adiposity measures for MetS (definition 2) when cut-offs were both sex- and race-specific. However, the most important one was that elevated LgFM was inversely associated with MetS (definition 2) only among African-American men (OR = 0·39; 95 % CI 0·22, 0·68). Considering standardized Z-scores of each adiposity measure in relation to MetS (definition 2), WC among white men had the highest predictive value with each 1 sd increasing the odds of MetS by 2·82-fold. Other adiposity measures that increased the odds of MetS (definition 2) by twofold or more included BMI and WC among all men, BMI and TtFM among white men, RbFM among all women, WC and RbFM among white women and RbFM among African-American women.
Added predictive value of DEXA measures v. anthropometric measures
Comparing a multivariate logistic regression model with only BMI+WC as predictors with a nested model that added DEXA measures to those anthropometric measures indicated that the AUC was increased by 11 % (from 0·67 to 0·74) among men and 12 % among women (from 0·63 to 0·72). Comparing the model with anthropometric and DEXA measures with a nested model in which covariates were added as predictors yielded a change in AUC by 8 % (from 0·74 to 0·80) among men and 11 % among women (from 0·72 to 0·80).
Discussion
Our study had a number of important findings. First, TtFM assessed using DEXA as a direct measure for overall adiposity had a lower value compared with anthropometric indices, particularly WC, in predicting MetS. This finding is consistent with previous studies that used a measure of percentage total body fat with BMI and/or WC(Reference Richelsen and Pedersen13, Reference Tai, Ho and Fok14, Reference Warne, Charles and Hanson16, Reference Tulloch-Reid, Williams and Looker17, Reference Wannamethee, Shaper and Morris23, Reference Bosy-Westphal, Geisler and Onur24, Reference Bray, Jablonski and Fujimoto27), while contradicting others(Reference Nagaya, Yoshida and Takahashi18, Reference De Lorenzo, Mukherjee and Kadziola19, Reference Lahmann, Lissner and Gullberg40). However, most of these studies used either bioelectrical impedance or densitometry. Compared with DEXA, these assays may have larger systematic and random measurement errors potentially causing discrepancies in findings. Most studies used either Pearson’s correlation or stepwise regression models when outcomes were continuous (e.g. HDL-C), whereas some compared hazard or incidence rate ratios or adjusted odds ratios across adiposity predictors for a single binary outcome (e.g. incident type 2 diabetes or all-cause mortality)(Reference Richelsen and Pedersen13–Reference Nakanishi, Nakamura and Suzuki15, Reference Tulloch-Reid, Williams and Looker17, Reference Reeder, Senthilselvan and Despres20–Reference Bosy-Westphal, Geisler and Onur24, Reference Bray, Jablonski and Fujimoto27, Reference Wang, Rimm and Stampfer28, Reference Vazquez, Duval and Jacobs41, Reference Meisinger, Doring and Thorand42). Among the few that conducted ROC curve analysis with MetS or type 2 diabetes as the outcome, AUC ranged between 0·65 and 0·85 (usually close to 0·70) for all anthropometric measures considered as well as percentage body fat(Reference Warne, Charles and Hanson16, Reference Tulloch-Reid, Williams and Looker17, Reference Bosy-Westphal, Geisler and Onur24–Reference Lee, Lee and Kim26, Reference Wang, Rimm and Stampfer28, Reference Woo, Ho and Yu43–Reference Bouguerra, Alberti and Smida45).
The debate as to whether WC is superior to other anthropometric indices is ongoing. In one of these studies, WC was superior to waist:hip ratio but similar to BMI in predicting type 2 diabetes(Reference Wang, Rimm and Stampfer28), while in another waist:height ratio and BMI were consistently the best predictors of this health outcome among men and women(Reference Rissanen, Hamalainen and Vanninen21). Finally, percentage body fat and waist:hip ratio quintiles were superior to BMI in predicting all-cause mortality in a large Swedish cohort, although their predictive power varied by sex and age group(Reference Lahmann, Lissner and Gullberg40).
Second, there were several important findings related to regional adiposity. In fact, comparing TtFM with other region-specific body fat indices, the only index significantly superior was RbFM among women (African-Americans in particular) for MetS (definition 2) and the two dyslipidaemia components of MetS (HDL-C and TAG), even though it was comparable to WC. Among men, none of the region-specific body fat indices was superior to TtFM. One important finding which was not replicated elsewhere was that LgFM was protective against MetS and its components, particularly among African-American men. This may be due to the inverse and strong association of LgFM with TrFM (Pearson’s correlation ranged between −0·92 and −0·94, P < 0·05; see Appendix 1).
Third, there were clear sex and race differences in the predictive values of various anthropometric and DEXA-derived measures. For instance, comparing TtFM to WC in predicting MetS (definition 2), the predictive value was not significantly different among African-American men but was poorer among all other sex and ethnic groups. This is an important finding not replicated thus far by others (e.g. reference (Reference Bosy-Westphal, Geisler and Onur24)). Additionally, we found BMI to be inferior to WC among men in general and white men in particular for MetS (definition 2) prediction, but not women. This general finding, which is indicative of the lower value of BMI compared with WC, is consistent with other reports that compared BMI and WC in their predictive value of MetS components or type 2 diabetes(Reference Reeder, Senthilselvan and Despres20, Reference Wang, Rimm and Stampfer28, Reference Moreno, Pineda and Rodriguez44), but not with others(Reference Wannamethee, Shaper and Morris23, Reference Meisinger, Doring and Thorand42).
Fourth, based on ROC curve analyses with MetS (definition 2) as the target outcome, we estimated optimal cut-off points for each adiposity index. We found, among others, that WC cut-off points varied across race–sex groups, between 97·0 cm among African-American men and 104·0 cm among white men, with women having an optimal cut-point of 103·0 cm. These cut-off points were also disparate from those recommended by the National Institutes of Health/North American Association for the Study of Obesity report of 88 cm among women and 102 cm among men(35), highlighting the need for sex- and race-specific cut-off points as was suggested previously by others(Reference Ness-Abramof and Apovian46).
Finally, our sensitivity analysis indicated that combining all measures together rather than screening for each one separately may increase AUC by 11–12 % of its original value in which only BMI and WC binary variables are considered for prediction of MetS (definition 2). Thus, whenever available, DEXA measures can be used in combination with WC and BMI to improve prediction of MetS.
Our study has several notable strengths. First, to our knowledge, it is the first large study to assess the predictive value of percentage total and regional body fatness (using DEXA scans) and compare it to commonly used anthropometric measurements when the outcomes of interest are MetS and its component risk factors. Second, it is also one of few to systematically compare AUC using statistical tests rather than visually comparing point graphical presentations and point estimates. Third, the inclusion of several metabolic risk factors as outcomes allowed us to differentiate the predictive values of each body fat and anthropometric index across those risk factors and to simultaneously examine sex differences.
Despite its strengths, our study has several limitations. First, it is a cross-sectional study, thus precluding ascertainment of temporality in many of the adiposity–metabolic associations. However, the original NCEP ATP III definition (1), and based on previous prospective cohort studies(Reference Maison, Byrne and Hales47, Reference Palaniappan, Carnethon and Wang48), assumes that obesity precedes the development of other components of MetS. Other limitations include selection bias due to attrition between the initial household survey and the MRV examination, which led the available sample to be significantly older than the original selected household sample, with a higher proportion of females and a higher percentage of participants with low income. Moreover, different DEXA equipment (Hologic) was used for those who were morbidly obese, data that were unavailable at the time of the study. In fact, DEXA scans were less accurate at higher BMI levels, in part due to truncal adiposity, and older persons were more likely to be excluded for DEXA scans in general than their younger counterparts. It is worth noting that although DEXA is nowadays considered as one of the most accurate methods of measuring body composition (including percentage total and regional body), it was initially designed to clinically diagnose osteoporosis, i.e. for bone density measurement(Reference Andreoli, Scalzo and Masala49). Additionally, our data included fewer white men than other groups, which made comparisons across sex–race groups less reliable and low-powered. Finally, HANDLS baseline data did not include measures of physical activity, which is potentially an important confounder or effect modifier in the relationship between adiposity and metabolic disorders.
In conclusion, the present study provides additional evidence that WC is among the most powerful tools to predict MetS and its non-obesity related components. Moreover, TtFM in most cases had no additional advantage for both men and women. In one instance, however, RbFM (fat concentration in the ribs region) was superior to both TtFM and WC among women in predicting dyslipidaemia–TAG and superior to TtFM in predicting MetS and dyslipidaemia–HDL-C. Its higher predictive value over TtFM for MetS was mostly noted among African-American women. In particular, a value of RbFM over 20 % was highly predictive of MetS for both sexes. In contrast, LgFM was protective against MetS with an optimal cut-off point of 34 % among men and 37 % among women. Thus, WC should continue to define the obesity components of MetS, even though RbFM among women and LgFM for both sexes may have additional predictive value. Thus, our findings may help guide screening and preventive efforts to alleviate the obesity epidemic and its related metabolic disturbances in the USA, particularly in diverse populations of low to middle socio-economic status within urban neighbourhoods.
Acknowledgements
This research was supported entirely by the Intramural Research Program of the National Institutes of Health, National Institute on Aging. The authors declare no conflicts of interest. The authors’ contributions were as follows. M.A.B.: conceptualization, full data access, data management, statistical analysis, literature review, write-up of the manuscript, revision of the manuscript. M.T.F.K.: literature review, write-up of parts of the manuscript, revision of the manuscript. Y.W.: literature review, help with statistical methods, revision of the manuscript. M.A.M.: data management, revision of the manuscript. M.K.E.: data acquisition, revision of the manuscript. A.B.Z.: data acquisition, write-up of parts of the manuscript, revision of the manuscript. The authors would like to thank Drs Jitka Sojkova and Lori L. Beason-Held for their internal review of the manuscript.
Appendix 1
Pearson’s correlation between adiposity indices: HANDLS study (n 1935)
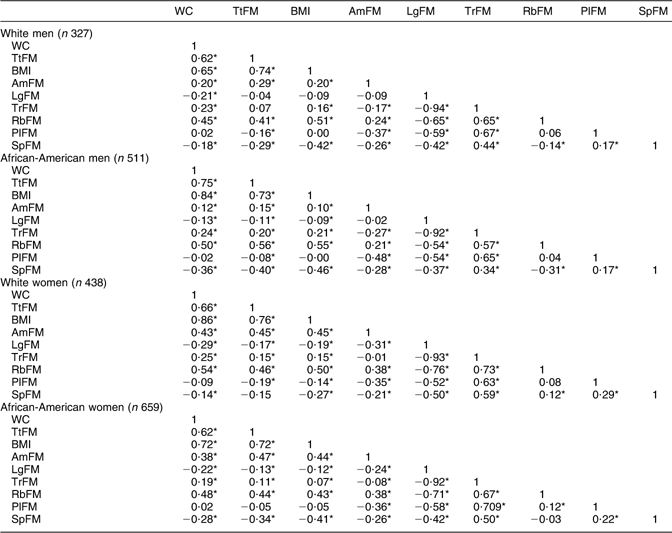
HANDLS, Healthy Aging in Neighborhoods of Diversity Across the Life Span; WC, waist circumference; TtFM; percentage total body fat mass; AmFM, percentage arm fat mass; LgFM, percentage leg fat mass; TrFM, percentage trunk fat mass; RbFM, percentage rib fat mass; PlFM, percentage pelvic fat mass; SpFM, percentage spine fat mass.
*P < 0·05 for the null hypothesis that Pearson’s correlation coefficient r = 0.
Appendix 2
AUC (95 % CI) for MetS (definition 2)Footnote † and metabolic risk factors predicted by adiposity indices, stratified by sex and race: HANDLS study
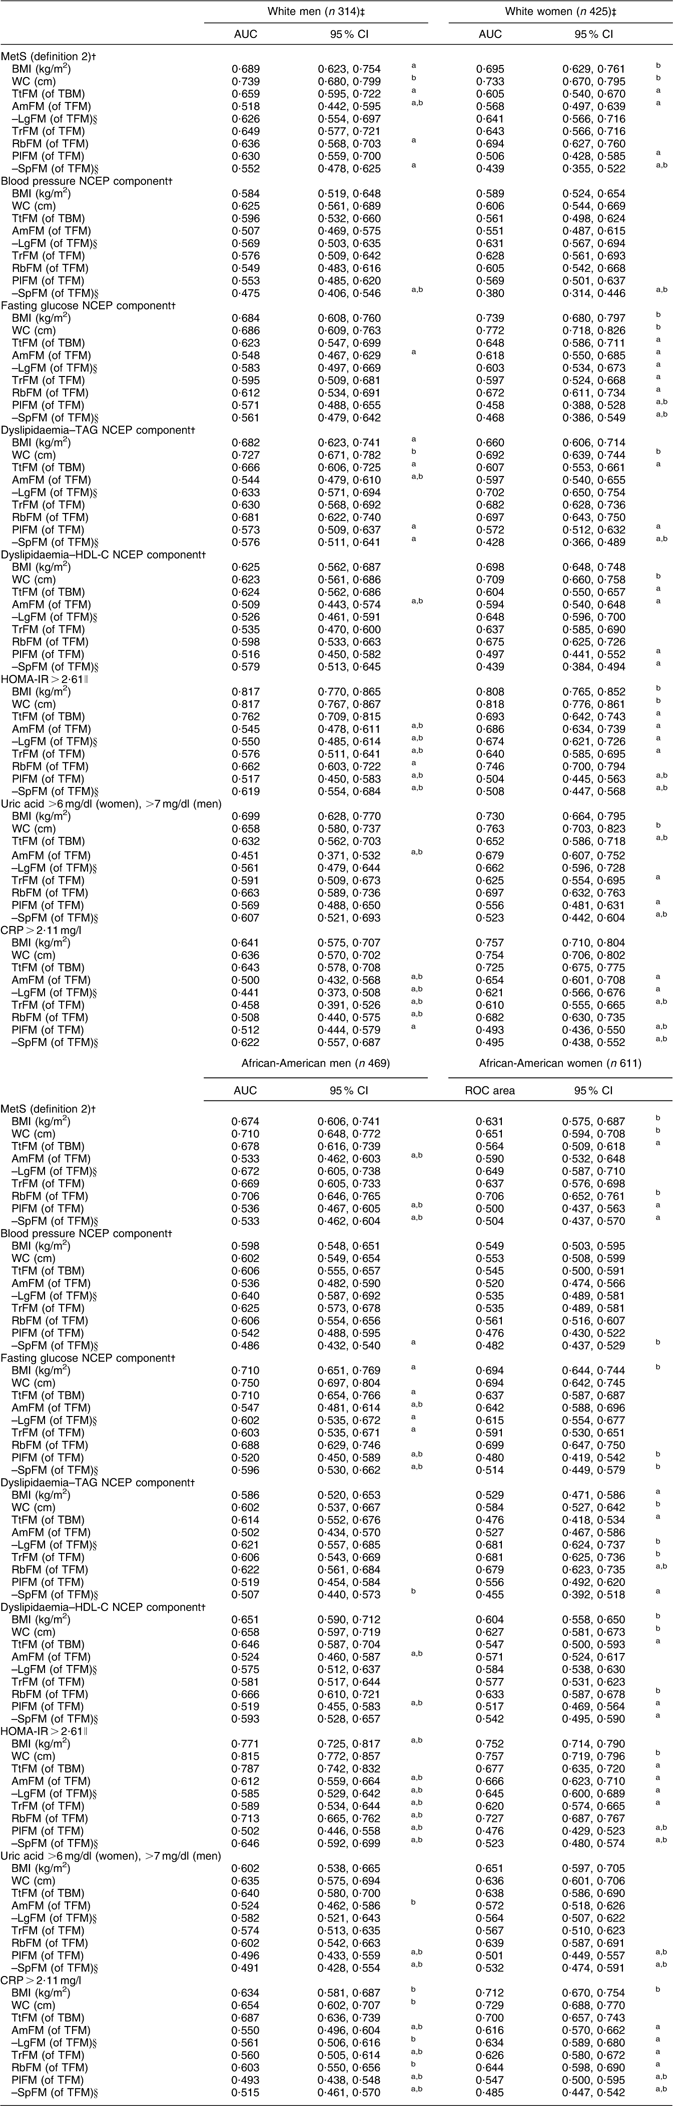
AUC, area under the receiver-operating characteristic (ROC) curve; MetS, metabolic syndrome; HANDLS, Healthy Aging in Neighborhoods of Diversity Across the Life Span; WC, waist circumference; TtFM; percentage total body fat mass; TBM, total body mass; AmFM, percentage arm fat mass; TFM, total fat mass; LgFM, percentage leg fat mass; TrFM, percentage trunk fat mass; RbFM, percentage rib fat mass; PlFM, percentage pelvic fat mass; SpFM, percentage spine fat mass; NCEP, National Cholesterol Education Program; HDL-C, HDL cholesterol; HOMA-IR, homeostasis model assessment–insulin resistance; CRP, C-reactive protein.
a P < 0·05 for the null hypothesis that AUC for a specific test measure is the same as that of the reference measurement (WC, cm); Bonferroni adjustment for multiple comparisons was used.
b P < 0·05 for the null hypothesis that AUC for a specific test measure is the same as that of the alternative reference measurement (TfFM); Bonferroni adjustment for multiple comparisons was used.
† Using definition 1, MetS was positive when three or more of the following criteria screened as positive. These criteria are derived from the NCEP Adult Treatment Panel III (2001)(1). (i) Central obesity NCEP component: WC ≥ 102 cm for men and WC ≥ 88 cm for women; (ii) blood pressure NCEP component: systolic blood pressure/diastolic blood pressure ≥ 130/85 mmHg; (iii) fasting glucose NCEP component: fasting glucose ≥ 110 mg/dl; (iv) dyslipidaemia–TAG NCEP component: TAG ≥ 150 mg/dl; (v) dyslipidaemia–HDL-C NCEP component: HDL-C < 40 mg/dl for men and HDL-C < 50 mg/dl for women. Using definition 2, MetS was positive when two or more of the preceding criteria screened positive excluding criteria (i) and (v).
‡ Sample sizes available for each analysis varied depending on metabolic outcome.
§ AUC values were obtained based on a ROC curve analysis in which LgFM and SpFM observed values were multiplied by –1.
∥ HOMA-IR is the product of the fasting values of glucose (G 0; expressed as mg/dl) and insulin (I 0, expressed as μU/ml), divided by a constant: I 0 × G 0/405.



