

Phosphorus is an essential nutrient, involved in several metabolic processes as well as a key component in skeletal health( Reference Cooke 1 ). Broadly, dietary P is either present as naturally occurring P from protein-rich components such as meat and fish, bony material and plant ingredients or derived from the added inorganic P( Reference Cooke 1 ). Studies in cats indicated that the higher the P content of the diet, the higher the amount of P excreted in the urine and faeces( Reference Kienzle, Thielen and Pessinger 2 – Reference Fettman, Coble and Hamar 4 ). This relationship is not straightforward, however, as digestion and absorption of dietary P can be altered by a range of dietary factors( 5 ). Not only does the total P content of the diet and the Ca:P ratio appear to influence P availability, but the source of dietary P may also play a role in this process( Reference Dobenecker, Webel and Reese 6 , Reference Mack, Alexander and Morris 7 ). Dietary P derived from food ingredients, for example, poultry meal or meat and bone meal, is considered to be less bioavailable than supplemented inorganic salts; for example, P-containing mono and dibasic Na salts( Reference Pastoor, Van’t Klooster and Mathot 3 , Reference Finco, Barsanti and Brown 8 ). P-based additives are widely used in commercial food manufacturing, where they serve a number of processing functions including pH stabilisation, emulsification, leavening, hydration and bactericidal actions. This difference in availability is most likely due to the P contained in the organic materials being bound to in vivo proteins and intra-cellular signalling molecules, whilst added inorganic P is usually included in diets as a soluble salt that is able to readily disassociate and be absorbed( Reference Noori, Sims and Kopple 9 ). This solubility may differ between sources of inorganic P, for example, monophosphates readily soluble in water may lead to higher excretion of P in the urine compared with acid-soluble monophosphates( Reference Dobenecker, Schaschl and Webel 10 ).
In healthy humans, normal circulating P and Ca concentrations are maintained via modulation of calcitrol (1,25-dihydroxyvitamin D3), fibroblast growth factor (FGF-23) and parathyroid hormone (PTH)( Reference Isakova, Gutierrez and Shah 11 ). During prolonged exposure to a high dietary P intake in humans, FGF-23 production is stimulated; this down-regulates the expression of renal sodium-phosphate co-transporters and decreases 1,25-dihydroxyvitamin D3 levels, leading to increased P excretion through the kidneys( Reference Silver, Rodriguez and Slatopolsky 12 ). In cats, dogs and rats, it has been observed that acutely after a meal, an increase in serum P causes a reduction in ionised Ca (iCa) that in turn increases PTH secretion, also leading to decreased resorption of P in the kidney and increased excretion into the urine( Reference Nagode, Chew and Podell 13 , Reference Tani, Sato and Yamanaka-Okumura 14 ). A substantial reduction in kidney function can also impair the regulation of phosphate balance, resulting in chronically elevated circulating phosphate concentrations in humans( Reference Uribarri 15 ). This response has been associated with cardiovascular events, cardiovascular mortality and all-cause mortality as well as with human patients having chronic kidney disease (CKD)( Reference Kestenbaum, Sampson and Rudser 16 ).
Dobenecker et al. ( Reference Dobenecker, Webel and Reese 6 ) recently showed that feeding a high-P diet, with a low Ca:P, to cats for 29 d caused glucosuria and microalbuminuria with a decreased creatinine clearance; all of which are indicators of kidney dysfunction( Reference Dobenecker, Webel and Reese 6 ). The use of phosphate supplements as low as 0·5 % by DM weight of diet has been shown to cause renal and vascular calcification in adult rats( Reference Tani, Sato and Yamanaka-Okumura 14 , Reference Hitchman, Hasany and Hitchman 17 ). In addition, the feeding of semi-purified diets to rats has been shown to result in morphological changes to the kidneys, consistent with the disease, when compared with diets comprising P from a mostly natural source( Reference Ritskes-Hoitinga, Lemmens and Beynen 18 ). These observations are consistent with the literature suggesting that the absorption of natural sources of P is considerably lower than inorganic phosphate salt supplements( Reference Dobenecker, Webel and Reese 6 , Reference Hitchman, Hasany and Hitchman 17 , Reference Gonzalez-Parra, Gracia-Iguacel and Egido 19 ). Recent work from our group found that cats fed diets containing total P of 4·8 g/4184 kJ (1000 kcal), of which 3·5 g P/4184 kJ (1000 kcal) was in the form of inorganic sodium dihydrogen phosphate (SDHP) and Ca:P = 0·6 for 4 weeks, developed irreversible kidney changes characterised by reduced glomerular filtration rate, elevated serum creatinine and urinary albumin:creatinine ratio and evidence of structural abnormalities within the kidney( Reference Alexander, Stockman and Atwal 20 ). In a follow-up study, adult cats fed a diet with P from SDHP inclusion of 1·5 g/4184 kJ (1000 kcal), 3·6 g total P/4184 kJ (1000 kcal) and Ca:P = 0·9 for over 28 weeks showed no mean changes in blood biochemistry indicative of renal dysfunction; however, there was sonographic evidence indicative of new renoliths and renal structural changes in some cats( Reference Alexander, Stockman and Atwal 20 ). There were three exceptions in the test group, where cats developed signs of renal dysfunction towards the end of the feeding period, with clinically relevant changes in blood biochemistry apparent from week 21 of feeding. Therefore, there is a need to better understand dietary P absorption.
Although there are data for postprandial serum or plasma P in cats( Reference Finco, Barsanti and Brown 8 ) and dogs( Reference Dobenecker and Siedler 21 ), these measures and the associated regulatory responses have been examined in greater detail in healthy humans as well as in humans with CKD( Reference Berndt and Kumar 22 ). Dietary management of CKD aims to limit P load on the kidneys through a reduction in P intake, but various strategies are also applied to reduce bioavailability, including the use of phosphate binding medications, as well as dietary manipulation by applying different P sources( Reference Moe, Zidehsarai and Chambers 23 , Reference Moore, Nolte and Gaber 24 ). The findings of these studies in humans demonstrate that ingestion of added inorganic P increased serum phosphate concentrations in one study( Reference Moore, Nolte and Gaber 24 ) and that plasma P decreased following consumption of vegetarian diets in another( Reference Moe, Zidehsarai and Chambers 23 , Reference Moore, Nolte and Gaber 24 ), highlighting that postprandial plasma P kinetics are different when different sources of P are ingested. Karp et al. ( Reference Karp, Vaihia and Kärkkäinen 25 ) found similar trends in serum phosphate and urinary P excretion, when tripolyphosphate and monophosphate supplements were consumed. In addition, healthy male volunteers fed a 500 mg P supplement showed that serum phosphate increased postprandially, while a transient decrease was apparent after a placebo( Reference Hazim, Hlais and Ghattas 26 ). Sustained increases in plasma P are thought to be harmful due to the physiological consequences associated with the regulation of plasma P( Reference Tani, Sato and Yamanaka-Okumura 14 ). There is a suggestion that over time, increased FGF-23 can lead to a loss of Ca-dependent inhibition of PTH, and suppression of PTH by FGF-23 itself, which in turn could lead to damage to organs such as the kidney and parathyroid gland( Reference Wetmore, Santos and Mahnken 27 , Reference Canalejo, Canalejo and Martinez-Moreno 28 ).
To date relatively little work has been undertaken to understand the factors affecting postprandial plasma P concentrations in cats. This knowledge is vital, particularly as evidence is accumulating to suggest that dietary P may contribute to the aetiology of diseases such as CKD or CVD. We( Reference Alexander, Stockman and Atwal 20 ) and others (Dobenecker et al. ( Reference Dobenecker, Webel and Reese 6 ); Pastoor et al. ( Reference Pastoor, Van’t Klooster and Mathot 3 )) have reported changes in kidney function following exposure to diets containing high levels of P, but the mode of action, time course and clinical significance of the findings make drawing firm conclusions on the role of dietary P difficult to establish. Responses to differences in dietary P levels as well as differing bioavailability of various sources of dietary P present in the diets have been determined in cats and dogs( Reference Pastoor, Van’t Klooster and Mathot 3 , Reference Dobenecker, Webel and Reese 6 , Reference Dobenecker and Siedler 21 , Reference Siedler and Dobenecker 29 ). With this in mind, we describe herein a series of studies designed to evaluate the postprandial profiles of P in the plasma of cats following a range of dietary interventions.
Methods
Overview
A series of randomised crossover studies were performed, as detailed in Table 1. These studies involved a single exposure to each test diet comprising 50 % of the individuals’ metabolic energy requirement (MER), and subsequent monitoring of the postprandial plasma responses for 6 h post-ingestion. Diets were blinded for feeders and during all sample analyses. The number of cats in each study varied based on separate powering for individual study. The timings of blood sampling and blood volumes were refined as the series of studies progressed; there was a minimum of 7 d between sampling occasions for each study. Each research protocol was reviewed and approved by the WALTHAM Animal Welfare and Ethical Review Body and carried out under the authority of the revised Animals (Scientific Procedures) Act 1986 incorporating EU Directive 2010/63. Cats were extensively trained for and habituated to all procedures.
Study details (Mean values and ranges)
Cats
All cats utilised throughout the studies were neutered. To ensure eligibility for the study, all cats underwent a pre-study health assessment, including a physical examination and haematological, plasma biochemical and urine analysis. Cats were group housed in social rooms, except during 24 h urine collection periods when, to facilitate sample collection, they were individually housed in lodges. Throughout the study, diets were offered in amounts to maintain an ideal body condition score according to a 9-point scale( Reference Bjornvad, Nielsen and Armstrong 30 ) and deionised water was available ad libitum at all times on the study day; a second meal (50 % MER) was offered following the final sample collection. This second meal was a single batch of a fully complete and balanced commercial diet that was compliant with Association of American Feed Control Officials (AAFCO) and European Pet Food Industry Federation (FEDIAF) guidelines. This was analysed to calculate the total P intake over 24 h.
Diets
For these studies, experimental dry and wet diets were specifically formulated and manufactured at Royal Canin and Mars Inc., respectively. Nutritional composition of the diets was confirmed through nutritional analyses carried out at Eurofins Ltd, Wolverhampton, UK, utilising Association of Official Analytical Chemists official methods of analyses (see Table 2 for details).
Nutrient composition of the diets
SDHP, sodium dihydrogen phosphate; STPP, sodium tripolyphosphate; PME, predicted metabolisable energy.
* Inorganic P represents the target P inclusion level from: SDHP, NaH2PO4 or STPP, Na5P3O10.
† Same diet as fed in Alexander et al. ( Reference Alexander, Stockman and Atwal 20 ) without the 200 mg/4184 kJ (1000 kcal) Ca supplement.
‡ Calculated by proximate analysis to PME according to the National Research Council (5) .
§ Food base excess calculated from methionine and cysteine according to Jeremias et al. Reference Jeremias, Nogueira and Brunetto (61) on a per kg food basis.
Blood sampling
Following an overnight fast, cats were given topical local anaesthesia (1 ml EMLA™ cream 5 %; AstraZeneca) and a 22G cephalic catheter was positioned, which remained in place for the duration of the sampling period. A 0·2 ml heparin flush and discard was performed before sampling and a 2 ml saline flush followed each sample to maintain patency. A fasted blood sample was collected to provide a baseline, with further samples taken at intervals described in each specific study up to, and including, 6 h post-feeding.
Blood sample processing and analysis
Blood samples (0·5 ml) were collected into lithium heparin tubes and kept on ice until analysis was performed within 60 min of sampling. iCa was measured in whole blood using a Stat Profile Prime Veterinary Critical Care Analyser (Nova Biomedicals). Performance of the instrument was verified by analysis of tri-level quality control material before and after sample measurement via an ion-selective electrode. Plasma was isolated by centrifugation of the remaining blood samples at 2000 g for 10 min at 4°C. P, in the form of orthophosphate, was photometrically quantified on non-ashed plasma using an AU480 clinical chemistry analyser (Beckman Coulter) according to the manufacturer’s instructions and concentrations reported in mmol/l. Bi-level quality control material before, midway and after sample day measurements was used to confirm acceptable instrument performance.
Analysis of plasma PTH and FGF-23 were performed at the Royal Veterinary College, London. Blood samples (1 ml for each measure) were collected in EDTA containing tubes and plasma obtained by centrifugation at 2000 g for 10 min at 4°C, before being stored at –80°C until analysis. Intact plasma FGF-23 was measured using a human sandwich ELISA (Kainos Laboratories), as previously described( Reference Geddes, Finch and Elliott 31 ), and PTH concentrations by a RIA previously validated for use with feline samples( Reference Williams, Elliott and Syme 32 ).
Urine sample analysis
All urine passed over 24 h following the feeding of the test diet were collected to assess renal P excretion. Cats were individually housed during this 24 h collection period, and urine was collected in a litter tray containing hydrophobic sand or glass beads. Urine samples were acidified to pH 2 (±0·1) using concentrated hydrochloric acid, and centrifuged at 2000 g for 5 min at 4°C before P analysis was undertaken on the AU480 analyser as described above.
Statistical powering
Following completion of a pilot study, sample size analyses were performed to investigate the number of cats needed in a crossover study design, with 2, 3 or 4 diets, to detect fold changes with at least 80 % power in plasma P levels of 5–20 % when measuring 6, 8 or 10 time points. Plasma P levels from this pilot study were used to estimate the between-cat variability (sd=0·0261 log10 mmol/l), between-diet within-cat variability (sd=0·0393 log10 mmol/l) and within diet within cat variability (sd=0·0395 log10 mmol/l). The baseline pre-feed levels were also estimated to be 0·0816 log10 mmol/l. Data were then simulated (1000 for each scenario) according to these variability estimates and by inducing a difference for one diet at one time point. The analysis was performed, as per the postprandial pilot data analysis (given below). The power was estimated by the percentage of simulations where all comparisons relative to the mean that was changed were significant, at the overall family-wise error rate of 5 %.
Statistical analysis
For each study, the postprandial plasma P levels (primary measure), iCa, PTH and FGF-23 were analysed using linear mixed effects models (LMM), with time nested in diet nested in animal as the random effects and diet, time point and their interaction as the categorical fixed effects. Plasma P, PTH and FGF-23 data were log10 transformed before analyses where increasing variation in residuals with increasing value was observed. For some measures, data were missing because samples were not taken or of failure of laboratory equipment; however, the restricted maximal likelihood (REML) method of analysis was used to account for this and assumed these values were missing at random. Comparisons were made, using a family-wise adjusted 5 % level for each measure, between diets at each time point and between fasted to each subsequent postprandial time point for each diet. Accordingly, means, differences between means or fold changes were reported with 95 % family-wise CI. In addition, for each cat on each diet in each study, the plasma P at baseline was subtracted from all post-baseline time points, and the trapezium rule was then used to calculate the AUC in mmol/l × h. Separate LMM were fit for each trial with AUC as the response. Distributional assumptions were assessed by visual inspection of the residuals and were deemed to be upheld for all models. The fixed effect for each model was diet, and the random effect was diet nested in animal. From each model, mean AUC with 95 % CI are reported for all diets. Comparisons between diets are reported as differences with 95 % CI and P values.
Urinary P excretion was analysed by LMM with cat as a random effect and diet as a fixed effect. A comparison was made between diets using the 5 % level. Means and differences between means are reported with 95 % CI.
Analyses were performed in statistical software R version 3.3.2( 33 ) using libraries lme4( Reference Bates, Mächler and Bolker 34 ) for LMM, multcomp( Reference Hothorn, Bretz and Westfall 35 ) for simultaneous inference and ggplot2( Reference Wickham 36 ) for data visualisation.
Results
Study 1 – proof of principle: can postprandial plasma phosphorus profiles be manipulated by different diet compositions?
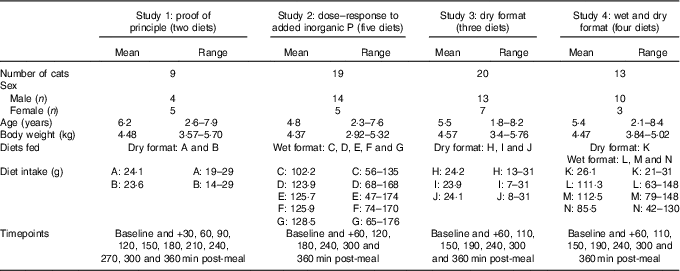
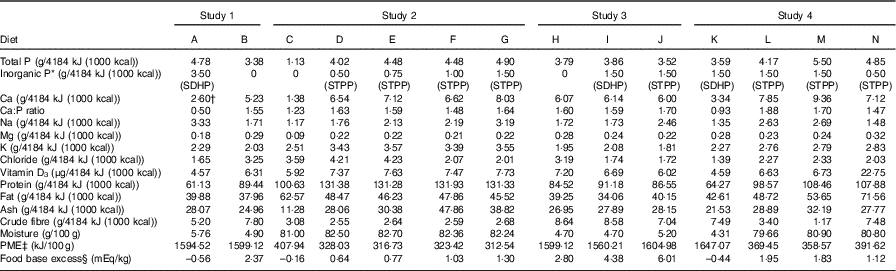
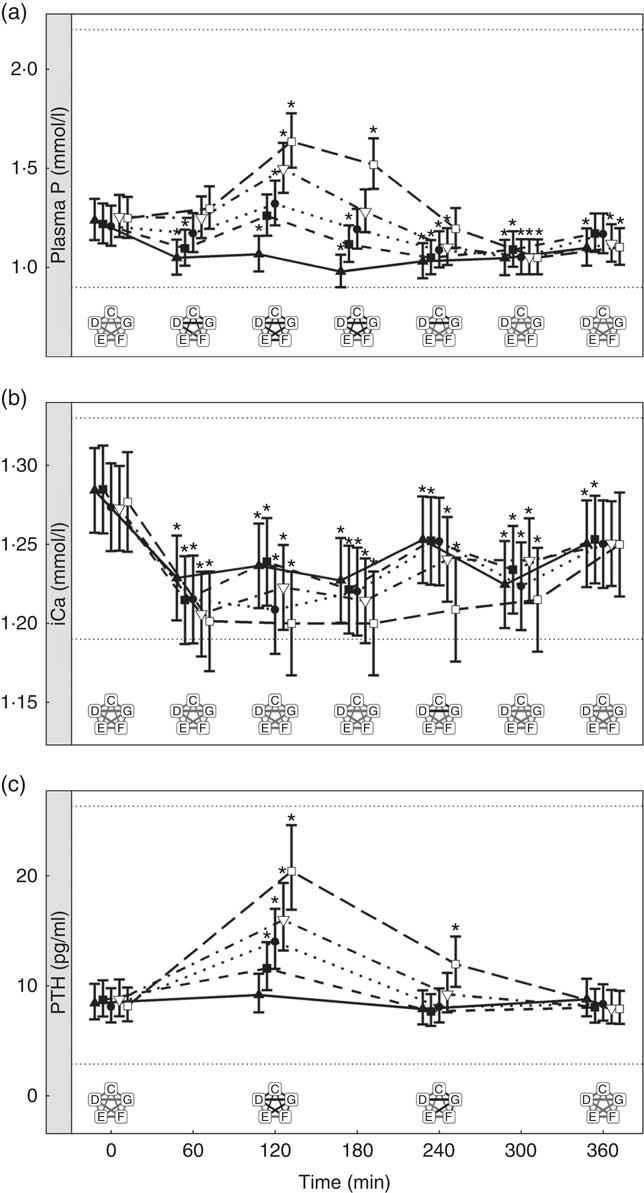
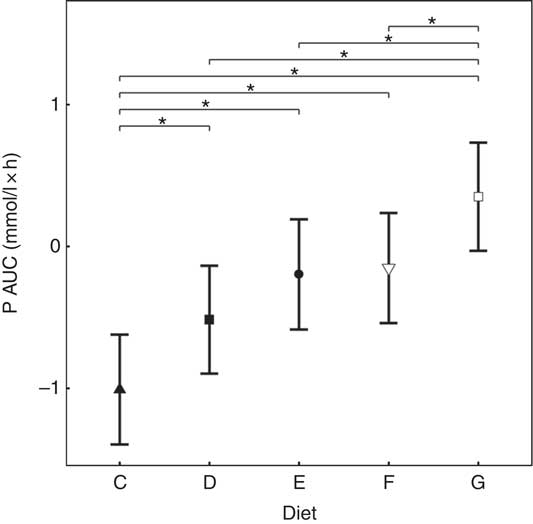
Diet A significantly increased plasma P to a peak of 1·98 (95 % CI 1·72, 2·27) mmol/l at 150 min where it plateaued before gradually decreasing during the final three time points (P <0·001; Fig. 1(a)). Diet B showed a significant decrease from baseline in plasma P from 90 until 360 min (P ≤ 0·008; Fig. 1(a)). Diet A had a significantly higher AUC of 3·65 (95 % CI 2·8, 4·49) mmol/l × h than diet B which had a negative AUC of –1·1 (95 % CI –1·4, –0·621) mmol/l × h (P <0·001; Fig. 2 and Table 3). The increase in plasma P in cats fed diet A was accompanied by a significant reduction in iCa compared with diet B at 300 and 360 min (P <0·001 and P = 0·007, respectively; Fig. 1(b)). An increase in PTH was also observed from 120 min onwards when cats were fed diet A (P <0·001; Fig. 1(c)). There was no observed change in PTH for cats fed diet B (P ≥ 0·998; Fig. 1(c)). No differences in FGF-23 were observed between diets or from baseline over the 6 h postprandial sampling period (Fig. 1(d)).
Biochemical parameters over the study day for study 1. (a) Plasma phosphorus, (b) whole blood ionised calcium (iCa), (c) plasma parathyroid hormone (PTH) and (d) fibroblast growth factor 23 (FGF-23). Diet A (![]() ): 4·8 g total phosphorus/4184 kJ (1000 kcal), 3·5 g phosphorus from sodium dihydrogen phosphate/4184 kJ (1000 kcal), calcium:phosphorus 0·56. Diet B (
): 4·8 g total phosphorus/4184 kJ (1000 kcal), 3·5 g phosphorus from sodium dihydrogen phosphate/4184 kJ (1000 kcal), calcium:phosphorus 0·56. Diet B (![]() ): 3·38 g total phosphorus/4184 kJ (1000 kcal), no added inorganic phosphorus, calcium:phosphorus 1·55. Values are means, with 95 % CI represented by vertical bars. *Mean values were significantly different from baseline (P <0·05). Reference ranges are shown for each parameter, but for FGF-23 only the minimum is shown. Significant differences between diets: false (
): 3·38 g total phosphorus/4184 kJ (1000 kcal), no added inorganic phosphorus, calcium:phosphorus 1·55. Values are means, with 95 % CI represented by vertical bars. *Mean values were significantly different from baseline (P <0·05). Reference ranges are shown for each parameter, but for FGF-23 only the minimum is shown. Significant differences between diets: false (![]() ) and true (
) and true (![]() ).
).
AUC data for study 1. Diet A (![]() ): 4·8 g total phosphorus/4184 kJ (1000 kcal), 3·5 g phosphorus from sodium dihydrogen phosphate/4184 kJ (1000 kcal), calcium:phosphorus 0·56. Diet B (
): 4·8 g total phosphorus/4184 kJ (1000 kcal), 3·5 g phosphorus from sodium dihydrogen phosphate/4184 kJ (1000 kcal), calcium:phosphorus 0·56. Diet B (![]() ): 3·38 g total phosphorus/4184 kJ (1000 kcal), no added inorganic phosphorus, calcium:phosphorus 1·55. Values are means, with 95 % CI represented by vertical bars. *Mean values were significantly different between diets (P <0·05).
): 3·38 g total phosphorus/4184 kJ (1000 kcal), no added inorganic phosphorus, calcium:phosphorus 1·55. Values are means, with 95 % CI represented by vertical bars. *Mean values were significantly different between diets (P <0·05).
Data for each diet specification† (Mean values and 95 % confidence intervals)
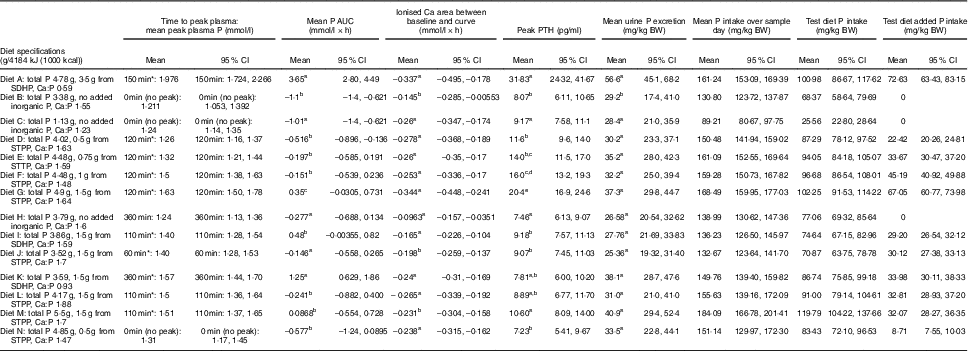
PTH, parathyroid hormone; BW, body weight; SDHP, sodium dihydrogen phosphate; STPP, sodium tripolyphosphate.
a,b,c,d,e Mean values with unlike superscript letters were significantly different between diets within each study (P <0·05).
* Time to peak plasma shows significant difference to baseline results.
† Separate trials are delineated by a blank line.
Urinary P excretion increased significantly when cats were fed diet A (Table 3) (P <0·001).
Study 2 – does added inorganic phosphorus in the diet drive the postprandial increase in plasma phosphorus in a dose-dependent manner?
Inorganic P inclusion increased peak plasma P concentrations in a dose-dependent manner. A significant increase from baseline in plasma P was apparent following ingestion of diet E, diet F and diet G (1·32, 1·50 and 1·63 mmol/l and P = 0·023, P <0·001 and P <0·001, respectively; Table 3 and Fig. 3(a)). Diets C and D did not show an increase in plasma P and instead were significantly reduced from baseline after 60 min (P <0·001 and P = 0·002, respectively; Fig. 3(a)), diet C remained decreased until 360 min whilst diet D did return to baseline at 120 min before decreasing again for the remainder of the study (Fig. 3(a)). The differences in peak plasma P and overall kinetic profiles of the diets (Fig. 3(a)) are reflected in the AUC data, where diet G had the largest AUC compared with all other diets (0·35 (95 % CI –0·03, 0·73) mmol/l × h, P ≤ 0·0167), diets D, E and F were not significantly different to each other, while diets D–G were all significantly higher than diet C (–1·01 (95 % CI –1·41, –0·621) mmol/l × h, P <0·0216; Table 3 and Fig. 4). iCa was significantly decreased from baseline for all diets (P ≤ 0·02; Fig. 3(b)). Diets E, F and G returned to baseline concentrations at 360 min, diet E also returned to baseline at 240 min during the study (Fig. 3(b)). At 240 min diet G was significantly decreased compared with diets C (P = 0·038) and D (P = 0·047; Fig. 3(b)). Inorganic P inclusion also increased peak PTH concentration in a dose-dependent manner. Diets D, E, F and G all significantly increased PTH at 120 min post-meal (fold change 1·33, 1·73, 1·83 and 2·50, respectively; P <0·001, Fig. 3(c)), diet G was still elevated at 240 min post-meal (fold change 1·47; P <0·001, Fig. 3(c)). Diet C alone showed no observable changes in PTH from baseline throughout the study.
Biochemical parameters over the study day for study 2. (a) Plasma phosphorus, (b) ionised calcium (iCa) and (c) parathyroid hormone (PTH). Diet C (![]() ): 1·13 g total phosphorus/4184 kJ (1000 kcal), no added inorganic phosphorus, calcium:phosphorus 1·23. Diet D (
): 1·13 g total phosphorus/4184 kJ (1000 kcal), no added inorganic phosphorus, calcium:phosphorus 1·23. Diet D (![]() ): 4·02 g total phosphorus/4184 kJ (1000 kcal), 0·5 g phosphorus from sodium tripolyphosphate (STPP)/4184 kJ (1000 kcal), calcium:phosphorus 1·63. Diet E (
): 4·02 g total phosphorus/4184 kJ (1000 kcal), 0·5 g phosphorus from sodium tripolyphosphate (STPP)/4184 kJ (1000 kcal), calcium:phosphorus 1·63. Diet E (![]() ): 4·48 g total phosphorus/4184 kJ (1000 kcal), 0·75 g phosphorus from STPP/4184 kJ (1000 kcal), calcium:phosphorus 1·55. Diet F (
): 4·48 g total phosphorus/4184 kJ (1000 kcal), 0·75 g phosphorus from STPP/4184 kJ (1000 kcal), calcium:phosphorus 1·55. Diet F (![]() ): 4·45 g total phosphorus/4184 kJ (1000 kcal), 1·0 g phosphorus from STPP/4184 kJ (1000 kcal), calcium:phosphorus 1·48. Diet G (
): 4·45 g total phosphorus/4184 kJ (1000 kcal), 1·0 g phosphorus from STPP/4184 kJ (1000 kcal), calcium:phosphorus 1·48. Diet G (![]() ): 4·9 g total phosphorus/4184 kJ (1000 kcal), 1·5 g phosphorus from STPP/4184 kJ (1000 kcal), calcium:phosphorus 1·64. Values are means, with 95 % CI represented by vertical bars. *Mean values were significantly different from baseline (P <0·05). Reference ranges are shown for each parameter. Significant differences between diets: false (
): 4·9 g total phosphorus/4184 kJ (1000 kcal), 1·5 g phosphorus from STPP/4184 kJ (1000 kcal), calcium:phosphorus 1·64. Values are means, with 95 % CI represented by vertical bars. *Mean values were significantly different from baseline (P <0·05). Reference ranges are shown for each parameter. Significant differences between diets: false (![]() ) and true (
) and true (![]() ).
).
AUC data for study 2. Diet C (![]() ): 1·13 g total phosphorus/4184 kJ (1000 kcal), 100 % organic phosphorus, calcium:phosphorus 1·23. Diet D (
): 1·13 g total phosphorus/4184 kJ (1000 kcal), 100 % organic phosphorus, calcium:phosphorus 1·23. Diet D (![]() ): 4·02 g total phosphorus/4184 kJ (1000 kcal), 0·5 g phosphorus from sodium tripolyphosphate (STPP)/4184 kJ (1000 kcal), calcium:phosphorus 1·63. Diet E (
): 4·02 g total phosphorus/4184 kJ (1000 kcal), 0·5 g phosphorus from sodium tripolyphosphate (STPP)/4184 kJ (1000 kcal), calcium:phosphorus 1·63. Diet E (![]() ): 4·48 g total phosphorus/4184 kJ (1000 kcal), 0·75 g phosphorus from STPP/4184 kJ (1000 kcal), calcium:phosphorus 1·55. Diet F (
): 4·48 g total phosphorus/4184 kJ (1000 kcal), 0·75 g phosphorus from STPP/4184 kJ (1000 kcal), calcium:phosphorus 1·55. Diet F (![]() ): 4·45 g total phosphorus/4184 kJ (1000 kcal), 1·0 g phosphorus from STPP/4184 kJ (1000 kcal), calcium:phosphorus 1·48. Diet G (
): 4·45 g total phosphorus/4184 kJ (1000 kcal), 1·0 g phosphorus from STPP/4184 kJ (1000 kcal), calcium:phosphorus 1·48. Diet G (![]() ): 4·9 g total phosphorus/4184 kJ (1000 kcal), 1·5 g phosphorus from STPP/4184 kJ (1000 kcal), calcium:phosphorus 1·64. Values are means, with 95 % CI represented by vertical bars. *Mean values were significantly different from baseline (P <0·05).
): 4·9 g total phosphorus/4184 kJ (1000 kcal), 1·5 g phosphorus from STPP/4184 kJ (1000 kcal), calcium:phosphorus 1·64. Values are means, with 95 % CI represented by vertical bars. *Mean values were significantly different from baseline (P <0·05).
There were no significant differences in P concentrations in the urine (Table 3).
Study 3 – does the source of added inorganic phosphorus alter postprandial plasma phosphorus kinetics?
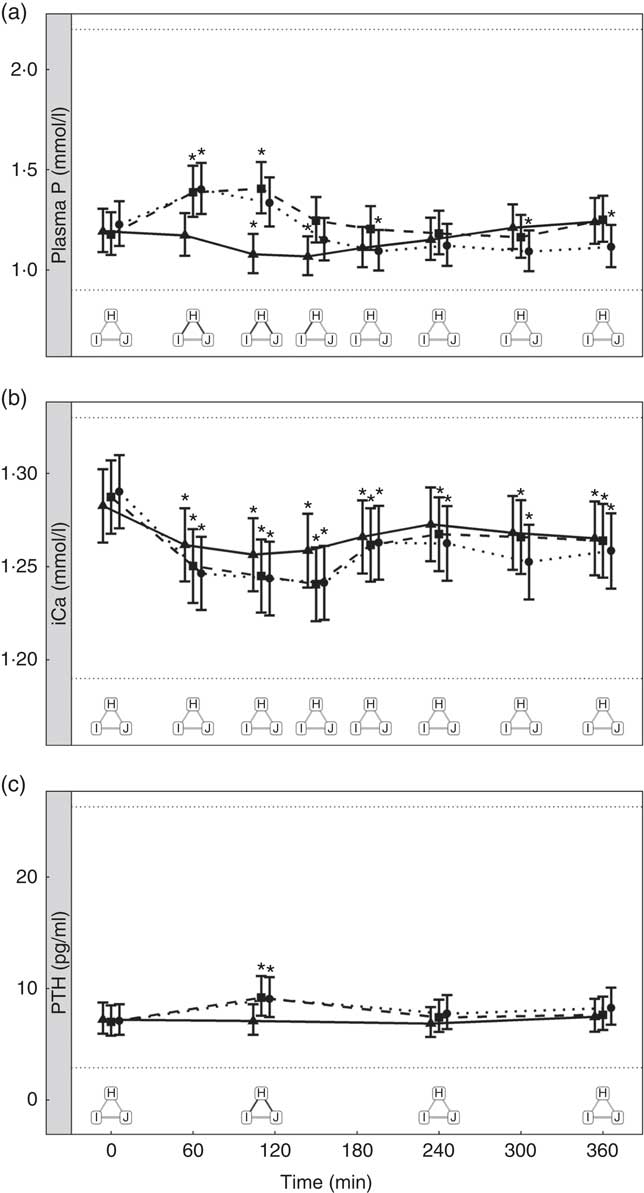
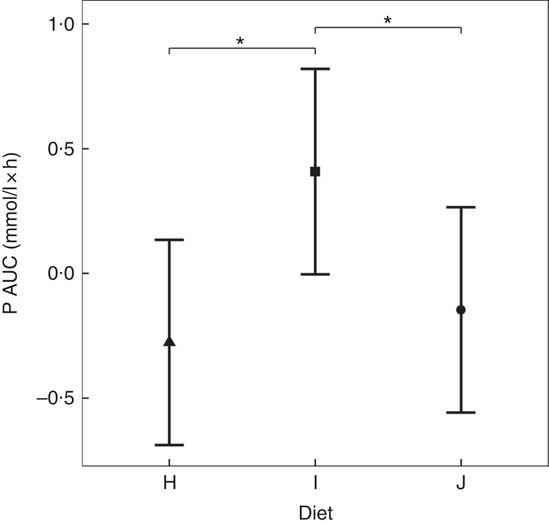
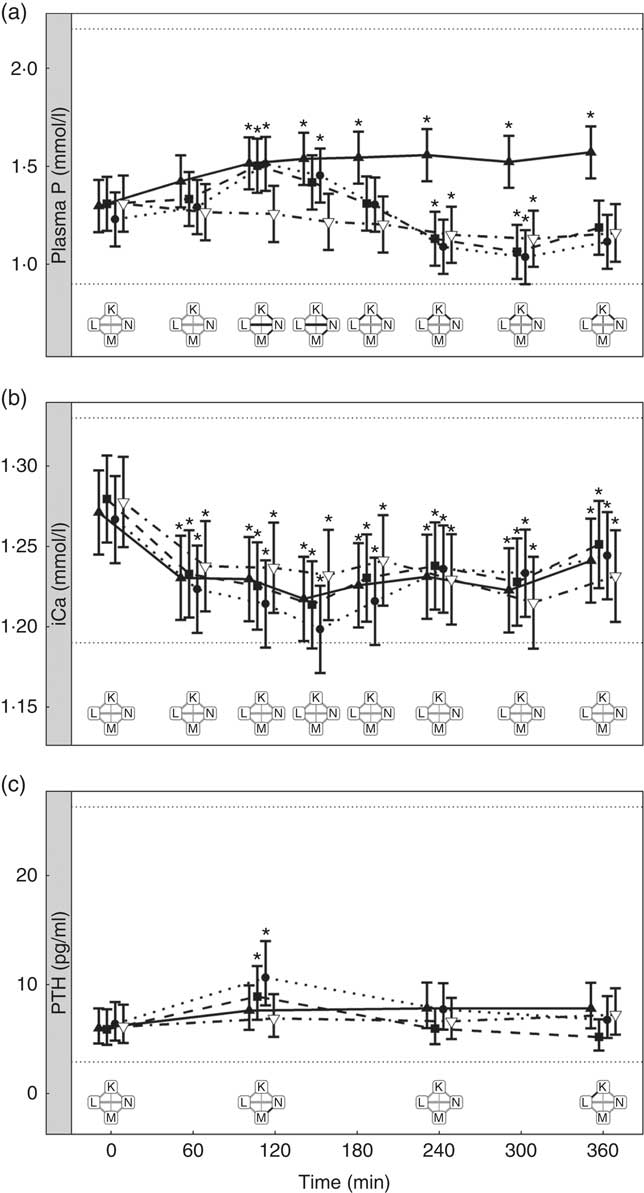
Diets including sources of added inorganic P, diets I (SDHP) and J (sodium tripolyphosphate (STPP), Na5P3O10), both significantly increased plasma P to 1·39 and 1·40 mmol/l, respectively, from baseline (P <0·001; Fig. 5(a)). Diet H, which did not contain any added inorganic P, showed a significant reduction in plasma P at 110 min (P = 0·0139) and 150 min (P = 0·0035) before returning to baseline concentration (Fig. 5(a)). There are no significant differences between diet I and diet J for plasma P kinetics (Fig. 5(a)); however, diet I had a significantly higher AUC (0·48 (95 % CI –0·004, 0·82) mmol/l × h) than diet J (P = 0·0124; Table 3 and Fig. 6) due to a reduction in plasma P for diet J below baseline levels at 190 min (P = 0·0032), 300 min (P = 0·0025) and 360 min (P = 0·0472; Fig. 5(a)). Although iCa was significantly reduced compared with baseline (P ≤ 0·035), this response was not influenced by the form of inorganic P (Fig. 5(b)). PTH was elevated above baseline at 110 min post-meal in both diet I and J (1·31- and 1·28-fold increase, respectively; P <0·001; Fig. 5(c)) before returning to baseline. Diet H showed no observable differences in PTH from baseline concentration (Fig. 5(c)).
Biochemical parameters over the study day for study 3. (a) Plasma phosphorus, (b) ionised calcium (iCa) and (c) parathyroid hormone (PTH). Diet H (![]() ): 3·79 g total phosphorus/4184 kJ (1000 kcal), no added inorganic phosphorus, calcium:phosphorus 1·6. Diet I (
): 3·79 g total phosphorus/4184 kJ (1000 kcal), no added inorganic phosphorus, calcium:phosphorus 1·6. Diet I (![]() ): 3·86 g total phosphorus/4184 kJ (1000 kcal), 1·5 g phosphorus from sodium dihydrogen phosphate/4184 kJ (1000 kcal), calcium:phosphorus 1·59. Diet J (
): 3·86 g total phosphorus/4184 kJ (1000 kcal), 1·5 g phosphorus from sodium dihydrogen phosphate/4184 kJ (1000 kcal), calcium:phosphorus 1·59. Diet J (![]() ): 3·52 g total phosphorus/4184 kJ (1000 kcal), 1·5 g phosphorus from sodium tripolyphosphate/4184 kJ (1000 kcal), calcium:phosphorus 1·7. Values are means, with 95 % CI represented by vertical bars. *Mean values were significantly different from baseline (P <0·05). Reference ranges are shown for each parameter. Significant differences between diets: false (
): 3·52 g total phosphorus/4184 kJ (1000 kcal), 1·5 g phosphorus from sodium tripolyphosphate/4184 kJ (1000 kcal), calcium:phosphorus 1·7. Values are means, with 95 % CI represented by vertical bars. *Mean values were significantly different from baseline (P <0·05). Reference ranges are shown for each parameter. Significant differences between diets: false (![]() ) and true (
) and true (![]() ).
).
AUC data for study 3. Diet H (![]() ): 3·79 g total phosphorus/4184 kJ (1000 kcal), no added inorganic phosphorus, calcium:phosphorus 1·6. Diet I (
): 3·79 g total phosphorus/4184 kJ (1000 kcal), no added inorganic phosphorus, calcium:phosphorus 1·6. Diet I (![]() ): 3·86 g total phosphorus/4184 kJ (1000 kcal), 1·5 g phosphorus from sodium dihydrogen phosphate/4184 kJ (1000 kcal), calcium:phosphorus 1·59. Diet J (
): 3·86 g total phosphorus/4184 kJ (1000 kcal), 1·5 g phosphorus from sodium dihydrogen phosphate/4184 kJ (1000 kcal), calcium:phosphorus 1·59. Diet J (![]() ): 3·52 g total phosphorus/4184 kJ (1000 kcal), 1·5 g phosphorus from sodium tripolyphosphate/4184 kJ (1000 kcal), calcium:phosphorus 1·7. Values are means, with 95 % CI represented by vertical bars. * Mean values were significantly different from baseline (P <0·05).
): 3·52 g total phosphorus/4184 kJ (1000 kcal), 1·5 g phosphorus from sodium tripolyphosphate/4184 kJ (1000 kcal), calcium:phosphorus 1·7. Values are means, with 95 % CI represented by vertical bars. * Mean values were significantly different from baseline (P <0·05).
There were no significant differences in P concentrations in the urine (Table 3).
Study 4 – when added inorganic phosphorus is fixed, does altering the organic phosphorus content of a diet change postprandial peak plasma phosphorus concentrations?
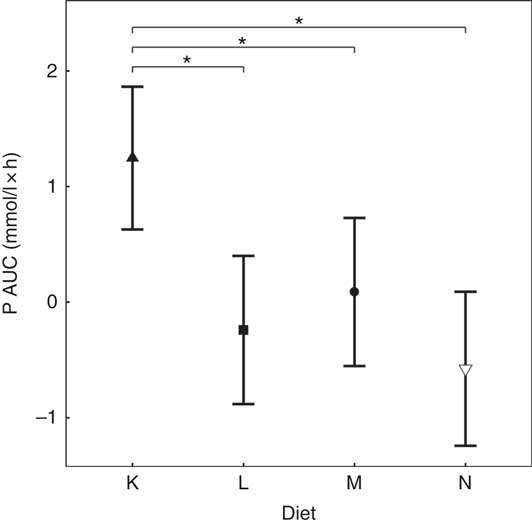
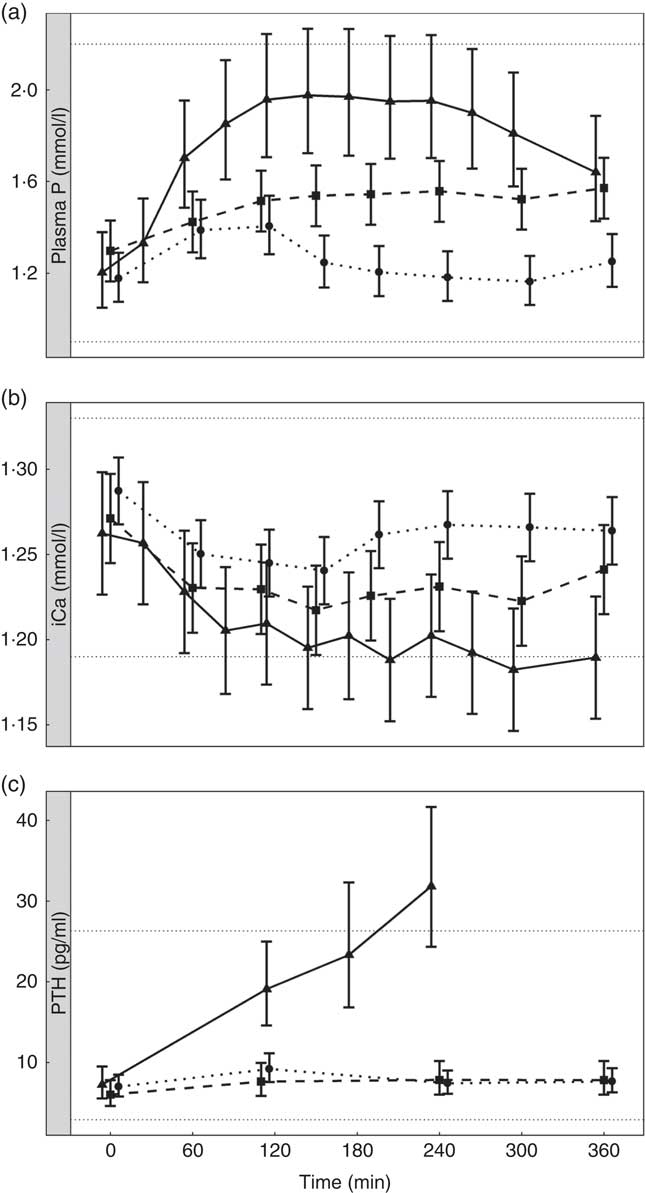
Diets K, L and M showed a peak in the plasma P of 1·57, 1·50 and 1·51 mmol/l, respectively (Fig. 7(a)). This peak was unaffected by organic P content (from raw ingredients) of the diet (P = 1·000), despite this ranging from 2·1 to 4 g/4184 kJ (1000 kcal). Diet N showed a reduction in plasma P at 240 min (P = 0·025) and at 300 min (P = 0·005) before returning to the baseline concentration (Fig. 7(a)). Diets L, M and N did not have significantly different AUC (P ≥ 0·178); however, diet K had a significantly higher AUC than the other diets due to the prolonged elevation of plasma P (1·25 (95 % CI 0·629, 1·86) mmol/l × h, P <0·0014; Table 3). Again iCa was reduced from baseline (P <0·001) with no significant differences detected between diets (Fig. 7(b)). Despite a similar peak in plasma P for diets K, L and M, PTH was found to significantly increase at 110 min only for diets L and M (8·89 and 10·60 pg/ml, respectively; Fig. 7(c)). PTH concentrations following ingestion of diet M were significantly higher than that with diet N at 110 min (P = 0·003) and diet K was significantly higher than diet L at 360 min (P = 0·004; Fig. 7(c)). Diet N showed no observable differences in PTH from baseline concentration.
Biochemical parameters over the study day for study 4. (a) Plasma phosphorus, (b) ionised calcium (iCa) and (c) parathyroid hormone (PTH). Diet K (![]() ): 3·59 g total phosphorus/4184 kJ (1000 kcal), 1·5 g phosphorus from sodium dihydrogen phosphate/4184 kJ (1000 kcal), calcium:phosphorus 0·93. Diet L (
): 3·59 g total phosphorus/4184 kJ (1000 kcal), 1·5 g phosphorus from sodium dihydrogen phosphate/4184 kJ (1000 kcal), calcium:phosphorus 0·93. Diet L (![]() ): 4·17 g total phosphorus/4184 kJ (1000 kcal), 1·5 g phosphorus from sodium tripolyphosphate (STPP)/4184 kJ (1000 kcal), calcium:phosphorus 1·88. Diet M (
): 4·17 g total phosphorus/4184 kJ (1000 kcal), 1·5 g phosphorus from sodium tripolyphosphate (STPP)/4184 kJ (1000 kcal), calcium:phosphorus 1·88. Diet M (![]() ): 5·5 g total phosphorus/4184 kJ (1000 kcal), 1·5 g phosphorus from STPP/4184 kJ (1000 kcal), calcium:phosphorus 1·7. Diet N (
): 5·5 g total phosphorus/4184 kJ (1000 kcal), 1·5 g phosphorus from STPP/4184 kJ (1000 kcal), calcium:phosphorus 1·7. Diet N (![]() ): 4·85 g total phosphorus/4184 kJ (1000 kcal), 0·5 g phosphorus from STPP/4184 kJ (1000 kcal), calcium:phosphorus 1·47. Values are means, with 95 % CI represented by vertical bars. *Mean values were significantly different from baseline (P <0·05). Reference ranges are shown for each parameter. Significant differences between diets: false (
): 4·85 g total phosphorus/4184 kJ (1000 kcal), 0·5 g phosphorus from STPP/4184 kJ (1000 kcal), calcium:phosphorus 1·47. Values are means, with 95 % CI represented by vertical bars. *Mean values were significantly different from baseline (P <0·05). Reference ranges are shown for each parameter. Significant differences between diets: false (![]() ) and true (
) and true (![]() ).
).
There were no significant differences in P concentrations in the urine (Table 3).
Does the dietary calcium:phosphorus ratio influence postprandial plasma phosphorus kinetics?
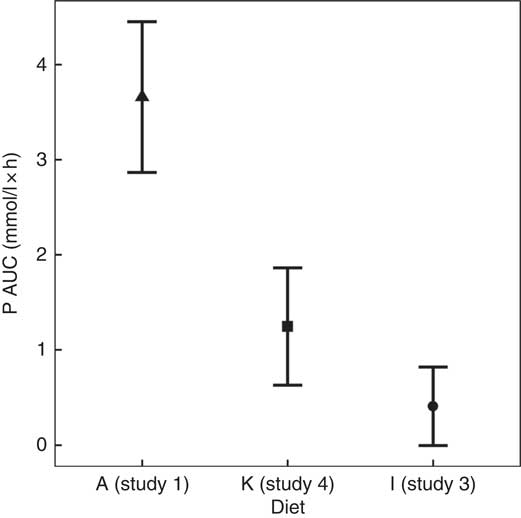
To enable this comparison, data from the separate studies have been combined. While these data cannot be statistically compared, visual inspection of the kinetic profiles shows that SDHP-supplemented diets A (Ca:P 0·56) and K (Ca:P 0·93), both with Ca:P below 1·0, displayed a prolonged elevation of postprandial plasma P compared with diet I (Ca:P 1·59) where the Ca:P was in excess of 1·0 (Fig. 9(a)). These differences in plasma P kinetic profiles resulted in a marked increase in the AUC for diet A (3·65 (95 % CI 2·8, 4·49) mmol/l × h) and diet K (1·25 (95 % CI 0·629, 1·86) mmol/l × h) compared with diet I (0·48 (95 % CI –0·004, 0·82) mmol/l × h; Fig. 10 and Table 3). In addition, changes in iCa (Fig. 9(b)), PTH (Fig. 9(c)) and urinary P excretion (Table 3) were most evident when diet A was fed, which contained the highest P from SDHP of 3·5 g/4184 kJ (1000 kcal) and lowest Ca:P ratio of 0·56, whereas PTH did not change from baseline following ingestion of diets K and I (Fig. 9(c)), which contained 1·5 g P from SDHP/4184 kJ (1000 kcal) and higher Ca:P ratios of 0·93 and 1·59, respectively.
AUC data for study 4. Diet K (![]() ): 3·59 g total phosphorus/4184 kJ (1000 kcal), 1·5 g phosphorus from sodium dihydrogen phosphate/4184 kJ (1000 kcal), calcium:phosphorus 0·93. Diet L (
): 3·59 g total phosphorus/4184 kJ (1000 kcal), 1·5 g phosphorus from sodium dihydrogen phosphate/4184 kJ (1000 kcal), calcium:phosphorus 0·93. Diet L (![]() ): 4·17 g total phosphorus/4184 kJ (1000 kcal), 1·5 g phosphorus from sodium tripolyphosphate (STPP)/4184 kJ (1000 kcal), calcium:phosphorus 1·88. Diet M (
): 4·17 g total phosphorus/4184 kJ (1000 kcal), 1·5 g phosphorus from sodium tripolyphosphate (STPP)/4184 kJ (1000 kcal), calcium:phosphorus 1·88. Diet M (![]() ): 5·5 g total phosphorus/4184 kJ (1000 kcal), 1·5 g phosphorus from STPP/4184 kJ (1000 kcal), calcium:phosphorus 1·7. Diet N (
): 5·5 g total phosphorus/4184 kJ (1000 kcal), 1·5 g phosphorus from STPP/4184 kJ (1000 kcal), calcium:phosphorus 1·7. Diet N (![]() ): 4·85 g total phosphorus/4184 kJ (1000 kcal), 0·5 g phosphorus from STPP/4184 kJ (1000 kcal), calcium:phosphorus 1·47. Values are means, with 95 % CI represented by vertical bars. *Mean values were significantly different from baseline (P <0·05).
): 4·85 g total phosphorus/4184 kJ (1000 kcal), 0·5 g phosphorus from STPP/4184 kJ (1000 kcal), calcium:phosphorus 1·47. Values are means, with 95 % CI represented by vertical bars. *Mean values were significantly different from baseline (P <0·05).
Postprandial biochemical parameters to enable a visual comparison of diet A from study 1 (![]() ), diet I from study 3 (
), diet I from study 3 (![]() ) and diet K from study 4 (
) and diet K from study 4 (![]() ). (a) Plasma phosphorus, (b) ionised calcium (iCa) and (c) parathyroid hormone (PTH). Diet A: 4·8 g total phosphorus/4184 kJ (1000 kcal), 3·5 g P from dihydrogen phosphate (SDHP)/4184 kJ (1000 kcal), calcium:phosphorus 0·56. Diet I: 3·86 g total phosphorus/4184 kJ (1000 kcal), 1·5 g phosphorus from SDHP/4184 kJ (1000 kcal), calcium:phosphorus 1·59. Diet K: 3·59 g total phosphorus/4184 kJ (1000 kcal), 1·5 g phosphorus from SDHP/4184 kJ (1000 kcal), calcium:phosphorus 0·93. Reference ranges are shown for each parameter.
). (a) Plasma phosphorus, (b) ionised calcium (iCa) and (c) parathyroid hormone (PTH). Diet A: 4·8 g total phosphorus/4184 kJ (1000 kcal), 3·5 g P from dihydrogen phosphate (SDHP)/4184 kJ (1000 kcal), calcium:phosphorus 0·56. Diet I: 3·86 g total phosphorus/4184 kJ (1000 kcal), 1·5 g phosphorus from SDHP/4184 kJ (1000 kcal), calcium:phosphorus 1·59. Diet K: 3·59 g total phosphorus/4184 kJ (1000 kcal), 1·5 g phosphorus from SDHP/4184 kJ (1000 kcal), calcium:phosphorus 0·93. Reference ranges are shown for each parameter.
AUC data to enable a visual comparison of diet A from study 1 (![]() ), diet I from study 3 (
), diet I from study 3 (![]() ) and diet K from study 4 (
) and diet K from study 4 (![]() ). Diet A: 4·8 g total phosphorus/4184 kJ (1000 kcal), 3·5 g phosphorus from sodium dihydrogen phosphate (SDHP)/4184 kJ (1000 kcal), calcium:phosphorus 0·56. Diet I: 3·86 g total phosphorus/4184 kJ (1000 kcal), 1·5 g phosphorus from SDHP/4184 kJ (1000 kcal), calcium:phosphorus 1·59. Diet K: 3·59 g total phosphorus/4184 kJ (1000 kcal), 1·5 g phosphorus from SDHP/4184 kJ (1000 kcal), calcium:phosphorus 0·93.
). Diet A: 4·8 g total phosphorus/4184 kJ (1000 kcal), 3·5 g phosphorus from sodium dihydrogen phosphate (SDHP)/4184 kJ (1000 kcal), calcium:phosphorus 0·56. Diet I: 3·86 g total phosphorus/4184 kJ (1000 kcal), 1·5 g phosphorus from SDHP/4184 kJ (1000 kcal), calcium:phosphorus 1·59. Diet K: 3·59 g total phosphorus/4184 kJ (1000 kcal), 1·5 g phosphorus from SDHP/4184 kJ (1000 kcal), calcium:phosphorus 0·93.
Discussion
In an effort to better understand the influence of dietary P sources and levels on postprandial biochemical parameters in healthy neutered cats, a series of studies were undertaken to evaluate plasma P, iCa and PTH kinetic responses. The data presented here demonstrate that added inorganic P sources SDHP and STPP cause a greater, dose-dependent peak in plasma P than natural sources.
An initial proof of principle study was performed to assess whether two distinct diets, with regard to total P, inorganic P inclusion and Ca:P, resulted in marked differences in postprandial plasma P kinetics. The high plasma P concentrations observed with diet A indicate that P is absorbed faster than regulating factors can respond to maintain stable plasma P (Fig. 1(a)). This was accompanied by decreased plasma iCa concentrations and an elevation in plasma PTH, which apparently resulted in higher urinary P excretion. This is consistent with other studies investigating P homoeostasis( Reference Berndt and Kumar 22 , Reference Rosol and Capen 37 ). In addition, Finco et al. ( Reference Finco, Barsanti and Brown 8 ) reported that a diet enriched with inorganic P showed a higher percentage of dietary P recovered in the urine than a fully organic P diet (34·9 % compared with 14·7 %). While PTH release stimulates bone resorption and limits bone formation in humans( Reference Kemi, Karkkainen and Lamberg-Allardt 38 , Reference Kärkkäinen and Lamberg-Allardt 39 ), in rats and hamsters radiolabelled P was found in femur heads 4 h after ingestion( Reference McDonald, Stookey and Muhler 40 ). This PTH-driven bone resorption may have been apparent in diet A from the proof of concept study, where there was a sustained change in plasma P and PTH apparent, and data from feeding this diet over 4 weeks showed increased circulating concentrations of bone-specific alkaline phosphatase (BAP) and C-terminal cross-linking telopeptide of type I collagen (CTX)( Reference Alexander, Stockman and Atwal 20 ). This may be the case for the other diets tested here, but bone turnover markers were not measured in the present study, and the urine data may not be sufficiently sensitive to detect subtle differences between diets in this model. Interestingly, diet K, despite causing a prolonged elevation in plasma P, showed no discernible peak in postprandial PTH, as well as no measurable changes in BAP and CTX when fed during a 30-week feeding trial( Reference Alexander, Stockman and Atwal 20 ). We cannot say for certain that PTH does not have a peak before the 2 h timepoint (as this was not quantified); however, due to the increasing PTH concentration in the pilot study it would seem unlikely. FGF-23 has also been implicated in the homoeostatic control of plasma P concentrations, where FGF-23 release is stimulated in response to high dietary P consumption. This is thought to increase renal P excretion and reduce 1,25-dihydroxyvitamin D3 production by the kidney in order to reduce intestinal absorption of P( Reference Isakova, Gutierrez and Shah 11 ). Significant postprandial changes in FGF-23 were not observed during study 1 (Fig. 1(d)). Although FGF-23 was analysed using a human antibody-based assay, it has been validated for use in cats( Reference Geddes, Finch and Elliott 31 ) and has been used several times by the same research group to show changes in FGF-23 in cats with CKD( Reference Geddes, Biourge and Chang 41 – Reference Geddes, Elliott and Syme 44 ). In Alexander et al. ( Reference Alexander, Stockman and Atwal 20 ) blinded samples were tested and a difference in FGF-23 was found between control and test groups. These data taken together suggest the suitability of the assay for cats, despite the target species for the assay being human. Consequently FGF-23 was not measured beyond the initial proof of principle study. Acute phosphate loading in healthy men has also been shown to have little effect on serum FGF-23 concentrations( Reference Nishida, Taketani and Yamanaka-Okumura 45 ), suggesting that short-term P exposure may not be sufficient to illicit a response. Isakova et al. ( Reference Isakova, Gutierrez and Shah 11 ) suggested that FGF-23 may not be an acute regulator of P handling as well as the potential that the P loading in their study was not sufficiently high enough to elicit a response( Reference Isakova, Gutierrez and Shah 11 ). This latter point seems plausible as there is a study in rats showing that FGF-23 was raised 3 h post-ingestion by a 90 mg P/kg supplement( Reference Takasugi, Akutsu and Nagata 46 ), which is higher than the 72·63 mg/kg BW fed in diet A here. In the first study, increased plasma P was associated with an increase in 24 h urinary P excretion, which is consistent with observations in healthy female volunteers offered inorganic phosphate supplements( Reference Karp, Vaihia and Kärkkäinen 25 , Reference Kemi, Karkkainen and Lamberg-Allardt 38 ). When comparing this data with other cat studies, feeding a purified diet containing 3·3 g P from SDHP/4184 kJ (1000 kcal) for 21 d before a 7 d urine collection showed a renal excretion of almost 80 % (219·02 mg P/kg body weight (BW) per d excreted)( Reference Pastoor, Van’t Klooster and Mathot 3 ). Finco et al. Reference Finco, Barsanti and Brown (8) collected urine over 6 d from cats fed a diet containing 2·1 g P from SDHP/4184 kJ (1000 kcal) and found a renal excretion of 35 % (70·8 mg P/kg BW per d excreted), which agrees with our 35·1 % (56·6 mg P/kg BW per d). The disparity between the pilot study data here and the data containing a similar amount of SDHP may be due to the purified diet, by definition this diet contains more readily available ingredients and thus will be more easily absorbed.
To further understand the dietary factors responsible for the marked increase in plasma P observed in study 1, a series of follow-up studies were undertaken to determine the effect of added inorganic P, source of P and increasing total P using organic sources of P on postprandial plasma P kinetics. In interrogating these data, an observation related to Ca:P was also noted and will be discussed as a factor responsible for differences in the regulation of postprandial P.
When dietary inorganic P inclusion was increased from 0 to 1·5 g/4184 kJ (1000 kcal) while maintaining a fixed Ca:P, plasma P was elevated in a dose-dependent manner (Fig. 3(a)). At least under the conditions applied in the present studies, added inorganic P appears primarily responsible for driving the increase in postprandial plasma P. In addition, the present data demonstrate that despite increasing the organic P inclusion from 2·1 to 4 g/4184 kJ (1000 kcal), while maintaining a fixed added inorganic P of 1·5 g/4184 kJ (1000 kcal) and Ca:P >1·5, there was no difference in the peak plasma P concentrations (Fig. 7(a)) or plasma P AUC (Fig. 8) apparent between the diets. While this supports other studies reporting that inorganic sources of P are readily digested and highly bioavailable (80–100 %) compared with organic P sources (for 40–60 %), there are limited data clearly describing the influence of different dietary sources of P on the regulation of postprandial plasma P( Reference Pastoor, Van’t Klooster and Mathot 3 , Reference Finco, Barsanti and Brown 8 , Reference Calvo, Moshfegh and Tucker 47 ). Finco et al. Reference Finco, Barsanti and Brown (8) showed that cats fed a diet with 2·1 g P from SDHP/4184 kJ (1000 kcal) showed an increase in plasma P concentration from just under 5 mg/dl (1·61 mmol/l) to a concentration of 8 mg/dl (2·58 mmol/l) 2 h after feeding, which started to return towards baseline at 6 h, compared with a 100 % natural P source diet which did not change over 8 h post-meal.
Studies 3 and 4 suggest that diets formulated using SDHP v. STPP caused subtle differences in the postprandial plasma P concentrations. This response is broadly in agreement with the findings reported by Karp et al. ( Reference Karp, Vaihia and Kärkkäinen 25 ), where ingestion of monophosphate and tripolyphosphate supplements by young healthy women resulted in similar changes in serum phosphate, but urinary Ca excretion reduced following the tripolyphosphate compared with the monophosphate supplement. This was suggested to be due to tripolyphosphate binding more Ca than the monophosphate supplement in the intestine( Reference Karp, Vaihia and Kärkkäinen 25 ). The lack of difference between plasma kinetic profiles of mono- and tripolyphosphates may be due to monophosphates being the only form of P that can be absorbed by the intestine and cross into the bloodstream, according to data in serially killed rats( Reference Fingerhut, Ruf and Lang 48 ). The data shown here demonstrate that SDHP had a larger P AUC compared with that seen in STPP, suggesting that as a source of inorganic P it may have a greater impact on homoeostasis of plasma P than STPP in the cat. Whether this difference is biologically meaningful is unclear, but this finding warrants further investigation. In dogs, it has been shown that added inorganic P salts containing Na and K increase 2 h postprandial serum P and PTH above normal ranges( Reference Dobenecker and Siedler 21 ).
The bioavailability of dietary P is considered to be influenced not only by the P source and content of the diet but also by the Ca:P, with an increase in the Ca:P from around 1 to nearly 2, reducing P digestibility and urinary P excretion( Reference Kienzle, Thielen and Pessinger 2 , Reference Mack, Alexander and Morris 7 , Reference Pastoor, Opitz and Van’t Klooster 49 – Reference Kienzle, Pessinger and Thielen 51 ). To investigate the influence of Ca:P on postprandial plasma P kinetics, a composite analysis of the present data was undertaken. This highlighted that diets A and K with a Ca:P <1 had a significantly higher plasma P AUC (Fig. 10) compared with those with a Ca:P >1·0, with this response primarily resulting from a prolonged elevation in plasma P (Fig. 9). Interestingly, despite the remarkably similar total and added inorganic P levels between diets I and K, plasma P returned to baseline within 3 h when cats were fed diet I with a Ca:P of 1·59, adding further support that this response may have resulted from the difference in dietary Ca:P. The mechanism behind the reduction in bioavailability due to Ca:P in diet stated in the literature is thought to be due to extra Ca being available to form insoluble, and hence non-bioavailable, Ca–Mg–phosphate complexes in the intestinal tract( Reference Pastoor, Van’t Klooster and Mathot 50 ). This insoluble complex formation is likely to be the reason that increasing Mg content of the diet has also been shown to decrease the percentage of P absorption and urinary P content( Reference Pastoor, Van’t Klooster and Opitz 52 ). The availability of Ca in the diet is also essential for its ability to form these insoluble complexes. Investigation into the differences between calcium chloride and calcium carbonate supplementation has found that calcium chloride had better capacity than calcium carbonate for reducing the presence of P in the urine, increasing retention( Reference Pastoor, Opitz and Van’t Klooster 49 ). It is important to note that it was not only the Ca:P that differed between diets I and K; diet K also contained less crude fibre and had a negative food base excess (Table 2). Crude fibre increases faecal DM and bulk, which in turn can decrease apparent digestibility of P and other minerals( Reference Prola, Dobenecker and Mussa 53 ). The potential impact of the base excess of the diet has been studied in cats, where although there was no effect on plasma P concentrations or apparent digestibility of P, the excretion of other minerals such as Ca are known to be affected by this and therefore could have contributed to some of the findings shown here( Reference Ching, Fettman and Hamar 54 , Reference Kienzle, Schuknecht and Meyer 55 ). Another factor that may alter the digestibility and absorption of P is the diet matrix. Diets based on wet chunk or dry kibble technologies (or format as stated in Table 1) may affect the availability of P through changes in transit times, most likely driven by differences in energy density between the matrices( Reference Coradini, Rand and Filippich 56 , Reference Vist and Maughan 57 ). Visual assessment of data from diets C and L, both wet chunk formats, compared with diet J, a dry kibble diet, suggests that plasma P starts to rise after 60 min in the dry format, while in wet plasma P was not significantly different to baseline at this time point. Aside from this difference, there appears to be little to distinguish between the diet formats in the small set of diets studied here. To draw further conclusions would require a comparison of more diets within the same study. One point to note is that diets for these studies were formulated using similar raw materials (within diet matrix) included at various ratios to alter the total P or Ca:P. As such, we have no information on whether other raw materials (such as alternative Ca or P sources) would have the same effect on plasma P concentrations.
Diets A and K have been shown to cause adverse effects on renal function in cats when fed over prolonged periods( Reference Alexander, Stockman and Atwal 20 ). This observation is broadly in agreement with Dobenecker et al. ( Reference Pastoor, Van’t Klooster and Mathot 3 , Reference Dobenecker, Webel and Reese 6 ) who reported an increase in indicators of kidney dysfunction when a diet high in added inorganic P was fed and compared with a control diet low in both total and supplemented P. Diets A and K displayed a distinct kinetic profile compared with all the other diets tested, showing an extended elevation in plasma P across the 6 h postprandial period investigated. The differences in plasma P kinetic profiles, iCa and PTH concentrations observed between diets A and K suggest differences in the regulation of P homoeostasis. Differing levels of SDHP in the two diets apparently explain the higher peak in plasma P in cats fed diet A, which also had a lower Ca:P than diet K. These two factors may explain the marked increase in plasma PTH, decrease in plasma iCa and increased urinary P excretion observed in cats fed diet A compared with diet K. Diet A also contained higher Na (3·33 g/4184 kJ (1000 kcal) compared with 1·35 g/4184 kJ (1000 kcal)) and less crude fibre (5·2 g/4184 kJ (1000 kcal) compared with 7·49 g/4184 kJ (1000 kcal)) than diet K. Increasing Na has been reported to increase P absorption of minerals through increasing Na+-dependent uptake of phosphate in rats( Reference Marks, Lee and Nadaraja 58 ). In addition, diets with reduced crude fibre show increased absorption of minerals in humans( Reference Reinhold, Faradji and Abadi 59 ). With these differences in mind, it is surprising to note that when 5 d digestibility was measured by Alexander et al. ( Reference Alexander, Stockman and Atwal 20 ) the mean apparent digestibility of P was 49·3 % for diet A and 51·5 % for diet K and may indicate that the dietary differences are not important for digestibility in this case. The subtle reduction in plasma P towards the end of this period in cats fed diet A indicates that P regulatory factors (e.g. PTH) are likely triggered and responding to the large P load in an attempt to return plasma P to normal. This somewhat mimics the response reported by Hazim et al. ( Reference Hazim, Hlais and Ghattas 26 ), when healthy men ingested a 500 mg inorganic P supplement with a high fat meal. The sustained plasma P levels 6 h postprandially make it distinctly possible that plasma P may still be elevated at the time of the next feed, potentially exposing the kidneys and other tissues to incrementally higher P concentrations with each meal, which may explain the adverse effects that were observed when these diets were fed to cats over prolonged periods( Reference Alexander, Stockman and Atwal 20 ). Consumption of a diet with a low Ca:P has been shown to cause nutritional hyperparathyroidism, resulting in enlargement of the parathyroid in cats, presumably as an attempt to maintain plasma Ca concentration( Reference Pastoor, Van’t Klooster and Mathot 3 ). The increase in PTH stimulates intestinal absorption of Ca and P and promotes urinary P excretion( Reference Pastoor, Van’t Klooster and Mathot 3 ). A prolonged elevation in plasma P postprandially could also lead to increases in PTH production and thereby a reduction in plasma iCa. Increased FGF-23 production has been suggested to aid in maintaining P homoeostasis( Reference Isakova, Gutierrez and Shah 11 , Reference Dobenecker and Siedler 21 ). As suggested by data herein and Alexander et al. ( Reference Alexander, Stockman and Atwal 20 ), FGF-23 may respond to high elevated plasma P levels than PTH at a later stage. Studies have also shown that if FGF-23 levels remain high, there is a reduced PTH response to low plasma Ca concentrations, which could be a mechanism by which kidney damage may occur if highly available dietary P is consumed long-term( Reference Wetmore, Santos and Mahnken 27 ). Quantification of regulatory factors involved in P homoeostasis are therefore essential to understanding the potential impact of high levels of dietary P.
In this study, inorganic P sources were found to dose-dependently increase plasma P levels, similarly altering plasma PTH; this response was apparently independent of total P and Ca:P. The exceptions to this peak PTH at 120 min were diet A, which was increased at 4 h post-meal as discussed above, and diet K, which did not cause an increase in PTH during the trial day despite the sustained elevation of plasma P. In addition, in agreement with an earlier rat study, this increase in PTH occurred without a corresponding significant reduction in iCa between dietary manipulations, suggesting that plasma P may directly affect PTH production( Reference Hernández, Concepción and Rodríguez 60 ). Although the plasma P data continued to show differences between diets in the studies following the proof of principle study, differences were not detected in either iCa or urinary excretion of P. This may be due to the lower added inorganic P inclusion levels (0–1·5 g/4184 kJ (1000 kcal)) compared with diet A (3·5 g/4184 kJ (1000 kcal)). Consequently there may not have been sufficient stimulus, induced by added inorganic P to the diet, during the sampling day to induce a decrease in iCa and/or a significant increase in urinary P excretion. A lack of significant differences between diets for 24 h urinary P data may be due to two factors. First, no other diets studied in this programme provoked such a large increase in plasma P or PTH (nor a decrease in iCa) as diet A. This may indicate a threshold must be reached before any changes in urinary excretion of P are measurable. Second, the methodology used meant that there was no guarantee of an empty bladder before commencing the collection and no guarantee of the bladder being emptied before finishing the collection. As such it is possible that not all the excreted P was collected from all cats on the study day at every collection point. Interestingly, despite no measurable differences in 24 h P excretion, diet K resulted in increased urinary excretion of P when fed over several weeks compared with the control group( Reference Alexander, Stockman and Atwal 20 ). Thus, a single feed and a 24 h urine collection may not be enough to identify more subtle differences between diets. In summary, this also indicates that although this model is useful in showing differences between diets following the 6 h after a single feed, long-term feeding studies are required to determine the consequences of fluctuations in plasma P kinetics. From the data presented here, it is not possible to deduce whether similar kinetic profiles will be observed after a second meal or to extrapolate responses beyond the 6 h time frame. In addition, it should be recognised that firm conclusions around the mechanisms governing P homoeostasis may be limited due to the omission of markers of bone resorption and the methods employed during the 24 h urine collections.
In conclusion, the results of the present series of studies add to the growing literature, suggesting that inclusion of added inorganic P in diets results in a dose-dependent increase in plasma P, with a concurrent elevation in PTH( Reference Hazim, Hlais and Ghattas 26 , Reference Siedler and Dobenecker 29 ). This relationship is far from straightforward, however, with a sustained postprandial elevation in plasma P apparent when diets with a Ca:P <1·0 were fed compared with that seen when the diet Ca:P was >1·5. In addition, we present limited evidence that the source of added inorganic P can influence postprandial P kinetics, but further work is required to characterise the responses to other forms relevant to food manufacturing. In contrast, organic sources of P at the levels fed here do not appear to influence postprandial plasma P kinetics or P regulatory factors. Here, we present a model that can be applied to evaluate the short-term impact of a variety of dietary factors on short-term, postprandial regulation of plasma P homoeostasis. While some inferences to long-term feeding of the same diets have been made in the present manuscript, it is important to recognise that these data alone cannot infer the safety of a given diet composition.
Acknowledgements
The authors would like to acknowledge the skills and expertise of colleagues at WALTHAM in the care, training and sampling of the cats and for the analysis of samples collected throughout the studies. The authors recognise the contribution of Jonathan Elliott and Anna Riddle (The Royal Veterinary College, London) in the analysis of the PTH and FGF-23 samples.
This work was funded by Mars Petcare. The WALTHAM® Centre for Pet Nutrition is a fundamental research centre for Mars Petcare.
J. C. C., D. W. L., R. B. and P. W. conceived the project. J. C. C., G. T., M. G., D. W. L., R. B. and P. W. developed the overall research plan and had study oversight. J. C. C., G. T. and M. G. conducted the research and oversaw the analysis of the samples. R. S. and A. C. performed the statistical analysis. J. C. C. authored the paper with G. T., M. G., D. W. L., R. B. and P. W.
J. C. C., R. S., A. C., G. T., M. G., D. W. L., R. B. and P. W. were employees of Mars Petcare during the study.


 Open access