



Weight-cutting strategies, particularly rapid and gradual weight loss in weight-sensitive sports (e.g. wrestling, boxing, judo and mixed martial arts), have been a continuing concern for sports scientists and coaches. Gradual weight loss involves moderate energy restriction for which the primary cause of weight loss is body fat decrement(Reference Turocy, DePalma and Horswill1,Reference Economos2,Reference Garthe, Raastad and Refsnes3) . In this regard, we have previously shown that rapid weight loss resulted in a more catabolic environment through greater decrements in lean mass compared with gradual weight loss in competitive wrestlers(Reference Motevalli, Dalbo and Attarzadeh4). In a more recent meta-analytic study, we have shown the beneficial effects of gradual weight loss compared with rapid weight loss on fat mass (FM), body fat percentage (BFP) and RMR in individuals with overweight/obesity(Reference Ashtary-Larky, Bagheri and Abbasnezhad5). Importantly, research shows that the catabolism of lean mass after rapid weight loss can negatively influence muscle strength, power and functionality(Reference Mettler, Mitchell and Tipton6,Reference Rashidlamir, Goodarzi and Ravasi7,Reference Webster, Rutt and Weltman8,Reference Koral and Dosseville9) , performance components that are highly required in wrestling(Reference García-Pallarés, López-Gullón and Muriel10,Reference Ramirez-Velez, Argothyd and Meneses-Echavez11) . Therefore, gradual weight loss may be more effective in improving body composition and muscular performance than rapid weight loss.
Research has also shown that myokines and hormones affect body composition and subsequently functional performance. For instance, myostatin (MST) serves as a negative regulator of skeletal muscle mass (SMM) and differentiation(Reference Elkasrawy and Hamrick12,Reference Bagheri, Rashidlamir and Motevalli13) . However, follistatin (FST) functions as the positive regulator of the MST by binding to its active form and inhibiting its binding to the activin type IIB receptor(Reference Amthor, Nicholas and McKinnell14), resulting in the positive regulation of SMM. Insulin-like growth factor-1 (IGF-1) is also known as a major positive regulator of SMM identical to FST(Reference Barbé, Kalista and Loumaye15). The role of IGF-1 in muscle hypertrophy and MST inhibition has been indicated in previous literature(Reference Barbé, Kalista and Loumaye15). Moreover, MST knockout or FST overexpression results in increased SMM(Reference Wagner, McPherron and Winik16,Reference Lee17) and decreased body fatness(Reference McPherron and Lee18,Reference Yang, Ratovitski and Brady19) . Conversely, elevated MST concentrations resulted in increased body fat in mice and extremely obese females(Reference Reisz-Porszasz, Bhasin and Artaza20,Reference Hittel, Berggren and Shearer21) . Weight loss has been shown to create MST or FST alterations. It has been previously reported that 2 d of food deprivation significantly decreased SMM and increased MST expression in the fast-twitch fibres of the anterior tibialis muscle in mice(Reference Allen, Cleary and Lindsay22). Additionally, Flanagan et al. reported an elevation in FST concentrations in obese females following a long-term weight loss intervention(Reference Flanagan, Linder and Mejhert23). We previously reported a significant increase in MST and a decrease in FST concentrations following rapid weight loss compared with gradual weight loss in competitive wrestlers(Reference Motevalli, Dalbo and Attarzadeh4). Collectively, these reports indicate an obvious relationship between weight loss and changes in MST and FST concentrations.
Nutritional supplements are broadly used by athletic populations to improve body composition and exercise performance. Spirulina, spiral blue-green microalgae and filamentous cyanobacterium related to the Oscillatoriaceae family(Reference Kulshreshtha, Jarouliya and Bhadauriya24,Reference Yousefi, Saidpour and Mottaghi25) have received recent attention due to their nutrient composition, which includes phytochemicals, essential and non-essential amino acids, essential fatty acids, fibres, vitamins and minerals(Reference Moradi, Ziaei and Foshati26). Moreover, spirulina supplementation has been shown to improve metabolic abnormalities such as non-alcoholic fatty liver disease by decreasing liver enzymes aspartate aminotransferase (AST), alanine aminotransferase (ALT) and γ-glutamyl transferase(Reference Yousefi, Saidpour and Mottaghi25). Importantly, spirulina is a cost-efficient supplement that is widely available and may have favourable effects on weight loss(Reference Moradi, Ziaei and Foshati26). Studies regarding the effects of spirulina supplementation on exercise performance and body composition in athletes are lacking. Additionally, the decrements of lean mass following rapid weight loss periods are obvious(Reference Motevalli, Dalbo and Attarzadeh4). Because gradual weight loss results in a lesser catabolic environment, fluid loss and lean mass decrements than rapid weight loss(Reference Garthe, Raastad and Refsnes3,Reference Motevalli, Dalbo and Attarzadeh4,Reference Ashtary-Larky, Bagheri and Abbasnezhad5) , it is becoming the go-to weight loss strategy in weight-class sports, mainly competitive wrestlers(Reference Motevalli, Dalbo and Attarzadeh4). Therefore, we evaluated the effects of spirulina supplementation during gradual weight loss on MST, FST, IGF-1, body composition and liver enzymes (ALT and AST) in competitive wrestlers.
Experimental methods
Subjects
Forty trained male wrestlers (age: 22 (sem 2) years, training experience: 4·4 (sem 1) years and stature: 175 (sem 4·4) cm) were recruited to participate in this study. Subjects were considered trained if they had wrestling training at least three times a week for at least 3 years before the study. Other than being trained male wrestlers, inclusion criteria composed of not taking any dietary supplements or medications for at least 6 months before enrolment in the study, no known medical issues or diseases, no smoking or alcohol consumption, no history of endocrine dysfunction, BFP of 6 % or greater and being competitively overweight which was defined as having a current body mass (BM) at least 4 % heavier than the weight in which the participant normally competes(Reference Motevalli, Dalbo and Attarzadeh4). Possible subjects were excluded from participating through failure to meet any of the previously stated inclusion criteria. Additional criteria for exclusion were a non-willingness to continue nutritional protocols. A physician using the Physical Activity Readiness Questionnaire and medical health/history questionnaire evaluated all these criteria. Subjects provided informed consent before study enrolment, and all protocols were approved by the Institutional Review Board of the Islamic Republic of Iran’s wrestling Federation (IAWF.95.4.20) and carried out according to the Declaration of Helsinki.
Design
This study was a randomised, placebo-controlled and double-blinded intervention. Prior to baseline measurements, subjects were fully acquainted with all testing and experimental procedures. Subjects were randomly assigned to one of two groups: gradual weight loss + spirulina (SP; n 20) or gradual weight loss + placebo (PL; n 20). All subjects had to fill out a 10-d food diary to determine their basal energy and macronutrient consumption. After completion of the 10-d food diary, subjects underwent an 8-h night fast and submitted a report to the laboratory for baseline testing between 08.00 and 08.30 hours the next day. Subsequently, subjects began a 12-d progressive energetic restriction diet to achieve the desired weight reduction. Subjects reported to the laboratory on day 13 for post-testing during the same time in the morning following identical procedures as baseline testing. The study schematics are illustrated in Fig. 1.
Schematic of the study design
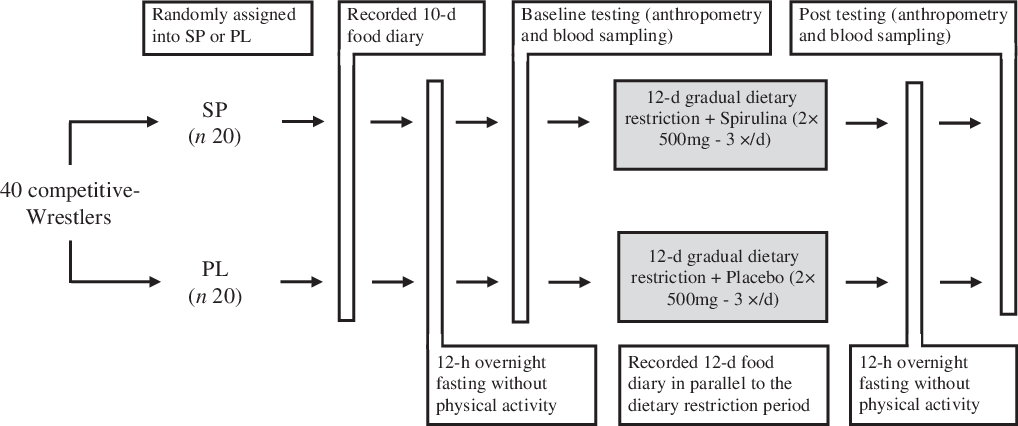
Gradual weight loss protocol
Subjects in both groups lost weight based on a 12-d diet developed by Rashidlamir et al. (Reference Rashid-lamir, Goodarzi and Ravasi27), which gradually restricts energy content over time. All subjects were required to reduce baseline BM by 4 %(Reference Motevalli, Dalbo and Attarzadeh4). The weight loss protocol is presented in online Supplementary Table S1. Subjects were able to consume water ad libitum and did not decrease their energetic consumption during breakfast(Reference Motevalli, Dalbo and Attarzadeh4). Subjects in both groups were involved in daily moderate physical activity lasting 20–40 min, which consisted of technical training.
Spirulina supplementation
Using a double-blind protocol, subjects in the SP group received two tablets of spirulina (each tablet contained 500 mg) before each meal (breakfast, lunch and dinner). Additionally, subjects in the PL group received two tablets of placebo (500 mg of starch) before each meal that were similar in appearance to the spirulina-filled capsules. The nutritional value of spirulina per each 100 g is all essential and non-essential amino acids, fat (monounsaturated, polyunsaturated), carbohydrates, vitamins (A, B1, B2, B3, B5, B6, B9, B12, choline, C, D, E, K), minerals (Ca, Fe, Mg, Mn, P, K, Na, Zn) and water. The selected dose and time of ingestion were based on a prior study(Reference Koozehchian, Kazaj and Sarshin28). The supplementation was monitored by phone calls, WhatsApp or Telegram software.
Anthropometric and body composition measurements
Subjects were also advised to report to the laboratory for testing in a normally hydrated state after an overnight fast. Upon arrival in the laboratory, subjects were instructed to empty their bladders immediately before measurements. BM was measured with a digital scale (SECA) to the nearest 0·1 kg. The subject’s stature was measured with a stadiometer (SECA) to the nearest 0·1 cm. BFP, FM and SMM were assessed by a multi-frequency bioelectrical impedance device (Inbody 720) as previously explained(Reference Bagheri, Rashidlamir and Ashtary-Larky29). The test–retest reliability of the bioelectrical impedance method was high (R = 0·95–0·99).
Blood sampling and laboratory measurements
Fasting samples (5 ml) were taken from the cubital vein using standard procedures following an 8-h overnight fast(Reference Bagheri, Rashidlamir and Ashtary-Larky30). Subjects also did not participate in any training for 24 h before reporting to the laboratory between 08.00 and 08.30 hours. Blood samples were clotted and stored for 20 min at room temperature before being centrifuged at 3000 revolutions per minute for 20 min. Spun serum was removed from the centrifuge and frozen at –70°C. Serum MST (human MST, Zellbio Gmbh) and FST (human FST, Zellbio Gmbh) concentrations were measured in duplicate using ELISA kits according to the manufacturer’s instructions. The intra-assay and inter-assay CV were <10 % and 12 % for all of the serum markers, respectively. ALT and AST enzymes were measured using Biolabo (France) based on the manufacturer’s instructions.
Nutrient intake and dietary analysis
Subjects were asked to maintain a food diary for the duration of the study. Besides, subjects in both groups submitted 10-d food records to establish baseline energy and macronutrient consumption and an additional 12-d food diary to record energy and the consumption of macronutrients during gradual weight loss protocol. Each item of food was individually entered into Diet Analysis Plus version 10 (Cengage), and total energy consumption and the amount of energy derived from proteins, fats and carbohydrates were assessed.
Statistical analysis
A priori sample size calculation was carried out using the G*Power analysis software(Reference Faul, Erdfelder and Lang31). Our rationale for sample size was according to our previous study that evaluated the effects of gradual v. rapid weight loss on FST and MST concentrations in competitive wrestlers(Reference Motevalli, Dalbo and Attarzadeh4). Based on α = 0·05, a power (1-β) of 0·85, the analysis revealed that a total sample size of at least thirty subjects (n 15 per group) was needed to have sufficient power to detect significant changes in the FST and MST concentrations. However, we recruited an extra 25 % of subjects (twenty subjects per group) to ensure that we achieved our target sample size in case of potential dropouts. The normality of the data was confirmed using the Shapiro–Wilk test. The Student’s t test was used for group comparisons at baseline. A two × two ANOVA with repeated measures (time (baseline v. post-test) × group (SP v. PL)) was used to determine the differences between the treatments. Pearson’s linear regression was used to examine the relationship between continuous variables with r 2 values of >0·02, 0·13 and 0·26 as the threshold for weak, moderate and substantial effects, respectively, as recommended(Reference Cohen32). Statistical significance was set at P < 0·05. Cohen’s d effect size was calculated as post-training mean minus pre-training mean/pooled pre-training standard deviation means(Reference Cohen33). All analyses were performed using SPSS (version 24.0), and Graphpad Prism (version 8.4.3) was used to produce Fig. 2–4.
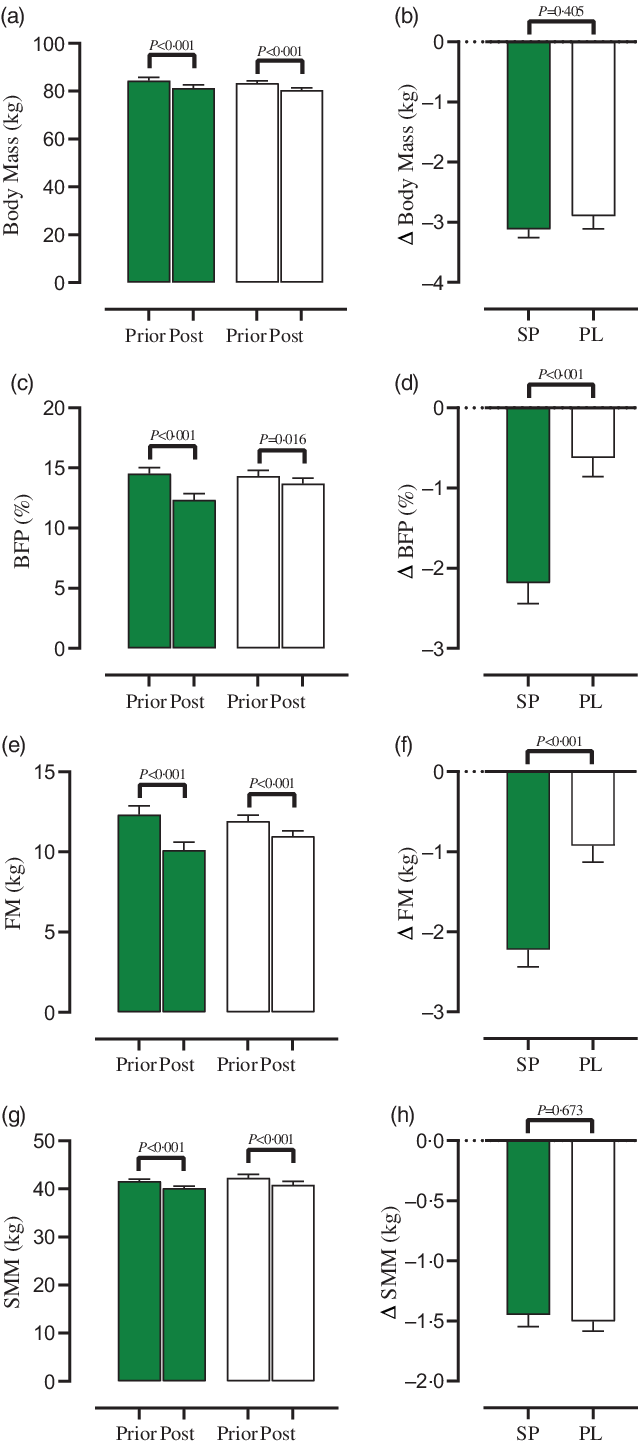
Effect of both groups on body composition markers. (a) Body mass (kg), (b) Δ body mass (kg), (c) body fat percentage ((BFP), (%)), (d) Δ body fat percentage ((BFP), (%)), (e) fat mass (FM), (f) Δ fat mass (FM), (g) skeletal muscle mass ((SMM), (kg)) and (h) Δ skeletal muscle mass ((SMM), (kg)). Error bars represent standard error of the mean.  SP;
SP;  PL.
PL.
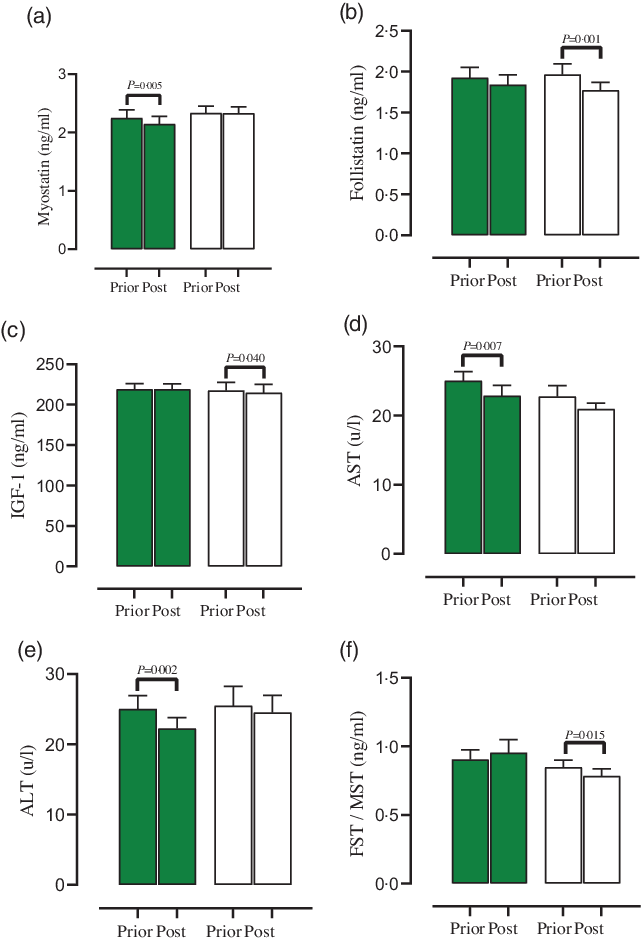
Effect of both groups on blood markers. (a) Myostatin (ng/ml), (b) Follistatin (ng/ml), (c) Follistatin:Moystatin ((FST:MST), (ng/ml)), (d) Aspartate aminotransferase ((AST), (u/l)), (e) Alanine aminotransferase ((ALT), (u/l)), (f) IGF-1 (ng/ml). Error bars represent standard error of the mean. SP; PL.
Relationships between change in skeletal muscle mass (Δ SMM (kg)) and change in markers (Δ (marker)) and between change in body fat percentage (BFP) and change in markers (Δ (marker)). a1 and a2) Correlation matrix of ΔBFP and ΔSMM with markers, r values as shown. Key indicates magnitude of r (yellow = −1 green = 1, white = 0). (b)–(e) linear regression (Pearson’s) of Δ (marker) as a function of Δ body fat% (%), (F)–(I) linear regression (Pearson’s) of Δ (marker) as a function of Δ SMM (kg). Linear regression indicated by black line, 95 % CI indicated by green and yellow zones. Open white circles indicate PL group and closed black circles indicate SP group.  SP;
SP;  PL.
PL.

Results
Subjects and dietary compliance
Compliance with the gradual weight loss strategy and spirulina supplementation was 97·5 % of subjects in both SP and PL groups. No adverse events were reported from spirulina and placebo supplementation. There was a significant main effect of time for kilocalories, protein, fat and carbohydrate intake for both groups (P < 0·001). Subjects in both groups consumed significantly less kilocalories, protein, fat and carbohydrates on days 1–4, 5–8 and 9–12 of the gradual weight loss protocol compared with baseline (P < 0·05). Subjects in the SP group consumed significantly less fat than baseline and significantly less than days 1–4 compared with days 5–8 (P < 0·05). Both groups consumed significantly less kilocalories, protein and carbohydrates on days 9–12 compared with days 1–4 (P < 0·05). However, no significant group × time was observed for any macronutrient consumption (P > 0·05, online Supplementary Table S2).
Body composition
A significant main effect of time was observed for BM (Fig. 2(a), P < 0·001) and SMM (Fig. 2(g), P < 0·001). A significant group × time was detected for BFP (Fig. 2(c), P < 0·001) and FM (Fig. 2(e), P < 0·001). BM (SP = –3·1 kg, 95% CI –3·4, –2·8, d = 4·8, P < 0·001 and PL = –2·9 kg, 95% CI –3·3, –2·4, d = 3·1, P < 0·001), BFP (SP = –2·1 %, 95% CI –2·7, –1·6, d = 1·9, P < 0·001 and PL = –0·6 %, 95% CI –1·1, –0·1, d = 0·6, P < 0·016), FM (SP –2·2 kg, 95% CI –2·6, –1·7, d = 2·2, P < 0·001 and PL = –0·9 kg, 95% CI –1·3, –0·5, d = 1, P < 0·001) and SMM (SP = –1·4 kg, 95% CI –1·6, –1·2, d = 3·2, P < 0·001 and PL = –1·5 kg, 95% CI –1·6, –1·3, d = 4·2, P < 0·001) significantly decreased in both groups (P < 0·05). The changes in BFP (Fig. 2(d), P < 0·001) and FM (Fig. 2(f), P < 0·001) were significantly higher in SP compared with PL group, while the changes in BM (Fig. 2(b), P = 0·405) and SMM (Fig. 2(h), P = 0·673) were not differed between both groups.
Endocrine markers
A significant main effect of time was observed only for FST (Fig. 3(b), P = 0·030) concentrations. In addition, a significant group × time was detected for MST (Fig. 3(a), P = 0·021) and FST:MST (ratio) (Fig. 3(c), P = 0·020) concentrations. MST (SP = –0·1 ng/ml, 95 % CI –0·1, –0·03, d = 0·7, P = 0·005) concentrations significantly diminished in SP group, while FST:MST (PL = –0·06 ng/ml, 95 % CI –0·1, –0·01, d = 0·6, P = 0·015) concentrations significantly decreased in PL group. Furthermore, FST (PL = –0·1 ng/ml, 95 % CI –0·3, –0·08, d = 0·6, P = 0·001) and IGF-1 (PL = –2·6 ng/ml, 95 % CI –5·1, –0·1, d = 0·5, P = 0·040, Fig. 3(f)) concentrations significantly decreased in PL group.
Liver enzymes
A significant main effect of time was observed for AST (Fig. 3(d), P = 0·027) and ALT (Fig. 3(e), P = 0·001) concentrations. AST (SP = −2·1 u/l, 95 % CI −3·6, −0·6, d = 0·6, P = 0·007) and ALT (SP = −2·7 u/l, 95 % CI −4·3, −1·1, d = 0·8, P = 0·002) significantly decreased in SP group. However, no significant group × time difference was observed for both enzymes (P > 0·05).
Correlations
To evaluate any potential relationships between gradual weight loss-induced changes of BFP (ΔBFP) and SMM (ΔSMM) on myokines, IGF-1 and liver enzymes (Δ (marker), independent of SP or PL group), first, two correlation matrix was generated (Fig. 4-a1 and a2). FST, IGF-1 and FST:MST showed a strong negative relationships with ΔBFP (FST:MST showed the strongest relationship), while MST showed a strong positive relationship. MST, FST and IGF-1 showed a weak negative relationship with ΔSMM, while FST:MST showed a moderate positive relationship. Pearson correlation analysis revealed that there was no significant association between ΔBFP and ΔMST (r = 0·30, P = 0·060, Fig. 4(b)), ΔFST (r = –0·30, P = 0·068, Fig. 4(c)) and ΔIGF-1 (r = –0·30, P = 0·067, Fig. 4(d)). Similarly, no association was observed for ΔSMM with ΔMST (r = –0·04, P = 0·797, Fig. 4(f)), ΔFST (r = –0·07, P = 0·687, Fig. 4(g)) and ΔIGF-1 (r = –0·07, P = 0·664, Fig. 4(h)). Finally, ΔFST:MST data showed a negative correlation with ΔBFP (r = –0·38, P = 0·015, Fig. 4(e)), while no significant correlation with ΔSMM (r = 0·12, P = 0·443, Fig. 4(i)) was noted.
Discussion
We evaluated the alterations of serum concentrations of MST, FST, IGF-1, AST, ALT and body composition markers following gradual weight loss protocol with and without spirulina supplementation in competitive wrestlers. The most conspicuous observation to emerge from the data comparison was that SP significantly reduced MST (–4·4%), AST (–8·6%) and ALT (–11 %) concentrations, while PL significantly reduced FST (–8·7%), IGF-1 (–1·2%) and FST:MST (–7·1 %) concentrations (P < 0·05). Both groups significantly decreased BFP (SP: −2·1 % v. PL: −0·6 %) and FM (SP: −18·7 % and PL: −8·4 %). Interestingly, the changes in BFP and FM were significantly greater in SP compared with the PL group (P < 0·001). Therefore, current outcomes are important since we show that spirulina supplementation potentiates BFP and FM loss after a gradual weight loss in competitive wrestlers.
We demonstrated that both groups caused a significant reduction in BM (SP = −3·6% and PL = −3·4%), BFP, FM and SMM (SP = −3·3 % and PL = −3·5 %). However, our results did not show any significant between-group differences when we compared absolute changes in BM (P = 0·405) and SMM (P = 0·0673). Interestingly, it was observed that the reduction in BFP and FM was greater after SP. It seems that adding spirulina supplementation to the gradual weight loss protocol can target weight loss in such a way, that it tends to be more effective through BFP and FM reduction. Although the role of spirulina supplementation on body composition, especially in athletes, is not fully understood, it has been shown that spirulina supplementation has an anti-obesity effect(Reference Zarezadeh, Faghfouri and Radkhah34). It seems that spirulina acts via the AMP-activated protein kinase signalling pathway and Sirtuin 1 in adipose tissue and skeletal muscle(Reference Heo and Choung35). It has been indicated that spirulina supplementation activates the AMP-activated protein kinase pathway, which regulates Sirtuin 1(Reference Heo and Choung35). Therefore, Sirtuin 1 deacetylates metabolic molecules, including NF-kB, c-Myc, forkhead transcriptional factor 1 and PPAR-γ, which results in an elevation of adiponectin, an adipokine that increases with a decrement of FM(Reference Heo and Choung35,Reference Bagheri, Rashidlamir and Ashtary-Larky36) . Moreover, studies reported an increment in gene expression of PPAR-γ coactivator 1-α and uncoupling protein 2 in skeletal muscle following spirulina supplementation, which is the result of adiponectin/adipoR1 activation and consequently, the up-regulation of adiponectin, as well as PPAR-γ coactivator 1-α and uncoupling protein 2 that promotes the mitochondrial biogenesis and fat oxidation(Reference Heo and Choung35,Reference Iwabu, Yamauchi and Okada-Iwabu37,Reference Knutti and Kralli38) . Additionally, the activation of AMP-activated protein kinase inhibits acetyl-CoA carboxylase that causes lipid oxidation increment by regulating carnitine palmitoyltransferase I(Reference Galic, Loh and Murray-Segal39). On the other hand, it has been shown that deactivation of the acetyl-CoA carboxylase by AMP-activated protein kinase suppresses fatty acid synthesis(Reference Heo and Choung35). Indeed, Heo et al. perfectly illustrated that spirulina supplementation declines the index of white adipose tissues, including mesenteric, perirenal/retroperitoneal and epididymal in white adipose tissue(Reference Heo and Choung35).
Both groups significantly reduced SMM (P < 0·001). However, no significant between-group differences were noted (P = 0·673) when we compared changes from pre-test to post-test. Maintaining SMM in wrestlers seems essential since it is strongly associated with strength and power outcomes(Reference García-Pallarés, López-Gullón and Muriel10,Reference Ramirez-Velez, Argothyd and Meneses-Echavez11) , which can be considered as an important target in weight loss protocols in wrestlers. Therefore, utilising a gradual weight loss protocol that slightly affects SMM is considered a rational option compared with a rapid weight loss as we have shown previously(Reference Motevalli, Dalbo and Attarzadeh4). It should be noted that weight loss protocols along with keeping high protein consumption can counteract the SMM loss caused by the energy restriction(Reference Mettler, Mitchell and Tipton6). The most important factor responsible for the significant decrement of SMM is protein intake(Reference Carbone and Pasiakos40). Indeed, the protein quantity of the spirulina supplementation in the SP group was not sufficient to combat SMM catabolism. Research has shown that a daily intake of 1·6 g/kg per d is sufficient in healthy individuals during resistance training(Reference Morton, Murphy and McKellar41). Furthermore, the range of 2·3–3·1 g/kg/d has been shown as the most consistently protective against SMM catabolism during energy restriction(Reference Helms, Zinn and Rowlands42). Since protein intake was significantly reduced in the SP (18·6 %) and PL (20·6%) groups, the reduction of SMM is not a surprising outcome.
When spirulina supplementation was added to our gradual weight loss protocol, a visible decrease in MST concentrations was observed. This is an attention-grabbing outcome since the decrement of this myokine can mediate FM reduction(Reference Deng, Zhang and Wen43). Animal studies have revealed that MST inhibition highly likely affects adipose tissue loss rather than the whole BM loss in high-fat diet-induced in mice(Reference Deng, Zhang and Wen43,Reference Zhang, McFarlane and Lokireddy44) . It has been reported that MST up-regulation in mice leads to a remarkable increase in adipose tissue(Reference Reisz-Porszasz, Bhasin and Artaza20,Reference Allen, Hittel and McPherron45) . Conflictingly, MST down-regulation in mice causes an increment of SMM but, surprisingly, decrement of FM, which is due to elevated fatty acid oxidation(Reference Pedersen and Febbraio46). Therefore, it seems a significantly higher reduction of BFP was responsible for MST decrement in the SP group.
FST and IGF-1 analysis showed a significant reduction in the PL group. Indeed, reductions in FST concentrations that coupled with the lack of change in MST led to a significant decrease in FST/MST concentrations in the PL group. When we considered their entirety, the decrement of FST/MST in the PL group highlights the importance of spirulina supplementation, which reduced the catabolic environment in the weight loss phase of the SP group. Previously, we reported that rapid weight loss (reducing baseline BM by 4 % in 48 h) compared with gradual weight loss leads to a decrease in FST:MST ratio, leading to SMM catabolism(Reference Motevalli, Dalbo and Attarzadeh4). Of note, we detected that FST:MST ratio was negatively associated with BFP in the SP group, indicating that the subjects who maintain or improve the FST:MST ratio were the ones with the greatest drops in BFP. Although it is not feasible to assume causality from correlation, i.e., whether an elevation in FST:MST concentrations leads to the decline in BFP or vice versa; the current outcomes are consistent with the model proposed by Chen et al. (2012) in which a catabolic environment via declines in the FST and elevations in MST concentrations, and hence a diminished FST:MST ratio may explain abdominal obesity levels(Reference Chen, Han and Yang47). Therefore, our findings reinforce the importance of the FST:MST ratio on body composition.
Reports indicate that rapid weight loss can be associated with significant changes in liver enzymes(Reference Coswig, Fukuda and Del Vecchio48,Reference Suzuki, Binks and Sha49) . For instance, a study of seventeen mixed martial arts competitors found that rapid weight loss was associated with an increase in lactate dehydrogenase and AST concentrations(Reference Coswig, Fukuda and Del Vecchio48). Based on our outcomes, both ALT and AST enzymes were significantly reduced in the SP group (P < 0·05), which supports the previous study regarding the beneficial effect of spirulina supplementation on liver enzymes(Reference Khan, Bhadouria and Bisen50). It has been suggested that spirulina may be attributed to the presence of ß-carotene, enzyme superoxide dismutase or Se and blue pigment phycocyanin(Reference Alhazza, El-Desoky and Al-Othman51). Therefore, spirulina supplementation has a protective effect on the liver through ß-carotene by reducing cell damage, especially the damage to DNA molecules, thus playing an important role in the repair of the regeneration process in damaged hepatocytes cells(Reference Alhazza, El-Desoky and Al-Othman51,Reference Kumar, Sharma and Kumar52) . Moreover, a shred of strong evidence approved powerful antioxidant compounds of spirulina such as phycocyanin and ß-carotene(Reference Mottaghi53); therefore, spirulina is suggested as an effective supplement for reducing oxidative stress and inflammation, which can directly influence liver function and structure as well as the concentrations of liver enzymes such as AST and ALT(Reference Mottaghi53).
Several limitations need to be noted in the present study. The myokines’ concentrations were assessed in the peripheral blood circulation, while the evaluation of these markers in muscle using biopsy can provide more precise results. Although subjects in both groups consumed water ad libitum during the weight loss period, dehydration was not investigated in the present study. However, similar changes in BM and SMM in the two groups along with a greater reduction in BFP in the SP group might indicate lesser dehydration in the SP group. It is well established that dehydration can decrease reaction time, mental ability, accuracy and increased tiredness feelings(Reference Weber, Mihalik and Register-Mihalik54). Moreover, dehydration is associated with higher heart rates and perceived exertion and postural control perturbation, which decreases wrestling performance(Reference Alhazza, El-Desoky and Al-Othman51,Reference Kumar, Sharma and Kumar52) . Therefore, the assessment of dehydration in subsequent studies could help to interpret current and future results. Additionally, we use a multi-frequency bioelectrical impedance device that is not as accurate as dual-energy x-ray absorptiometry (the gold standard technique for body composition measurement), and therefore, our results should be interpreted with caution. However, multi-frequency bioelectrical impedance is a valid and reliable method(Reference Ling, de Craen and Slagboom56–Reference Schoenfeld, Nickerson and Wilborn58), which has been shown to provide acceptable body composition estimates as compared with dual-energy x-ray absorptiometry in athletic populations(Reference Schoenfeld, Nickerson and Wilborn58). Last, we did not evaluate our subjects’ performance in wrestling. Since we did observe a significant reduction in BFP and FM, future studies should evaluate whether the performance could be affected by decreased body fatness.
Overall, the current findings suggest the beneficial influence of spirulina supplementation during gradual weight loss protocol on BFP, FM, MST and liver enzymes’ reduction along with maintaining IGF-1 and FST concentrations in competitive wrestlers. Additionally, spirulina supplementation was not effective in preserving SMM. Because high protein consumption can counteract the SMM loss caused by the energy restriction(Reference Mettler, Mitchell and Tipton6), we suggest the use of higher protein intakes to preserve SMM in future studies.
Acknowledgements
The authors thank all the subjects.
This research received no specific grant from any funding agency, commercial or not-for-profit sectors.
The authors declare that there are no conflicts of interest.
A. R. and R. B. conceived and designed research. A. R. conducted experiments. A. R. contributed new reagents or analytical tools. R. B. analysed data. R. B., R. N. and M. S. M. wrote the manuscript. D. A. L., A. W., M. K. and A. R. revised the manuscript. All authors read and approved the manuscript.
Supplementary material
For supplementary material referred to in this article, please visit https://doi.org/10.1017/S000711452100091X



