


I. Introduction
In recent years, the wine industry has realized increasing gains from technological similarity and convergence. From micro-oxygenation to DNA profiling to smart packaging, the diffusion and uptake of new technologies have drastically changed viticulture by enhancing production and transparency. However, this transformation has affected sectors and countries unevenly, making it difficult to define similarity and characterize its main features. In turn, the absence of a widely-agreed measure has confined the study of wine innovation to specific geographical areas, preventing a broader understanding of global technology diffusion.
The purpose of this paper is to provide a first definition of technological similarity in the wine industry. While relevant for market assessment and positioning, this exercise is empirically challenging for two reasons. First, sectoral and intra-sectoral differences in similarity are difficult to capture in a single metric. Second, diffusion and similarity change over time with changes in trade policy and regulatory standards.
I make progress on these challenges by using a novel dataset of wine patents filed in 53 countries between 1970 and 2023. As a major form of intellectual property, patents protect various aspects of the vinification process, including harvesting, fermentation, and commercialization. In addition to capturing within- and cross-sectoral similarities, patents are key indicators for detecting changes in the global regulatory landscape. These features make them well-suited to explore technological trends and measure similarity over time.
I retrieve data from The Lens, a public repository that combines information from patent records and the scholarly literature [28]. To facilitate patent intelligence, this database integrates sources from multiple servers, including 161.3 million filings from 195 jurisdictions (ibid.). The centerpiece of the analysis are 9439 patent abstracts drawn from this corpus. Unlike claims,Footnote 1 abstracts can offer a descriptive summary of the invention, without added technicalities or legalese.
I begin the analysis by translating unstructured patent text into a numerical representation. This approach builds on recent advances in computational linguistics, where sentences are converted into low-dimensional vectors and used as inputs for classification tasks [i.e.,Reference Ash and Hansen4]. Formally known as sentence embeddings, these algorithms allow to represent the meaning of words in a local context, accounting for the distribution of terms with which they co-occur. By encoding sentence similarity in vector form, embeddings can provide an informed measure of meaning for a large corpus of data. Here, my objective is to construct dense vector representations using five embedding models: Patent Embeddings using Citation-informed TransformERs (PaECTER), General Text Embedding (GTE), Sentence-BERT (S-BERT), Universal Sentence Encoder (USE), and Doc2Vec Footnote 2. Models differ in their architecture and performance, offering a useful testbed to trace technological changes over time.
After pre-cleaning and tokenizing the abstracts, I operationalize each model to identify patterns in technical breakthroughs and standardization. The measure I use, cosine similarity, is computed by taking the dot product of two vectors and then normalizing the result. As a benchmark for comparing document distance, this metric treats embeddings as rays and equates semantic direction to similarity. By mapping each cosine angle to a score ranging from 0 (low) to 1 (high), it offers a geometric framework for measuring technological similarity within and across sectors.
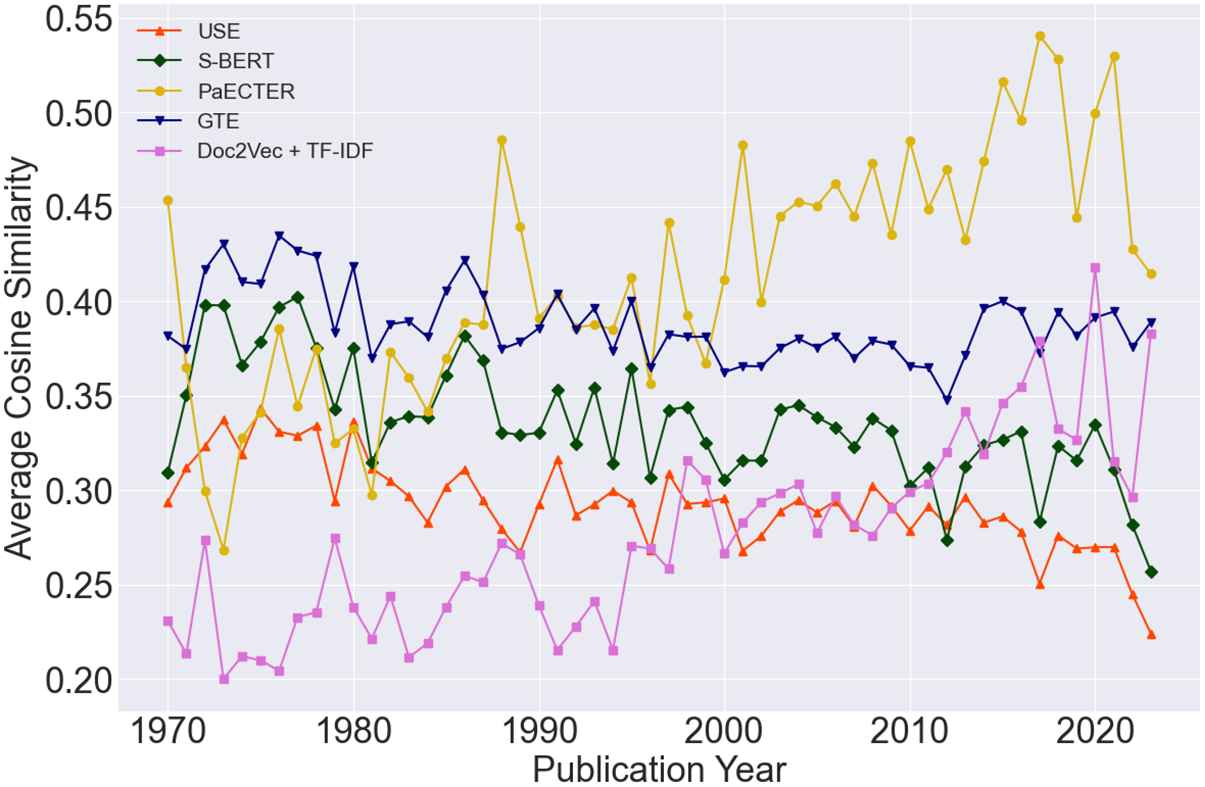
The results from this analysis lead to three main observations. First, models trained on larger and finer datasets exhibit an initial decline, followed by a stabilization in technical similarity (Figure 3). The decrease is more prominent between 1970 and 1990 for innovations related to biotechnology, organic chemistry, and chemical engineering. The relative stabilization around the turn of the century aligns with the growing standardization of instruments and precision machinery, including engines, pumps, and other mechanical elements. Due to the lower technical sophistication, breakthroughs connected to consumer goods present a higher mean similarity throughout the period, with relative stability after the mid-1990s. In contrast, coarser models show a slow and progressive increase in average similarity across all fields. These findings resonate with [Reference Ganguli, Lin, Meursault and Reynolds9] and a large body of evidence indicating how model selection is critical for information retrieval and task accuracy.
Second, technological convergence within sectors is higher within countries than across them. In particular, similarity in the language of wine patents has been progressively falling in the United States, where it became stationary in the early 2000s. Conversely, EU countries show changes in the opposite direction. Here, the rise in similarity became especially pronounced after 2010, extending to all fields. Whether this should be attributed to the low trade tariffs within the Union or the progressive harmonization of the Common Agricultural Policy is a key empirical question. Taken together, these trends indicate that, despite the increasing volume of trade during our sample period, wine innovation is tied to the economic and cultural conditions of the place of invention.
Third, I document significant variations in average similarity across models. In particular, I demonstrate that semantic similarity, computed using GTE and PaECTER, ranges from  $38.7\%$ to
 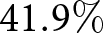 $41.9\%$, while S-BERT and USE achieve considerably lower averages of
  $33.2\%$ and
  $28.9\%$. More generally, models score better along all dimensions on US and Asian patents, where they also exhibit greater technical convergence (46.5%–46.6%). Despite being difficult to identify, this finding could indicate the existence of innovation clusters, knowledge spillovers or higher industrial specialization within these regions.
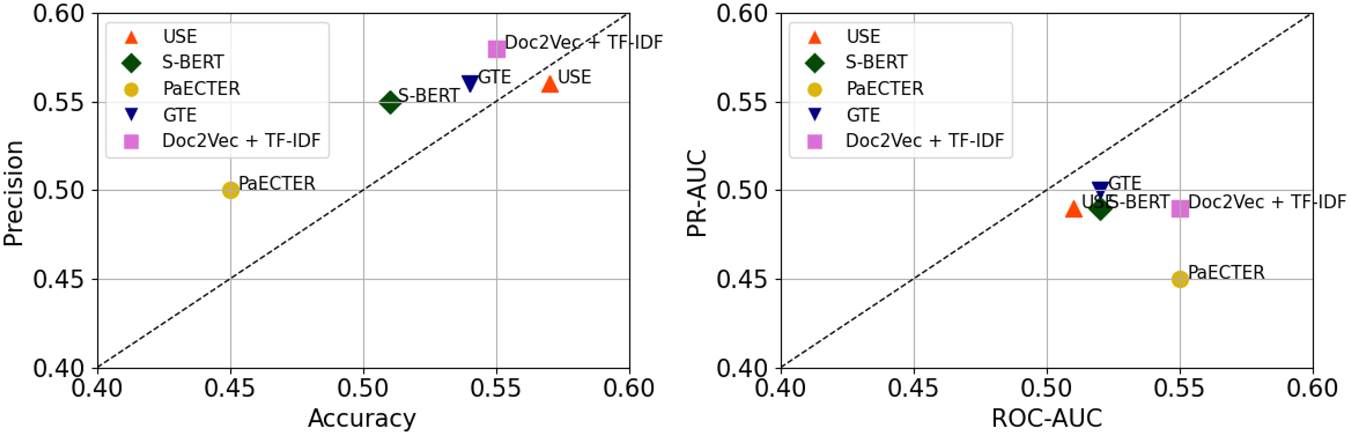
I explore a series of approaches to validate the findings. First, I employ the patent classification codes as ground-truth labels to test the performance of each model against four evaluation criteria. As a standard measure of technological similarity,Footnote 3 classification codes offer a systematic benchmark to evaluate patents that belong to the same class. In Table D1 and Figure 5, I show that GTE improves discrimination, while USE has higher accuracy and precision. Decomposing the estimates, I further document that models achieve higher performance in different technical fields. However, compared to standardized labels, all models perform poorly, underscoring their inability to capture similarity beyond a trivial measure. This finding matters per se, as it suggests a role for purpose-trained frameworks to support future research in this direction.
Second, I download patent drawings to test their mean similarity against the one produced by the models. If properly implemented, this exercise should return close matches, providing a robust estimation of technological convergence in both visual and textual content. After preprocessing the drawings and extracting their key features, I borrow tools of computer vision to analyze them based on the Structural Similarity Index Measure (SSIM). Overall, the metric averages at  $39.69\%$, which is well in agreement with the estimates obtained from GTE. This confirms that models with enhanced fine-tuning have higher predictive power and should be prioritized for market assessment.
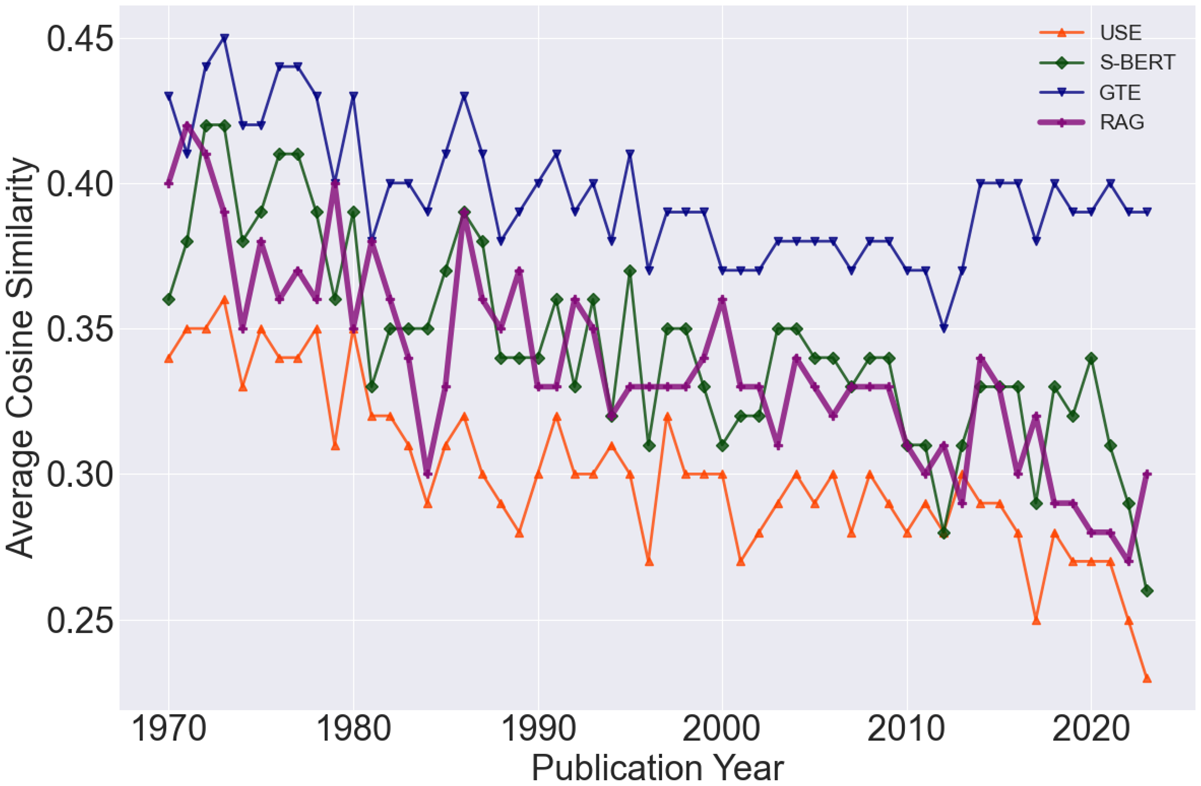
Third, I exploit advances in Retrieval-Augmented Generation (RAG) and Large Language Models (LLMs) to query abstracts with high language similarity. In the absence of human annotators, RAG can index the relevant data and communicate with an LLM to generate responses. For this purpose, if the validation was successful, I would expect a close evolution of patent similarity between the static models and the RAG-augmented one. In Figure 6, I show that the mean changes generated under RAG closely follow the patterns produced using S-BERT, USE, and GTE. Overall, this analysis provides additional confidence that newer models can offer a robust representation of technological co-movements for the sampled patents.
This research adds to the literature in industrial economics using textual analysis to infer valuable economic patterns. Closest to mine are papers that leverage unstructured text for information retrieval and corpus visualization. Importantly, [Reference Ganguli, Lin, Meursault and Reynolds9] compare the performance of seven embedding models to measure the similarity of US patents from 1836 to 2023. They show large differences between Transformers, highlighting the importance of model selection and validation. Here, I specialize their focus by considering fewer models, which are yet better suited to handle smaller text domains. Further, by focusing on a specific industry and a broader set of countries, I identify patterns that deviate from a persistent decline in similarity.
This study also contributes to a recent literature that employs NLP in wine economics [i.e., Reference Croijmans and Majid7, Reference McCannon18]. [Reference Katumullage, Yang, Barth and Cao16] draw wine reviews from the Wine Spectator to test the performance of fine-tuned CNN, BiLSTM, and BERT. Consistent with my analysis, they find that models trained on larger datasets have higher predictive accuracy. While contextually different, our methodologies share a common belief that NLP is a useful tool for pattern recognition and classification. Here, I improve on their study by considering a richer set of architectures, embedded with higher context awareness.
More broadly, this paper speaks to scholars in innovation economics, especially those interested in wine production technologies, competition, and sectoral adjustments. My main contribution is to demonstrate that, while the growing availability of textual data can advance our understanding of viticultural technology, model selection is critical to define similarity and its evolution. Tailoring this search to one’s research questions is thus crucial to accurately map sectoral and industrial change.
II. Data
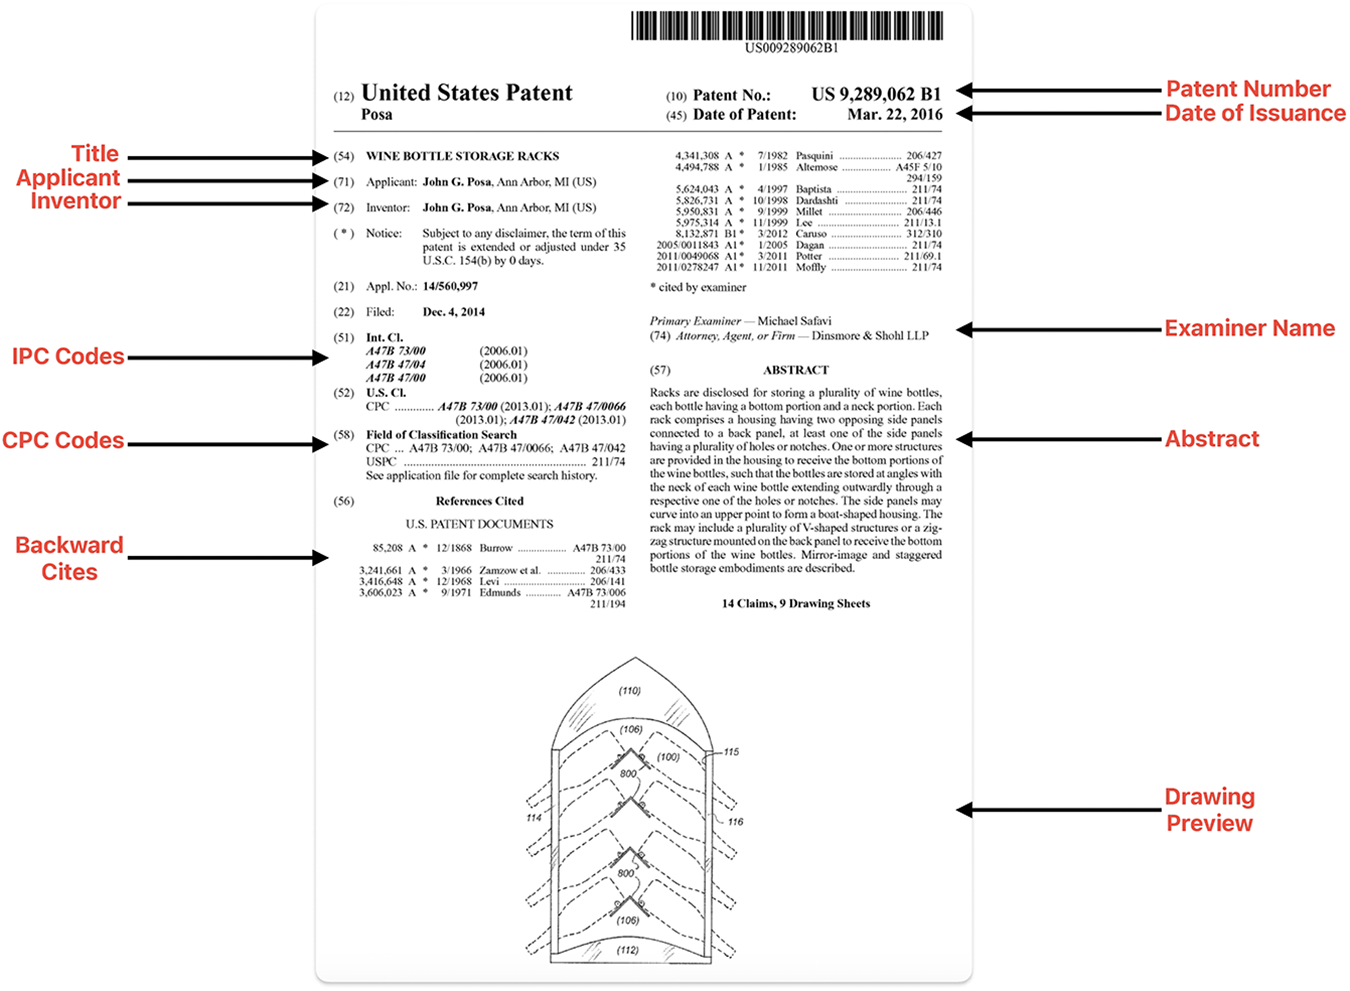
Patent data provide rich textual evidence on the nature of the invention and its innovative content. According to international guidelines [i.e.,31], each document consists of four elements: a request, a descriptive summary, an abstract, a claim set and, when available, a graphical representation.Footnote 4
a. Descriptive Statistics
I retrieve data from Lens.org, an integrated platform connecting application-level information with the scholarly and non-scholarly literature citing a patent. I query all documents that contain the word wine in the title and abstract, restricting the observation period to years 1970–2023. The reason for this restriction is two-fold. First, the adoption of patent seizure and secrecy programs during the war implies that several breakthroughs are not formally registered prior to 1970. Second, this period coincides with an increasing harmonization in wine regulation and shifting power centers across the industry.
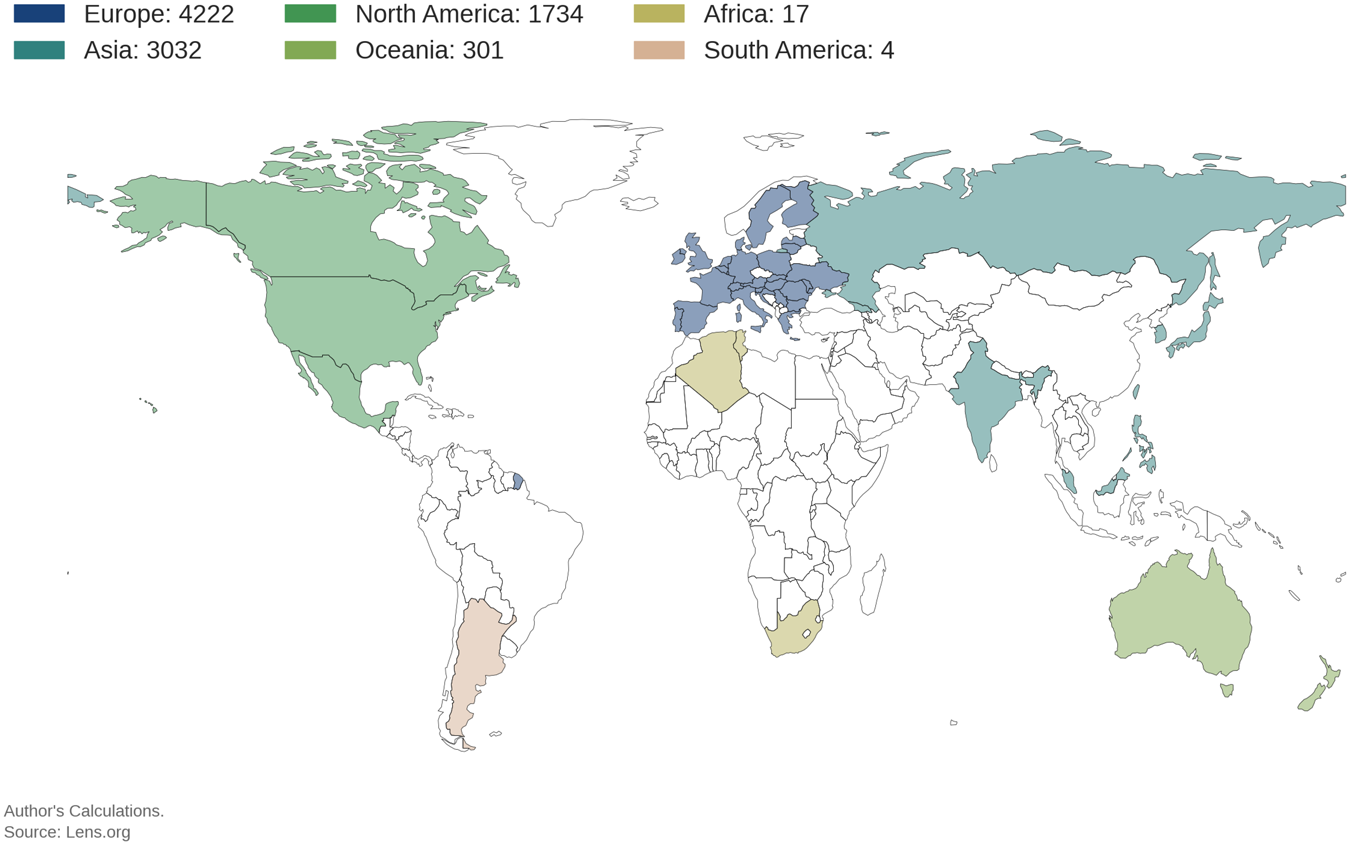
The search yields 9439 patents filed in over 53 jurisdictions. Top filers include the United States (1516), South Korea (1453), and France (903). As shown in Figure B1, the European Union and Asia are leading contributors with 4196 and 3032 patents, respectively. Across all regions, inventions are highly concentrated, with France, Germany, and Spain owning 63.1% of European innovations. Similarly, the United States, South Korea, and Japan hold 87.2% and 75.7% of the share in their respective continents.
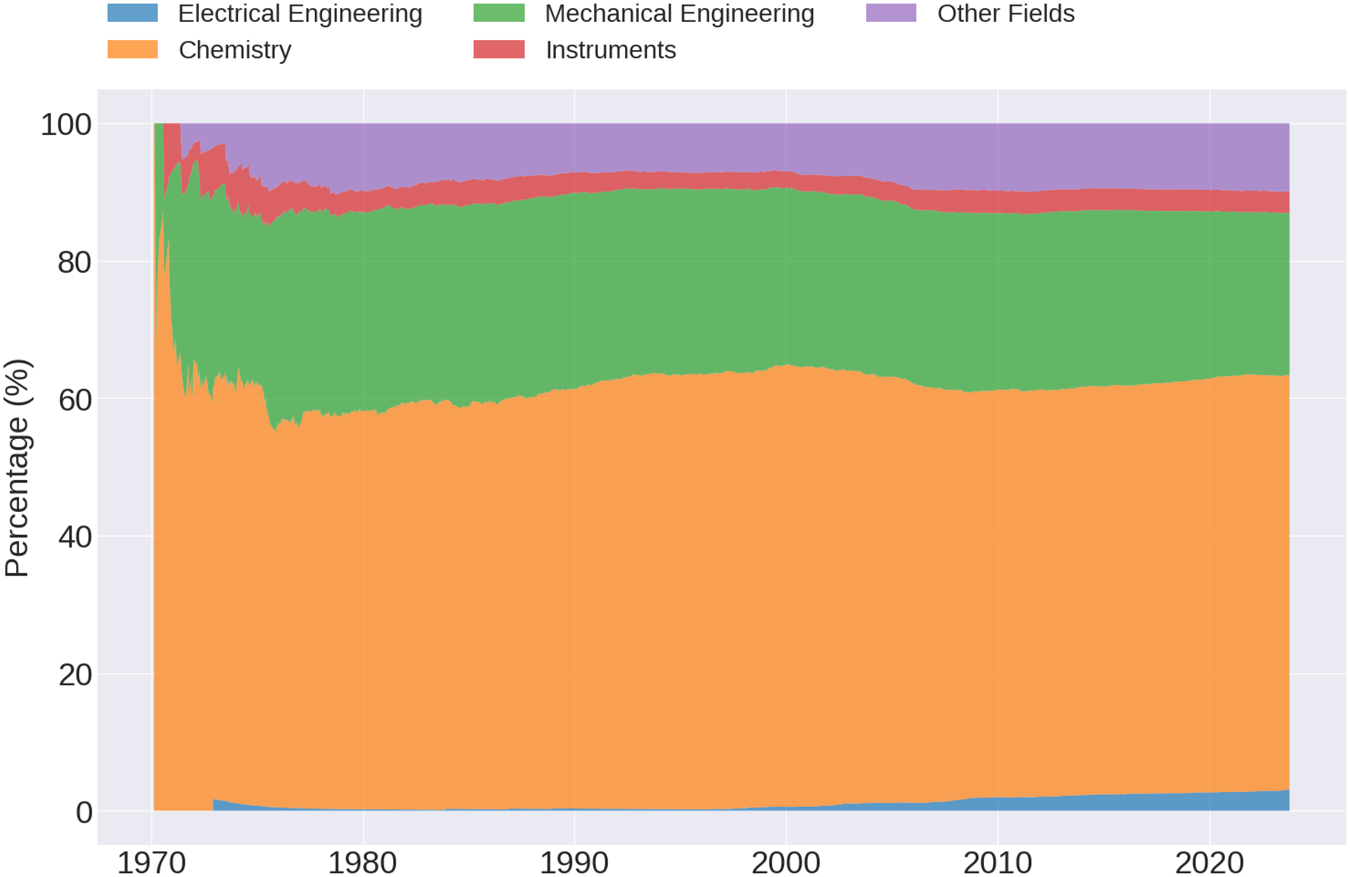
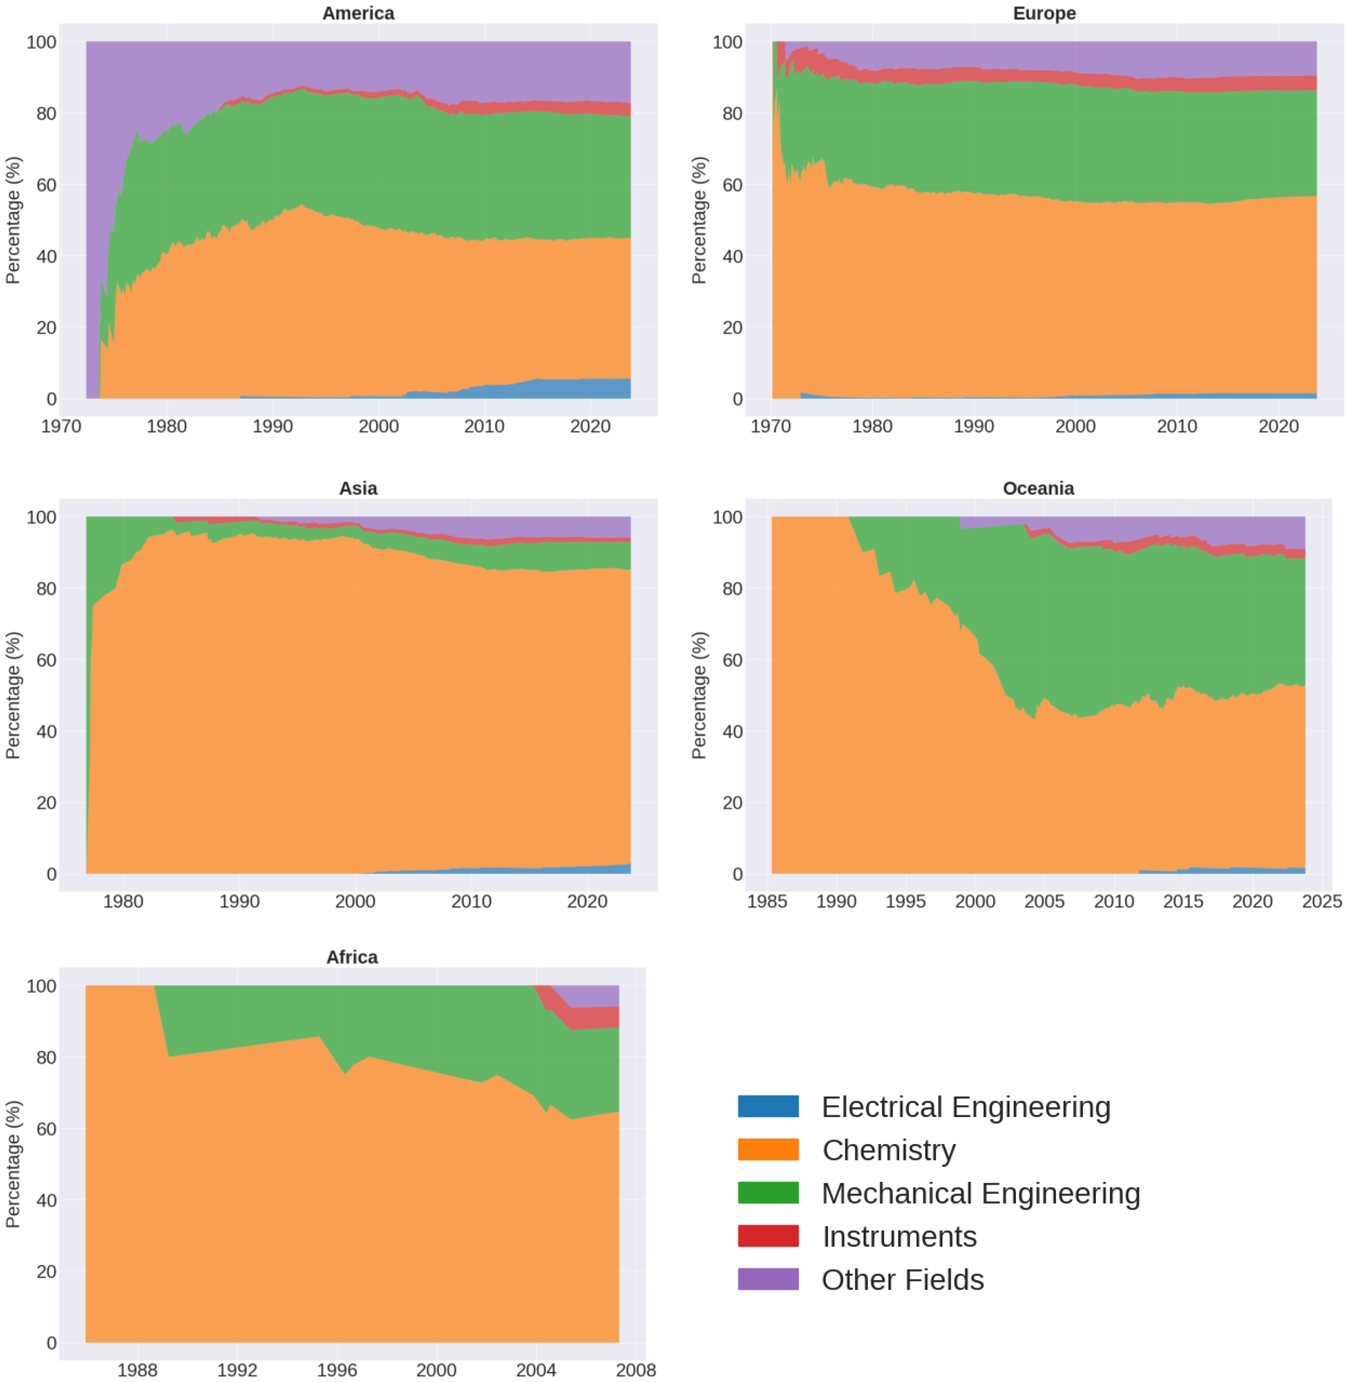
Beyond filing patterns, countries differ with respect to their area of specialization. Figure B2 maps the evolution of wine patents into five fields of expertise, as measured by the World Intellectual Property Organization (WIPO)Footnote 5. Throughout our sample period, innovations related to Food Chemistry and Chemical Engineering predominate, followed by inventions in Machine Tools and Mechanical Elements. Although aggregate patterns are relatively stable over time, Figure B3 shows marked differences across regions. For instance, North America leads in digital technologies and consumer products; while Europe exhibits relatively higher expertise in wine measurement technology. In Africa and Oceania, the fall in Chemistry patents was offset by an increasing focus on handling and packaging technology, including bottles, corks, and storage boxes. These changes are in line with a rise in vine area, wine production, and exports in both markets [i.e.,Reference Meloni, Anderson, Deconinck and Swinnen19]. Asia demonstrates a strong tendency toward singular specialization in the chemistry of stabilization, treatment, and flavoring. As these patterns extends to products other than wine, they attest to the greater expertise in fine chemicals across the region. Still in small numbers, wine patents related to Electrical Engineering have gained traction over time. Their expansion has been more pronounced in Europe following the enactment of the Common Wine Policy in 1970 and in the United States amid the rise in software-related technology.
Without implying causality, this evidence shows that the relevance of wine patents varies across countries and aligns with the economic or cultural value attributed to wine-making. It also shows that changes in specialization came along new regulation and consumer tastes, with different effects on technological adoption and convergence.
b. Preprocessing
For our purposes, I focus on the abstract of each patent. According to the WIPOFootnote 6, abstracts should not exceed 250 words and provide a brief summary of the invention. Unlike claims, abstracts contain fewer technicalities and legalese, offering a more objective measure of innovation.
To reduce nuisance and structure the corpus, I begin by preprocessing the data. I convert all text to lowercase, removing leading and trailing whitespaces, non-ascii characters, punctuation, stopwords, and numbers. I further split contractions and tokenize the text.
After this precleaning step, I simplify the dictionary by grouping words with similar meaning but different grammar. First, I strip prefixes and suffixes to convert words to their root form. Formally known as stemming, this process enables to quickly index terms and reduce their dimensionality. Next, I lemmatize the corpus to retain the dictionary form of every word. This technique treats expressions with the same base as a unique term. Panel (a) of Figure 1 visualizes the most frequent lemmas, mapping the size of each word to its occurrence. As shown, expressions refer to different aspect of the vinification process, from harvesting to fermentation, from clarifying to bottling and aging. With references to grapes and rice, the word cloud condenses information about New and Old World producers, providing a broader outlook on the wine industry.
Preprocessing of wine patents. (a) Word Cloud of Patent Abstracts. (b) TF-IDF Ranking.

As a final step, I rank words to determine their relevance within the corpus. In particular, I use the Term Frequency-Inverse Document Frequency (TF-IDF) method to remove common tokens and reduce the size of the vocabulary. Developed to improve information retrieval [Reference Jones15], the TF-IDF algorithm adjusts the frequency of word  $w$ in document
  $d$ by using the log ratio of total documents
  $D$ to those containing
  $w$. Simply put, it reweighs a term’s relevance by accounting for words that appear consistently within a case file, assigning a lower rank to both common and uncommon ones. Panel (b) of Figure 1 plots the TF-IDF ranking, showing that stems with a score equal to or below 10.11 are relatively uninformative and can be dropped from the sample.
Overall, this preliminary analysis serves to lower the dimensionality of the abstracts and improve the quality of our similarity functions.
III. Methods
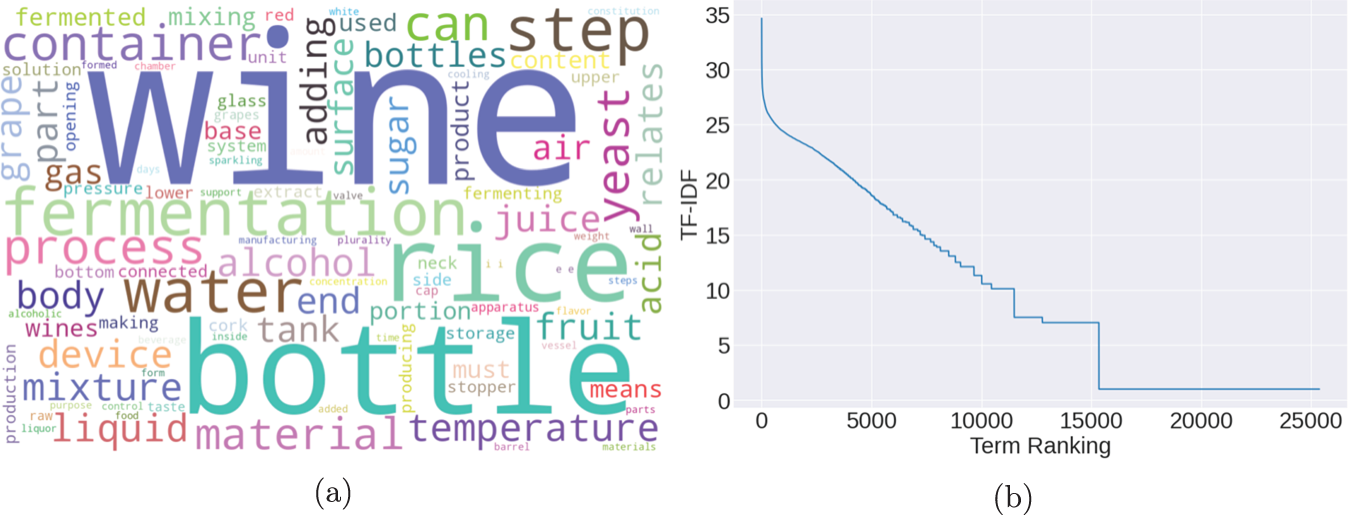
Sentence embeddings encode entire expressions in vector form, offering a numerical representation of words in a broader context. Increasingly employed in the economic field, they have been used for feature extraction, categorization, and similarity search. In Table 1 and Figure 2, I review the models applied to the abstracts and the validation process.
Pipeline for wine patent similarity.

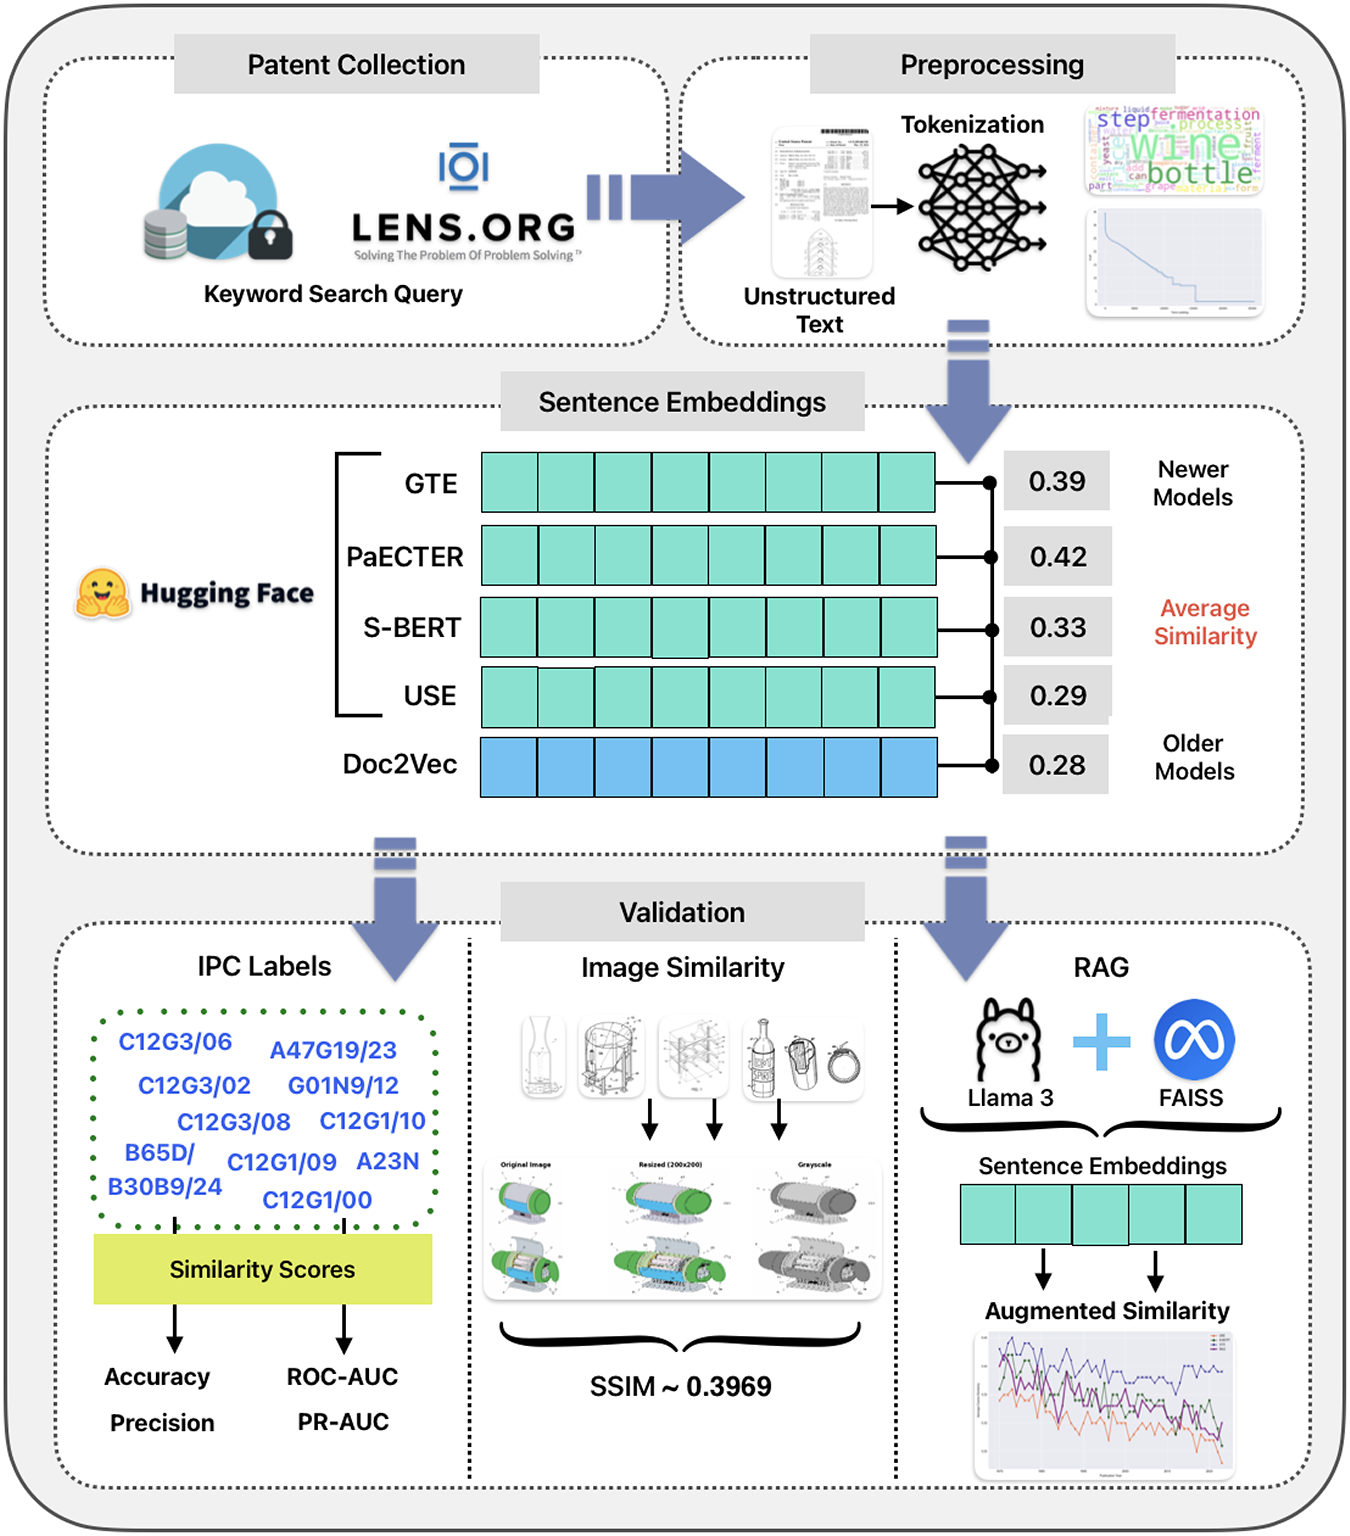
Comparison of sentence embeddings

a. NLP and sentence transformers
Transformers are deep learning algorithms that use an input string to output information about the sampled data and their context. In this application, I employ four different architectures, specifically designed to parse sentences in dense corpora.
General Text Embedding (GTE), developed by Alibaba NLP, is optimized using multi-domain text in the pre-training and fine-tuning stage. Built upon a contrastive learning technique, the system weights both positive and negative sentence pairs to learn higher level features. GTE represents each sentence as a 768-dimensional vector, handling a maximum of 8192 tokens. Designed primarily for search tasks, it balances fast information retrieval with scalability in larger documents [Reference Zhang, Zhang, Long, Xie, Dai, Tang, Lin, Yang, Xie, Huang and Zhang34].
Sentence-BERT (S-BERT), owned by Google AI, fine-tunes the original Bidirectional Encoder Representations from Transformers (BERT) with two attention mechanismsFootnote 7. In particular, the model uses both Siamese and Triplet networks to enhance similarity comparisons and learn differences among sentences. S-BERT supports a maximum of 512 tokens and outputs embeddings with size 384. Due to its high awareness, it is employed for downstream clustering and similarity search [Reference Reimers and Gurevych25].
Universal Sentence Encoder (USE) is a precursor of S-BERT. The model boosts a Deep Average Network (DAN) that computes the mean vector of all embeddings contained within a sentence. This mean vector is later fed into fully connected layers that fine-tune the model to improve its learning process. Trained on structured and unstructured data, USE processes up to 512 tokens and maps sentences to a 512-dimensional vector. More versatile than S-BERT, it is employed for shorter text and general NLP tasks with lower context awareness [Reference Cer, Yang, Kong, Hua, Limtiaco, John, Constant, Guajardo-Cespedes, Yuan, Tar, Sung, Strope and Kurzweil6].
Unlike other sentence embeddings, Patent-level Representation Learning using Citation-informed Transformers (PaECTER) is only trained on patent data. The model modifies Google’s PatentBERT by adding examiner citations. This feature enables it to capture relationships among patent documents and enhance their understanding. PaECTER projects words to a 1024-dimensional vector space, truncating sentences with more than 768 tokens. When employed on patent data, the model scores higher in terms of accuracy than any of its predecessors [Reference Ghosh, Erhardt, Rose, Buunk and Harhoff10].
The last representation scheme, Doc2Vec, is a two-layer neural network based on a Distributed Memory version of Paragraph Vector (PV-DM) and a Distributed Bag of Words version of Paragraph Vector (PV-DBOW). While the PV-DM layer anticipates the next sentence based on the preceding one; the PV-DBOW samples random words from each paragraph to predict their position within the text. Less powerful than state-of-the-art Transformers, it can be easily deployed for classification purposes [Reference Le and Mikolov17].
Throughout, I define similarity as the cosine of the angle between two embedding vectors. Let  $X$ and
  $Y$ be two sentence embeddings. Cosine similarity is the ratio between the dot product of the two embeddings and their vector norms:
 \begin{align*}
sim(|{X, Y}|) & = \frac{X \cdot Y}{||{X}|| \cdot ||{Y}||} = \frac{\sum^{n}_{i = 1} x_{i} \cdot y_{i}}{\sqrt{\sum^{n}_{i=1} x^2_{i}} \cdot \sqrt{\sum^{n}_{i=1} y^2_{i}}}.
\end{align*}
\begin{align*}
sim(|{X, Y}|) & = \frac{X \cdot Y}{||{X}|| \cdot ||{Y}||} = \frac{\sum^{n}_{i = 1} x_{i} \cdot y_{i}}{\sqrt{\sum^{n}_{i=1} x^2_{i}} \cdot \sqrt{\sum^{n}_{i=1} y^2_{i}}}.
\end{align*}In practice, this measure attributes higher value to vectors pointing in the same direction and a lower one to embeddings moving orthogonally. Commonly used in patent analysis, cosine similarity provides an intuitive measure of technological closeness by mapping vectors to the [0,1] range.
b. Validation
In order to validate the findings, I adopt three strategies. First, I employ the International Patent Classification (IPC)Footnote 8 code as a benchmark to test the performance of each representation scheme on a ground-truth label. In machine learning, ground-truth labels provide an indication of quality by comparing the inference obtained from a black-box model against the one produced by a human. Here, I use the IPC code assigned by examiners to check whether the models classify as similar patents that belong to the same class.
I quantify the performance of the schemes against four metrics. The first two, accuracy and precision, assess whether a scheme can reliably predict similarity within a given class. Specifically, accuracy is the ratio of correct predictions over all possible predictions; while precision is the proportion of true positives correctly identified by the model. Despite their popularity, neither metric can assess model performance beyond a common threshold, nor separate classes beyond a single measure. For this reason, I employ two additional indicators. The receiver operating characteristic area under the curve (ROC-AUC) trades off sensitivity and specificity, evaluating the models’ ability to discriminate among labels. In contrast, the precision-recall area under the curve (PR-AUC) balances precision and recall, identifying false negatives. Taken together, these metrics should provide a comprehensive assessment of the schemes and address concerns of misclassification.
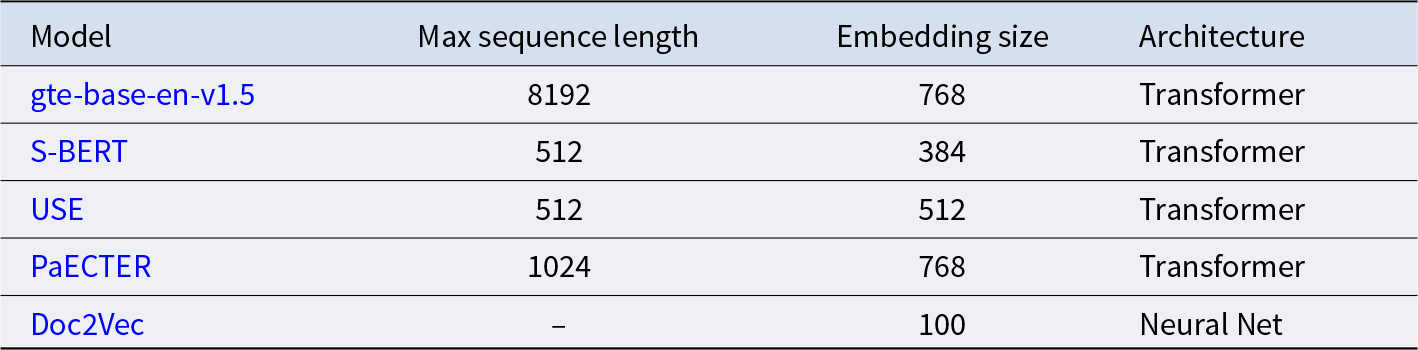
Second, I download patent drawings to verify that the trend produced by newer models generalizes to other aspects of the application process. The rationale is that text similarity, as measured by the cosine method, should closely track changes in image similarity. To this end, I preprocess and standardize drawings to extract their key features. After resizing and normalizing their pixel values, I compute the mean score using a metric of image quality, namely the Structural Similarity Score Index (SSIM). This algorithm returns an average similarity score based on three features: luminance, contrast, and structure. This, in turn, allows to evaluate which embedding scheme computes the most meaningful representation, effectively comparing visual with semantic similarity.
Third, I build a Retrieved Augmented Generation (RAG) chat-box to evaluate the performance of the scores obtained from the static embeddings. This method leverages context to improve the quality of the trends generated by each representation and reduce hallucinations. For every query, the system pulls relevant information from the input vectors as well as from external sources. After storing vectors in a dictionary, I use the RAG function to produce an average similarity plot and a new summary of the trends. While not without limitations, RAG can provide a cost-effective alternative to correct deviations in static models and improve information retrieval.
IV. Results
As a first step in the analysis, I trace patent similarity to visualize the evolution of wine embeddings for years 1970-2023. Figure 3 presents the main result, showing that average similarity varies with the chosen scheme. While PaECTER and Doc2Vec exhibit an increasing convergence; GTE, S-BERT, and USE show a progressive decline until the late 1990s, followed by a stabilization in the later period. This conflicting evidence demonstrates that model choice influences the shape and definition of technological convergence, as well as our understanding of sectoral innovation over time.
Average wine patent similarity at publication, 1970–2023.

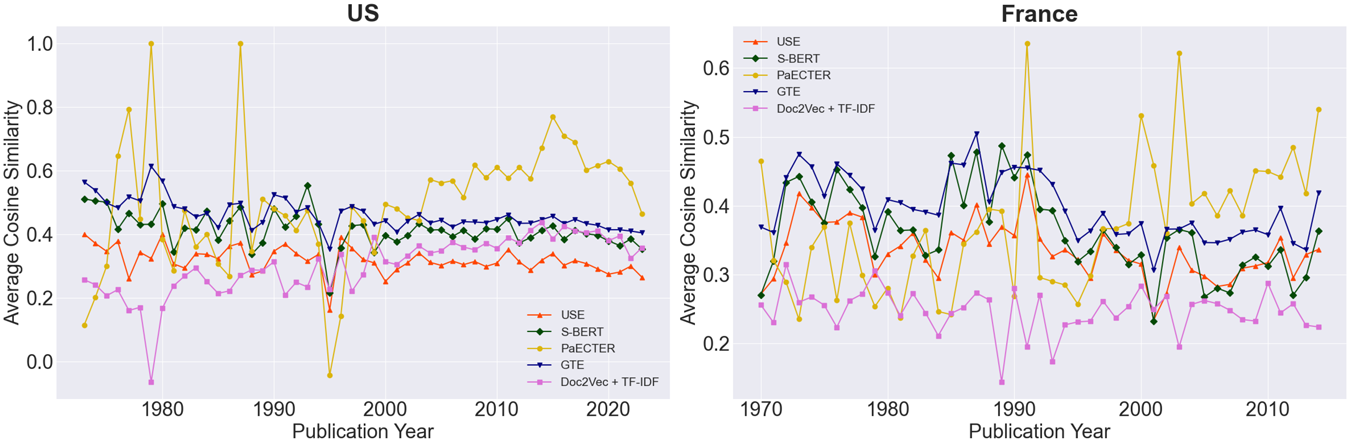
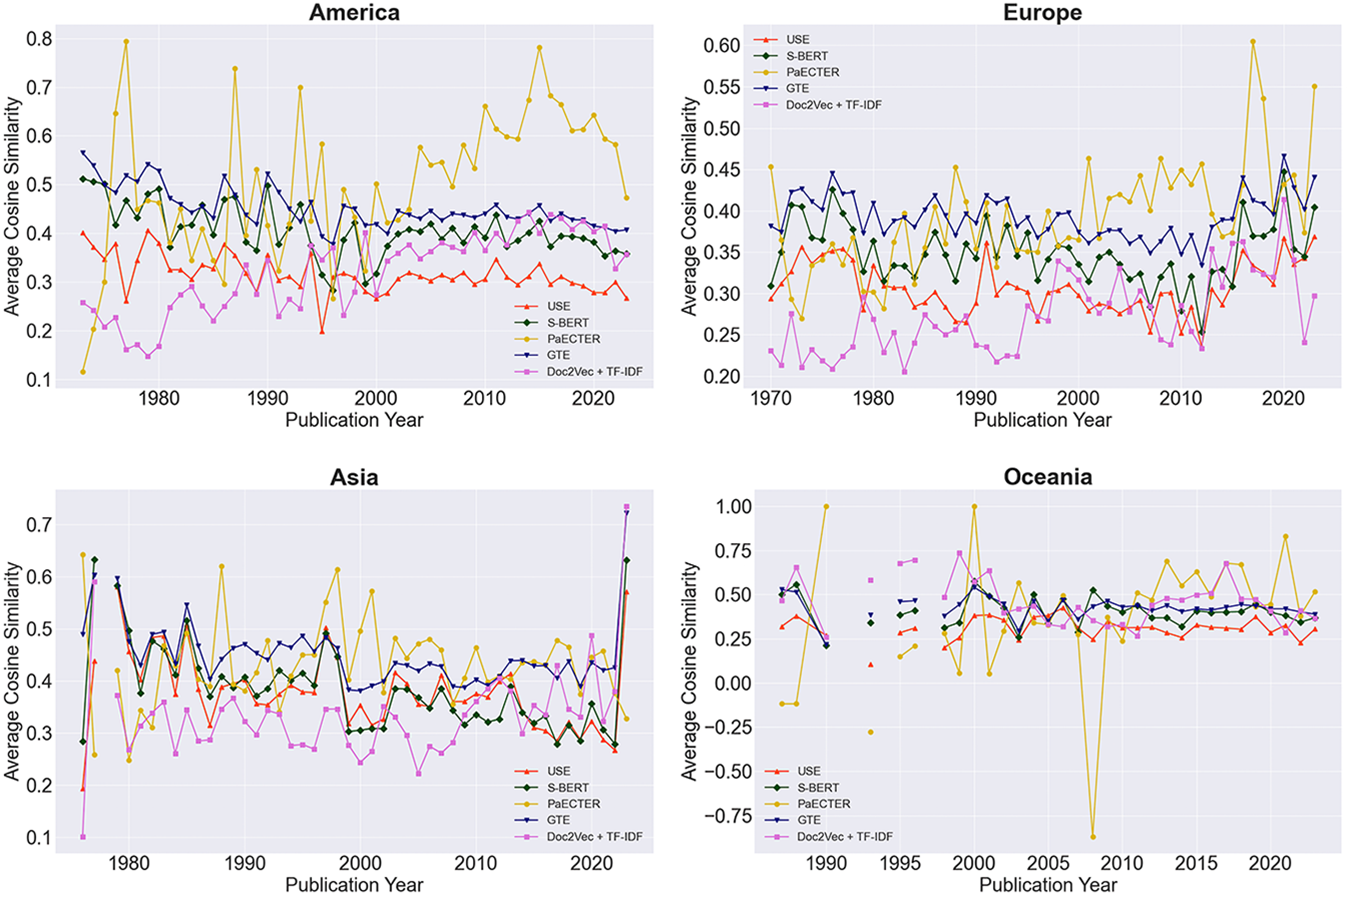
Differences are not only visible at the aggregate level, but also extend to individual countries. Figure C1 maps all vector embeddings to analyze the changes in the language of wine patents across continents. The panel shows a progressive decline in average similarity in America, where scores as high as 65.3% in the 1970s have fallen to 29.3% in the early 2020s. Other New World producers, including Asia and Oceania, exhibit higher scores - ranging from 64.4% to 89.0% during the first two decades and dropping to 33.3% in the later period. In Europe, patterns vary markedly, with the mean gradually declining to 31.1% by the early 2010s, followed by an increase to 46.6% in the subsequent decade. By way of example, Figure 4 specializes the analysis to two countries, the United States (left) and France (right). While the first exhibits a downward trend in mean similarity over time (38.4%-56.4%); France displays higher stability, with a mild increase beginning in the early 2010s (29.1%-42.9%). Despite these distinctions, greater technological convergence in both countries stems from Electrical Engineering and Instruments, sectors that significantly contribute to wine marketing, sampling and testing methods.
Mean evolution of patent similarity by selected countries, 1970-2023.

Overall, these movements suggest two possible observations. First, they indicate that, despite the increasing volume of trade during our sample period, wine innovation is tied to the economic conditions and market structure of the place of invention. This finding resonates with [Reference Moscona and Sastry20] and a large literature that highlights how differences in R&D across countries may fail to level out in the long run. Second, they attest to the growing prominence of New World producers in America, Asia, and Oceania, especially following the enactment of the TRIPS Agreement in 1995 and the increasing globalization of wine.
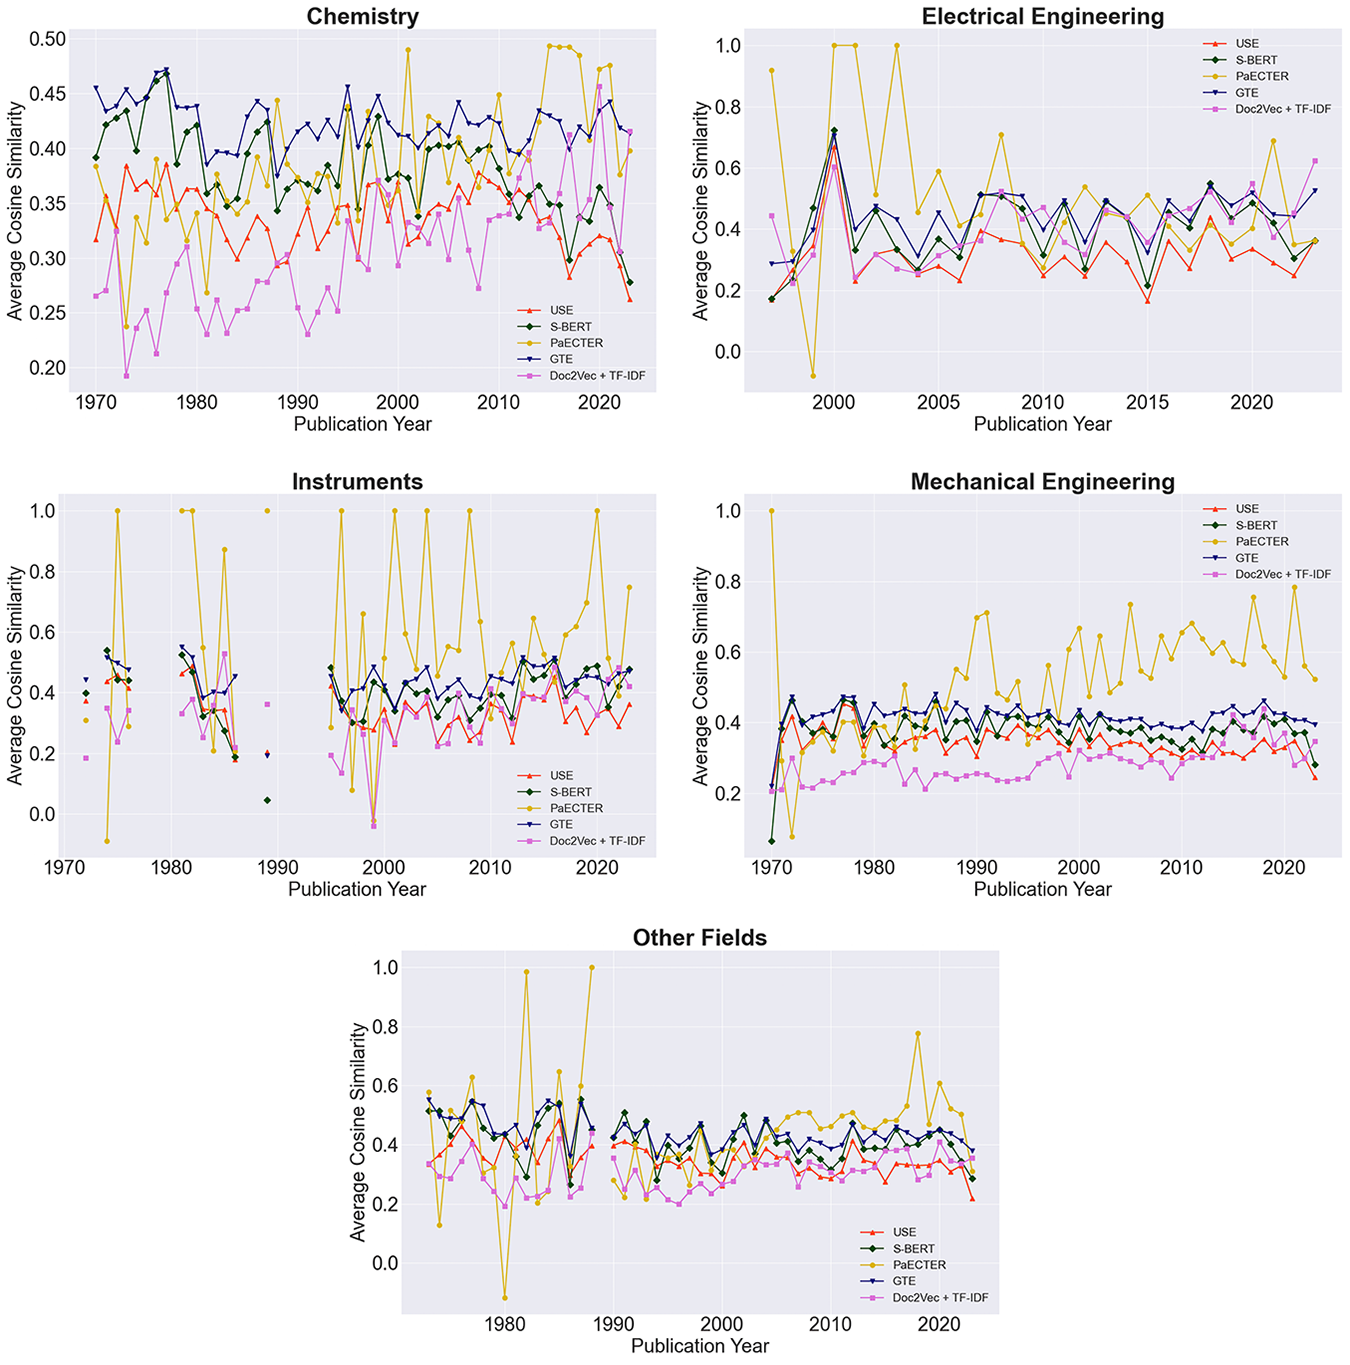
Further, there are major contrasts across technical domains. Figure C1 decomposes wine embeddings by technology sectors, showing clear distinctions in the direction and magnitude of the changes. While the upward trend observed in two of the five models extends to the fields of Chemistry and Mechanical Engineering; all representations exhibit a declining trend for patents related to Electrical Engineering, Instruments, and Other Fields. This shift is mostly driven by applications filed in the United States, Australia, and New Zealand, where wine technologies of high sophistication have become increasingly diverse during the first decade of the 21th century. In contrast, European patents exhibit growing similarity starting from the early 2000s. Patterns are especially pronounced for the Mechanical Engineering and Instruments sectors, indicating an increasing convergence in wine production apparatus and monitoring solutions across the Union. Whether this should be attributed to the Common Agricultural Policy, the low trade barriers, or the geographic distribution of wine climates is an outstanding question with deep policy implications. Trends across Asia replicate the changes observed in Europe. Most notably since the early 2010s, fast-moving consumer goods (FMCG) have become less diverse, with models showing a 24.8–44.4% increase in similarity over this period. This, in turn, resonates with the greater homogeneity in wine preferences across East Asia [i.e., Reference Holmes and Anderson11], and should be read as a by-product of the high specialization in the FMCG industry within the region.
Finally, newer representations return higher mean scores than older ones. Although the trend lines move in opposite directions, GTE and PaECTER consistently point at values between 38.8% and 41.9%. As before, average similarity is higher among New World inventors, especially in Oceania ( $61.3\%-62.5\%$) and America (49.7%–55.3%). Conversely, Doc2Vec, USE, and S-BERT suggest considerably lower scores, ranging from
  $28.3\%$ to
  $33.2\%$. Regardless of these differences, all models exhibit higher convergence in technologies for the evaluation and control of wine quality, online advertising, and labeling. This, in turn, highlights the potential for broader adoption of these technologies across multiple regions, independent of whether a territory is primarily involved in its development or end use.
In one way, these results suggests that, despite the increasing volume of exports during our sample period, the uptake and diffusion of wine technology responds to the economic and cultural frameworks of production in the local market. Whether the movements we observe stem from differences in wine regulation, historical contrasts in the development of the wine industry, or changes in patent policy is a key empirical question. While the range of available data inhibit this type of evaluation, it is yet meaningful to explore the mechanisms behind these contrasts in greater detail.
a. Model evaluation
The previous section demonstrates that, in analyzing wine patents, different Transformers offer contrasting measures of technological similarity. Below, I provide a range of robustness checks to show how sentence embeddings can yield a reliable assessment of inventive activity in the wine industry.
1. Ground-Truth Labels
I use the International Patent Classification (IPC) system as a benchmark to measure the performance of each model on vector similarity. The IPC serves to identify the technology of reference and categorize applications based on their content.
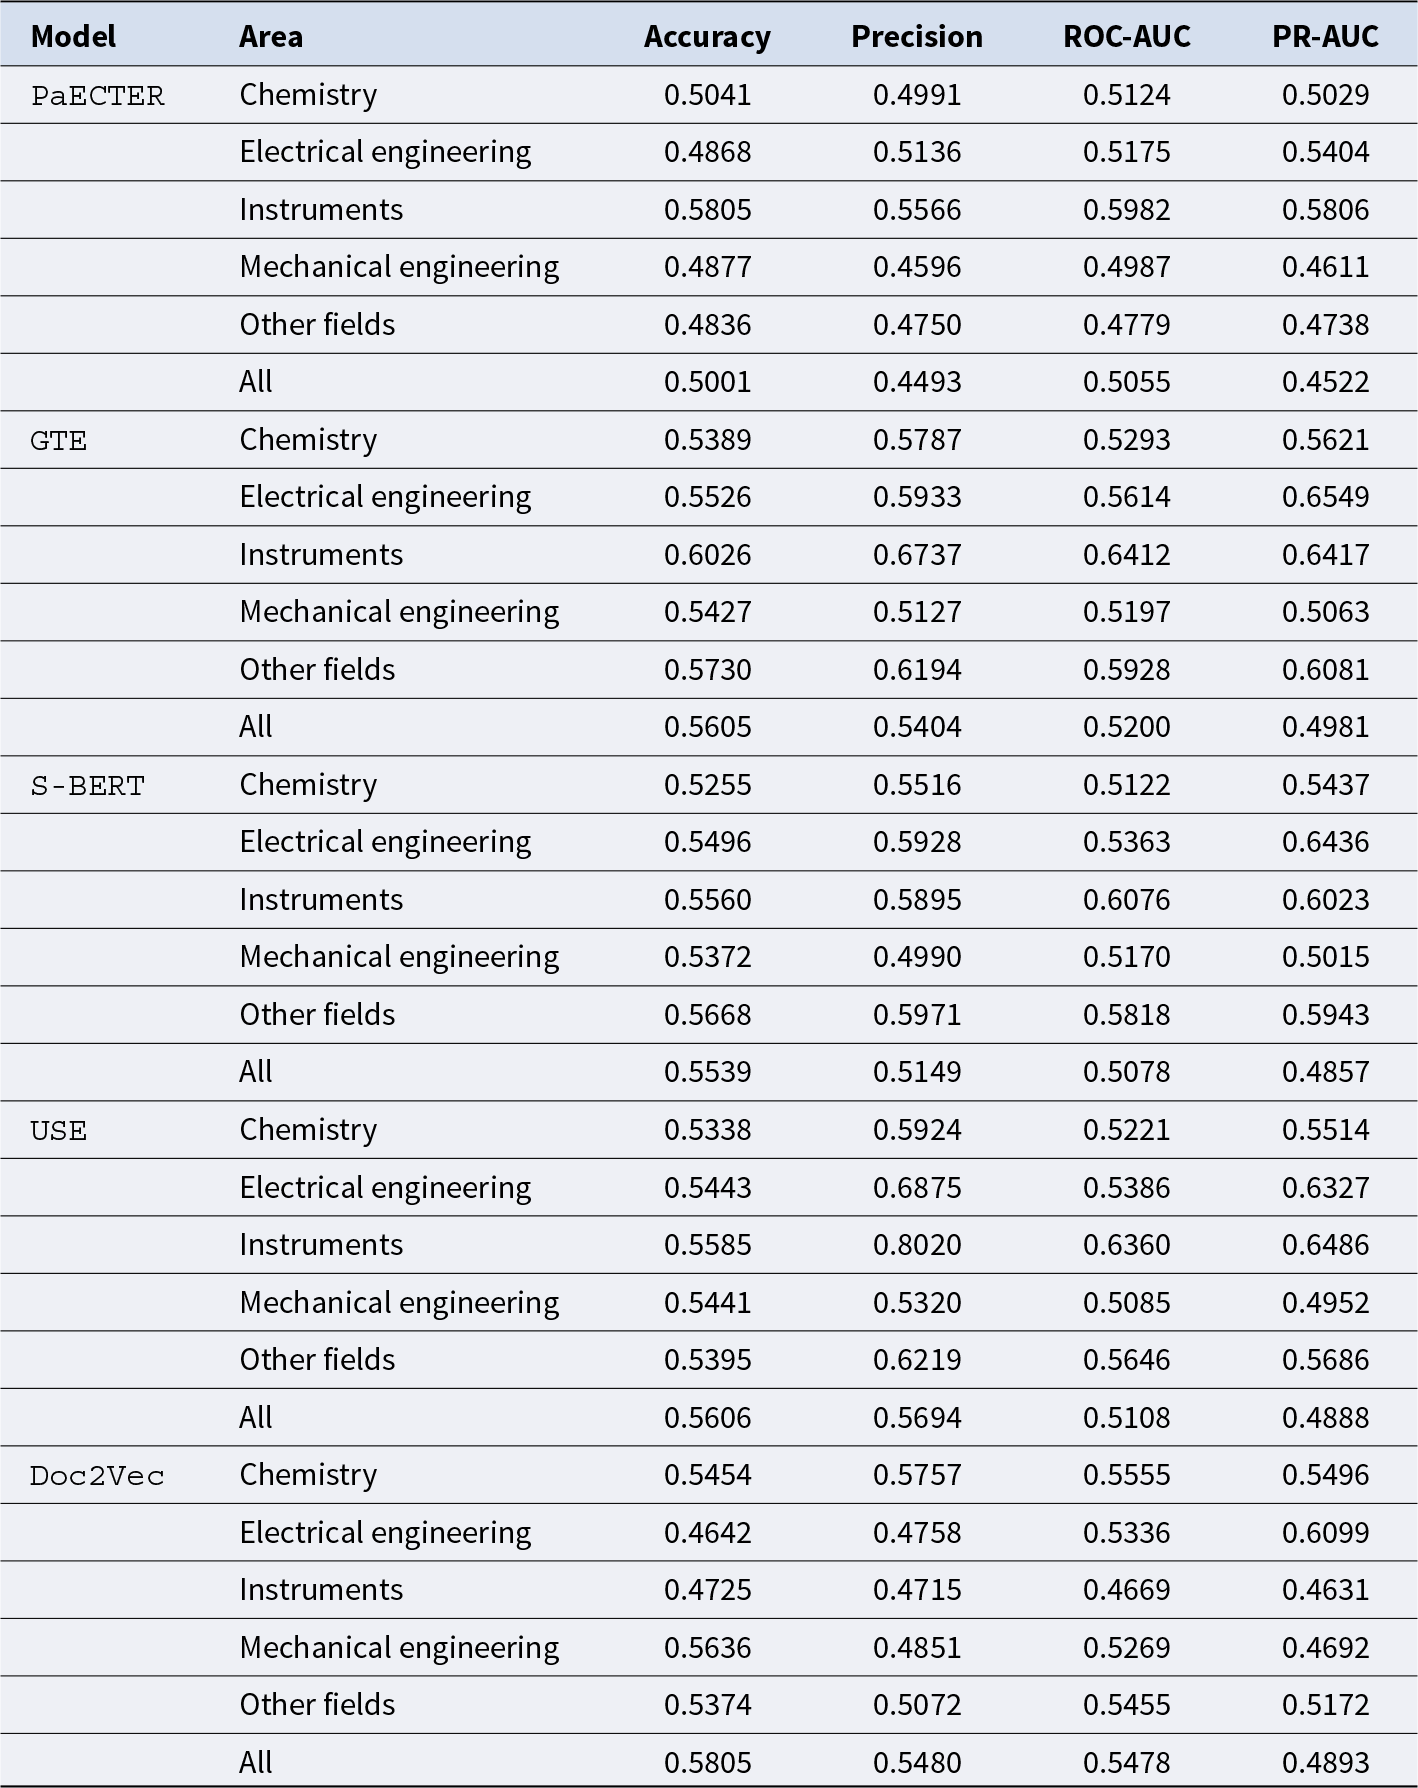
In Table D1 and Figure 5, I estimate the ability of the models to predict the IPC codes between patent pairs and discriminate across technical fields. I begin by grouping the data to extract the embeddings and the set of IPC codes for a pair published in the same year. I then iterate through all unique pairs to compute the cosine similarity matrix and check whether the patents share a common code. The results suggest that all models, except for PaECTER, have some ability to assign patents to their respective classes. In particular, the accuracy metric indicates that models match the IPC code between  $55.4\% - 58.1\%$ of the times. While these scores are considerably low, they reflect the complexity of the IPC system and the subjective variation in how the codes are assigned. In measuring the precision of the classification task, embeddings provide a moderate assessment of similarity compared to the formal system. Out of all patent pairs, GTE and USE offer the best predictions, classifying between
  $54.1\%$ and
  $56.9\%$ of applications correctly; conversely, PaECTER, Doc2Vec, and S-BERT generate a high number of false positives, especially in the field of Mechanical Engineering. Indirectly, this speaks to the nature of innovation within that area, signaling that the use of specialized terms may affect the quality of the embeddings and the classification process. With the exception of Doc2Vec, all models have higher predictive power in matching pairs to the Instruments sector (55.7%–80.2%). This finding hints at the greater homogeneity among systems for the measurement of wine quality and the control of wine-making processes.
Ground-truth labels and model comparisons.

The last two columns summarize how well the five schemes distinguish between patent pairs that share an IPC code, while minimizing the potential for misclassification. As before, the estimates indicate that models can moderately recognize the similarities inherent in the standard classification. Across all pairs, the distribution of scores derived from the embeddings yields consistent matches in  $50.2\%$ and
  $54.8\%$ of cases. Based on the PR-AUC, the models’ ability to distinguish pairs and minimize false positives is relatively low (46.11%–65.49%). This holds true across all domains aside from those pertaining to Instruments and Electrical Engineering, areas where wine innovation shows greater technical homogeneity and convergence over time.
Overall, one could interpret these results as suggesting that all models provide some degree of discrimination. Due to the complexity of the technologies involved, however, this exercise returns low to moderate matches, underscoring the presence of similarities that span across fields. This point helps explain the misclassification, providing reassurance about the models’ ability to understand common features beyond the standard labels.
2. Average Structural Similarity
I compare text with drawing similarity using a metric of image quality, the Structural Similarity Index Measure (SSIM, [Reference Wang, Bovik, Sheikh and Simoncelli29]). As explained in the Appendix, the SSIM accounts for the luminance, contrast, and structure of drawings, mapping similarity to the  $[0,1]$ range. After precleaning and standardizing images, I find a mean value of 39.69% and standard deviation of 0.1330. This score aligns well with the average returned by GTE, indicating that newer embeddings can better mirror changes in visual features. More generally, it demonstrates that patent drawings have noticeable dissimilarities and instability. While some pairs display high similarity; others share few to no structural patterns. Taken together, these differences reflect the broader applicability of inventions related to wine, as well as instances of market concentration that are recognizable in the language of wine patents. While I do not distinguish across fields here, this evidence confirms the existence of high technical overlap across some segments of the wine industry, with significant variation at the lower end of the SSIM scale.
3. Retrieval-Augmented Generation
In the absence of human evaluators, I experiment with Large Language Models (LLMs) to test the embeddings’ performance in tracking technological similarity over time. Throughout, I leverage RAG to evaluate LLMs’ generative abilities and compare them to the output produced by the static models.
In Figure 6, I provide visual evidence that the LLM-retrieved set exhibits a downward trend and closely tracks the performance of GTE, S-BERT, and USE. This finding hints in two directions. Primarily, it highlights the limitations of Doc2Vec and PaECTER in analyzing wine patents. Indirectly, it demonstrates how RAG-based algorithms can reduce distortions in embeddings models, offering an improved assessments of related technologies.
RAG validation and model comparisons.

Overall, the validation process provides robust evidence that larger embeddings are better suited to capture changes in wine innovation. While not without limitations, these exercises help navigate the patent landscape, demonstrating that wine technology has become increasingly diverse since the early 1970s. However, zooming in the specific sectors reveals large disparities across continents and fields, with New World inventors leading the decline almost entirely. More generally, the downward trend has been driven exclusively by the production side of the market and only in part mitigated by the increasing convergence in wine marketing and consumer goods.
V. Conclusion
In this paper, I use natural language processing to analyze the evolution of technological similarity in the wine industry. The findings reviewed above hint in two main directions. First, they provide a primer to map sectoral innovation in the face of changing regulation and new competitors. Second, they demonstrate that model choice can influence our understanding of technological evolution over time. Overall, this evidence cautions wine researchers against an over-reliance on black-box models, highlighting the role of human judgment in determining their efficacy.
Yet, a deeper implication of this research is that wine innovation, as measured by sentence embeddings, is tied to the economic conditions and market structure of the country of invention. This is especially true for sophisticated technologies across the Chemistry and Mechanical Engineering sectors. Such a finding runs counter the hypothesis that differences in R&D stabilize in the long run, with newcomers rapidly narrowing the gap with established innovators. As research-intensive economies continue to reap the benefits of patent protection, the development of wine technology will likely depend on the incentives faced by leaders, not followers [Reference Acemoglu and Zilibotti2, Reference Atkinson and Stiglitz5, Reference Moscona and Sastry20]. On the one hand, this promises to sustain research in basic science among top filers; on the other, convergence by less developed countries seems poised to stall or lag behind. From an economic standpoint, this argument illustrates how barriers to diffusion could amplify the divide among wine patentees.
A second observation stems from the differences in the fields of specialization. Recent advances in wine software and packaging have increased technological similarity among New World producers. Although end-consumer products still represent a minority of the invention share, these patterns likely anticipate higher competition outside traditional wine markets. Whether more intense R&D will deliver changes in productivity or factor endowments in these regions likely depends on the geography of knowledge flows [Reference Jaffe, Trajtenberg and Henderson13]. As posited by leading scholars [ Reference Acemoglu, Aghion and Zilibotti1, Reference Aghion, Bloom, Blundell, Griffith and Howitt3], competition among wine patentees may intensify in the short-run, at the expense of long-term innovation and convergence. More generally, this result shows that absorptive capacity theories fall short in explaining the sectoral misalignment between Old and New World producers.
How can wine policy address the divide and capitalize on convergence? The answer is not straightforward. Implicitly, the analysis suggests that any attempt to leverage similarity should weight the private and social costs of developing wine technologies. Threats posed by trade frictions, the shrinkage of wine markets, and climate change could either curb or stimulate investments in frontier technology. In promoting inclusive growth, wine policy should edge against these risks and mitigate the potential for further divergence. Absent such concerns, patents may offer only partial coverage and fail to reshape technological trajectories.
This study is not without limitations. To begin with, the paper is purely descriptive and the conclusions tied to the models available at the time of writing. Though valuable for analyzing similarity, single vector embeddings suffer from theoretical and contextual biases [Reference Weller, Boratko, Naim and Lee30]. Together, these factors may alter our understanding of wine technology and convergence. While advances in LLMs overcome some of these shortcomings; doubts remain about the ability of general-purpose frameworks to address domain-specific tasks. As NLP continues to evolve, models are improved to learn expressions across multiple corpora. Probing whether the contrasts remain with the advent of newer representations – including proprietary ones – would provide further ground to draw inference from patent data.
Further, the analysis focuses solely on wine. With the ongoing expansion in spirits across key regions, it would be worthwhile to extend this research to other segments of the global beverage market. I would expect this extension to strengthen the external validity of the results and provide new avenues to compare product categories.
Nonetheless, this paper aims to offer a path forward to assess technical transformation in wine-making. Probing how these patterns continue to evolve is key to understand how patents have shaped and will continue to shape the wine industry for the years to come.
Acknowledgements
I thank David A. Jaeger, two anonymous referees, and participants at AAWE 2025 for their valuable comments and suggestions. This work was financially supported by the Economic and Social Research Council (ESRC), grant number ES/P000681/1.
Appendix A. What’s in a patent?
A Sample Patent Application (U.S. Patent No. 9,289,062 B1).

Appendix B. Descriptive statistics
Wine patents by continent, 1970–2023.

Patenting activity in the wine industry by WIPO field, 1970–2023.

Wine patents by WIPO field across continents, 1970–2023.

Appendix C. Visualization of wine patent similarity
Continent Overview
Mean patent similarity by continent (1970–2023).

Technology overview
Mean patent similarity by technology area, 1970–2023.

Appendix D. Validation
D.1. IPC classification
Key evaluation metrics – ground-truth vs embedding output

Notes: The table tests the internal validity of the five embedding models against four evaluation metrics: accuracy, precision, ROC-AUC, and PR-AUC. Each metric aims to summarize the ability of the classifier to correctly predict average similarity based on the International Patent Classification (IPC) code.Source: Author’s Analysis.
D.2. Image similarity
In the field of computer vision, the Structural Similarity Index (SSIM, [Reference Wang, Bovik, Sheikh and Simoncelli29]) measures the luminance, contrast, and structure of a set of images, assigning each pair a score between zero (no correlation) and one (perfect correlation). Unlike the Mean Squared Error (MSE), the index returns a pixel-by-pixel metric of quality that closely aligns with human perception. While the rise of deep learning-based frameworks has widely improved image comparisons, the SSIM remains a point of reference for object recognition and evaluation.
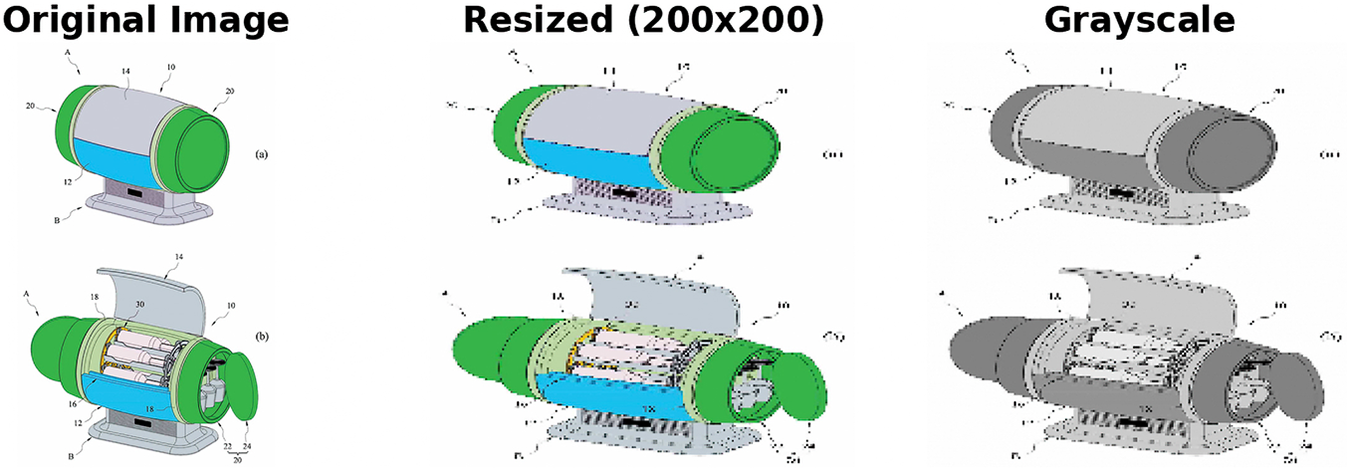
In the analysis, I proceed in two steps. I begin by preprocessing the drawings for feature extraction. As shown in Figure D1, I resize all images to 200x200 pixels and convert them to grayscale.

I then obtain the SSIM score for each image-pair and compute the average for the sample period. Throughout, I consider the following relationship:
 \begin{align*}
SSIM &= \frac{(2 \mu_{x}\mu_{y} + C_{1}) (2\sigma_{xy} + C_{2})}{(\mu^{2}_{x} + \mu^{2}_{y} + C_{1}) (\sigma^{2}_{x} + \sigma^{2}_{y} + C_{2})} \in [0,1],
\end{align*}
\begin{align*}
SSIM &= \frac{(2 \mu_{x}\mu_{y} + C_{1}) (2\sigma_{xy} + C_{2})}{(\mu^{2}_{x} + \mu^{2}_{y} + C_{1}) (\sigma^{2}_{x} + \sigma^{2}_{y} + C_{2})} \in [0,1],
\end{align*}where
•
 $\mu_{x}, \mu_{y}$: average luminance of patent drawings;
•
$\sigma_{x}, \sigma_{y}$: variances of pixel intensity;•
$\sigma_{xy}$: covariance of pixel intensity;•
$C_{1}, C_{2}$: stability constants.


Let  $x$ and
  $y$ be an image pair. The expression evaluates average image luminance,
  $\frac{2\mu_{x}\mu_{y} + C_{1}}{\mu^2_{1}+\mu^2_{2} + C_{1}}$, derives the standard deviations of pixel intensity,
  $\frac{2\sigma_{x}\sigma_{y} + C_{2}}{\sigma_{x}^2 + \sigma_{y}^2 + C_{2}}$, and computes pairwise correlations,
  $2\sigma_{xy} + C_{2}$. At each step, the formula adds stability constants
  $C_{1}$ and
  $C_{2}$ to avoid division by zero. In practice, this metric provides a consistent assessment of similarity by decomposing image quality into three components and evaluating their perceptual distance.
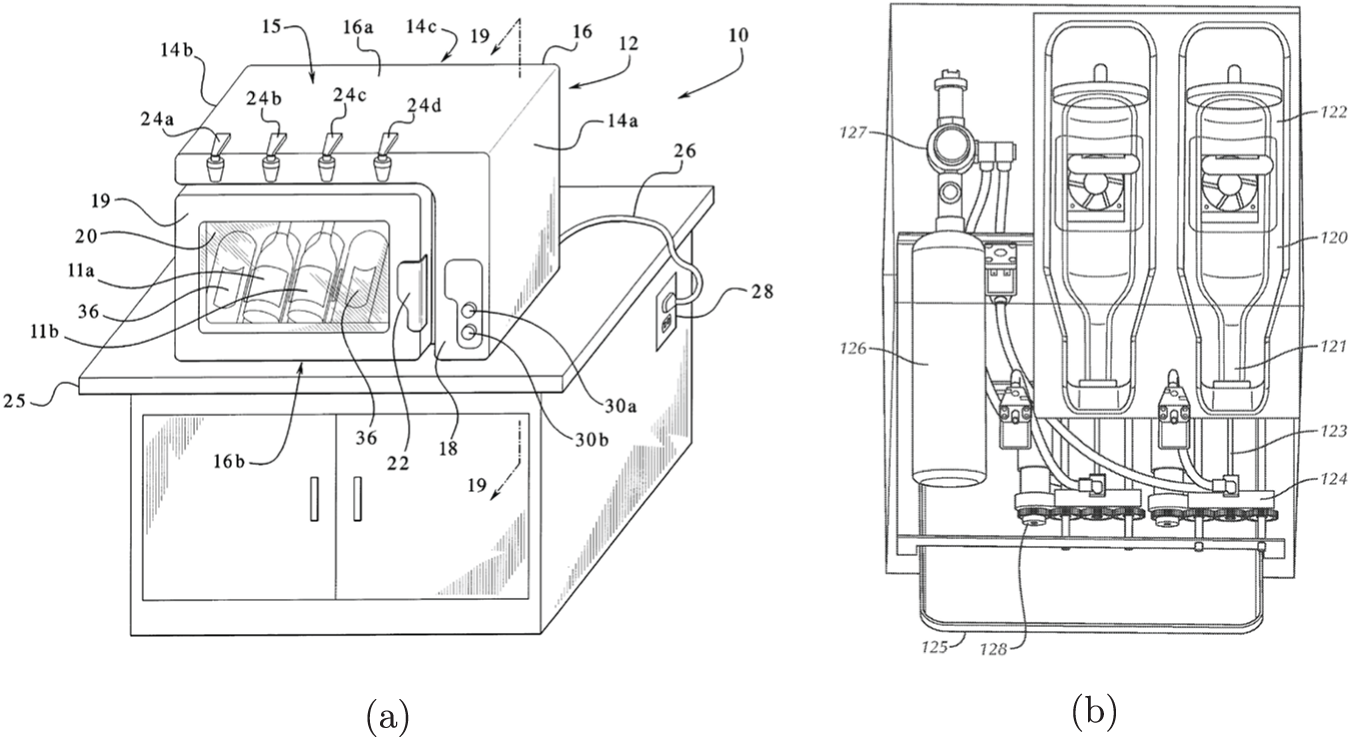
Patents with High Image Similarity. (a) Patent US-6557369-B1 [Reference Hubbard, Mustatea and Koretz12]. (b) Patent US-10940449-B2 [Reference Phelps, O’Connor, Deller and Lydon22].

RAG validation via LLM
Retrieval-Augmented Generation (RAG) leverages Large Language Models (LLMs) to pull relevant information from an input text. In this paper, I first build a RAG chatbox using an open-source LLM, Mistral-7B-Instruct-v0.3. The querying function of the chatbox builds on Mistral 7B to process and rank patents based on cosine similarity. As shown below, the use of RAG can simplify the retrieval of related abstracts:
• Patent ES410336A1 “A Method for the Champagnization of Wine in Continuous Current.”
Abstract: A method for the wine champagnization in direct current, based on the fact that the fermentable material is configured in a current and subjected to secondary fermentation in a current under constant pressure and gradually decreasing temperature, characterized in that the secondary fermentation occurs in a single vessel, the flow direction of the fermentable material being inverted at least once and the average linear flow rate remaining constant, the gradual reduction of the process temperature being achieved by cooling the fermentable material in the terminal part of the process. The current, followed by the recuperative cooling of the total current. - Publication Date: 5/16/1976
• Patent CA1096792A “Continuous-Flow Wine Champagnization Process.”
Abstract: The present invention relates to a continuous-flow wine champagnization process. The starting fermentation broth consisting of champagne wine-stock, saccharose and yeast cells is fed into an apparatus and passed through a yeast mass accumulated at a constant separation of yeast cells from the wine stream. The process according to the present invention resides in that a secondary fermentation of the starting fermentation broth is effected at a temperature of up to 150.degree.C, followed by enrichment of the resulting champagnized wine with biologically active yeast substances. Under the conditions of the process according to the present invention these two stages are combined. The process according to the present invention makes it possible to intensify champagnization, improve the product quality and increase, by 2–3 times, the product output per unit production area. - Publication Date: 3/3/1981
• Patent LV10639A “Method for Permanent Producing of Sparkling Wine”
Abstract: The method of continuous wine “champagnization” is carried out by performing repeated fermentation of the fermentation mixture through the continuous presence of a pure yeast culture flowing to “champagnization” on fillings of the fermentation device and enriching champagnized wine with bioactive substances in the same fermentation device. This innovative method is supplemented with the repeated fermentation of the fermentation mixture and the enrichment of the champagnized wine in a whole chain of separate devices with a simultaneous collecting of the champagnized wine in single flow from the top of each device. The first device, in order of champagnized wine collection, is filled at 70–80% of its height, while the next is filled at 40–50%. If there are more than two devices, the side ones are filled at 70–80% of their height, while the middle devices are filled at 40–50%. Publication Date: 8/20/1995.
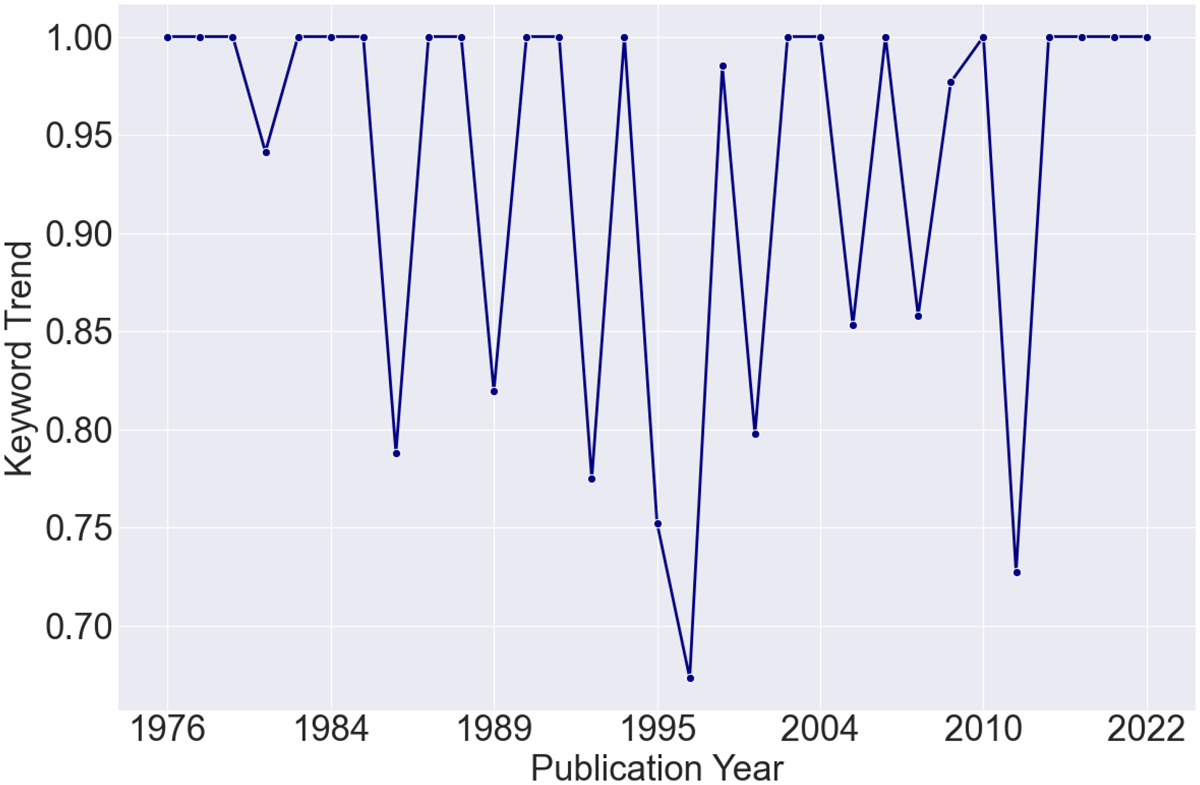
After retrieval, the RAG function may be employed for keyword and trend research. In Figure D3, I query the word “champagnization” from the patent corpus and plot its frequency for years 1970–2023. As shown, patentees most commonly referred to this term in years 1986, 1996, and 2011.
RAG trend for “champagnization”, 1970–2023.


 Open access