


1. Introduction
It is well known that approximately 79 % of the global total precipitation occurs over the ocean (Barry & Chorley Reference Barry and Chorley2009) and approximately 70 % to 85 % of the heat energy that the global atmosphere receives is latent heat released from precipitation (Salby Reference Salby1996; Simpson et al. Reference Simpson, Kummerow, Tao and Adler1996; Aplers & Melshelmer Reference Aplers and Melshelmer2004). Rainfall over the ocean greatly enhances the exchange of gas across the air–water interface (Zappa et al. Reference Zappa, Ho, McGillis, Banner, Dacey, Bliven, Ma and Nystuen2009;Harrison et al. Reference Harrison, Veron, Ho, Reid, Orton and McGillis2012), creates turbulence in the upper ocean layer (Harrison & Veron Reference Harrison and Veron2017), and affects the production and concentrations of sea spray aerosols (Lewis & Schwartz Reference Lewis and Schwartz2004). A recent study (Lehmann et al. Reference Lehmann, Oehlschlägel, Häusl, Held and Gekle2021) shows that tiny droplets (called secondary droplets herein) produced by the impact of raindrops on a water surface serve as vehicles for the transport of micro-plastic particles from ocean water to the atmosphere.
When large raindrops impinge on the ocean surface, they create splash products, consisting of crowns, central jets (stalks) and cavities, on the water surface and myriad secondary water droplets in the air, as part of sea sprays. These surface features are crucial to understanding radar backscattering from the ocean surface in a rain field. In a laboratory study, Braun, Gade & Lange (Reference Braun, Gade and Lange2002) showed that the cross-polarization radar backscattering from the water surface, dominated by rain-induced splash products, increases with increasing rain rate for a range of wind speeds less than 12 m s $^{-1}$. Studies given by Liu et al. (Reference Liu, Zheng, Liu, Wang, Duncan and Huang2016, Reference Liu, Zheng, Liu, Sletten and Duncan2017) revealed that the radar backscattering intensity in response to oceanic rainfall correlates with the average distance between the rain-generated stalks on the ocean surface and is influenced to a certain degree by the concentration of secondary droplets near the air–water interface.
The role of rain-generated secondary droplets in the formation of sea sprays has been largely overlooked (Veron Reference Veron2015; Okachi et al. Reference Okachi, Yamada, Baba and Kubo2020). Several mechanisms are involved in the generation of these droplets in rain field. Using the volume-of-fluid lattice Boltzmann method, Lehmann et al. (Reference Lehmann, Oehlschlägel, Häusl, Held and Gekle2021) performed a great number of numerical simulations of single raindrop impact with various raindrop diameters and provided a detailed statistical analysis on the secondary droplets ejected from the upper edge of the crowns that form as thin water sheets shooting upward around the impact sites. They showed that a raindrop of diameter 4 mm impacting on the water surface at terminal velocity can produce hundreds of such droplets. An experimental study given by Liu (Reference Liu2018) shows that the number of secondary droplets generated by this kind of mechanism is greatly affected by wind. In addition, it is well known that rainfall entrains bubbles that collapse to generate underwater sound (Prosperetti & Oguz Reference Prosperetti and Oguz1993). When these bubbles reach the ocean surface, their thin water film caps drain and eventually burst, projecting film drops into the atmosphere (Spiel Reference Spiel1998). Both experiments (Blanchard Reference Blanchard1989) and numerical simulations (Deike et al. Reference Deike, Ghabache, Liger-Belair, Das, Zaleski, Popinet and Séon2018; Gañán-Calvo & López-Herrera Reference Gañán-Calvo and López-Herrera2021) showed that the popping bubbles also can eject thin and fast vertical water jets, resulting in several jet droplets under certain flow regimes.
The main focus of the present laboratory experiments is to explore the dynamics of secondary droplets generated by raindrops impacting a water surface. Using cinematic in-line holography, new observations of the droplets in the air layer directly above the water surface are provided. With the experimental observations, several droplet generation mechanisms and basic air–water mixing features in the atmospheric surface layer, including the vertical profile of the liquid water content that is important to radar application, are revealed.
The remainder of this paper is organized as follows. The experimental set-up and measurement techniques are described in § 2. The results and discussion are presented in § 3. Finally, conclusions are given in § 4.
2. Experimental details
The experiments were performed in a rain facility that includes an overflow water pool and a rain generator, see figure 1(a). The overflow water pool is 1.2 m by 1.2 m square in plan view with a depth of 0.31 m. The pool is constructed of transparent acrylic and two opposing sidewalls of the tank are 1.27 cm lower than the other two sidewalls. The pool is supported by a short frame which is adjusted so that the upper edges of the two lower sidewalls form a horizontal plane. Before the experiments, the pool was fully filled with filtered tap water mixed with sodium hypochlorite at a concentration of 10 ppm. This high level of chlorination was used to maintain low levels of bacteria and other organic material which are known to produce surfactants. A circulation system was used to skim the pool water into a separate water reservoir tank and pump it back to the pool via a filter system for a period of two days. During the rain experiments, the water in the reservoir tank is pumped into the rain generator and the pool is operated with a constant water level by maintaining an overflow condition at the two lower sidewalls with inflow due entirely to the incoming raindrops. The surface tension at the air–water interface in the pool was monitored with a Langmuir trough system (KSV NIMA, model KN 1003) just before and after the rain experiments and the ambient surface tension was kept constant, i.e.  $\sigma = 72.6$ mN m $^{-1}$.
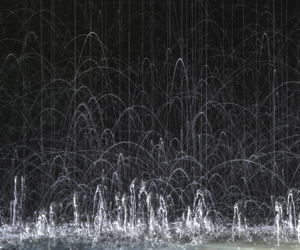
(a) Schematic showing the rain simulation facility. The drawing is not to scale. The rain impact area on the water surface is approximately 0.51 m long (in the direction of the laser beam) and 0.36 m wide. Both the horizontal laser beam and the camera are set at the same height relative to the overflow pool by using the two traverses. (b) Long-exposure photographic image showing raindrops (straight vertical lines), stalks (bright trajectories near the water surface) and secondary droplets (thin trajectories above the stalks).

The rain generator consists of a rectangular water tank (horizontal dimensions 0.9 m by 0.6 m) with an array of hypodermic needles mounted vertically on the bottom of the tank to produce raindrops. In this study, 370 needles (22 gauge with an inner diameter of 0.41 mm and a length of 6.35 mm) are used to produce raindrops with a diameter of approximately 2.74 mm. The distance between the needles is approximately 2.54 cm, resulting in a rain site area of 0.51 m by 0.36 m on the water surface of the pool. The bottom of the rain generator tank was positioned 2.3 m above the water pool and the impact speed of the raindrops on the water surface was 5.6 m s $^{-1}$. The rain rate is regulated by using an overflow pipe to control the water depth in the rain generation tank. Herein, heavy rains with two rain rates, ${\rm RR} = 140$ and 381 mm h $^{-1}$, are studied. The two rain rates are within the range of prior laboratory experiments investigating the interactions between heavy rainfall and surface wave turbulence (Tsimplis & Thorpe Reference Tsimplis and Thorpe1989; Tsimplis Reference Tsimplis1992; Peirson et al. Reference Peirson, Beyá, Banner, Peral and Azarmsa2013; Harrison & Veron Reference Harrison and Veron2017).
In order to create random raindrop impact locations on the water surface, the rain generator is mounted on a linear traverser system with two degrees of freedom travelling on a horizontal plane. Each motion axis of the traverser system consists of two parallel rails, bearings, a servomotor, a crank-piston drive mechanism and a linear position feedback sensor. The rain generator is mounted on the top motion axis mechanism, while the traverser system is attached to a tall frame that is in turn attached to the laboratory ceiling and sidewalls to stabilize the entire rain simulation system. The motion of the rain generator is controlled by a computer using the position feedback sensor on each motion axis. In this study, the motion of the rain generator was circular with a diameter of 1.3 cm and a frequency of 1.0 Hz. With these values of diameter and frequency, the horizontal distance between the impact locations of two consecutive raindrops released from one needle ranges from 0.5 to 1.0 cm for the two rain cases. Given this droplet impact spacing for droplets from a single needle and the 2.54 cm distance between the needles, the possibility of collision between raindrops and antecedent splashes, resulting from the impacts of previous raindrops from surrounding needles, is very low. However, such collisions may still occur in the rain field since the raindrops are randomly released with time.
Secondary droplets and raindrops at various heights ( $H_c$) above the water surface are measured with a cinematic in-line holographic technique using a high-speed camera and an expanded laser beam. The technique implements the principle that a droplet located in the pathway of a collimated laser beam induces a diffraction wave pattern that is superposed with the reference wave thereby creating a holographic image on the camera sensor. The light source for the holograms is an expanded laser beam with a diameter of approximately 75 mm that is generated by a pulsed Nd:YLF laser (CrystalLaser, QL527-200) in combination with a set of optical lenses, a spatial filter and a neutral density optical filter. A mirror is used to orient the laser beam horizontally across the 0.51 m width of the rain field and this mirror is attached to a vertical traverser that is attached to one side of the water pool, see figure 1(a). The high-speed camera (Phantom VEO 640L, 2560 by 1600 pixel with resolution 10 $\mathrm {\mu }$m per pixel) fitted with an Infinity K-2 long-distance microscope lens that is focused with a one-to-one magnification is attached to a second vertical traverser that is mounted on the opposing side of the rain pool. The camera and the laser beam are set at the same height and the camera sensor directly faces the expanded incoming laser beam. The field of view for the holograms is $2.56\times 1.6$ cm $^2$ with a measurement volume of 209 cm $^3$. The camera records 1000 holograms per second with one laser light pulse per image as the droplets pass through the expanded laser beam over a total time of 12 s for each experimental run.
The physical 3-D location and radius (diameter) of each droplet are extracted from a given hologram in the two-step procedure described below. In the first step, the holographic images along the laser beam axis ( $z$) across the width of the rain field are numerically reconstructed by employing an angular spectrum method based on the Rayleigh–Sommerfeld diffraction formula. The complex wave field at any plane perpendicular to $z$ is given as follows (Katz & Sheng Reference Katz and Sheng2010):
 \begin{equation} E(x,y,z)=\iint S(k_x, k_y)\exp[jzk\sqrt{(1-(k_x/k)^2-(k_y/k)^2)}]\,{\rm e}^{j(xk_x+yk_y)}\,{\rm d}k_x \,{\rm d}k_y, \end{equation}
where,  $S(k_x,k_y)=\iint E_0(x, y)\,{\rm e}^{-j(k_xx+k_yy)}\,{\rm d}\kern 0.05em x\, {{\rm d}\kern 0.05em y}$ is the Fourier transform of the hologram $E_0(x,y)$ recorded at the image plane ( $z=0$), $k_x$ and $k_y$ are the corresponding spatial frequencies of the image coordinates $x$ and $y$, respectively, and $k=2{\rm \pi} /\lambda$ is the wavenumber of the laser light with a wavelength of $\lambda =527$ nm. The intensity distribution of the complex wave field is used to reconstruct a holographic image at $z$. With intervals of 1 mm in $z$, 511 reconstructed images are generated from a single hologram, covering the entire measurement volume of the rain field.
In the second step of the droplet position and radius determination, raw data of the radii and position for the droplets in all of the images reconstructed along the laser beam are estimated. For a given droplet, its centre in each reconstructed image, if detected, is nearly the same. Thus for each droplet and each reconstructed image, a subimage with size slightly greater than that of the droplet image is created. The edge sharpness of each cropped image is quantified by applying the Laplacian operator to each pixel. The numerical value of this edge sharpness measure is calculated by
 \begin{equation} L_{P}(z)=\sum_{x,y}[\nabla^2 I(x,y,z)]^2, \end{equation}
where,  $I(x,y,z)$ is the intensity of the cropped image reconstructed at $z$. The image with the maximum of the sharpness measure is taken as the in-focus reconstructed hologram image and the $z$ value of this image is taken as the physical $z$ location of the droplet. This reconstructed image is also used to determine the droplet radius and the $x$–
$x$– $y$ position of its centre. Further details can be found in Erinin et al. (Reference Erinin, Liu, Wang, Liu and Duncan2023) and others.
The in-line hologram system was calibrated with a custom calibration target consisting of a flat glass plate with 14 sputter-deposited circular dots with radii from 15 to 1500  $\mathrm {\mu }$m. Before and after the rain experiments, six holograms of the target placed at positions separated by 0.1 m along the laser beam and covering the entire width of the measurement field were recorded. With the reconstruction scheme mentioned above, the dots with radii $\geq 0.05$ mm (50 $\mathrm {\mu }$m) were measured. The measurement accuracy of the dots varies with position relative to the lens focal plane. This accuracy is of the order of 0.5 pixel (0.005 mm) when near the focal plane but 2–3 pixels when at the limits of the rain field. In addition, it is noted that small droplets in the measurement volume that are completely occluded by large ones cannot be measured with this holographic technique. To remedy this issue, a large sample size is used in the statistical analyses given in § 3.
The trajectories of droplets in the  $x$–
$x$– $y$ plane are obtained from consecutive frames with a particle tracking algorithm based on a minimum acceleration criterion, i.e. droplets moving with nearly constant velocity during a very short time interval. The algorithm is described below and further details can be found in Malik et al. (Reference Malik, Dracos and Papantoniou1993) and Ouellette, Xu & Bodenschatz (Reference Ouellette, Xu and Bodenschatz2006). In the algorithm, assuming that a set of links between droplets in the $(n-1)$th frame and the $n$th frame have been established, let $\boldsymbol {x}_{\boldsymbol {i}}^{\boldsymbol {n}}$ denote the position of the $i$th linked droplet in the $n$th frame. The tracking algorithm then searches for an $\boldsymbol {x}^{\boldsymbol {n+1}}_{\boldsymbol {j}}$ for each $\boldsymbol {x}_{\boldsymbol {i}}^{\boldsymbol {n}}$ such that $\boldsymbol {x}_{\boldsymbol {j}}^{\boldsymbol {n+1}}$, the position of the $j$th droplet in frame $n+1$, is the $i$th linked droplet in frame $n$ that was at the position $\boldsymbol {x}_{\boldsymbol {i}}^{\boldsymbol {n}}$. To determine which of all the $\boldsymbol {x}^{\boldsymbol {n+1}}_{\boldsymbol {j}}$ to choose, the criterion of minimum acceleration in three frames is used and the optimal solution to making links between $\boldsymbol {x}_{\boldsymbol {i}}^{\boldsymbol {n}}$ and $\boldsymbol {x}^{\boldsymbol {n+1}}_{\boldsymbol {j}}$ is to minimize the tracking cost $\varPhi$ as follows:
 \begin{equation}
\varPhi=\sum_{i}\sum_{j}\frac{\|\boldsymbol{x}^{\boldsymbol{n+1}}_{\boldsymbol{j}}-2\boldsymbol{x}^{\boldsymbol{n}}_{\boldsymbol{i}}+\boldsymbol{x}^{\boldsymbol{n-1}}_{\boldsymbol{i}}\|}{\Delta
t^2}.
\end{equation}
\begin{equation}
\varPhi=\sum_{i}\sum_{j}\frac{\|\boldsymbol{x}^{\boldsymbol{n+1}}_{\boldsymbol{j}}-2\boldsymbol{x}^{\boldsymbol{n}}_{\boldsymbol{i}}+\boldsymbol{x}^{\boldsymbol{n-1}}_{\boldsymbol{i}}\|}{\Delta
t^2}.
\end{equation}
Here,  $\Delta t=1$ ms is the time interval between frames. In order to improve the efficiency of computation, the positions of the $i$th linked droplet in frames $n-1$ and $n$ are used to calculate its velocity $\boldsymbol {v}_{\boldsymbol {i}}^{\boldsymbol {n}}$ and a position for the droplet in frame $n+1$ is estimated by
 \begin{equation}
\tilde{\boldsymbol{x}}^{\boldsymbol{n+1}}_{\boldsymbol{i}}=\boldsymbol{x}_{\boldsymbol{i}}^{\boldsymbol{n}}+\boldsymbol{v}_{\boldsymbol{i}}^{\boldsymbol{n}}\Delta
t.
\end{equation}
\begin{equation}
\tilde{\boldsymbol{x}}^{\boldsymbol{n+1}}_{\boldsymbol{i}}=\boldsymbol{x}_{\boldsymbol{i}}^{\boldsymbol{n}}+\boldsymbol{v}_{\boldsymbol{i}}^{\boldsymbol{n}}\Delta
t.
\end{equation}
The tracking cost  $\varPhi$ in (2.3) is calculated only with those droplets in a search area surrounding the estimated position $\tilde {\boldsymbol{x}}^{\boldsymbol{n+1}}_{\boldsymbol{i}}$. Also, if $\tilde {\boldsymbol{x}}^{\boldsymbol{n+1}}_{\boldsymbol{i}}$ is beyond the image boundary, the tracking for the $i$th linked droplet in the $n$th frame ends.
Next, all the unlinked droplets in the  $n$th frame are considered as new droplets entering in the measurement volume. Let $\boldsymbol {X}_{\boldsymbol {i}}^{\boldsymbol {n}}$ denote the position of the $i$th unlinked droplet in the $n$th frame while $\boldsymbol {X}_{\boldsymbol {j}}^{\boldsymbol {n+1}}$ refers to the position of the $j$th unlinked droplet in the $(n+1)$th frame. The links between $\boldsymbol {X}_{\boldsymbol {i}}^{\boldsymbol {n}}$ and $\boldsymbol {X}_{\boldsymbol {j}}^{\boldsymbol {n+1}}$ are established with the minimum acceleration criterion, too, by minimizing the tracking cost $\varPhi _N$ that is given as follows:
 \begin{equation}
\varPhi_N=\sum_{i}\sum_{j}\sum_{k}\frac{\|\boldsymbol{x}^{\boldsymbol{n+2}}_{\boldsymbol{k}}-2\boldsymbol{X}^{\boldsymbol{n+1}}_{\boldsymbol{j}}+\boldsymbol{X}^{\boldsymbol{n}}_{\boldsymbol{i}}\|}{\Delta
t^2},
\end{equation}
\begin{equation}
\varPhi_N=\sum_{i}\sum_{j}\sum_{k}\frac{\|\boldsymbol{x}^{\boldsymbol{n+2}}_{\boldsymbol{k}}-2\boldsymbol{X}^{\boldsymbol{n+1}}_{\boldsymbol{j}}+\boldsymbol{X}^{\boldsymbol{n}}_{\boldsymbol{i}}\|}{\Delta
t^2},
\end{equation}
where  $\boldsymbol{x}^{\boldsymbol{n+2}}_{\boldsymbol{k}}$ is the position of the $k$th droplet in the $(n+2)$th frame. The tracking algorithm for new droplets with the minimum acceleration criterion performs better than the nearest neighbour heuristic (Ouellette et al. Reference Ouellette, Xu and Bodenschatz2006), especially when a group of new droplets close to one another in one frame have a wide spread in the next frame. After the tracking of one hologram movie is completed, the new droplets from all the frames form the data set of the droplets found in the movie. The droplet velocities are defined as the differences between their positions of two consecutive frames divided by the time interval between the two frames.
During the tracking process, certain conflicts occur when a droplet in frame  $n+1$ is the best match for multiple droplets in frame $n$, arising from overlapping and/or colliding droplet images. To handle the conflicts, the involved links except that with the largest droplet radius, labelled $A^n$, are stopped at frame $n$ and new links are considered to have begun as soon as the overlapping or colliding is over within the next several frames. After all the frames in one movie have been processed, a set of links, labelled $B^{n+1}$, starting from the $(n+1)$th and the next several frames are selected. Connections between the links in $A^n$ and $B^{n+1}$ are established by searching for a best fit of a second-order polynomial to the droplet position varying with time for each stopped pair (from $A^n$ to $B^{n+1}$). The tracking algorithm was verified by surveying a number of sampled images obtained in both rain cases.
The raindrops and secondary droplets are separated into two data sets after the droplet trajectories are found. As previously stated, with one particular needle size and the same fall height, the raindrops in a state of free fall have a diameter of approximately 2.74 mm and reach the water surface at a velocity of 5.6 m s $^{-1}$. Since such large drops with such a high speed cannot be generated by the impact of raindrops on the water surface, the data set of raindrops is formed by the droplets of radii $\approx 1.37$ mm with a downward velocity of approximately 5.6 m s $^{-1}$ and zero horizontal velocity. The raindrops are excluded from the data set of secondary droplets. The raindrop and secondary droplet data sets are checked by using the fact that the number of raindrops does not change with height $H_c$, while the number of secondary droplets decreases drastically with increasing $H_c$.
The data set consisting of the droplet radii,  $R$, measured with the holographic axis located at various heights ( $H_c =4.0$, 8.0, 12.0 and 16.0 cm for ${\rm RR}=140$ mm h $^{-1}$, and $H_c =4.4$, 7.5 and 9.5 cm for ${{\rm RR}=381}$ mm h $^{-1}$) above the mean water surface, and the horizontal and vertical velocity components, $u_0$ and $v_0$, respectively, as each secondary droplet enters the measurement volume at the lowest measurement height for each rain rate, is presented and discussed in the following sections. The holographic image sequences are also used to elucidate the mechanisms that create some aspects of this data.
3. Results and discussion
A qualitative idea of the rain impact system consisting of raindrops, stalks (also called jets in Michon, Josserand & Séon Reference Michon, Josserand and Séon2017) and secondary droplets can be seen in the long-exposure-time diffuse light side view image given in figure 1(b). In the image, raindrops in a state of free fall appear as straight vertical lines. The thick bright curves near the water surface are the stalks (jets), while the secondary droplets appear as thin dim nearly parabolic curves. The intensity of a given feature is affected by both its size and speed. As can be seen from the image, two distinct layers of liquid water content are formed above the air–water interface of the rain field. The bottom layer (the bright region) near the water surface is dominated by a dense population of stalks, while the top layer consists of a cloud of secondary droplets. The height of the bottom layer is approximately 15 mm based on the average stalk height of 14.85 mm as reported in Liu et al. (Reference Liu, Zheng, Liu, Wang, Duncan and Huang2016), while the top of the layer of secondary droplets extends to a height estimated by visual observation of approximately 0.4 m. A decrease in the number of secondary droplets with height is clearly visible in the image. For reference, the initial vertical velocity component of a 1 mm diameter droplet that reaches a maximum height of 0.4 m in otherwise stationary air is estimated by the model described in § 3.3 to be approximately 3.5 m s $^{-1}$.
3.1. Characteristics of secondary droplets near the water surface
In order to show the distribution of radii and velocities of secondary droplets near the water surface, heat-map scatter plots of  $u_0$ and $v_0$ vs $R$ at the lowest measurement height for the two rain rates are given in figure 2(a–d). Since the data are recorded as each droplet enters the measurement volume, positive vertical velocity components indicate that the droplets are ejecting from the impact sites of raindrops on the water surface while droplets with negative vertical velocity components are settling back to the pool water.
Heat-map scatter plots of secondary droplet vertical (a,c) and horizontal (b,d) velocity components, respectively, vs droplet radius,  $R$, at $H_c = 4$ cm for ${\rm RR}= 140$ mm h $^{-1}$ (a,b) and $H_c = 4.4$ cm for ${{\rm RR} = 381}$ mm h $^{-1}$ (c,d), and the p.d.f. curves of vertical (e) and horizontal (f) velocity components with the same data as the heat-map scatter plots. In the heat-map scatter plots, the plot symbol colour gives the local number of droplets measured in $\Delta R = 0.014$ mm by $\Delta v_0 = 0.043$ m s $^{-1}$ (or $\Delta u_0$) rectangles. The dashed lines in (a) and (c) are the terminal velocity of raindrops falling in still air, given by equation (2) in Liu et al. (Reference Liu, Zheng, Liu, Wang, Duncan and Huang2016). The average diameters of raindrops for both rain rates are approximately $D_R=2.74$ mm and the total numbers of secondary droplets measured over the period of 12 s are 61 021 for ${\rm RR}=140$ mm h $^{-1}$ and 191 763 for ${\rm RR}=381$ mm h $^{-1}$, respectively.

Heat-map scatter plots of  $v_0$ and $u_0$ vs $R$ at $H_c = 4$ cm for ${\rm RR} =140$ mm h $^{-1}$ are given in figure 2(a,b), respectively. In the figures, the colourbars refer to the local number of droplets measured in rectangular cells of $\Delta R = 0.014$ mm by $\Delta v_0$ (or $\Delta u_0$) $=0.043$ m s $^{-1}$ and the total number of droplets is 61 021. As can be seen from figure 2(a), secondary droplets are mainly distributed in three regions, labelled I, II and III. The vast majority of droplets (approximately 99.7 % of the total number) are in Region I, which consists of a right triangular region formed by $R>0$, $v_0>0$ and $v_0+5R\le 4$, where $R$ is in mm and $v_0$ in m s $^{-1}$, for ascending-motion droplets and a half-circle for descending-motion ones. The right triangle shape for ascending-motion droplets indicates that in general the maximum droplet ejection vertical velocity decreases with increasing droplet radius. Region II consists of a group of large droplets ( $R>0.8$ mm) for which $v_0$ is uncorrelated with the radius and $|v_0|$ is typically less than 1.0 m s $^{-1}$. Also, figure 2(b) shows that the $u_0$ values of the droplets in Region II are very close to zero, indicating that these large droplets mainly move in the vertical direction. Only approximately 0.11 % of the total number of droplets are found in Region II. Region III is defined to include all downward-moving droplets with $|v_0|$ greater than the terminal settling speeds for droplets in still air as given by the red dashed curve (see the figure 2 caption for additional details). The droplets in Region III comprise only approximately 0.2 % of the total number of measured droplets and most have radii less than approximately 0.3 mm.
In order to evaluate the effects of rain rate on the dynamics of the secondary droplets in a rain field, heat-map scatter plots of  $v_0$ and $u_0$ vs $R$ at $H_c =4.4$ cm for ${\rm RR} =381$ mm h $^{-1}$ are presented in figure 2(c,d), respectively. A total number of 191 763 droplets are used in the figures and a slightly different value of $H_c$ than the prior rain rate is due to a change of the measurement unit on the ruler used for operational convenience. As can be seen by comparing these figures with figure 2(a,b), where ${\rm RR} = 140$ mm h $^{-1}$, the three regions defined above are also evident at the higher rain rate and the ranges of $u_0$ and $v_0$ for the large droplets in Region II are nearly the same as those observed at ${{\rm RR}=140}$ mm h $^{-1}$. However, the shape of each region varies with increasing rain rate and the percentages of secondary droplets increase in Regions II and III to approximately 0.31 % and 2.15 % of the total number, respectively. In addition, both vertical and horizontal velocity ranges increase markedly for both the ascending-motion droplets in Region I and the descending-motion droplets in Region III. This is confirmed by the p.d.f. curves of both the vertical and horizontal velocities of the secondary droplets in the rain field, as shown in figure 2(e,f), respectively. From the plots, one can see that the p.d.f. curves for the two rain rates are nearly the same in the range $-$1.4 to 2.8 m s $^{-1}$ for $v_0$ and $-$2.8 to 2.8 m s $^{-1}$ for $u_0$, corresponding to Region I, but outside this range the p.d.f. values for the ${\rm RR} = 381$ mm h $^{-1}$ are substantially higher. The range $-$4.5 to $-$2.8 for $v_0$ corresponds to Region III in figure 2(a,c). In addition, the asymmetrical shape of the p.d.f. curve for the vertical velocity ( $v_0$) shows different dynamic characteristics of the secondary droplets between ascending- and descending-motion in the rain field. The peak at $v_0\approx -0.5$ m s $^{-1}$ corresponds to the tiny droplets settling with a speed close to their terminal velocity (the peak near the dashed line in Region I). In contrast, the symmetrical shape of the p.d.f. curve about $u_0=0$ for the horizontal velocity indicates that, as expected, there is no preference for secondary droplet motion to the right or left since they are generated by vertically moving raindrops in a uniform rain field. The high peak at $u_0=0$ in figure 2(f) demonstrates that a large portion of the secondary droplets move in the vertical direction.
The physical processes that create the above-described characteristics of the plots in figure 2 are discussed below in §§ 3.2 and 3.3.
3.2. Generation mechanisms of secondary droplets
As noted above, most of the secondary droplets measured close to the water surface are in Region I of the  $v_0$– $R$ scatter plots in figure 2(a,c). Though there are roughly equal numbers of upward-moving ( $v_0>0$) and downward-moving ( $v_0<0$) droplets in this region, the two distributions of the droplets on the $v_0$– $R$ coordinates of each plot are markedly different. These differences are not surprising since upward-moving droplets that do not undergo collisions have vertical speeds close to their ejection speed at the water surface, diminished only by drag and gravity during their relatively short travel distance to the measurement site. On the other hand, downward-moving droplets that do not undergo collisions can have vertical speeds ranging from zero at the top of their trajectories to their terminal velocities, i.e. the space between the terminal velocity curve and the $v_0=0$ axis in figure 2(a,c). As can be seen in figure 2(b,d), the distributions of the droplets in $u_0$– $R$ coordinates are symmetric about the $u_0 =0$ axis in agreement with the $u_0$ p.d.f. in figure 2(f). In the $v_0>0$ regions of figure 2(a,c), the increase in the maximum values of $v_0$ with decreasing $R$ is an indication of the splash droplet generation mechanisms, though the small region of low droplet numbers for $v_0 > 2.5$ m s $^{-1}$ and $R<0.3$ mm is probably due to the very strong influence of air drag at small $R$ and high speed. Given the above-described distributions of droplets in Region I of $v_0$– $R$ space, these droplets are thought to be generated by a number of physical mechanisms including bubble collapsing and bursting (jet and film drops) and crown splashing (film drops) according to extensive laboratory and numerical studies of single drop impact on the surface of a deep-water pool, see for example Leng (Reference Leng2001), Zhang et al. (Reference Zhang, Toole, Fezzaa and Deegan2012), Deike et al. (Reference Deike, Ghabache, Liger-Belair, Das, Zaleski, Popinet and Séon2018) and Lehmann et al. (Reference Lehmann, Oehlschlägel, Häusl, Held and Gekle2021).
In an effort to gain insight into the physical mechanisms responsible for the generation of the secondary droplets in Region II, the holographic movies are carefully examined. Figure 3 presents a sequence of five images showing the pinch-off process of a jet (stalk), marked with red arrow in (a), in the rain field for  ${\rm RR} = 381$ mm h $^{-1}$ and $H_c = 4.4$ cm. The fact that this stalk appears sharp in the holographic image sequence indicates that it is in the plane of focus of the camera lens. According to the studies of single drop impact on a liquid surface, see Michon et al. (Reference Michon, Josserand and Séon2017), this stalk (a complete picture of the stalk not shown in the figure) is an energetic thick (fat) jet. As can be seen from figure 3(a), after the jet reaches a maximum height, herein approximately 3.5 cm (note that the bottom edge of the image is 3.2 cm above the water surface), a ball of water forms at its top necking down to a non-uniform filament connecting to the rest of the jet. Later, the filament stretches and eventually breaks up, resulting in several large secondary droplets, marked with blue arrows in (e). These large droplets move upwards with a vertical velocity of approximately 1.5 m s $^{-1}$, and mainly appear in Region II in figure 2. Also, since the number of the large droplets in Region II has the same order of magnitude as the number of raindrops measured from the movie and the horizontal velocities of the droplets are nearly zero, see figure 2(b), these large Region II droplets are likely due to the pinch-off of thick jets (stalks) that are produced by the impact of raindrops on the water surface. In addition, it is emphasized that these large droplets contribute significantly to the vertical profile of the liquid water content in the rain field as described in the later part of the present paper. Examples of experimental and numerical studies of single droplet impact on a quiescent water surface where stalk generation and pinch-off processes are examined include Castillo-Orozco et al. (Reference Castillo-Orozco, Davanlou, Choudhury and Kumar2015) and Michon et al. (Reference Michon, Josserand and Séon2017).
A sequence of five holographic images showing the generation of large-diameter secondary droplets (marked by the blue arrows in image (e)) near the water surface by the pinch-off (yellow arrow in (b)) of an energetic thick (fat) stalk (red arrow in (a)). Each image (5 mm wide by 16 mm high) is a portion of the full hologram and the time interval between images is 2 ms. The bottom of the images is located 3.2 cm above the mean water surface in the rain field.

As noted above, Region III consists of small droplets that are moving downward at speeds greater than their terminal velocity in still air. The explanation for this behaviour is also evident from visual examination of the high-speed holographic movies. Figure 4 shows a sequence of four images separated by 1 ms taken in the rain field at a rain rate of  ${\rm RR} = 381$ mm h $^{-1}$. Among the large secondary droplets present in the image, a neck-form collision (McTaggart-Cowan & List Reference McTaggart-Cowan and List1975), called a stretching separation collision elsewhere (Ashgriz & Poo Reference Ashgriz and Poo1990), of a raindrop (marked by the left red arrow) and a secondary droplet (marked by the right red arrow) appears at the top of the image in figure 4(a). The downward-moving raindrop collides with the secondary droplet moving from left to right at very low speed. The collision is a glancing contact, i.e. only a portion of the surface having direct contact, resulting in a region of interaction. During the collision, the secondary droplet does not appear to affect the raindrop (disregarding the illusion caused by other moving droplets in the image sequence), except in the immediate vicinity of the point of contact. As the raindrop and secondary droplet move in different directions, they remain connected to each other by a neck, yellow arrow in figure 4(b). After the separation, the raindrop becomes distorted and the neck breaks up into a chain of new small droplets with radii in the range of $R= 0.13$ to $0.25$ mm and downward vertical velocities $|v_0|$ ranging from 1.0 to 3.7 m s $^{-1}$, which is in Region III. The neck breakup and formation of droplets may be explained by the ‘end-pinching’ mechanism given by Stone & Leal (Reference Stone and Leal1989). Similar phenomenon of droplet generation during the collision of two secondary droplets is observed in the sequence of images shown in figure 5.
A binary collision of a raindrop (left red arrow) and a secondary droplet (right red arrow) produces a chain of small daughter droplets, blue arrows in (d), with downward velocity components greater than their terminal velocities in still air. The time interval between images is 1 ms and the size of each image is approximately 6 mm wide and 16 mm high. Here  ${\rm RR}=381$ mm h $^{-1}$.

A binary collision of secondary droplets (two red arrows) produces small daughter droplets, marked by three blue arrows in (d). The time interval between images is 1 ms and the size of each image is approximately 6 mm wide and 5 mm high. Here  ${\rm RR}=381$ mm h $^{-1}$.

Though binary droplet collisions have been studied extensively in a number of scenarios including spray combustion and raindrop formation (McTaggart-Cowan & List Reference McTaggart-Cowan and List1975; Orme Reference Orme1997), the present study is the first, to the authors’ knowledge, to observe collisions between raindrops and secondary droplets and between two secondary droplets in rain fields. The events shown in figures 4 and 5 are frequently observed in the video record and recorded by the data in Region III in figure 2(a,c). From the movies and the number of droplets in Region III at the two rain rates studied herein, it is suspected that the occurrence of these collisions increases dramatically with rain rate. However, the present observations cover an insufficient range of rain rate conditions to establish the parameter range over which collisions might be significant. Also, it should be mentioned that with extensive experimental investigations on binary collisions of liquid drops, Ashgriz & Poo (Reference Ashgriz and Poo1990) and Jiang, Umemura & Law (Reference Jiang, Umemura and Law1992) elucidated that the outcomes of separating collisions depend on the competition between the surface energy and drop kinetic energy in the region of interaction. The collision-breakup phenomena reported herein may be explained by this kind of energy mechanism. Unfortunately, the surface area of direct contact can not be measured with the current holographic technique so a detailed analysis of such underlying physics of individual events in the rain field is not possible.
3.3. Diameter distributions of secondary droplets and vertical profiles of liquid water content in the air above the water surface
Plots of the diameter distributions (the number of droplets per unit volume vs droplet diameter  $D$) of the secondary droplets at four heights ( $H_c = 4.0$, 8.0, 12.0 and 16.0 cm) above the water surface for ${\rm RR} =140$ mm h $^{-1}$ are given in figure 6(a). As can be seen from the plot, the diameter distribution at the lowest height ( $H_c=4$ cm, red circles) features two power-law regions; the small diameter region ( $D < 0.9$ mm) can be described by $N(D)\propto D^{-1.97}$ and the intermediate diameter region ( $0.9 < D<1.8$ mm) by $N(D)\propto D^{-5.86}$. The break in slope between the two power-law regions, $D\approx 0.9$ mm, is similar to that reported in field and laboratory experiments for sea spray (Wu et al. Reference Wu, Murray and Lai1984; Veron et al. Reference Veron, Hopkins, Harrison and Mueller2012; Erinin et al. Reference Erinin, Wang, Liu, Towle, Liu and Duncan2019). The level lines formed by the data in the range of large droplets ( $D>1.8$ mm) is a result of the very small number of droplets in this region and the logarithmic vertical axis of the plot. As the height increases, the break point in slope shifts to smaller droplet diameters, though the two slopes ( $\alpha$ and $\beta$) do not vary significantly with height. Also, secondary droplets with diameter less than approximately 0.3 mm decrease in number with increasing height more rapidly than that of larger droplets and the level region for large-diameter droplets diminishes. Qualitatively similar results are obtained when ${\rm RR}=381$ mm h $^{-1}$, as shown in figure 6(b) though a gradual reduction in the slope ( $\alpha$) of the small diameter region of the curves with increasing $H_c$ is evident.
(a,b) The diameter distributions of secondary droplets measured at various heights ( $H_c$) in the rain field for (a) ${\rm RR}=140$ mm h $^{-1}$ and (b) ${\rm RR}=381$ mm h $^{-1}$. (c,d) Heat-map scatter plots of droplet radius vs maximum height from numerical simulation for (c) ${\rm RR}=140$ mm h $^{-1}$ and (d) ${\rm RR}=381$ mm h $^{-1}$. (e) The liquid water content $\rho _{L}(h)$ varying with height. The raindrops are excluded from data in plot (e). Here, $\alpha$ and $\beta$ in (a,b) refer to the slopes of the two power-law regions.

The liquid water content at any height  $h$ above the air–water interface in the presence of secondary droplets is determined by
 \begin{equation} \rho_{L} (h) =\frac{\rho_w}{V_a}\int_0^\infty \frac{4{\rm \pi} R^3}{3}N(R, h)\,{\rm d}R, \end{equation}
where  $\rho _w$ is the water density, $V_a$ is the measurement volume containing air and droplets, $R$ is the droplet radius and $N(R, h)$ is the radius distribution of the droplets present at height $h$. The distribution $N(R, h)$ is rarely studied due to technical difficulties in both laboratory and field measurements. In the present study, measurements of $N(R, h)$ at several heights, $H_c$, are taken from figure 6(a,b).
In addition, using the measured joint distribution of radius and velocity of the droplets near the water surface,  $N_0(R, u_0, v_0)$, and the trajectories of the droplets calculated numerically, $N(R, h)$ is computed and compared with the measured values. A basic drag force model for the motion of a solid particle in still air is used to compute these droplet trajectories. The governing equations are given as follows:
 $$\begin{gather} \dot{x}(t)=u(t), \end{gather}$$
 $$\begin{gather}\dot{u}(t)={-}\frac{3C_D}{8R}\frac{\rho_a}{\rho_w}u|U|, \end{gather}$$
 $$\begin{gather}\dot{y}(t)=v(t), \end{gather}$$
 $$\begin{gather}\dot{v}(t)={-}\frac{3C_D}{8R}\frac{\rho_a}{\rho_w}v|U|-g\left(1-\frac{\rho_a}{\rho_w}\right), \end{gather}$$
where,  $|U|=\sqrt {u^2+v^2}$ is the velocity magnitude, $\rho _a$ is the density of air at standard temperature and pressure, and $C_D$ is the drag coefficient, which is a function of the Reynolds number, $Re = {2R|U|}/{\nu _a}$, where $\nu _a$ is the air kinetic viscosity. The relationship between $C_D$ and $Re$ proposed by Cheng (Reference Cheng2009) for solid spherical particles,
 \begin{equation} C_D=\frac{24}{Re}(1+0.27Re)^{0.43}+0.47[1-\exp({-}0.04Re^{0.38})], \end{equation}
is used in the calculation. It should be mentioned that when a 3-D model is used, the maximum heights for tiny droplets given in figure 6(c,d) vary only slightly due to the contribution of the velocity component in the  $z$-direction in the calculation of $|U|$. However, these small variations do not significantly affect the conclusions drawn below since the vertical motion of large droplets, which account for a major portion of the total water calculation, is dominated by the gravity.
The velocities and locations of the upward-motion droplets shown in figure 2(a,c) ( $H_c = 4.0$ and 4.4 cm, respectively) were used as the initial conditions of the simulation under the two rain conditions. The resulting heat-map scatter plots of the maximum height, $N_{mx}(R, h_{max})$ vs droplet radius at ${\rm RR} = 140$ and 381 mm h $^{-1}$ are shown in figure 6(c,d), respectively. As can be seen from figure 6(c), the maximum height that can be reached by a droplet with a radius of 0.3 mm is approximately 0.33 m at ${\rm RR}=140$ mm h $^{-1}$. This height is similar to that given by Lehmann et al. (Reference Lehmann, Oehlschlägel, Häusl, Held and Gekle2021) for the calculation of a single 3 mm diameter raindrop impacting a flat water surface. Based on the function $N(R,h)$ as computed by the droplet trajectory model with the initial conditions from the experimental measurements at the lowest height at the two rain rate conditions, $\rho _L(h)$ is computed and plotted vs $h$ in figure 6(e). The values of $\rho _L(H_c)$ calculated directly from the experimental data at each measurement height are also included in the plot. From the figure, one can see that the predicted and measured values of $\rho _L$ match well. Fitting the data to an exponential function yields
 \begin{equation} \rho_{L}(h)=A\exp{\left(-\frac{h}{B}\right)}, \end{equation}
where  $A\!=49.4$ kg m $^{-3}$, $B\!=0.0345$ m $^{-1}$ when ${\rm RR}\!=140$ mm h $^{-1}$, and $A\!= 68.24$ kg m $^{-3}$, $B=0.04$ m $^{-1}$ when ${\rm RR}=381$ mm h $^{-1}$. It is noted that incoming raindrops which add a constant value to $\rho _L(h)$ are not included in the results shown in figure 6. The computations of $\rho _L(h)$ exclude the immeasurable tiny droplets ( $R<0.05$ mm) that are trapped near the water surface due to air resistance, see figure 6(c,d).
Direct correlations between water surface features and secondary droplets in the rain field are not investigated in the present study due to a lack of surface measurements. However, the present results may still shed at least some light on the relative importance of the surface dynamics. Figure 6(c,d) shows that the maximum heights of secondary droplets at  ${\rm RR}=140$ mm h $^{-1}$ fall in the range 0 to 0.33 m and this range increases markedly from 0 to 0.45 m at ${\rm RR}=381$ mm h $^{-1}$. As depicted in § 2, at both rain rates the raindrops have the same radius, due to their generation by the same set of identical needles, while different rain rates are obtained by changing the water height in the rain generator, i.e. varying the drip rate. If the raindrops were falling on a calm water surface, according to the numerical simulations with one impacting droplet size (Lehmann et al. Reference Lehmann, Oehlschlägel, Häusl, Held and Gekle2021), the ranges of the maximum heights of secondary droplets should be the same under the two rain conditions. The difference between the two ranges mentioned above indicates that the maximum heights must be strongly influenced by the water surface shape and motion characteristics that depend on rain rate. The slope difference between the two curves of the liquid water content vs height $\rho _L(h)$ for the two rain rates in figure 6(e) also indicates the effect of these water surface characteristics.
4. Conclusions
In the present paper, secondary droplets generated by the impact of raindrops on a water surface are measured in a laboratory rain facility. Raindrops discharged at a height of 2.3 m above the pool impact the water surface at a speed of 5.6 m s $^{-1}$, which is approximately 72 % of the terminal velocity of raindrops of the same diameter under natural conditions. The radii (diameters) and velocities of secondary droplets generated by the raindrop impacts are measured at various heights with a cinematic digital in-line holographic technique that employs a coherent laser beam and a high-speed movie camera.
The experimental results show that the radius (diameter) distribution of secondary droplets generated by raindrop impacts varies dramatically with height. The range of the vertical ejection velocities for a given size of droplet decreases with increasing droplet radius and the heat-map scatter plots of radius vs vertical velocity component contain three regions with each region corresponding to a different mechanism of droplet generation or behaviour. The liquid water content due to the presence of secondary droplets near the air–water interface decreases exponentially with increasing height.
The secondary droplets generated by raindrops impacting the ocean surface transport mass, momentum and energy from the ocean back to the atmosphere. The mixing features in the atmospheric surface layer reported in the present study are important to understand the underlying physics of such transports. The joint distributions of radius and upward velocity of the secondary droplets near the water surface are useful for determining the interfacial flux of sea sprays from the ocean to the atmosphere (Lewis & Schwartz Reference Lewis and Schwartz2004). The jet breakup mechanisms play an important role in exploring interfacial production flux of sprays while the collision-breakup mechanism and the vertical profile of liquid water content are fundamental to the effective flux through a horizontal plane.
Acknowledgements
The authors thank undergraduate students D. Miller, E. G. Gancayco and G. Yu for their help with the measurements and image processing related to these experiments.
Funding
The support of the Division of Ocean Sciences of the National Science Foundation under grants OCE1829943 and OCE1925060 are gratefully acknowledged.
Declaration of interests
The authors report no conflict of interest.


 Open access