







1. Introduction
Turbulence is a highly nonlinear phenomenon, and the presence of multi-scale chaotic eddies is one of its key features. When a turbulent flow is bounded by a solid surface, i.e. a wall, it can be interpreted as a cluster of recurrent patterns called energy-containing eddies (energy-eddies) (Richardson Reference Richardson1922). These energy-eddies are the elementary structures of wall-bounded turbulence, carrying most of the energy and momentum, while the eddies generated by the energy cascade are regarded as energy-cascade eddies (Cho, Hwang & Choi Reference Cho, Hwang and Choi2018). Energy-eddies can explain the energetics of the wall turbulence, which forms the foundation for modelling and controlling industrial wall-bounded flows. Hence, comprehending the dynamics of energy-eddies, their precise origin and their interactions has attracted immense interest and posed a significant challenge for many years.
A conceptual model for wall-bounded turbulence was proposed by Townsend (Reference Townsend1976), who deduced that the size of energy-eddies, which can range from the inner viscous to the outer length scales (Marusic, Mathis & Hutchins Reference Marusic, Mathis and Hutchins2010), is proportional to the distance of their centres from the wall, and that they are structured in a hierarchical form as explained in Perry & Chong (Reference Perry and Chong1982). The isolation of these energy-eddies in numerous studies has deepened our understanding of the spatial structure of wall turbulence. For example, the current consensus on energy-eddies in the near-wall region is that they are involved in a temporal self-sustaining cycle, which describes the interaction between the streaks and vortices (Jiménez & Moin Reference Jiménez and Moin1991; Hamilton, Kim & Waleffe Reference Hamilton, Kim and Waleffe1995; Waleffe Reference Waleffe1997; Jiménez & Pinelli Reference Jiménez and Pinelli1999). The aforementioned process can be summarised as follows: when the wall-normal ejections of fluid form streaks (Landahl Reference Landahl1975) which meander, the streaks break down (Waleffe Reference Waleffe1995, Reference Waleffe1997). The disrupted streaks create perturbations in the flow, generating vortices. It is also noteworthy that the investigation of the temporal evolution of energy-eddies in the logarithmic and outer regions by Hwang & Bengana (Reference Hwang and Bengana2016) revealed that the energy-eddies in these regions undergo a self-sustaining process quite similar to that in the near-wall region. Furthermore, it is noted that the energy-eddies in the logarithmic and outer region are self-sustained without near-wall energy-eddies, even if the near-wall region is disturbed by wall roughness (Flores & Jiménez Reference Flores and Jiménez2006; Flores, Jiménez & del Alamo Reference Flores, Jiménez and del Alamo2007; Hwang & Cossu Reference Hwang and Cossu2010). Hence, there is agreement that energy-eddies at different layers of wall-bounded flows are involved in a self-sustaining cycle, independent of other scale motions. The aforementioned studies have proved that the energy-eddies are involved in a temporal self-sustaining cycle. However, the precise origin of the energy-eddies remains unknown. Furthermore, the specific issue of how the energy-eddies generate and evolve spatially appears to be an unanswered question.
The focus of the present study is to remove the energy-eddies at the inflow of a turbulent channel and identify the structures forming in the spatial evolution of energy-eddies. This study shows that the formation of near-wall streaks is the primary process in the spatial evolution of energy-eddies; in addition, the vortical motions are inactive until the streaks are re-established. This paper is organised as follows. The numerical experiments and methods are presented in § 2. The results are presented and discussed in § 3. Finally, the results are summarised in § 4.
2. Numerical experiments
The spatial evolution of energy-eddies is examined by performing direct numerical simulation (DNS) of incompressible turbulent flow in a plane channel at friction Reynolds number  $Re_\tau = {u_\tau h}/{\nu } = 550$, with streamwise and spanwise domain size equal to $L_x/h = 8{\rm \pi}$ and $L_z/h = {\rm \pi}$, respectively. Here, $u_\tau$ denotes the friction velocity, $\nu$ represents the kinematic viscosity, and $h$ is the channel half-height. Throughout the paper all quantities are non-dimensionalised by the $u_\tau$ value from the fully developed channel flow. The grid spacings in the streamwise and spanwise directions are $\delta x^+ = 6.65$ and $\delta z^+ = 3.36$, respectively. The minimum wall-normal grid spacing is located adjacent to the walls, $\delta y_{min}^+ = 0.31$, with the maximum wall-normal grid spacing located at the channel centre line, $\delta y_{max}^+ =2.87$. The ‘+’ superscript denotes wall units defined from the viscous length scale $\nu$/u $_\tau$. The details of the code and the validation are found in previous studies on turbulent channel flows (Lozano-Durán & Bae Reference Lozano-Durán and Bae2016; Bae et al. Reference Bae, Lozano-Durán, Bose and Moin2018).
In the present study two synchronised DNSs are used: one is a fully resolved streamwise periodic channel flow, which is subsequently denoted by PCH-DNS, while the other is a fully resolved channel flow DNS with inflow–outflow boundary conditions, which will be denoted by IOCH-DNS. In the IOCH-DNS the inlet boundary condition is an inflow velocity field, which is a filtered version of the inflow of the PCH-DNS, with a convective outflow boundary condition applied at the domain exit. The statistics of the IOCH-DNS are accumulated once the initial transients of the IOCH-DNS are washed out and this DNS has reached a statistically stationary state. A more detailed description of the methodology of the synchronised dual-channel code and the validation of the IOCH-DNS by comparison to the PCH-DNS is presented in Ezhilsabareesh et al. (Reference Ezhilsabareesh, Atkinson, Lozano-Duran, Schimd, Jiménez and Soria2020).
In order to examine the spatial evolution of energy-eddies in the IOCH-DNS, we take the inlet plane from the PCH-DNS and filter out the energy-eddies at every time step. Since the size of the energy-eddies in wall-bounded turbulence can be characterised by the spanwise length scale  $\lambda _z$ (Hwang Reference Hwang2015), the turbulent transport term in the turbulent kinetic energy (TKE) equation for each spanwise Fourier mode is considered to identify the boundary that distinguishes the energy-eddies from the energy-cascade eddies as described by Cho et al. (Reference Cho, Hwang and Choi2018). Their investigation of the spanwise spectra of the TKE and the turbulent transport suggested $\lambda _z = 3y$ as a reasonable boundary to separate the energy-eddies from the cascading eddies.
Figure 1 shows the pre-multiplied spanwise spectra as a function of the wall-distance of the turbulent transport ( $k_z^+$ $y^+ \hat{T}_{\textit{turb}}^+$) and TKE ( $k^+_z$ $y^+\hat {e}_{+}$) of the PCH-DNS. The TKE spectra contain most of the energy below the ridge $\lambda _z = 3y$, with the corresponding region in the turbulent transport spectra having a negative value; this is the donor region in the $k_z^+$ $y^+\hat{T}_{^\textit {turb}}^+$ spectrum. Therefore, at a given spanwise Fourier mode $\lambda _{z,0}$, the wall-normal profile with $y < \lambda _{z,0}/3$ contains the energy-eddies and the wall-normal profile with $y > \lambda _{z,0}/3$ contains the energy-cascade eddies. The velocity fluctuations are decomposed into spanwise Fourier modes; at a given Fourier mode $\lambda _{z,0}$, the fluctuations and energy in the wall-normal profile with $y <\lambda _{z,0}/3$ are removed, and only the eddies involved in the energy cascade contribute to the inflow velocity field of the IOCH-DNS at every time step. It is noted that the zeroth Fourier mode is unaltered at the inflow of the IOCH-DNS, which implies that the mean flow remains the same as for the PCH-DNS. Further, approximately 35 % of the total TKE is present at the inflow, corresponding to the TKE of the energy-cascade eddies. The spanwise Fourier transform of the velocity field at the inlet and its filtered version is expressed as
 \begin{equation}
\widehat{\widetilde{u_{i}}}(0,y,k_z) = \hat{G}(y,k_z)\, \widehat{u_{i}}(0,y,k_z) \end{equation}
\begin{equation}
\widehat{\widetilde{u_{i}}}(0,y,k_z) = \hat{G}(y,k_z)\, \widehat{u_{i}}(0,y,k_z) \end{equation}
where  $\hat {G}(y,k_z)$ is a filter function in Fourier space, given by
 \begin{equation} \hat{G}(y,k_z) = \begin{cases} 1 & \text{if}\ y > \lambda_{z,0}/3, \\ 0 & \text{otherwise}. \end{cases} \end{equation}
Pre-multiplied spanwise spectra: (a) turbulent transport ( $k_{z}^{+}y^{+}\hat {T}^{+}_{turb}$) and (b) TKE ( $k_{z}^{+}y^{+}\hat {e}$) of the PCH-DNS at $Re_\tau = 550$. Here, the dashed green line is at $\lambda _z = 3y$.

3. Results and discussion
The removal of the energy-eddies affects the skin friction ( $C_f$) and hence the corresponding friction Reynolds number $Re_{\tau }$, as shown in figure 2. Removing the energy-eddies removes the near-wall cycle at the inflow of the IOCH-DNS and therefore alters the wall shear stress distribution, resulting in an initial reduction of the downstream skin friction. However, as the flow develops downstream the skin friction starts to recover, requiring approximately $12h$ to start approaching the PCH-DNS skin friction. The skin friction coefficient of the IOCH-DNS reaches 96 % of the PCH-DNS at $x = 15h$, indicating that the filtered structures removed at the inflow to the IOCH-DNS recover as the flow develops downstream.
The ratios between the skin friction coefficient  $C_f$ and the friction Reynolds number $Re_{\tau }$ of the IOCH-DNS and those of the PCH-DNS. The solid red line gives $C_{f_{IOCH-DNS}} /C_{f_{PCH-DNS}}$, while the solid green line gives $Re_{\tau _{IOCH-DNS}} /Re_{\tau _{PCH-DNS}}$.

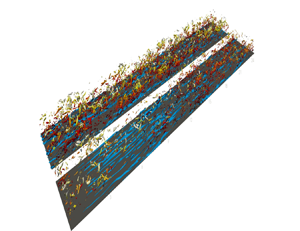
The resulting flow of the PCH-DNS and the streamwise-developing IOCH-DNS are compared to identify the structures that form during the recovery of the energy-eddies, with all data from the IOCH-DNS scaled using the friction velocity ( $u_{\tau }$) of the fully developed PCH-DNS. The focus of this study is predominantly on the spatial evolution of structures that subsequently are shown to exhibit all the structural and spectral energy characteristics of the energy-eddies, which were suppressed at the inflow of the IOCH-DNS. A comparison of the low-speed structures, i.e. the streaks, and the vortices in the two synchronised DNSs is shown in figure 3. It is evident from this visualisation that the energy-eddies, which are a combination of the streaks and streamwise vortices, are removed from the neighbourhood of the inflow of the IOCH-DNS, with the energy-cascade eddies at the inflow initially decaying in the streamwise direction. There is no evidence of the streaks or active vortical motions until $x > 3h$, where streaks start to reappear, and vortical motions only start to become active for $x > 12h$. From this qualitative observation, we hypothesise that the formation of the streaks is the primary process in the recovery of energy-eddies. This will be exemplified in the subsequent sections.
Vortices and low-speed structures shown by the iso-surfaces of the second invariant of the velocity gradient tensor,  $Q_A/\langle Q_W \rangle = 3$, with the colour representing the distance from the wall, and the streamwise fluctuating velocity, $u^+ = -0.5$, in blue, respectively. The invariant $Q_A$ is normalised in terms of $\langle Q_W \rangle$, representing the mean value of the second invariant of the rate-of-rotation tensor $Q_W$. The flow is from left to right. See also the supplementary movie 1, available at https://doi.org/10.1017/jfm.2022.1081.

3.1. Mean velocity profile and turbulence intensities
Figure 4 shows the mean velocity and the statistics of the fluctuating velocity profiles. The mean velocity profile of the IOCH-DNS at  $x = 0h$ is analogous to that of the PCH-DNS, since the zeroth Fourier mode is unaltered at the inflow, as shown in figure 4(a). However, the mean velocity profile experiences a non-trivial change in the buffer region and becomes distorted as the flow evolves, whereas the mean velocity profile in the outer region remains unaltered, as shown in figure 4(a). The results in figure 4( f) show that the mean velocity profile starts to recover at $x = 12h$ to that of the PCH-DNS case. The change in the mean velocity profile shows the important contribution of the energy-eddies to the structure of the mean velocity profile.
The statistical velocity profiles of the IOCH-DNS: (a, f) mean velocity profiles; (b,g) streamwise fluctuating velocity profiles; (c,h) wall-normal fluctuating velocity profiles; (d,i) spanwise fluctuating velocity profiles; (e,j) Reynolds shear stress. Panels (a–e) show from  $x = 0h$ to $x = 3h$, and panels ( f–j) show from $x = 6h$ to $x = 24h$. The dashed black line represents the PCH-DNS. The coloured lines represent various streamwise locations in the IOCH-DNS: the solid blue line is $x = 0h$, the solid magenta line is $x = 1.5h$, the solid green line is $x = 3h$, the solid orange line is $x = 6h$, the solid violet line is $x = 12h$ and the solid red line is $x = 24h$.

From figure 4(b), it can be seen that the streamwise velocity fluctuations are damped at the inflow, i.e.  $x = 0h$, because of the filtered energy-eddies. In figure 4(b), at $x = 1.5h$ and $x = 3h$, as the flow evolves downstream the streamwise velocity fluctuations are amplified in the buffer region. At the same time, no significant changes are observed for $y^+ > 100$. In contrast to the streamwise velocity fluctuations, the wall-normal velocity fluctuations shown in figure 4(c) decrease, while the streamwise velocity fluctuations intensify. The spanwise velocity fluctuations are found to remain unaltered for $x \leq 3h$, as shown in figure 4(d). The streamwise velocity fluctuations of the IOCH-DNS at $x = 12h$ are equivalent to those of the PCH-DNS in the buffer layer, as shown in figure 4(g), whereas the wall-normal and spanwise velocity fluctuations only begin to develop from $x > 6h$, as shown in figure 4(h,i). Figure 4(g,h,i) also shows that the turbulent fluctuations of the three velocity components in the outer region for $y^+ > 100$ have not completely recovered at $x = 24h$ – clearly indicating that large-scale energy-eddies require a longer domain to develop and recover to the fully developed channel flow structure provided by the PCH-DNS. Figure 4(e) shows that the Reynolds shear stress follows a trend similar to that of the wall-normal fluctuations, since the Reynolds shear stress gradually decays in the early stage of evolution for $x \leq 3h$ in the logarithmic region. Since the Reynolds shear stress is the correlation of streamwise velocity fluctuations and wall-normal velocity fluctuations, this indicates that the wall-normal velocity fluctuations have more influence on the streamwise development of the Reynolds shear stress. In summary, it is evident from the observations that the inter-component energy redistribution is insignificant until the streamwise velocity fluctuations in the buffer layer have recovered.
3.2. One-dimensional velocity and vorticity spectra
Figure 5 compares the pre-multiplied spanwise energy spectra of the streamwise velocity (k  $_z$
$_z$ $\phi$ $_{uu}$) of the PCH-DNS and IOCH-DNS. In the PCH-DNS, the peak of the spectra falls on the ridge $\lambda _z = 10y$ at $\lambda _z^+ \simeq 100$ and $y^+ \simeq 15$, a length scale which is approximately equal to the spanwise spacing of the near-wall streaks, where the streaks oscillate and break up (Kline et al. Reference Kline, Reynolds, Schraub and Runstadler1967). The $k_z\phi _{uu}$ spectrum of the PCH-DNS is aligned along the ridge $\lambda _z = 10y$ throughout the logarithmic region, indicating the linear growth of the spanwise length scale with the distance from the wall, which is consistent with the attached eddy hypothesis (Townsend Reference Townsend1976).
The pre-multiplied spanwise spectra of the streamwise velocity,  $k_z$
$k_z$ $\phi$ $_{uu}$, as a function of $y$ at various streamwise locations: (a) $x = 0h$, (b) $x = 1.5h$, (c) $x = 3h$, (d) $x = 6h$, (e) $x = 8h$, ( f) $x = 10h$, (g) $x = 12h$, and (h) $x = 24h$. The contours are 0.1 to 1.0 of the maximum value of k $_z$
$_z$ $\phi$ $_{uu}$ of the PCH-DNS, with the PCH-DNS indicated by the dashed black line and the IOCH-DNS by the contour enclosed in the solid grey line. Here, the dashed grey line is at $\lambda _z = 3y$ to indicate the cutoff spanwise wavelength, and the dashed green line is at $\lambda _z = 10y$.

The spectra of the IOCH-DNS in figure 5(a) show that the near-wall mechanism has been removed at the inflow since the energy-eddies have been filtered out, and the energy present at the inflow represents only the energy-cascade eddies. As the flow develops downstream from the inflow, the energy above the ridge  $\lambda _z=3y$ decays, as shown in figure 5(b,c) at the streamwise locations $x = 1.5h$ and $x = 3h$, indicating that without the presence of the energy-eddies, the energy-cascade eddies present at the inflow decay.
Figure 5(b,c) shows that the spectral peak starts to develop in the buffer layer at a spanwise wavelength of  $\lambda _z^+ \simeq 100$, which represents the spacing of the near-wall streaks. At streamwise positions $x = 8h$ and $x = 10h$ of the IOCH-DNS, the $k_z\phi _{uu}$ spectrum of the energy-eddies of spanwise wavelength $\lambda _z^+ > 300$ recovers earlier in the near-wall region for $y^+ < 20$ than in the outer region, as shown in figure 5(e, f). The spectrum of the IOCH-DNS at $x=12h$, shown in figure 5(g), is aligned along the ridge $\lambda _z = 10y$, which implies that the spanwise length scale is proportional to the distance from the wall (Hwang Reference Hwang2015; Hwang & Bengana Reference Hwang and Bengana2016). Furthermore, this implies that the eddies that develop in the streamwise direction have a Townsend attached eddy characteristic. At the downstream location of $x=24h$, shown in figure 5(h), the spectrum is very closely aligned to that of the fully developed PCH-DNS. However, the large scales with spanwise wavelength of $\lambda _z^+ > 800$ are still not completely recovered, because of the limited spatial extent of the IOCH-DNS in the streamwise direction.
The streamwise development of the pre-multiplied spanwise energy spectra of the wall-normal velocity fluctuations  $k_z\phi _{vv}$ of the IOCH-DNS is shown and compared to the fully developed spectrum of the PCH-DNS in figure 6. In the fully developed PCH-DNS, unlike the streamwise velocity spectra, where the near-wall peak is close to the wall at $y^+ \simeq 15$, the peak in the wall-normal velocity spectrum is away from the wall at $y^+ \simeq 50 \sim 60$ and $\lambda _z^+ \simeq 150$. In the IOCH-DNS, the region above the linear ridge $\lambda _z = 3y$ contains most of the wall-normal energy at the inflow, as shown in figure 6(a). As the IOCH-DNS spectra of $k_z\phi _{uu}$ develop in the streamwise direction, the wall-normal energy present at the inflow above the ridge $\lambda _z = 3y$ decays for $x \leq 6h$, as shown in figure 6(b–d), but starts to recover for $x > 6h$, as shown in figure 6(e–h).
The pre-multiplied spanwise spectra of the wall-normal velocity, k  $_z$
$_z$ $\phi$ $_vv$, as a function of $y$ at various streamwise locations: (a) $x = 0h$, (b) $x = 1.5h$, (c) $x = 3h$, (d) $x = 6h$, (e) $x = 8h$, ( f) $x = 10h$, (g) $x = 12h$, and (h) $x = 24h$. The contours are 0.1 to 1.0 of the maximum value of k $_z$
$_z$ $\phi$ $_vv$ of the PCH-DNS, with the PCH-DNS indicated by the dashed black line and the IOCH-DNS by the contour enclosed in the solid grey line. Here, the dashed grey line is at $\lambda _z = 3y$ to indicate the cutoff spanwise wavelength.

Figure 7 shows the streamwise development of the pre-multiplied spanwise energy spectra of the spanwise velocity fluctuations  $k_z\phi _{ww}$ of the IOCH-DNS compared to the fully developed spectrum of the PCH-DNS. The development of the IOCH-DNS spanwise velocity spectra follows a similar trend to that of the wall-normal velocity spectra. Both the wall-normal and spanwise velocity spectra decay in the streamwise direction for $x \leq 6h$ and start to recover for $x > 6h$, as shown in figure 7(b–h). The decay of the wall-normal and spanwise velocity fluctuation energy spectra above the ridge $\lambda _z = 3y$ along the streamwise direction indicates that the energy-cascade eddies decay without the presence of the energy-eddies. The $k_z\phi _{vv}$ and $k_z\phi _{ww}$ spectra start to recover for $x > 6h$ through the redistribution of the streamwise turbulent energy once the near-wall peak of the $k_z\phi _{uu}$ spectrum is recovered and re-established. The decay of the wall-normal and spanwise velocity components is quite common in the transition to turbulence, where the streaks are generated by extracting energy from the mean flow, and the wall-normal and spanwise velocity components decay while activating the long streaks in the flow (Landahl Reference Landahl1975; Butler & Farrell Reference Butler and Farrell1993). Thus, the decay of the wall-normal and spanwise velocity components in the IOCH-DNS may activate the lift-up process of the streaks, making them appear in the earliest stage of the streamwise evolution of the energy-eddies. Notably, the near-wall streak amplitude in the $k_z\phi _{uu}$ spectrum at $\lambda _z^+ \simeq 100$ for $x \leq 6h$ is higher than in the PCH-DNS. This implies that the streaks subsequently experience breakdown for $x > 6h$ to start the self-sustaining process. Eventually, this leads to the recovery of the wall-normal and spanwise velocity statistics for $x > 6h$ in the streamwise evolution of the flow field, which appears quite similar to the bypass transition process in turbulent boundary layers (Zaki & Durbin Reference Zaki and Durbin2005; Schlatter et al. Reference Schlatter, Brandt, de Lange and Henningson2008), although the mean velocity base flow is turbulent.
The pre-multiplied spanwise spectra of the spanwise velocity, k  $_z$
$_z$ $\phi$ $_ww$, as a function of $y$ at various streamwise locations: (a) $x = 0h$, (b) $x = 1.5h$, (c) $x = 3h$, (d) $x = 6h$, (e) $x = 8h$, ( f) $x = 10h$, (g) $x = 12h$, and (h) $x = 24h$. The contours are 0.1 to 1.0 of the maximum value of k $_z$
$_z$ $\phi$ $_ww$ of the PCH-DNS, with the PCH-DNS indicated by the dashed black line and the IOCH-DNS by the contour enclosed in the solid grey line. Here, the dashed grey line is at $\lambda _z = 3y$ to indicate the cutoff spanwise wavelength.

The streamwise development of the streamwise vorticity spectra of the IOCH-DNS is shown in figure 8, which demonstrates that the formation of the near-wall streaks is the primary process in the recovery of the energy-eddies. The streamwise vorticity spectrum of the fully developed PCH-DNS, which is also included in figure 8, has two peaks, one near the wall at  $y^+ \simeq 1\sim 5$ and the other in the buffer layer at $y^+ \simeq 20$. In the IOCH-DNS, the near-wall peak is quenched at the inflow, as presented in figure 8(a). As the flow develops in the streamwise direction, there is no evidence of active vortical motions for $x \leq 6h$, as shown in figure 8(b–d), where the $k_z\phi _{uu}$ spectrum has not yet fully recovered its energy at the spanwise wavelength equivalent to the spacing of the near-wall streaks. The vortical motions become reactivated for $x > 6h$, as shown in figure 8(e, f), where the near-wall peak of $k_z\phi _{uu}$ spectrum is nearing recovery and is subsequently re-established. This clearly indicates that the streamwise vortical motions become active only once the near-wall streaks are re-established.
The pre-multiplied spanwise spectra of the streamwise vorticity,  $k_z$
$k_z$ $\phi_{\omega_{x}\omega_{x}}$, as a function of $y$ at various streamwise locations: (a) $x = 0h$, (b) $x = 1.5h$, (c) $x = 3h$, (d) $x = 6h$, (e) $x = 8h$, ( f) $x = 10h$, (g) $x = 12h$, and (h) $x = 24h$. The contours are 0.1 to 1.0 of the maximum value of $k_z$
$k_z$ $\phi_{\omega _{x}\omega _{x}}$ of the PCH-DNS, with the PCH-DNS indicated by the dashed black line and the IOCH-DNS by the contour enclosed in the solid grey line. Here, the dashed grey line is at $\lambda _z = 3y$ to indicate the cutoff spanwise wavelength.

In brief, the streamwise velocity spectra start to recover in the buffer layer at a spanwise wavelength of  $\lambda _z^+ = 100$, equivalent to the spacing of the near-wall streaks. Moreover, it is apparent from the streamwise vorticity spectra that the vortical motions are inactive until the near-wall streaks are re-established. The formation of the near-wall streaks in the early stage of the streamwise evolution of the energy-eddies contrasts with the linear stability analysis of del Alamo & Jiménez (Reference del Alamo and Jiménez2006) and Pujals et al. (Reference Pujals, García-Villalba, Cossu and Depardon2009), where the higher amplification of large-scale streaks has been reported. It is worth noting that the linear stability analysis used in these studies assumed a mean flow and eddy viscosity consistent with those of the fully developed channel flow. In contrast, our results include changes in both the mean velocity base flow and the background turbulence for $x < 6h$, owing to the streamwise evolution of the flow.
4. Conclusions
In the present framework, the energy-eddies at the inflow of a turbulent channel flow DNS, referred to as IOCH-DNS, are purposely quenched to enable their spatial development to be studied. The primary interest has been to identify the structures that form during the recovery of energy-eddies based on statistical and spectral evidence. The results show that the removal of energy-eddies at the inflow directly affects the skin friction, with the channel flow requiring of the order of at least 12 channel heights to approach the baseline statistical state. It is observed that as the IOCH-DNS flow develops downstream, the mean velocity profile changes in the buffer region and becomes distorted. The streamwise velocity fluctuations develop towards their fully developed turbulent channel flow state before the wall-normal and spanwise velocity fluctuations. In fact, the wall-normal and spanwise velocity fluctuations only start developing towards their fully developed turbulent channel flow state once the streamwise velocity fluctuations have recovered in the buffer layer.
The statistical evidence shows that the energy-cascade eddies at the inflow decay in the streamwise direction and cannot be sustain without the energy-eddies. It is also observed that the streamwise velocity spectra start to recover at a spanwise wavelength of  $\lambda _z^+ \simeq 100$, equivalent to the spacing of the near-wall streaks in the buffer layer at $y^+ \simeq 15$. Although the wall-normal and spanwise velocity spectra start by decaying from the inflow in the streamwise direction, they begin to recover to their respective fully developed turbulent channel flow states when the streamwise energy is re-established at the near-wall streak location.
Furthermore, the streamwise vorticity spectra of the IOCH-DNS show that the vortical motions are inactive for  $x \leq 6h$, with the vortical motions becoming active only once the near-wall streaks are re-established, which is consistent with the qualitative observation from the iso-surface of an instantaneous field shown in figure 3. Thus, the results of the present study lead to the fundamental finding that in the spatial streamwise development of the energy-eddies in a turbulent channel flow, the energy-cascade eddies cannot sustain themselves without the energy-eddies, and the evidence supports the hypothesis that the near-wall sustaining mechanism is re-established by the formation of near-wall streaks as the primary process in the recovery of the energy-eddies. This latter hypothesis is currently the subject of a study comparing the energy production at the energy-eddies to energy transport from near-wall streaks, whose results will be reported in a future publication.
Supplementary movie
Supplementary movie is available at https://doi.org/10.1017/jfm.2022.1081.
Funding
The authors would like to acknowledge the funding of this research by the Australian Research Council through a Discovery Grant. The authors also acknowledge the computational resources provided by the Pawsey Supercomputing Centre and the National Computational Infrastructure (NCI), through computational grants awarded by the National Computational Merit Allocation Scheme (NCMAS), funded by the Australian Government. E. K. gratefully acknowledges the support provided by a Monash Graduate Scholarship (MGS) and a Monash International Tuition Scholarship (MITS).
Declaration of interests
The authors report no conflict of interest.


 Open access

