


Introduction
How can remote sensing, Geographic Information Systems (GIS) and statistical tools be used to assess and promote African knowledge systems and the continent's heritage? In what ways can such tools advance our understanding of processes such as the emergence of urbanism, and the ensuing increase in inequality and insecurity, from a local perspective? And how can this be applied in ways that avoid appropriating Indigenous spaces by translating them into universalist terms? In this article, we aim to anchor these questions in a structured analysis of three urban settlements in southern Africa, which were inhabited during the eighteenth and nineteenth centuries AD, using an adaption of the Gini coefficient (a statistical measure of inequality) that is sensitive to African-knowledge systems. Our approach necessitates a critical revision of certain common terms used in archaeological analysis and highlights how GIS and statistical tools should be situated within wider research fields. We explore a new way of using GIS to identify social inequality and insecurity and to embed the resulting data into a critical analysis that employs African-centred understanding of key notions such as inequality and urban life.
Inequality is expressed in sociopolitically contingent ways. Despite the continual development of sophisticated analytical toolsets, social asymmetry in past societies is hard to capture through standard desktop geospatial models and methods: ground-truthing and contextualisation are therefore required. This is certainly the case for archaeology in Africa. Here, the discipline risks being framed as a past-focused science that is detached from locally grounded experience and with limited or no bearing on the present or the future (Pikirayi Reference Pikirayi, Schmidt and Pikirayi2016). A key need is therefore to relate more directly to stakeholders’ notions of the past, heritage and custodianship (Lane Reference Lane2011; Jopela & Fredriksen Reference Jopela and Fredriksen2015) and to anchor archaeological understanding in local people's own terms, by challenging preconceived universalist notions about urban life mobility and migration (e.g. Ashley et al. Reference Ashley, Antonites and Fredriksen2016; Chirikure Reference Chirikure2020). Hence, we should seek to base analyses in culturally specific experiences, knowledge and skills (Mavhunga Reference Mavhunga and Mavhunga2017; Fredriksen Reference Fredriksen, Wingfield, Giblin and King2020), in particular concerning the spatial organisation of homesteads and households (Sadr Reference Sadr2016a & Reference Sadrb; King Reference King2018; Klehm et al. Reference Klehm, Barnes, Follett, Simon, Kiahtipes and Mothulatshipi2019). Innocent Pikirayi (Reference Pikirayi2015: 531–3) also calls for scholars working in Africa to develop their own theories and for a continent-wide approach in order to remove existing barriers and shape an archaeology relevant to Africa. While the epistemic critique of scientific methods as spatial appropriation has been voiced since the 1990s at least (Smith Reference Smith1999; Biernacki & Jordan Reference Biernarcki, Jordan and Joyce2002), such critique has yet to have an impact on archaeological research in southern Africa. Key issues include mobility and emerging urban life, although these were central conditions for Later Farming Communities (LFC) in the region (Fredriksen & Chirikure Reference Fredriksen and Chirikure2015; Ashley et al. Reference Ashley, Antonites and Fredriksen2016; Chirikure Reference Chirikure2020). Perhaps the main reason for the lack of engagement is that it would entail integrating African-knowledge systems into approaches that use remote sensing, GIS and statistics. This requires the meeting between quantitative research methods and grounded qualitative knowledges that resist using a universalist approach.
Scope and approach
In southern Africa, the LFC's (AD 1300–1840) unique and varied stone-walled architecture that appeared in its terminal phase after AD 1700 has attracted considerable research interest (e.g. Maggs Reference Maggs1976; Mason Reference Mason1986; Denbow Reference Denbow1979; Sadr & Rodier Reference Sadr and Rodier2012; Hunt & Sadr Reference Hunt and Sadr2014; Sadr Reference Sadr2016a & Reference Sadrb, Reference Sadr2019; Siteleki Reference Siteleki2016, Reference Siteleki2021; Mshungwana Reference Mshungwana2018). The subtle inter- and intra-site differences in architecture can be explored as expressions of social inequality (Chase Reference Chase2017) and differential access to resources, but also as reflecting a means to establish control in contexts with high levels of conflict, unrest and insecurity. Here, ‘insecurity’ refers to linkages between political instability or outright warfare and to changes in the location and/or internal organisation of settlements to safeguard food production and limit access and visibility to outside agents (Wilson & VanDerwarker Reference Wilson, VanDerwarker, VanDerwarker and Wilson2016: 2–8). A common assumption is that LFC agropastoralists resolved issues of rank and leadership with reference to a shared concept of hierarchy, and that the hierarchy was made visible and tangible in the organisation of settlements. According to the dominant settlement model, which is informed by colonial ethnohistorical accounts, the general rule was that the senior leader, as the wealthiest man, had the largest homestead (Huffman Reference Huffman1982, Reference Huffman2001, Reference Huffman2007: 20). Recent critiques have, however, shown that there is significant inter- and intra-site variation, and that such generalisations should be treated with caution (see Lane Reference Lane and Stahl2005; Fredriksen & Chirikure Reference Fredriksen and Chirikure2015). Furthermore, as pointed out by social anthropologists (Kopytoff Reference Kopytoff and Kopytoff1987; Gulbrandsen Reference Gulbrandsen2007), wealth was not simply or solely measured according to access to resources (e.g. the number of cattle), but also by the ability of a given community to attract new members.
In this article, we focus on three roughly contemporaneous large, agglomerated farming settlements in the Magaliesberg Mountain region in the north-western interior of South Africa: Marothodi (AD 1815–1823), Molokwane (AD 1790–1823) and Kaditshwene (AD 1650–1828; Figure 1a). The precise dating of the sites is a result of correlations of ethnohistorical accounts with archaeological research (see Hall Reference Hall, Hamilton, Nasson and Mbenga2010: 148–54 for an overview). The population of Kaditshwene is estimated at 15 000 inhabitants (Boeyens Reference Boeyens2003), while estimates for Molokwane and Marothodi are 12 000 and 7000, respectively (Hall Reference Hall, Hamilton, Nasson and Mbenga2010: 152). Significantly, while Marothodi was very short-lived, and Molokwane was occupied for just over three decades, Kaditshwene persisted for some 130 years (Boeyens Reference Boeyens2003, Reference Boeyens2016). All three settlements were organised so that cattle enclosures were located in the centre of each homestead (Figures 1b & 2) and dwellings were arranged around them in a circular or semi-circular fashion (Pistorius Reference Pistorius1996; Boeyens Reference Boeyens2003; Boeyens & Plug Reference Boeyens and Plug2011). Following the convention for such sites in southern Africa, the homestead concept refers to both a physical and a sociopolitical unit: the physical stone-wall arrangements centred around a cattle enclosure within the wider settlement and the family units inhabiting these spaces, comprising varying numbers of individual households (Anderson Reference Anderson2009: 64, 94).
a) Location map of the settlements included in the analysis (squares) and the nearest modern towns (circles); b) the settlement and homestead of Marothodi (figure by authors).

LiDAR images of the main centres of Marothodi (a) and Kaditshwene (b). For Marothodi, the two marked squares indicate the two largest homesteads at the centre of the settlement, associated with leaders (after Anderson Reference Anderson2009: 67–122). The largest inner circles are cattle enclosures, and adjacent to these are courtyards. These inner enclosures are surrounded by smaller homestead units, arranged in a scalloped shape. High elevation terrain in orange, turning to green as elevation decreases (figure by authors).

Detailed archaeological studies have revealed evidence of surplus iron and copper production at Marothodi (Figure 3), which is not the case for the other two settlements (Hall et al. Reference Hall, Miller, Anderson and Boeyens2006). Reflecting on the diversity of specialisation in an increasingly dense political landscape, Boeyens (Reference Boeyens2003) has convincingly argued that the emergence of large farming communities in southern Africa was the result of several factors, including population growth and conflict between chiefdoms (see also Mason Reference Mason1986), drought (see also Huffman Reference Huffman1996), the accumulation of cattle and the centralisation of political power. As pointed out by Klehm (Reference Klehm2017: 604), increasing social stratification within the LFC in southern Africa is seen to signal a rise in production, surplus, labour specialisation, control of political economy, extension of territorial hegemony, sedentism, urbanism and globalisation.
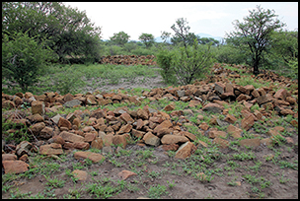
Remains of drystone walling at Marothodi: a) Collapsed walls surrounding a central cattle enclosure; and b) detail showing the construction of drystone walling (photographs by P.D. Fredriksen).

The dwellings or living spaces inside the homesteads, made from dagga (a mixture of clay and dung), have eroded over time. This makes it impossible to estimate the Gini coefficient of archaeological homesteads based only on the extant individual dwellings or living spaces. Instead, the layout of the perimeter wall, as the structure that survives within the landscape, is therefore used as the key defining feature of homesteads (Sadr Reference Sadr2020). Population estimates of the individual homesteads, and the overall settlements, have been compiled from ethnographical sources and earlier archaeological studies (Pistorius Reference Pistorius1996; Hall et al. Reference Hall, Miller, Anderson and Boeyens2006; Hall Reference Hall, Hamilton, Nasson and Mbenga2010; Boeyens Reference Boeyens2003, Reference Boeyens2016).
The Gini coefficient can be estimated at a spatially distinct settlement scale (e.g. at Marothodi) and the data then aggregated from various settlements to characterise an entire region (e.g. the Magaliesberg). In studying inequality, it is expected that complexity will grow with settlement size and that settlements with more homesteads are most likely to be defined by greater heterogeneity of their demographic, geographical, cultural and institutional structures (Kohler & Smith Reference Kohler and Smith2018). Inequality, as defined by McGuire (Reference McGuire1983: 93), refers to the differential access of individuals or groups to material and social resources within a society. More recently, Holton (Reference Holton, Turner and Holton2015: 61) defines inequality as the “differences that create and reproduce systematic asymmetries in a population's life chances over time”. Comparative archaeological studies that assess inequality across different cultures, technologies, political systems and time spans are particularly useful when offering interpretative frameworks that account for different scalar levels (Fochesato et al. Reference Fochesato, Bogaard and Bowles2019), ranging from supra-regional macroscale to the microscale of households. But the resolution of the available data continues to be a challenge for archaeological studies of inequality, owing to the frequent lack of relevant spatial and/or quantitative data in many parts of the world, including southern Africa.
The Gini coefficient is a quantitative method originally developed by economists, which has been effectively employed in archaeological analysis (Windler et al. Reference Windler, Thiele and Muller2013). Together with the Lorenz curve (a graphical illustration of the distribution of income or wealth), the Gini coefficient is a statistical index of distribution that measures the concentration of a variable. The coefficient has been reliably used to make inferences about social inequality (Smith et al. Reference Smith, Dennehy, Kamp-Whittaker, Colo and Harkness2014) and can be applied to data from archaeological contexts, such as graves and houses (Fochesato et al. Reference Fochesato, Bogaard and Bowles2019: 861). Its values range from 0, representing perfect equality (i.e. no one household/unit of analysis possesses more wealth than any other), to 1 or perfect inequality (i.e. one household/unit of analysis possesses all of the wealth). The Gini coefficient compares the Lorenz curve (see Figure 4), with a theoretical line representing complete equality expressed as A/(A + B), where A and B represent proportional areas of the graph below the line of perfect equality (Windler et al. Reference Windler, Thiele and Muller2013; Smith et al. Reference Smith, Dennehy, Kamp-Whittaker, Colo and Harkness2014). If A = 0, then the Gini coefficient will also be 0, as the Lorenz curve will match the line of perfect equality, signifying perfect equality in the community in question. Conversely, if B = 0, the Gini coefficient is 1, thereby describing perfect inequality.
The Lorenz curve (figure by authors adapted from Windler et al. 2013: 206).

As it provides only a numerical representation of wealth, the Gini coefficient on its own does not account for the social processes that lead to any particular distribution in a given society. Therefore, to reach a contextualised understanding of inequality, the coefficient must be interpreted in light of the respective communities, taking into account factors influencing wealth such as livelihood (e.g. farming and specialised craftwork), household size and trade. One of the benefits of using and discussing the Gini coefficient in this manner is that the results can help answer questions about power dynamics and social diversity in the past, at the same time allowing for comparison with more recent and contemporary societies (Chase Reference Chase2017: 31).
While studies exist for North America (Kohler & Ellyson Reference Kohler and Smith2018; Prentiss et al. Reference Prentiss, Foor, Murphy, Kohler and Smith2018), Asia (Fochesato et al. Reference Fochesato, Higham, Bogaard and Castillo2021) and western Europe (Bogaard et al. Reference Bogaard, Styring, Whitlam, Fochesato, Bowles, Kohler and Smith2018; generally, Kohler & Smith Reference Kohler and Smith2018: 28), the current article is the first to apply the Gini coefficient to an archaeological dataset from southern Africa. Importantly, the resulting Gini coefficients serve primarily as a departure point from which to engage with African-centred knowledge. From this, new questions emerge: are we dealing with inequality from a modernist perspective? Or might the results indicate something else?
Methods and materials
Our approach to consolidating different (archaeological and ethnographical) data, allowing for comparison across various settlements in different chronological phases, is adapted from Fochesato et al. (Reference Fochesato, Bogaard and Bowles2019) and customised for application in our particular context in southern Africa. While Fochesato and colleagues differentiate between living and livestock spaces and consider archaeological materials such as grave goods, here, we do not. Instead, our technique calculates the area and volume of homesteads based on the creation of Triangulated Irregular Networks (TINs) generated from LiDAR data, using RStudio software (version 4.0.2; RStudio Team 2020). We anchor our interpretations in the rich archaeological, ethnohistorical and ethnographical literature on each of the settlements: Kaditshwene (Boeyens Reference Boeyens2003, Reference Boeyens2016), Marothodi (Anderson Reference Anderson2009; Hall Reference Hall2012) and Molokwane (Pistorius Reference Pistorius1996).
Our primary analytical unit is the homestead made of drystone walling (see Figures 2 & 3). We hypothesise that the size of the homestead is a measure of household wealth, given the common assumption that the houses of the elites in hierarchical communities are typically larger and more elaborate than those occupied by people of lower status. According to Smith et al. (Reference Smith, Dennehy, Kamp-Whittaker, Colo and Harkness2014), the relationship between wealth (an indirect indicator of social inequality) and homestead size is based on two premises: that larger homesteads require more time, materials and labour to construct and are thus more costly, and that the construction of larger and more elaborate homesteads expresses wealth and their inhabitants’ relatively high social position. Homestead size is thus considered a reliable proxy for household wealth when it is archaeologically visible and usually incorporates “embodied, relational and material aspects of wealth” (Kohler et al. Reference Kohler2017: 619). But we should also consider what constitutes ‘wealth’ in each case. Fochesato et al. (Reference Fochesato, Bogaard and Bowles2019) note that spaces for living and storage, for example, are not differentiated in most archaeological studies, although storage spaces are frequently assumed to be a reliable indicator of land inequality. For the current study, LFC homesteads are defined as comprising both living space and livestock enclosures (for discussion of the practical use and sociopolitical meaning of LFC livestock enclosures, see Badenhorst Reference Badenhorst2009; Huffman Reference Huffman2010; Russell Reference Russell2022).
Area and volume
Household size serves as a convenient metric, largely due to its frequent use in anthropological research (Smith et al. Reference Smith, Dennehy, Kamp-Whittaker, Colo and Harkness2014: 312). When discussing archaeological indicators of inequality, area and volume are used as proxies for construction effort and complex architectural energetics (Chase & Chase Reference Chase and Chase2014; Smith et al. Reference Smith, Dennehy, Kamp-Whittaker, Colo and Harkness2014; Chase Reference Chase2017). Area refers to the floor space that a building occupies, and volume to the total mass of construction materials (i.e. walls, floors and basal platforms). Although area is the simplest of the two measures to estimate, volume is deemed more accurate because it is a more direct measure of the effort involved in constructing a homestead, and because elevations for visual effect, such as platforms, will be reflected in volume but not in area. Our study thus differs from other assessments of inequality that have considered the remains from dwellings, ritual offerings and burials to discuss relative wealth at different scales, including the household (Smith Reference Smith1987: 301–2; Smith et al. Reference Smith, Dennehy, Kamp-Whittaker, Colo and Harkness2014: 313). Using these and other material variables has proven difficult but not impossible (Chase Reference Chase2017; Kohler et al. Reference Kohler2017), as demonstrated by a case study evaluating exotic prestige goods theory in Iron Age southern Africa using evidence from historical and archaeological records (Moffett & Chirikure Reference Moffett and Chirikure2016).
Data preparation
Homesteads were digitised from hillshaded LiDAR images, which provided clear views of Marothodi, Molokwane and Kaditshwene. A polygon shapefile was then created within a geodatabase in ArcMap software (version 10.7) for all the homesteads in order to compute measurements of area (in m2) and volume (in m3, using elevation data) from the attribute table of the shapefile. A TIN was created as it allows for high-precision modelling of small areas and provides an optimal platform for computing surface area and volume data (Esri Dictionary; https://support.esri.com/en-us/gis-dictionary/tin). A TIN represents a topographic surface (in this case, the LiDAR elevation data) using a series of tessellated triangles; this models both individual homesteads and settlements and the wider landscape. Using the TIN, the volume between a polygon for each homestead and the landscape surface was computed to capture measurements above and below the reference plane. Since the homesteads are sited on varied topography and landscape, the height for each was estimated from the TIN and used as a reference plane. The volumes above and below the reference plane were combined to obtain the total volume of each homestead, which was used to calculate the Gini coefficient and the Lorenz curve in RStudio. Simply put, homestead volume was reconstructed by subtracting the varied topography on which the settlements are located, to leave just the volume of the homesteads.
Limitations
Since the Gini coefficient was originally designed for research in economics, two key limitations must be taken into consideration (Fochesato et al. Reference Fochesato, Bogaard and Bowles2019). First, studies in economics typically base their results on ‘complete enumeration’, for example, in the form of census or tax data, while archaeological studies typically depend on relatively small datasets with unknown statistical properties. Second, societies studied by economists differ in the degree of homogeneity in their cultural, social and technological components from societies studied by archaeologists. In addition, a major challenge for comparative studies is that the data are collected using different methods and sampling strategies. Given these issues, the data for Marothodi, Molokwane and Kaditshwene might potentially relate to other distinct wealth indicators (grave goods, dwelling or house size, size of storage areas, etc.) or to populations of different sizes—variables that we are unable to take into account. To compensate for this, we draw on the approach by Fochesato et al. (Reference Fochesato, Bogaard and Bowles2019), which demonstrates how to consolidate different data (i.e. spatial data in the form of house size complemented by ethnography and site chronologies established by archaeological research) to allow for comparison across various settlements in different phases.
Results
Table 1 shows the Gini coefficient scores based on the area and on volume of each homestead. A settlement where all the homesteads are of the same size would have a Gini coefficient of 0, while a settlement where a single homestead takes up all the space from other homesteads would result in a Gini coefficient of 1. When measuring inequality in this manner, the higher the value of an index/coefficient, the more spread the data are.
Gini coefficients

Digitised perimeter walling diagrams were created for each settlement (Figures 5a–7a) and Lorenz curves were calculated based on estimates of area (red) and volume (green; Figures 5b–7b). A simple way of thinking about the Gini coefficient in relation to the Lorenz curve is the degree of deviation from perfect equality. The closer the Lorenz curve is to perfect equality (the 45° line where Gini = 0), the more equal the distribution. The further away the Lorenz curve is from perfect equality, the higher the Gini coefficient, and the less equal the distribution.
a) Digitised homesteads; and b) Lorenz curves for homestead area (red) and volume (green) at Marothodi (figure by authors).

a) Digitised homesteads; and b) Lorenz curves for homestead area (red) and volume (green) at Molokwane (figure by authors).

a) Digitised homesteads; and b) Lorenz curves for homestead area (red) and volume (green) at Kaditshwene (figure by authors).

The Gini coefficients for area (m2) in the three settlements analysed here (Table 1) suggest an inverse relationship with the number of homesteads in a given settlement (Figure 8). Marothodi and Molokwane contain the greatest number of homesteads (77 and 71, respectively), and both have relatively low Gini coefficient scores (<0.5). Conversely, Kaditshwene only contains 24 homesteads, despite having the largest population, and a much higher Gini coefficient score.
Gini coefficient (area) against number of homesteads in each settlement. The dotted blue line indicates the inverse relationship between these two variables (figure by authors).

A similar inverse relationship exists between the Gini coefficients for volume (m3) and number of homesteads (Figure 9). When comparing the exact area and volume with the Gini coefficient scores of each settlement, there are only slight differences. There is a marginal difference between the Gini coefficient scores for area and volume at Kaditshwene (0.6661 and 0.6461, respectively), Molokwane (0.4805 and 0.5123) and Marothodi (0.4013 and 0.4215). Here, we should bear in mind that the volume constructed from the TIN is not a highly accurate estimation of volume. Indeed, ethnohistorical and archaeological studies indicate that some homesteads in settlements such as Kaditshwene were as high as 2m (Boeyens Reference Boeyens2000, Reference Boeyens2003) and factoring in the volume of such tall homesteads might produce different results.
Gini coefficient (volume) against number of homesteads in each settlement. The dotted blue line indicates the inverse relationship between these two variables (figure by authors).

Discussion
Keeping in mind that settlements with similar Gini coefficients might be very different from one another—for example, in terms of their social complexity, consumption, political hierarchy and economy (Fochesato et al. Reference Fochesato, Bogaard and Bowles2019: 3)—our Gini results are interpreted within the context of ethnohistorical and archaeological accounts of Marothodi, Molokwane and Kaditshwene. Using homestead size as a proxy for inequality shows that Kaditshwene has relatively high levels of inequality compared to Molokwane and Marothodi. This is apparent in the smaller number of homesteads at Kaditshwene (24) compared with Marothodi and Molokwane (71 and 77, respectively). Kaditshwene therefore shows the highest level of inequality with fewer homesteads, while being the site with the largest estimated population and a significantly longer period of occupation. For Marothodi and Molokwane, there is a low correlation between inequality and homestead size, suggesting that when assessment is based on homestead size alone, inequality is hardly detectable. Since a Gini coefficient analysis gives scores between 0 and 1, where 1 signifies high inequality, a score of 0.42 for Marothodi suggests modest levels of inequality. With a Gini score of 0.64, only Kaditshwene meets the expectation of a relatively high inequality score.
Crucially for our case, while the results demonstrate that a Gini coefficient analysis may be an excellent method for inter-site comparison and identification of spatial difference, they also raise the question of why the inequality scores are so different for Marothodi and Molokwane compared with those for Kaditshwene. Rather than solely measuring inequality, the Gini coefficients for these three southern African settlements may primarily reflect their choice of location. Such analysis is therefore helpful in providing detail for comparing sites situated in different types of landscapes. We emphasise that interpretation of the variables identified here should be anchored in a framework that is sensitive to the specific socio-political contexts. Kaditshwene stands out as a settlement located in a rugged landscape selected for defensive purposes.
The Hurutshe, who established Kaditshwene, went through a process of political fusion, relocation and settlement aggregation during the mid- to late 1700s and early 1800s. This process was driven by several factors, including territorial congestion, a growth in population size and strong competition for the accumulation and control of resources—mainly cattle and metals (Boeyens Reference Boeyens2016: 20). Significantly, unlike Marothodi and Molokwane, Kaditshwene experienced increasingly destructive conflicts and fierce opposition from southern and western communities (in present-day Botswana), especially from the mid-1700s (Morton Reference Morton2014; Boeyens Reference Boeyens2016). We might surmise that factors contributing to high inequality in Kaditshwene, and possibly other settlements, include conflict between chiefdoms, population growth, drought, the accumulation of cattle and the centralisation of political power. Thus, such groups will have a different relationship with surrounding landscapes, in terms of resources and sociopolitical contexts, compared to the other groups building their drystone-walled settlements in more open farmlands further to the east.
Differing Gini coefficients between Kaditshwene and Molokwane and Marothodi strongly suggest that location is a key factor in settlement organisation. Hence our opening question: are we seeing measures taken against insecurity, that is, changes to location and/or internal organisation to safeguard food production and limit access and visibility from outside, and only to a lesser extent measuring inequality? In terms of inequality, the expectation was that the data for Molokwane and Marothodi would indicate significant levels of social asymmetry, not least when taking into consideration the significant size of the central cattle enclosures. The size of the enclosures is most likely due to a focus on landscapes ideal for cattle grazing, access to various minerals and trade between the two sites—most probably including metal objects made by specialists working at Marothodi going one way and cattle from Molokwane moving the other way (Hall et al. Reference Hall, Miller, Anderson and Boeyens2006). Significantly, our initial expectation that settlements with larger population estimates will show higher Gini coefficients—and hence higher inequality—than those with smaller populations was not met in our analysis. This suggests that Gini coefficient analysis is not an efficient universal tool that can help us explain, for example, how and why the settlement at Marothodi, with a population in the thousands but still considerably smaller than that of Kaditshwene, went through a process of centralising power but still returned a Gini coefficient (conventionally interpreted as signifying inequality) markedly lower than Kaditshwene. Thus, while we set out to study inequality, the Gini coefficient seems instead to have been more successful in revealing relative differences in notions of insecurity; that is, identifying means of safeguarding against violence in landscapes characterised by unrest and turmoil.
Conclusions
Our study demonstrates significant potential for the use of Gini coefficients in archaeological studies of LFC sites in southern Africa, particularly when they are firmly anchored in a context-sensitive interpretative framework. Together with ethnohistorical insights information, this method can broaden approaches that are relevant for Africa-based practitioners and local stakeholders. Furthermore, applications of the Gini coefficient raise new questions, for example, concerning how indications of inequality and insecurity can be compared to existing ethnohistorical data relating to various landscapes. Importantly, while our analysis offers insights into data preparation and the adaptation of methods, more work is required to standardise the datasets to enable consistent comparison of settlements. Now that the necessary data and resolution are available for such comparative work, further analyses of remote-sensing data can be used to characterise the terrain of individual settlements, such as viewshed analysis, which will bring us closer to understanding not only regional variation in inequality between sites but also to identify concrete and site-specific strategies to meet increased insecurity among the Later Farming Communities of southern Africa.
Acknowledgements
The authors wish to express their gratitude to Karim Sadr, Stefania Merlo and Enrico Ryunosuke Crema for their continued support, insightful comments, helpful advice and assistance with the initial analyses of Mncedisi Siteleki's original PhD research, which has been significantly developed in this article.
Funding statement
Mncedisi Siteleki's original PhD research was funded by a PhD grant and a completion grant award from the Faculty of Humanities, University of Oslo.


 Open access