


1 Introduction
High-power lasers provide a significant approach for cutting-edge scientific research in topics such as laser inertial confinement fusion (ICF) and condensed matter physics[ Reference Betti and Hurricane1– Reference Hübener, Sentef, De Giovannini, Kemper and Rubio4]. The high-power laser parameters, including the near-field shape, fill factor, wavefront and far-field energy concentration, are important for evaluating the performance of the entire laser facility[ Reference Xia, Fan, Huang, Cheng, Guo and Wang5]. As a vast and intricate optical system, a high-power laser system comprises several thousand optical elements, some of which have a diameter greater than 0.5 m[ Reference Haynam, Wegner, Auerbach, Bowers, Dixit, Erbert, Heestand, Henesian, Hermann, Jancaitis, Manes, Marshall, Mehta, Menapace, Moses, Murray, Nostrand, Orth, Patterson, Sacks, Shaw, Spaeth, Sutton, Williams, Widmayer, White, Yang and Van Wonterghem6]. Numerous factors, including irregularities in material uniformity and surface profiles, as well as thermal distortion of the gain medium, significantly impair the quality of the transmitted beam, resulting in substantial degradation of the focal spot[ Reference Homoelle, Bowers, Budge, Haynam, Heebner, Hermann, Jancaitis, Jarboe, LaFortune, Salmon, Schindler and Shaw7, Reference Zhu, Zhu, Li, Zhu, Ma, Lu, Fan, Liu, Zhou, Xu, Zhang, Xie, Yang, Wang, Ouyang, Wang, Li, Yang, Fan, Sun, Liu, Liu, Zhang, Tao, Sun, Zhu, Wang, Jiao, Ren, Liu, Jiao, Huang and Lin8]. Therefore, accurate online measurement of pulsed laser parameters is of paramount importance for ensuring the optimal output performance of high-power laser systems[ Reference Jiao, Shao, Zhao, Wu, Ji, Wang, Xia, Liu, Zhou, Ju, Cai, Ye, Qiao, Hua, Li, Pan, Ren, Sun, Zhu and Lin9]. Under high-energy conditions, the irradiation focal spot can have a power density higher than 1020–1021 W/cm2. Nevertheless, due to the detector’s restricted dynamic range, accurately recording the focal-spot distribution by positioning it directly on the exact focal plane is challenging[ Reference Bowers, Wisoff, Herrmann, Anklam, Dawson, Nicola, Haefner, Hermann, Larson, Marshall, Wonterghem and Wegner10, Reference Danson, Haefner, Bromage, Butcher, Chanteloup, Chowdhury, Galvanauskas, Gizzi, Hein, Hillier, Hopps, Kato, Khazanov, Kodama, Korn, Li, Li, Limpert, Ma, Nam, Neely, Papadopoulos, Penman, Qian, Rocca, Shaykin, Siders, Spindloe, Szatmári, Trines, Zhu, Zhu and Zuegel11]. An ingenious approach to diagnosing the focal spot is to assess the complex amplitude (intensity and phase at the same position) of the laser beam on an out-of-focus plane, and subsequently numerically propagate it to the exact focal plane[ Reference Humphry, Kraus, Hurst, Maiden and Rodenburg12– Reference He, Liu and Zhu14]. In theory, an optical system based on interferometry can realize accurate laser beam detection by measuring the complex amplitude; however, its complex structure, large space requirements and need for high environmental stability restrict its installation in the limited space of a high-power laser facility[ Reference Liu, Gao and Chang15]. The Shack–Hartmann sensor, another widely utilized wavefront detection device, has its resolution constrained by the number and size of its sub-apertures. Consequently, it is primarily capable of measuring low-frequency information on the laser beam. Moreover, its applicability is restricted by the fact that it can measure only nearly parallel laser beams[ Reference Cao and Yu16]. An optimal device for real-time monitoring of high-power laser beam parameters should provide the accuracy of an interferometer while remaining simple and compact, like a Shack–Hartmann sensor. Achieving all these requirements with a single device using traditional techniques is difficult, thereby rendering online diagnostics of high-power beams a formidable challenge.
Coherent diffractive imaging (CDI) is emerging as a promising solution for determining the parameters of high-power lasers. Its ability to extract the complex amplitude directly from the intensity of the diffraction pattern provides advantages such as high imaging resolution and a compact design[ Reference Lo, Zhao, Gallagher-Jones, Rana, Lodico, Xiao, Regan and Miao17]. In 1972, Gerchberg and Saxton[ Reference Gerchberg and Saxton18] first introduced the CDI method, which was later developed by Fienup[ Reference Fienup19, Reference Fienup20]. Matsuoka and Yamakawa[ Reference Matsuoka and Yamakawa21] utilized CDI to measure the wavefront of terawatt-class laser pulses. They reconstructed the complex amplitude by capturing the intensity of the laser pulses at different planes and using the standard Gerchberg–Saxton (G-S) algorithm. By using the intensity recorded at multiple focal-spot planes, Bahk et al. [ Reference Bahk, Bromage, Begishev, Mileham, Stoeckl, Storm and Zuegel22] were able to ascertain the phase of the multi-terawatt laser beam by phase retrieval. At the University of Rochester, CDI was effectively utilized for focal-spot diagnostics at the OMEGA EP laser facility[ Reference Kruschwitz, Bahk, Bromage, Moore and Irwin23]. However, the adoption of a multiple-plane recording scheme elevates the demand for precision and stability in the experimental setup. Moreover, these methods can become highly complex when measuring high-power pulsed laser beams.
Professor Rodenburg’s team at Sheffield University has devised an innovative CDI technique known as coherent modulation imaging (CMI), which necessitates only a single-shot measurement for the reconstruction of complex amplitudes[ Reference Zhang, Pedrini and Osten24– Reference Lin, Xu, Zhao and Zhang28]. A random phase plate (RPP) is utilized to modify the wavefront of the incident laser, and a charge-coupled device (CCD) captures the diffraction patterns, resulting in a highly compact setup for CMI. In 2015, researchers conducted verification measurements on a He-Ne laser beam using CMI[ Reference He, Veetil, Liu, Gao, Wang, Wang and Zhu29]. Then, an attempt was made to use the new CMI technology to conduct practical measurements of near- and far-field parameters for high-power lasers[ Reference Zhu, Tao, Pan and Liu30]. However, in actual experimental studies, it has been found that while CMI technology reconstructs the complex amplitude with a single-shot, there is some obvious speckle noise present in the calculated near-field distribution. Consequently, the actual measurement results pose challenges in accurately characterizing a high-power laser beam[ Reference Tao, Veetil, Pan, Liu and Zhu31, Reference Pan, Veetil, Liu, Tao, Jiang, Lin, Li and Zhu32].
In this paper, to reduce speckle noise in the measurement, we proposed the modified coherent modulation imaging (MCMI) method. Compared to the traditional CMI algorithm, it enhances the constraint conditions by recording a second image with a CCD camera. By calibrating the static aberrations of the laser system with an offline point laser source, we obtained the complex amplitude optical field of nanosecond high-power pulsed lasers. The focal-spot distributions at different planes were calculated with the reconstructed complex amplitude. Experimental near-field and far-field parameter measurement results were compared with those obtained using traditional direct imaging and the Shack–Hartmann wavefront sensor under different energy conditions.
2 Modified coherent modulation imaging algorithm
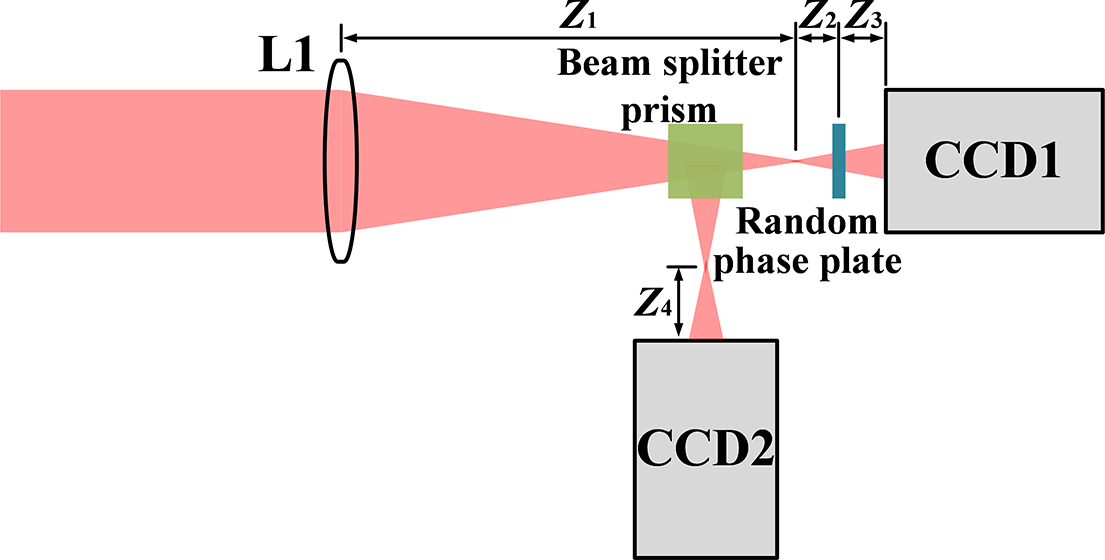
A schematic illustration of the MCMI method can be seen in Figure 1. The laser beam to be measured is focused by a converging lens L1, and is subsequently split into two identical beams using a beam splitter prism. Each of these two beams has an optical axis that is perpendicular to the other. The transmitted beam illuminates an RPP, which is situated at a certain distance behind the focal plane of lens L1. A CCD camera (CCD1) is used to record a formed diffraction spot. Another CCD camera (CCD2) is placed in the reflection path to simultaneously collect another intensity pattern. The purpose of adding CCD2 is to enhance the constraint conditions in the reconstruction algorithm, thereby improving the signal-to-noise ratio (SNR) of the measurement.
Schematic illustration of the MCMI method.
Take a random initial guess for the complex amplitude ${\psi}_n\left(x,y\right)$
of the laser beam at the focal plane, where n represents the number of iterations. Computational reconstruction of the incident laser’s optical field is performed iteratively through the following steps.
${\psi}_n\left(x,y\right)$
of the laser beam at the focal plane, where n represents the number of iterations. Computational reconstruction of the incident laser’s optical field is performed iteratively through the following steps.
-
(1) Suppose that the constraint function for a circular aperture in the focal plane is defined as ${C}_n=\left\{\begin{array}{@{}l}1,\ 0\le a\le {a}_n\\ {}0,\ a>{a}_n\end{array}\right.\!\!\!\!,$
where
$a$
is the radius and
${a}_n$
(when n = 1) is a small constant that is typically set at the micrometer scale. The optical field at the focal plane upon the nth iteration is denoted as
${\psi}_{\mathrm{e},n}\left(x,y\right)={\psi}_n\left(x,y\right)\cdot {C}_n$
.
${C}_n=\left\{\begin{array}{@{}l}1,\ 0\le a\le {a}_n\\ {}0,\ a>{a}_n\end{array}\right.\!\!\!\!,$
where
$a$
is the radius and
${a}_n$
(when n = 1) is a small constant that is typically set at the micrometer scale. The optical field at the focal plane upon the nth iteration is denoted as
${\psi}_{\mathrm{e},n}\left(x,y\right)={\psi}_n\left(x,y\right)\cdot {C}_n$
. -
(2) Propagate
${\psi}_{\mathrm{e},n}\left(x,y\right)$
to the RPP plane. The optical field is denoted as
${R}_{\mathrm{m},n}\left(x,y\right)= \mathrm{FDF}\left[{\psi}_{\mathrm{e},n}\left(x,y\right),{z}_2\right]$
, where
$\mathrm{FDF}$
defines the propagation calculated through the Fresnel diffraction formula as
$\mathrm{FDF}\big[\psi (x, y),z\big]=\frac{\exp \left( ik z\right)}{i\lambda z}\iint \psi \left(x,y\right)\exp \left[ ik\frac{{\left({x}^{\prime }-x\right)}^2+{\left({y}^{\prime }-y\right)}^2}{2z}\right]\mathrm{d}x\mathrm{d}y$
, where
$k=2\pi /\lambda$
,
$z$
is the propagation distance and
$\lambda$
is the wavelength of the laser. -
(3) Due to the modulation of the RPP, the RPP plane’s exit optical field can be denoted as
${\psi}_{\mathrm{m},n}\left(x,y\right)={R}_{\mathrm{m},n}\left(x,y\right)\cdot M\left(x,y\right)$
, where
$M\left(x,y\right)$
represents the pre-characterized modulation function of the RPP. -
(4) Propagate
${\psi}_{\mathrm{m},n}\left(x,y\right)$
to the CCD1 plane. The optical field can be calculated as
${\xi}_{\mathrm{m},n}\left(x,y\right)= \mathrm{FDF}\left[{\psi}_{\mathrm{m},n}\left(x,y\right),{z}_3\right]$
. -
(5) Substitute the amplitude of
${\xi}_{\mathrm{m},n}\left(x,y\right)$
with the square root of the intensity I
1 captured by CCD1. The corrected optical field function is
${\xi}_{\mathrm{m},n}^{\prime}\left(x,y\right)=\sqrt{I_1}\exp \left[i\arg \left|{\xi}_{\mathrm{m},n}\left(x,y\right)\right|\right]$
, where
$\arg \left|{\xi}_{\mathrm{m},n}\left(x,y\right)\right|$
denotes the phase of
${\xi}_{\mathrm{m},n}\left(x,y\right)$
. -
(6) Propagate back
${\xi}_{\mathrm{m},n}^{\prime}\left(x,y\right)$
to the RPP plane; then the optical field can be determined as
${\psi}_{\mathrm{c},n}\left(x,y\right)= \mathrm{FDF}\left[{\xi}_{\mathrm{m},n}^{\prime}\left(x,y\right),-{z}_3\right]$
. -
(7) Remove the effect of the RPP by the following function:
in which
$$\begin{align*}{R}_\mathrm{new}\left(x,y\right)&={R}_{\mathrm{m},n}\left(x,y\right)+\frac{\left|M\left(x,y\right)\right|}{{\left|M\left(x,y\right)\right|}_{\mathrm{max}}}\frac{M{\left(x,y\right)}^{\ast }}{\left[{\left|M\left(x,y\right)\right|}^2+\alpha \right]}\\ &\quad\times \left[{\psi}_{\mathrm{c},n}(x,y)-{R}_{\mathrm{m},n}(x,y)\cdot M(x,y)\right],\end{align*}$$
$\alpha$
is a constant aimed at efficiently mitigating noise[
Reference Rodenburg and Faulkner33]. Here, we set
$\alpha$
= 1.
-
(8) Propagate
${R}_\mathrm{new}\left(x,y\right)$
to the focus plane. The optical field can be calculated as
${\psi}_{\mathrm{e},n}^{\prime}\left(x,y\right)= \mathrm{FDF}\left[{R}_\mathrm{new}\left(x,y\right),-{z}_2\right]$
. -
(9) Propagate
${\psi}_{\mathrm{e},n}^{\prime}\left(x,y\right)$
to the CCD2 plane. The optical field can be calculated as
${\rho}_{\mathrm{m},n}\left(x,y\right)= \mathrm{FDF}\left[{\psi}_{\mathrm{e},n}^{\prime}\left(x,y\right),{z}_4\right]$
. -
(10) Substitute the amplitude of
${\rho}_{\mathrm{m},n}\left(x,y\right)$
with the square root of the intensity I
2 captured by CCD2. The revised optical field function is denoted as
${\rho}_{\mathrm{m},n}^{\prime}\left(x,y\right)=\sqrt{I_2}\exp \left[i\arg \left|{\rho}_{\mathrm{m},n}\left(x,y\right)\right|\right]$
. -
(11) Propagate
${\rho}_{\mathrm{m},n}^{\prime}\left(x,y\right)$
backward to the focus plane. The optical field can be calculated as
${\psi}_{\mathrm{e},n}^{{\prime\prime}}\left(x,y\right)= \mathrm{FDF}\left[{\rho}_{\mathrm{m},n}^{\prime}\left(x,y\right),-{z}_4\right]$
. -
(12) Gradually increase the value of
${a}_{n+1}$
, and correspondingly update the optical field at the focus plane as
${\psi}_{\mathrm{e},n+1}\left(x,y\right)={\psi}_{\mathrm{e},n}^{{\prime\prime}}\left(x,y\right)\cdot {C}_{n+1}$
.


Persist in executing steps (1)–(12) until the discrepancy between successive iterations of ${\psi}_{\mathrm{e},n}\left(x,y\right)$
decreases to an extremely low level. This accurately reconstructed complex amplitude optical field
${\psi}_{\mathrm{e},n}\left(x,y\right)$
decreases to an extremely low level. This accurately reconstructed complex amplitude optical field ${\psi}_{\mathrm{e},n}\left(x,y\right)$
can be used to calculate the laser distribution at different positions.
${\psi}_{\mathrm{e},n}\left(x,y\right)$
can be used to calculate the laser distribution at different positions.
The optical field at the plane behind the convergent lens L1 can be determined as $E\left({x}^{\prime },{y}^{\prime}\right)= \mathrm{FDF}\left[{\psi}_{\mathrm{e},n}\left(x,y\right),{z}_1\right]$
. The transmission function L(x, y) of the convergent lens L1 can be pre-calibrated with a point source laser. Following this, we can ascertain the optical field of the incident laser prior to lens L1, represented as
$E\left({x}^{\prime },{y}^{\prime}\right)= \mathrm{FDF}\left[{\psi}_{\mathrm{e},n}\left(x,y\right),{z}_1\right]$
. The transmission function L(x, y) of the convergent lens L1 can be pre-calibrated with a point source laser. Following this, we can ascertain the optical field of the incident laser prior to lens L1, represented as ${E}^{\prime}\left({x}^{\prime },{y}^{\prime}\right)=E\left({x}^{\prime },{y}^{\prime}\right)/L\left(x,y\right)$
. The intensity can be calculated as
${E}^{\prime}\left({x}^{\prime },{y}^{\prime}\right)=E\left({x}^{\prime },{y}^{\prime}\right)/L\left(x,y\right)$
. The intensity can be calculated as $I\left({x}^{\prime },{y}^{\prime}\right)={\left|{E}^{\prime}\left({x}^{\prime },{y}^{\prime}\right)\right|}^2$
.
$I\left({x}^{\prime },{y}^{\prime}\right)={\left|{E}^{\prime}\left({x}^{\prime },{y}^{\prime}\right)\right|}^2$
.
The efficacy of the proposed MCMI method can be evaluated by computing the error function on the CCD1 plane, as detailed below, while the iterative process continues until the desired level of precision is obtained:
 $$ \begin{align*} \mathrm{Error}=\frac{{\left|\left|{\xi}_{\mathrm{m},n}^{\prime}\left(x,y\right)\right|-\sqrt{I_1}\right|}^2}{I_1}. \end{align*} $$
3 Experiments and results
3.1 Optical path configuration
Figure 2(a) illustrates the optical pathway of computational near-field and far-field parameter measurements within the Shenguang-II laser device. The high-power laser, featuring the wavelength of 1053 nm and a substantial aperture of 310 mm × 310 mm, is sampled by a wedge-shaped plate, then downsized to 23.5 mm × 23.5 mm through the use of a beam reducer. The sampling beam passes through the adjustable attenuators A1 and A2 to further decrease its intensity. Based on the principles of geometric optical imaging and the parameters of the beam reduction system components, the imaging position of the laser beam’s near-field can be calculated. As shown in Figure 2(a), the imaging plane is behind A2 and the distance to L1 is 1300 mm. For the measurement optical path of MCMI, the beam continues to pass through the splitters M4, M3 and M2 and reflector M1 and finally enters the measurement package. The incident parallel beam is focused by the focusing lens L1 (focal length f = 330 mm), and subsequently split into two beams by a beam splitter prism. One of the beams passes through the RPP and forms a diffraction pattern, which is recorded by CCD1. The other beam enters CCD2, where another diffraction pattern is captured. CCD1 and CCD2 used are PIKE-F1100B instruments (Allied Vision Technologies, AVT, 4008 × 2672 pixels, pixel size 9 μm, bit depth 8 bits). CCD2 can be placed on an optional plane in the reflection path. Coincidentally, in experiments, CCD2 is placed on the imaging plane of lens L1; thus, the image recorded is exactly the near-field intensity of the laser to be measured, which also can be used for real-time laser beam monitoring during offline debugging of the laser device.
(a) Optical path schematic diagram of the MCMI method. (b) MCMI measurement package in the Shenguang-II laser device. (c) Location of components in the MCMI measurement package.
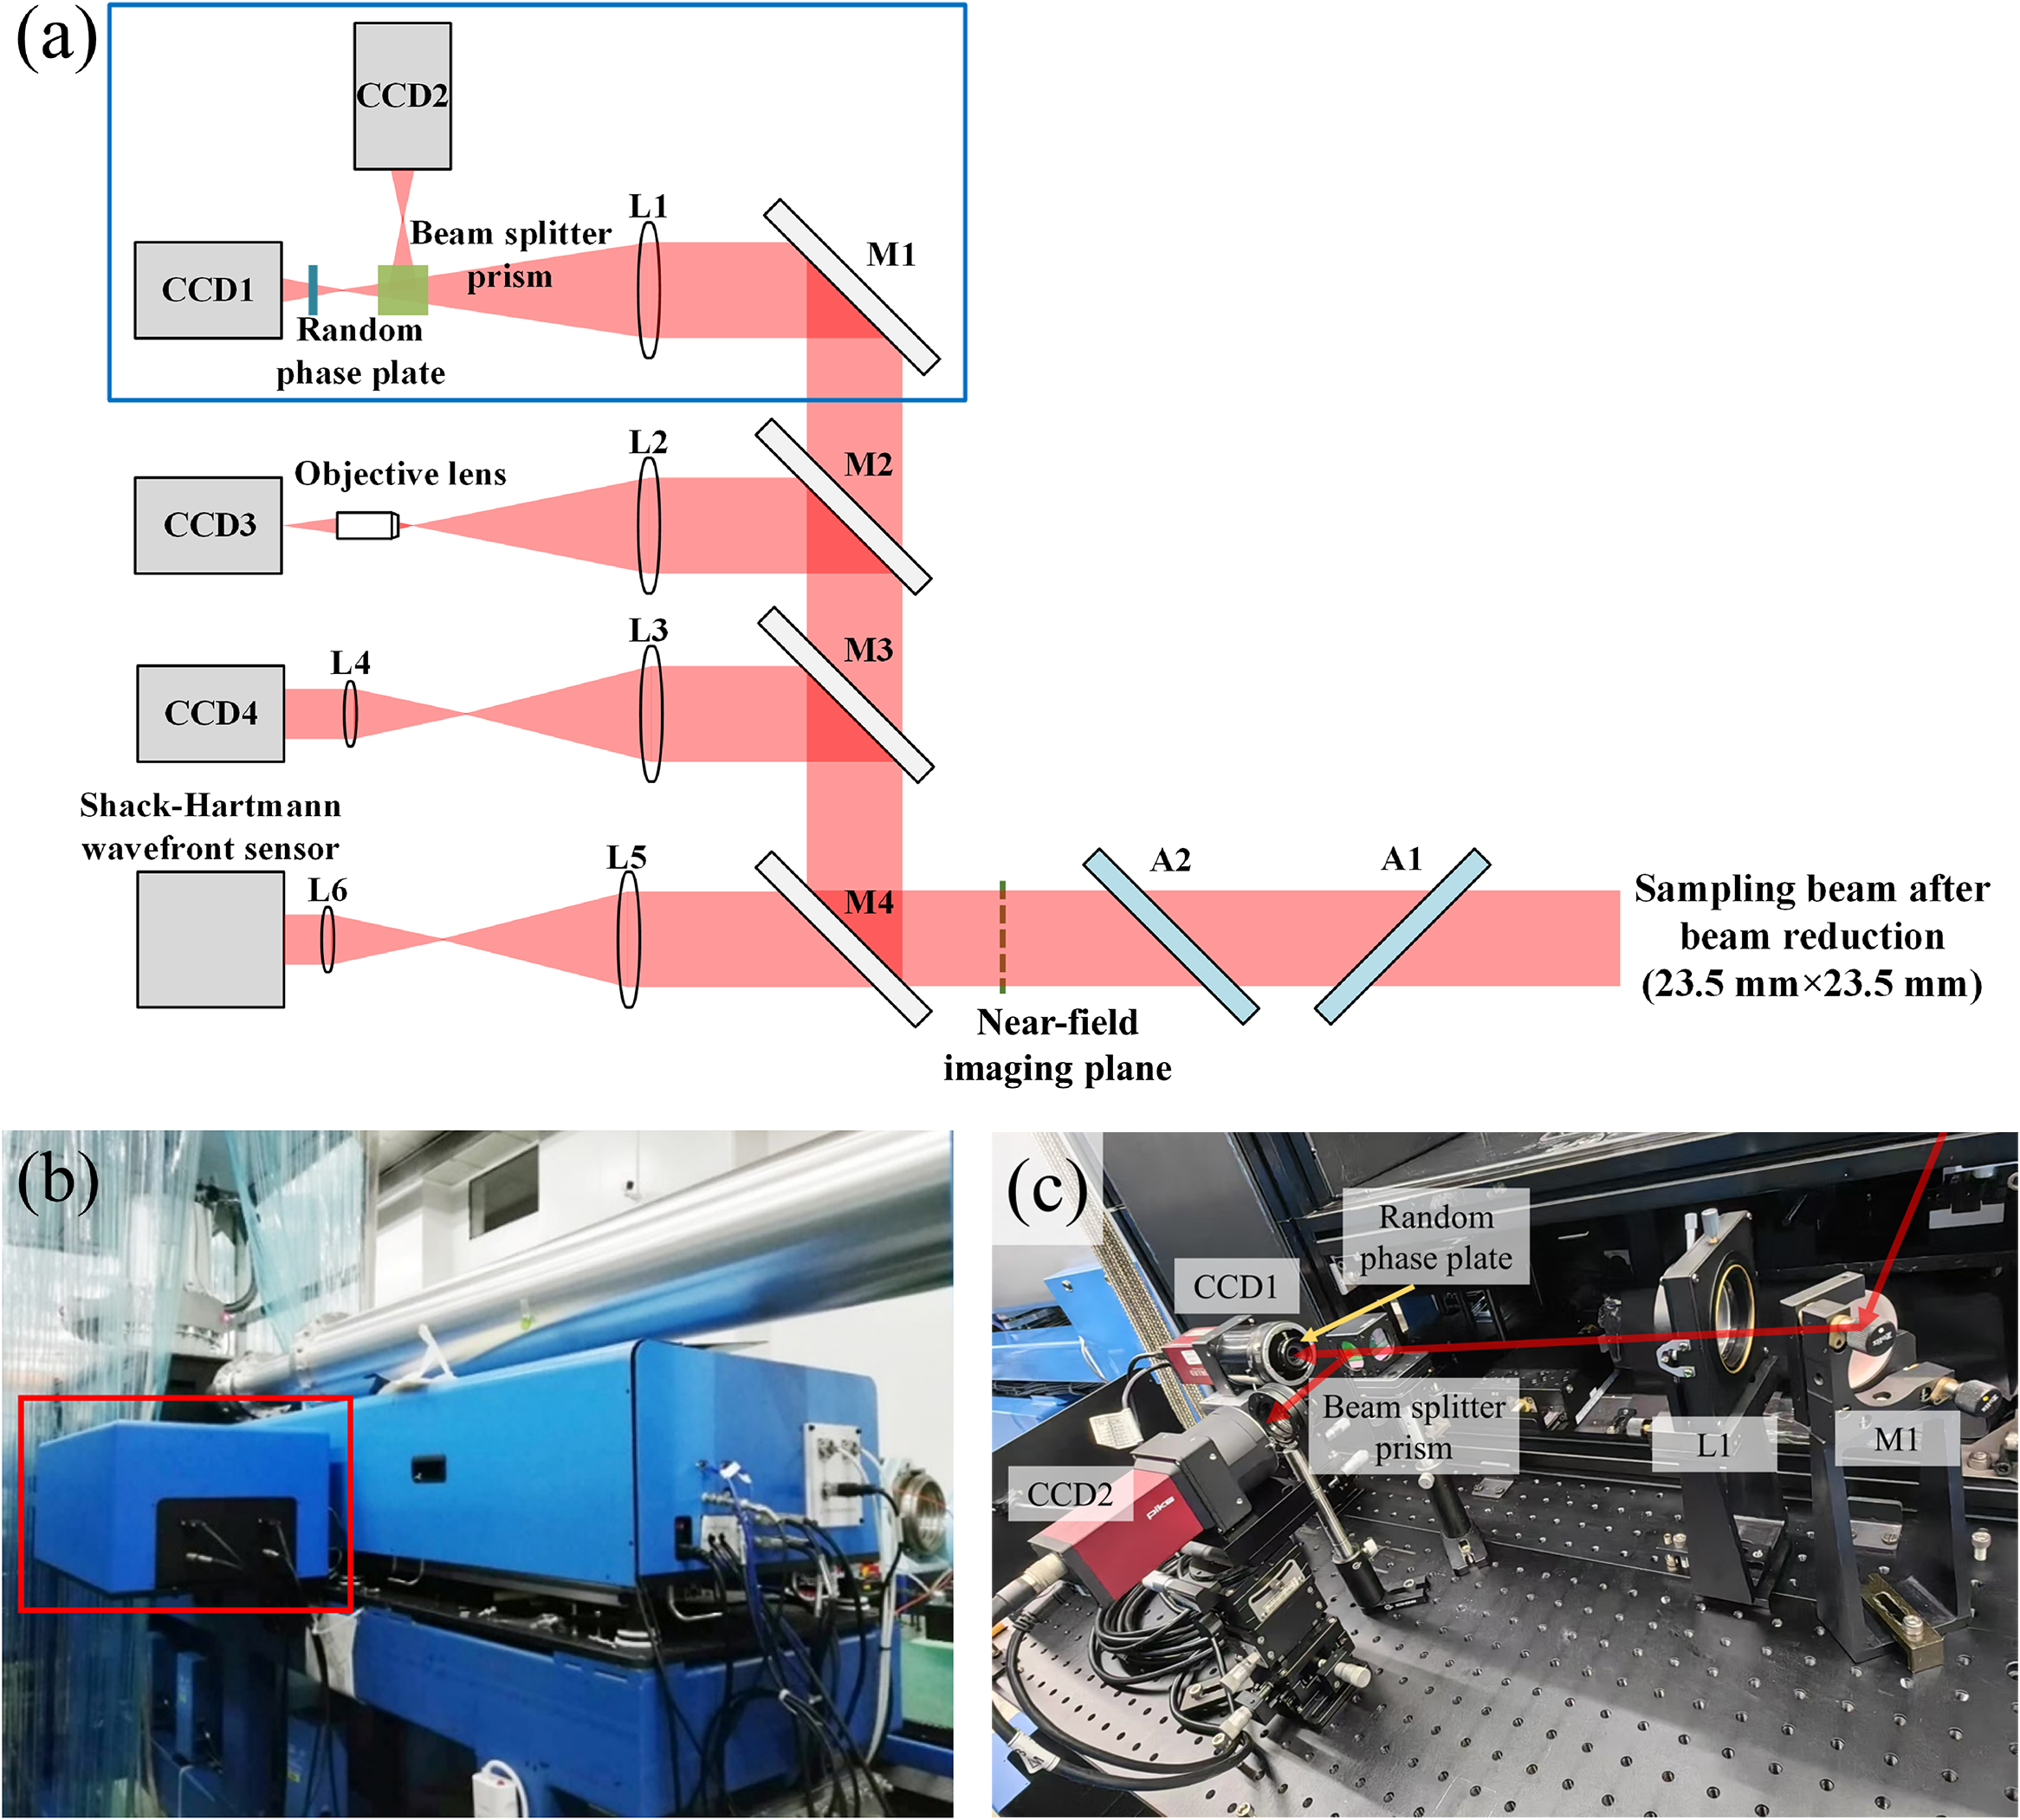
The value of z
1 is the focal length of lens L1. The selected distance of z
2 and z
3 is intended to form a diffraction pattern at suitable planes; thus, the size of the entire diffraction pattern matches the size of the CCD camera. The distance from the focal plane to the CCD2 detector is z
4. The parameters are z
1 = 330 mm, z
2 = 27.2 mm, z
3 = 83.3 mm and z
4 = 110.2 mm. By utilizing the patterns recorded by CCD1 and CCD2, the optical field can be reconstructed through iterative calculations. In part 2, with the MCMI algorithm, the complex amplitude ${E}^{\prime}\left({x}^{\prime },{y}^{\prime}\right)$
before the convergent lens L1 can be calculated. Using the Fresnel propagation formula to propagate
${E}^{\prime}\left({x}^{\prime },{y}^{\prime}\right)$
before the convergent lens L1 can be calculated. Using the Fresnel propagation formula to propagate ${E}^{\prime}\left({x}^{\prime },{y}^{\prime}\right)$
to the near-field imaging plane with a distance of 1300 mm, the near-field intensity and wavefront also can be calculated. The far-field focal spot can be obtained by propagating
${E}^{\prime}\left({x}^{\prime },{y}^{\prime}\right)$
to the near-field imaging plane with a distance of 1300 mm, the near-field intensity and wavefront also can be calculated. The far-field focal spot can be obtained by propagating $E\left({x}^{\prime },{y}^{\prime}\right)$
to the focal-spot plane. Figure 2(b) depicts the actual measurement package that we positioned within the Shenguang-II laser device. Figure 2(c) illustrates the arrangement of the components within the MCMI measurement package.
$E\left({x}^{\prime },{y}^{\prime}\right)$
to the focal-spot plane. Figure 2(b) depicts the actual measurement package that we positioned within the Shenguang-II laser device. Figure 2(c) illustrates the arrangement of the components within the MCMI measurement package.
In Figure 2(a), CCD3 is used for traditional direct imaging through far-field intensity recording. The focal spot is formed by L2 focusing, and the objective lens is used to magnify the focal spot for display. CCD4 is used for traditional direct near-field imaging. The system composed of L3 and L4 is used for further reduction of the sampling beam. The final beam size matches the size of the CCD4 detector. A Shack–Hartmann sensor is utilized for measuring near-field wavefronts. This Shack–Hartmann sensor is a customized model mainly used in the Shenguang-II laser device to cooperate with a large-aperture deformable mirror for active wavefront correction. It has a central transmission wavelength of 1053 nm, a sub-aperture array of 22×22 and an aperture size of 5.5 mm × 5.5 mm. The dynamic range of defocus aberrations measurement is better than 16 μm, and the measurement accuracy reaches 0.1 μm. Similarly, the system composed of L5 and L6 is used for further reduction of the sampling beam. The final beam size matches the detector size of the Shack–Hartmann sensor. These above configurations can be used to compare the accuracy of computational measurement with traditional measurement methods.
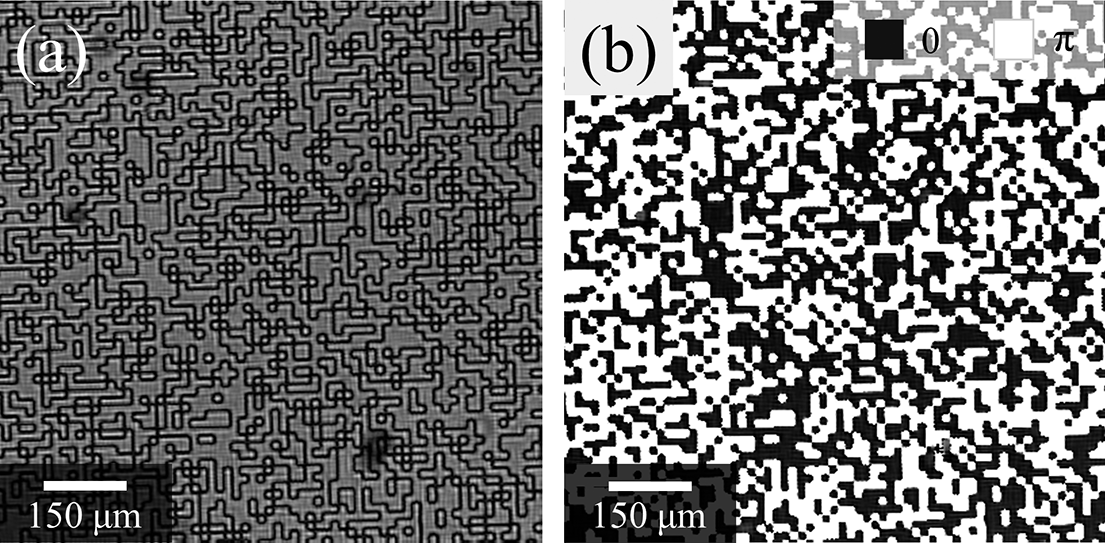
The intensity and phase of the RPP, which was pre-characterized by the ePIE algorithm [ Reference Tao, Veetil, Pan, Liu and Zhu31], are shown in Figure 3. The RPP is designed for the wavelength of 1053 nm. It consists of a series of 0 or π phase modulation units, which are randomly distributed, and the smallest modulation unit is 9 μm in size.
Pre-characterized modulation function of the RPP. (a) Intensity distribution and (b) phase distribution.
3.2 Static aberration calibration
Effective wavefront quality control is crucial for high-power laser devices, as it directly impacts the safety of laser operation and the success of physics experiments. Static aberrations are defined as wavefront aberrations occurring under the static conditions of the high-power laser device itself. Static wavefront aberrations mainly arise from material nonuniformity, processing errors, clamping stress and optical path installation errors of optical components, while dynamic output wavefront distortion primarily stems from amplifier thermal gradients and nonuniform pumping, air disturbances and mechanical vibrations.
At the focal point of the transmission spatial filter (TSF) within the main amplification system of the Shenguang-II laser device, a large-aperture calibration laser is generated by a 1053 nm continuous fiber laser (point laser source) passing through a spatial filter output lens. The calibration laser enters the MCMI measurement package after traversing several optical components. The calculated near-field wavefront at this point represents the static aberrations of the Shenguang-II main amplification system.
Assuming the static aberration is W s and when a high-power pulsed laser is emitted the measured wavefront of the laser beam is W e, then we can obtain the actual dynamic wavefront of the high-power laser by calculating W d = W e – W s.
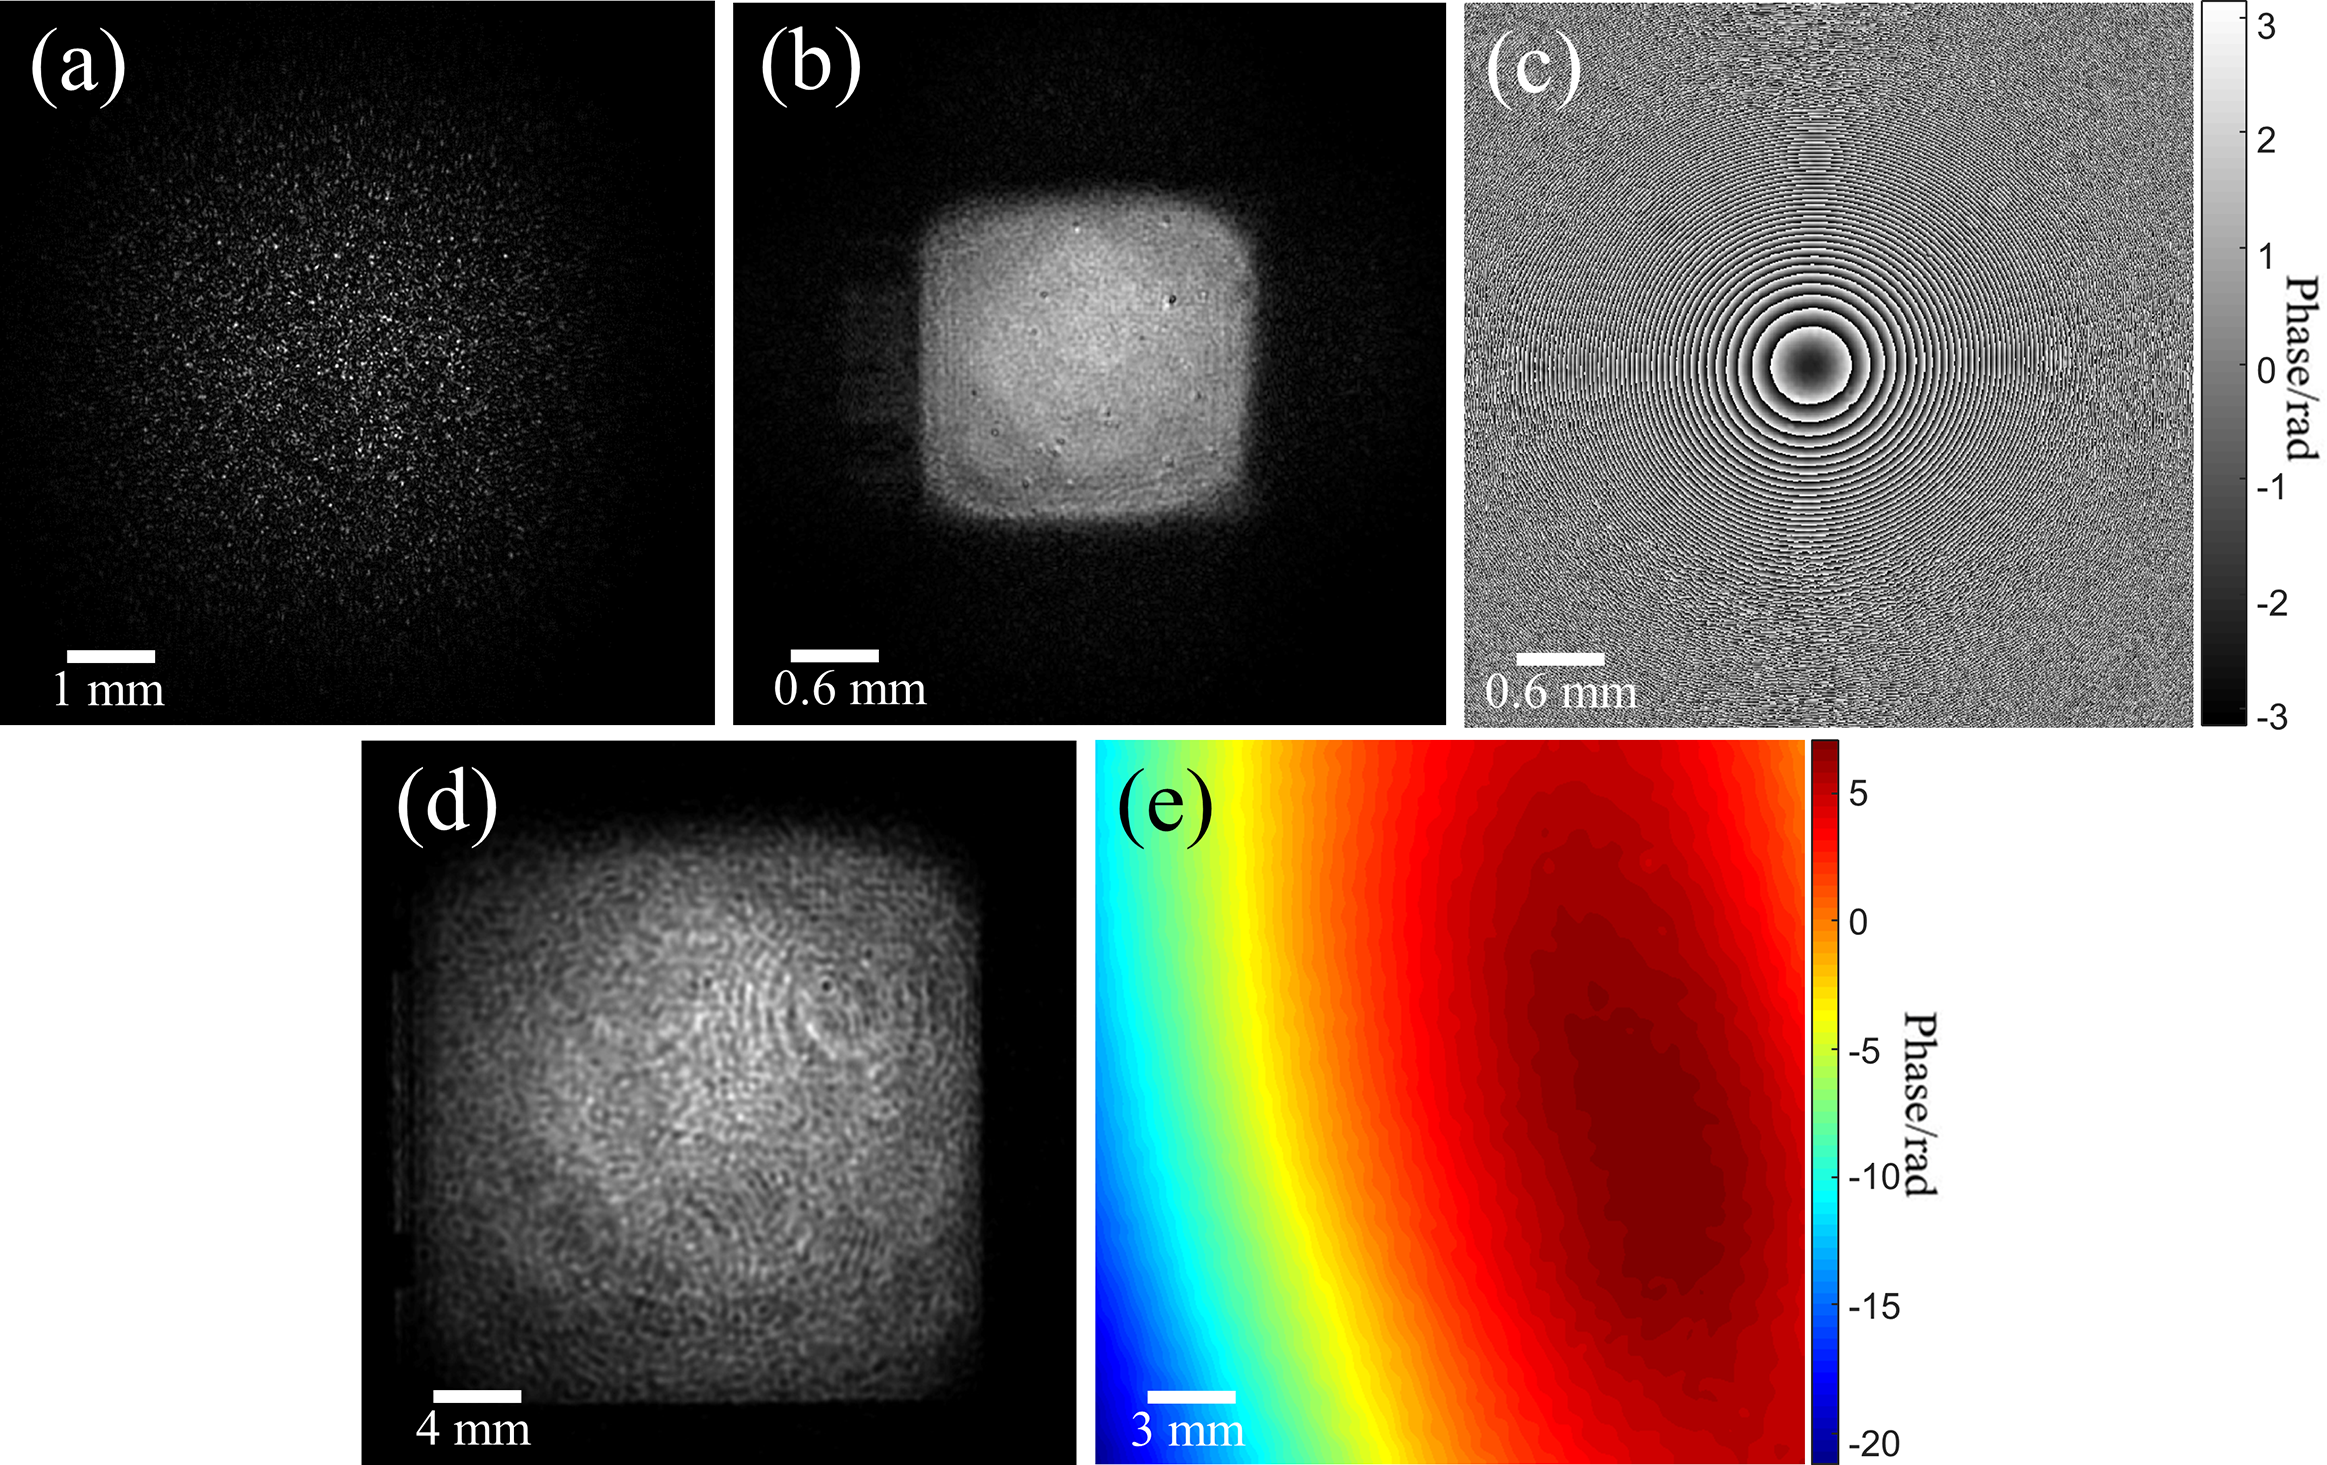
To demonstrate the benefits of adding a second pattern to enhance the constraints in the MCMI algorithm during the static aberrations calibration of the laser system, we first investigated the complex amplitude reconstruction only using a pattern recorded by CCD1 with the traditional CMI algorithm. Utilizing a Tesla K40c graphics processing unit (GPU) from NVIDIA, the reconstruction process was completed in 500 iterations, resulting in a total calculation time of approximately 200 seconds.
The images involved in data acquisition and computational reconstruction include (a) the diffraction pattern recorded by one CCD after passing through the modulator RPP and (b) the intensity pattern directly recorded by another CCD. Using the patterns captured by these CCDs, we reconstructed the complex amplitude images on the RPP plane, which encompass (c) the intensity and (d) the phase. Based on this reconstructed complex amplitude, we calculated the (e) intensity and (f) phase images of the near-field of the laser beam.
The intensity pattern captured by CCD1 is shown in Figure 4(a). It can be seen that the laser beam becomes speckled after modulation by the RPP. Employing the intensity pattern, the MCMI algorithm was used to reconstruct the optical field of the incident laser. Figures 4(b) and 4(c) depict the reconstructed intensity and phase distributions on the RPP, respectively. The near-field intensity calculated is displayed in Figure 4(d), which clearly shows some speckle noise inside. Figure 4(e) shows the calculated near-field wavefront, where the peak-to-valley (PV) value is 27.51 rad (4.38λ) and root-mean-square (RMS) is 6.41 rad (1.02λ).
Static aberration calibration with a point laser source using the traditional CMI algorithm. (a) Intensity image recorded by CCD1. (b) Retrieved intensity on the RPP plane. (c) Retrieved phase on the RPP plane. (d) Calculated near-field intensity. (e) Calculated near-field wavefront.
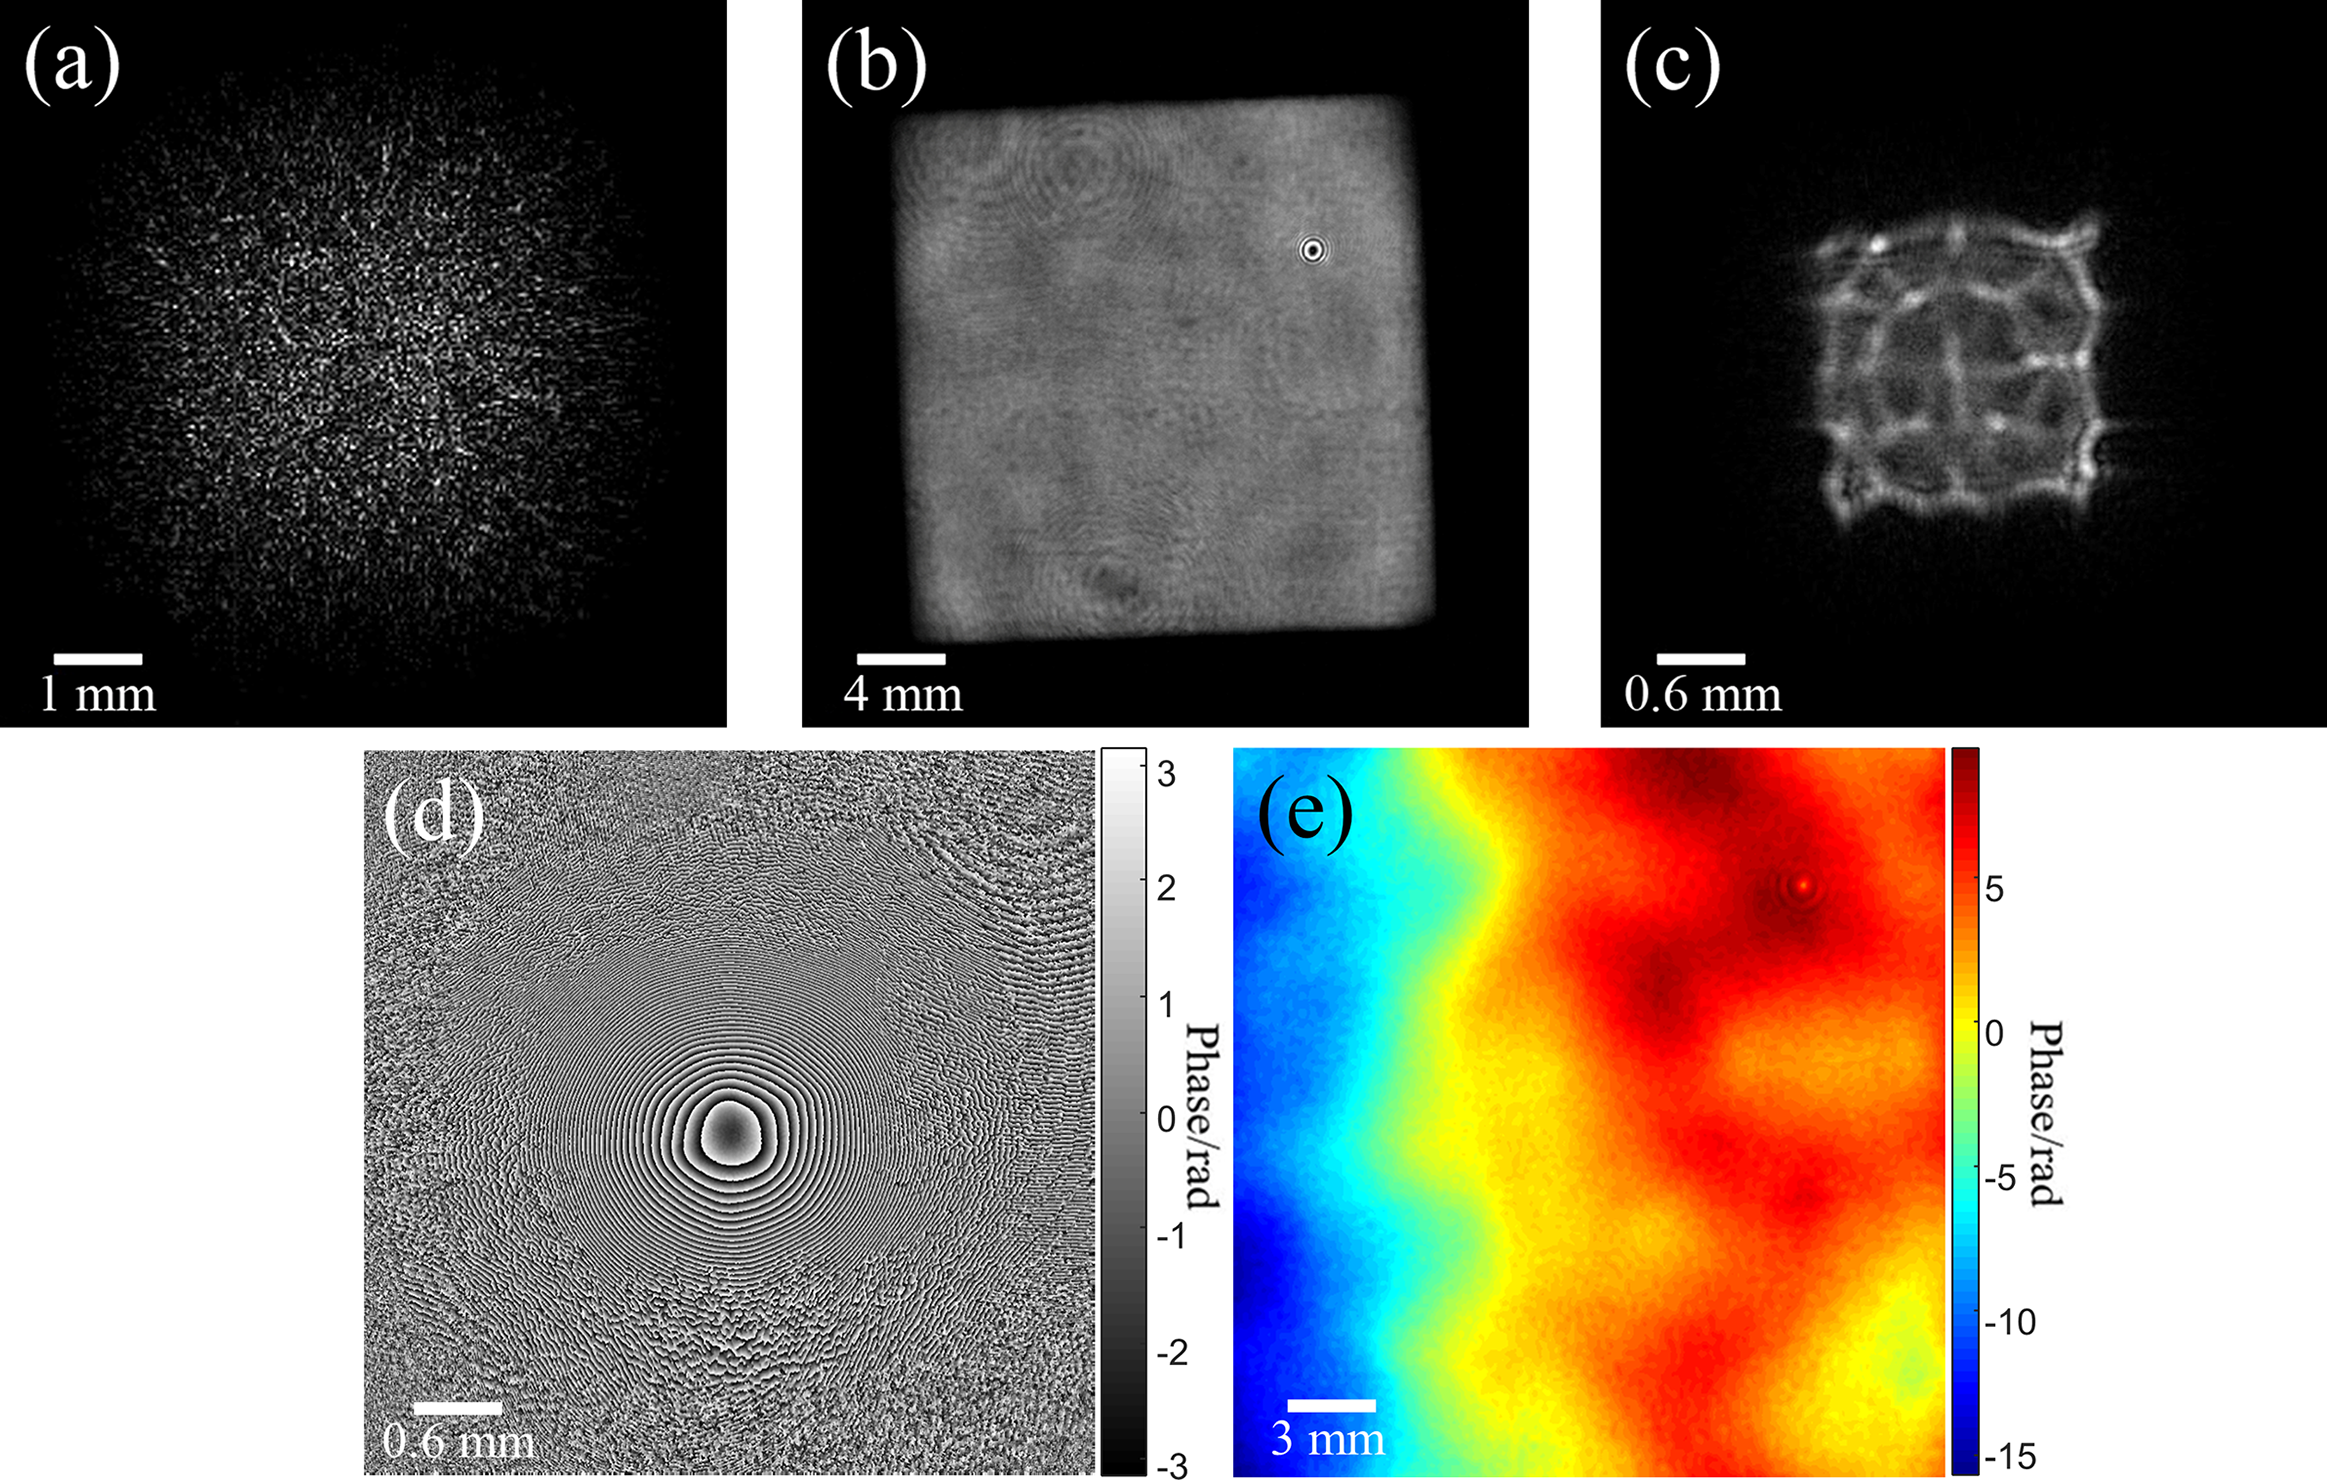
Here, we investigated the complex amplitude reconstruction using two patterns recorded by CCD1 and CCD2 with the proposed MCMI algorithm. The reconstruction was accomplished in similar conditions using the previous computer hardware configuration, and the computation time also remained similar.
Figure 5(a) illustrates the intensity pattern captured by CCD1, while Figure 5(b) depicts the intensity pattern recorded by CCD2. The reconstructed intensity and phase distributions on the RPP plane are presented in Figures 5(c) and 5(d), respectively. Here we introduce the ratio of beam intensity variance to background noise variance as a method to calculate the SNR of the reconstructed intensity. The calculation expression is SNR = 10log10 (intensity variance/noise variance). The calculated SNR for Figure 5(c) is 31.9 dB and for Figure 4(b) it is 30.5 dB. By comparing these two values, we can conclude that the proposed MCMI algorithm has reduced the noise. The computed near-field intensity is presented in Figure 5(e). It is worth noting that CCD2 is placed exactly on the near-field imaging plane, ensuring that the computed near-field intensity is consistent with the image captured by CCD2, as shown in Figure 5(b). By comparing Figures 5(e) and 4(d), it is clear that the addition of constraints effectively reduces speckle noise. Figure 5(f) shows the calculated near-field wavefront, where the PV value is 24.74 rad (3.94λ) and the RMS is 6.70 rad (0.85λ). Comparing Figures 5(f) and Figure 4(e), it is intuitive to see the diffraction ring in the upper right corner, which is shown in Figure 5(f). It can be observed that the measurement spatial resolution has been improved by using the MCMI algorithm.
Static aberration calibration with a point laser source using the MCMI algorithm. (a) Intensity image recorded by CCD1. (b) Intensity image recorded by CCD2. (c) Retrieved intensity on the RPP plane. (d) Retrieved phase on the RPP plane. (e) Calculated near-field intensity. (f) Calculated near-field wavefront.

To demonstrate the reconstruction process of the traditional CMI algorithm and the MCMI algorithm more clearly, the two convergence curves are shown in Figure 6. Following 500 iterations of calculation, we found that the reconstruction errors are less than 10%. However, MCMI has a faster convergence speed and smaller errors due to the addition of constraints imposed by CCD2’s pattern.
Error convergence curves observed during the iterative calculation process.

3.3 High-energy experimental measurements
In ICF experiments, the seed laser initially originates from the front-end system. It is then amplified by a pre-amplification system to reach an energy level in joules. Ultimately, it is converted into a 351 nm laser via frequency doubling within the target system for laser–matter interaction. For varying materials and target shapes, laser devices must deliver different output energies and pulse widths, while maintaining high-quality laser beam characteristics to ensure optimal physical experimental results. The measurement system offers precise characterization of laser parameters, serving as a crucial technical foundation for both physical experiments and the evaluation of laser operational status.
The computed measurement results of a high-power laser of energy 3272 J and pulse width 3 ns are displayed in Figure 7. Figure 7(a) presents the intensity pattern recorded by CCD1. After modulation by the RPP, the laser beam becomes speckled, as can be observed. Figure 7(b) shows the intensity pattern recorded by CCD2; it displays a regular square beam with only a few small modulation points. Figure 7(c) illustrates the reconstructed irregular intensity distribution on the RPP plane, which is a consequence of the free propagation in space. The corresponding phase distribution is shown in Figure 7(d). Figure 7(e) displays the computed near-field wavefront, which includes static aberrations.
Computational measurement of a high-power laser of energy 3272 J and pulse width 3 ns. (a) Intensity image recorded by CCD1. (b) Intensity image recorded by CCD2. (c) Retrieved intensity on the RPP plane. (d) Retrieved phase on the RPP plane. (e) Calculated near-field wavefront including static aberrations.
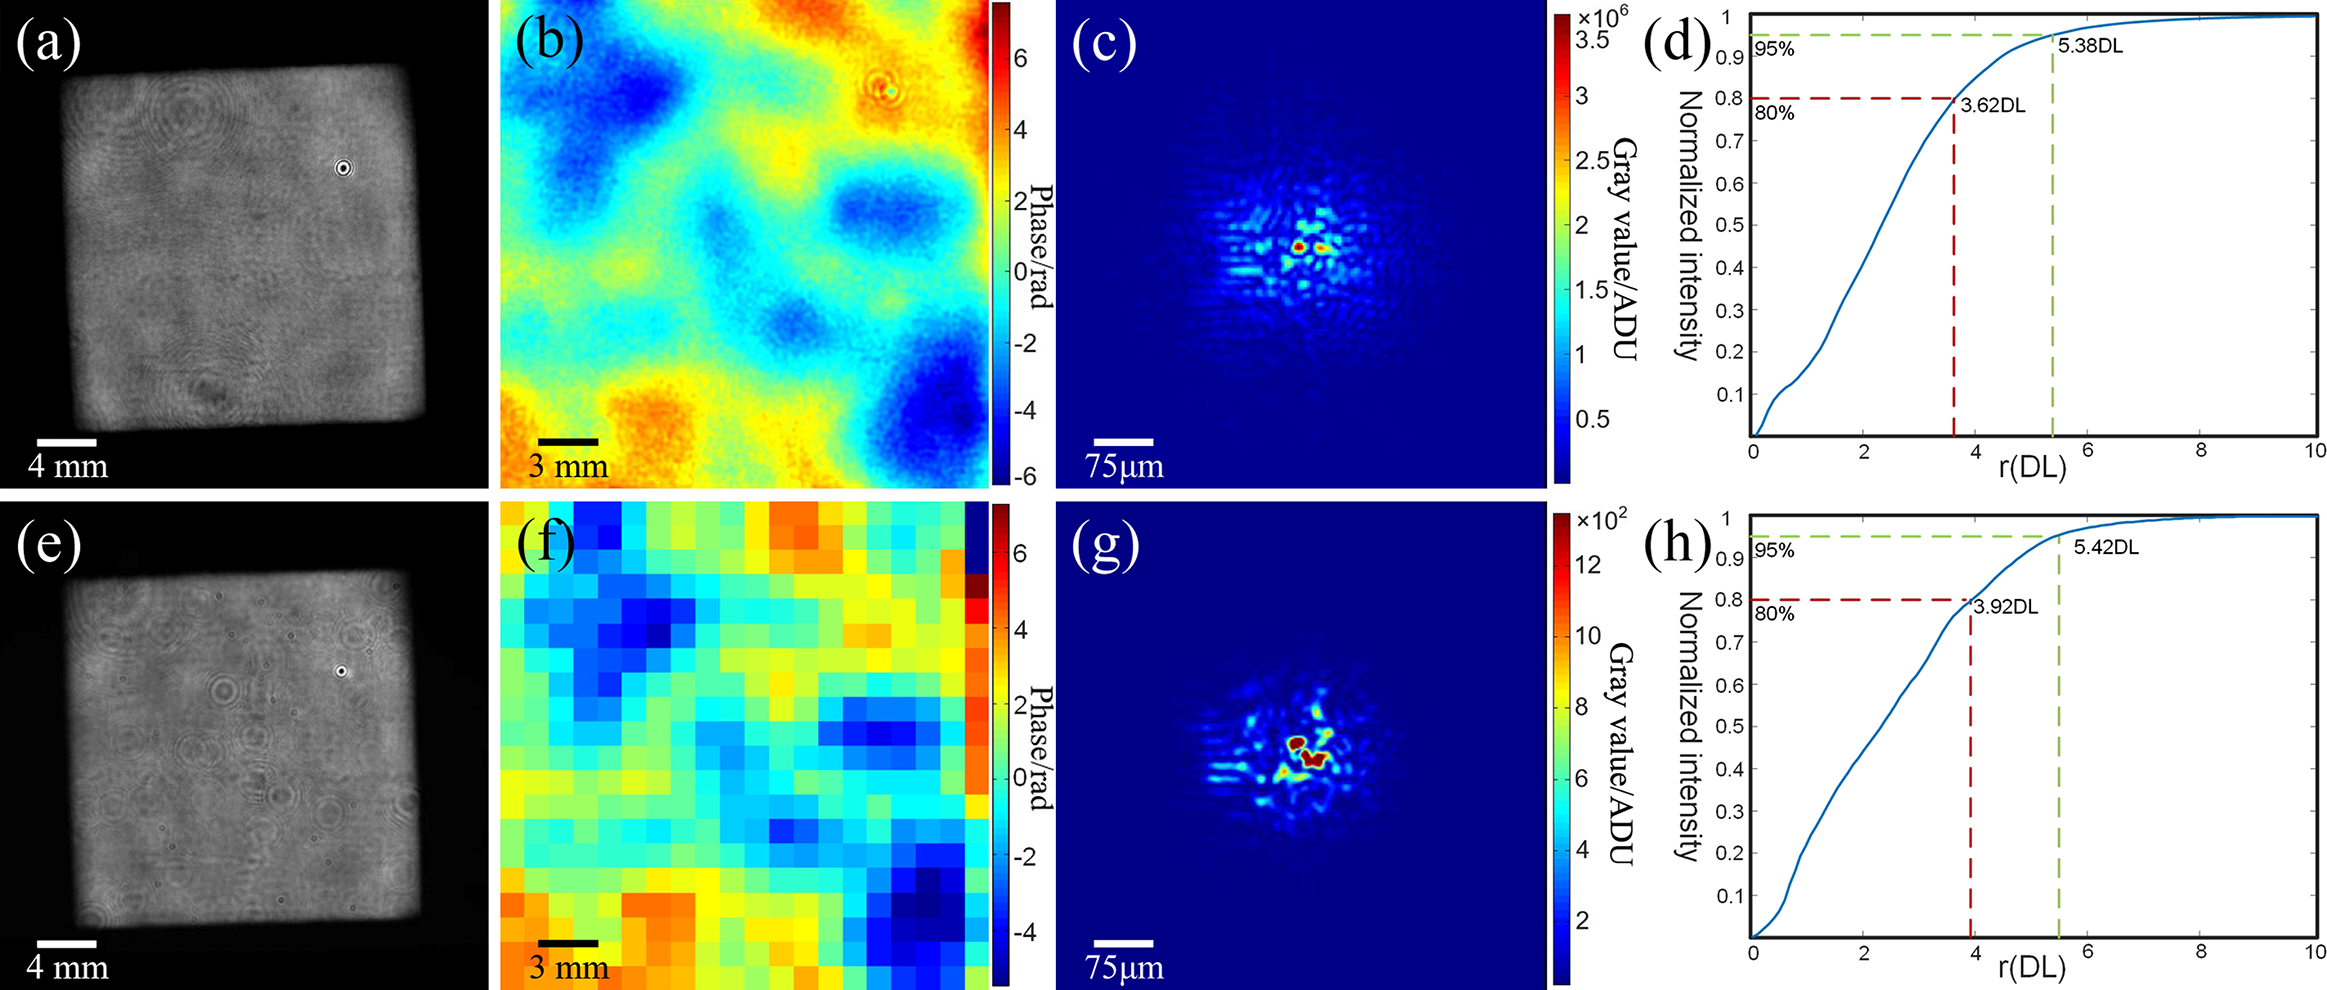
The MCMI method can calculate the near-field intensity and wavefront, as well as the focal-spot distribution in the far-field, and it can also derive the far-field encircled energy curve. Traditional measurement methods, on the other hand, directly image and record the near-field intensity and the far-field focal-spot distribution using different CCDs, and they can also calculate the far-field encircled energy curve. However, the wavefront is measured separately using a Shack–Hartmann wavefront sensor. We have compared these measurement results in Figure 8. Figures 8(a) and 8(e) illustrate the near-field intensity distributions: the former is reconstructed using the MCMI method, while the latter is captured directly using CCD4. These two distributions are almost indistinguishable, and the upper right region in both figures clearly shows modulation caused by specific defects. When evaluating the near-field beam quality, the near-field F factor is a key parameter to consider. The near-field F factor is typically represented as $F={I}_\mathrm{ave}(D)/{I}_\mathrm{max}(D)$
, where
$F={I}_\mathrm{ave}(D)/{I}_\mathrm{max}(D)$
, where ${I}_\mathrm{max}(D)$
represents the maximum laser beam intensity within the diameter D, while
${I}_\mathrm{max}(D)$
represents the maximum laser beam intensity within the diameter D, while ${I}_\mathrm{ave}(D)$
denotes the average intensity within the same diameter. A higher F factor indicates better near-field beam quality for the actual high-energy laser. Following calculations and processing, the near-field F factors for the two methods have been determined to be 0.650 and 0.663, respectively. By subtracting the static aberrations presented in Figure 5(f) from the computed near-field wavefront displayed in Figure 7(e), the actual dynamic, high-energy near-field wavefront can be derived, as illustrated in Figure 8(b). The PV value is 13.56 rad (2.16λ) and the RMS is 2.13 rad (0.34λ). Figure 8(f) presents the near-field wavefront measurement obtained using the Shack–Hartmann wavefront sensor, where the PV value is 12.75 rad (2.03λ) and the RMS is 2.32 rad (0.37λ). The wavefront distribution measured by these two methods is almost identical. In the upper right corner of Figure 8(b), the phase modulation induced by defects in the wavefront is clearly visible, indicating an enhancement of spatial resolution achieved through the MCMI method. Figure 8(c) shows the focal spot that was obtained by propagating the reconstructed complex amplitude. The numerical value 3.725 × 10⁶ on the scale represents the maximum gray value of the intensity. The scale is converted into pseudocolor during display. According to the formula for calculating the dynamic range
${I}_\mathrm{ave}(D)$
denotes the average intensity within the same diameter. A higher F factor indicates better near-field beam quality for the actual high-energy laser. Following calculations and processing, the near-field F factors for the two methods have been determined to be 0.650 and 0.663, respectively. By subtracting the static aberrations presented in Figure 5(f) from the computed near-field wavefront displayed in Figure 7(e), the actual dynamic, high-energy near-field wavefront can be derived, as illustrated in Figure 8(b). The PV value is 13.56 rad (2.16λ) and the RMS is 2.13 rad (0.34λ). Figure 8(f) presents the near-field wavefront measurement obtained using the Shack–Hartmann wavefront sensor, where the PV value is 12.75 rad (2.03λ) and the RMS is 2.32 rad (0.37λ). The wavefront distribution measured by these two methods is almost identical. In the upper right corner of Figure 8(b), the phase modulation induced by defects in the wavefront is clearly visible, indicating an enhancement of spatial resolution achieved through the MCMI method. Figure 8(c) shows the focal spot that was obtained by propagating the reconstructed complex amplitude. The numerical value 3.725 × 10⁶ on the scale represents the maximum gray value of the intensity. The scale is converted into pseudocolor during display. According to the formula for calculating the dynamic range $\mathrm{DR}\left[\mathrm{dB}\right]=20{\log}_{10}\left({S}_{\mathrm{max}}/{S}_{\mathrm{min}}\right)$
, where S
max and S
min represent the maximum and minimum values of the recorded intensity, respectively, the calculated dynamic range of the focal spot in Figure 8(c) is 176 dB. Due to the focal spot not being directly recorded through a CCD on the focal plane, numerical calculations can be used to obtain a high dynamic range focus distribution based on the reconstructed complex amplitude at the other plane. Figure 8(g) shows the focal spot with the maximum gray value of 1.341 × 10³, and the calculated dynamic range is 62 dB, as measured by direct imaging through the 16-bit CCD3. Figure 8(c) exhibits a focal-spot distribution that is more representative of reality, owing to the large dynamic range achieved through computational reconstruction. Encircled energy refers to the fraction of the total energy of the focal spot that is contained within a specific radius. The encircled energy can be calculated as
$\mathrm{DR}\left[\mathrm{dB}\right]=20{\log}_{10}\left({S}_{\mathrm{max}}/{S}_{\mathrm{min}}\right)$
, where S
max and S
min represent the maximum and minimum values of the recorded intensity, respectively, the calculated dynamic range of the focal spot in Figure 8(c) is 176 dB. Due to the focal spot not being directly recorded through a CCD on the focal plane, numerical calculations can be used to obtain a high dynamic range focus distribution based on the reconstructed complex amplitude at the other plane. Figure 8(g) shows the focal spot with the maximum gray value of 1.341 × 10³, and the calculated dynamic range is 62 dB, as measured by direct imaging through the 16-bit CCD3. Figure 8(c) exhibits a focal-spot distribution that is more representative of reality, owing to the large dynamic range achieved through computational reconstruction. Encircled energy refers to the fraction of the total energy of the focal spot that is contained within a specific radius. The encircled energy can be calculated as $\mathrm{EE}=\underset{x^2+{y}^2<{r}^2}{\iint }E\left(x,y\right)\mathrm{d}x\mathrm{d}y/\underset{-\infty }{\overset{+\infty }{\int }}\int E\left(x,y\right)\mathrm{d}x\mathrm{d}y$
, where
$\mathrm{EE}=\underset{x^2+{y}^2<{r}^2}{\iint }E\left(x,y\right)\mathrm{d}x\mathrm{d}y/\underset{-\infty }{\overset{+\infty }{\int }}\int E\left(x,y\right)\mathrm{d}x\mathrm{d}y$
, where $r$
is the radius of the circle centered on the centroid of the focal spot’s energy distribution. Figure 8(d) depicts the encircled energy corresponding to the far-field focal spot presented in Figure 8(c). In the figure, ‘DL’ represents the diffraction limit of the focal spot. The mathematical representation of the diffraction limit is given by
$r$
is the radius of the circle centered on the centroid of the focal spot’s energy distribution. Figure 8(d) depicts the encircled energy corresponding to the far-field focal spot presented in Figure 8(c). In the figure, ‘DL’ represents the diffraction limit of the focal spot. The mathematical representation of the diffraction limit is given by $1 \mathrm{DL}=2.44\lambda f/1.414D$
, where λ is the wavelength and f and D are the focal length and the diameter of the converging lens, respectively. Here,
$1 \mathrm{DL}=2.44\lambda f/1.414D$
, where λ is the wavelength and f and D are the focal length and the diameter of the converging lens, respectively. Here, $1 \mathrm{DL}=2.44\times 1053\times {10}^{\hbox{--} 3}\times 330/(1.414\times 23.5)=25.52$
μm. Far-field spot size control is crucial for ICF physics and represents one of the key parameters of high-power laser facility performance. The encircled energy reflects the energy concentration within the focal spot. A smaller multiple of the diffraction limit corresponding to the 80% or 95% encircled energy indicates a stronger laser focusing capability. The selection of 80% and 95% encircled energy is based on the standards in the field of high-power laser[
Reference Menapace, Davis, Steele, Hachkowski, Nelson and Xin34]. Figure 8(h) shows the encircled energy of the far-field focal spot depicted in Figure 8(g). The comparison suggests that the computational method yields a better focal-spot energy concentration, due to the large dynamic range offered by the proposed approach.
$1 \mathrm{DL}=2.44\times 1053\times {10}^{\hbox{--} 3}\times 330/(1.414\times 23.5)=25.52$
μm. Far-field spot size control is crucial for ICF physics and represents one of the key parameters of high-power laser facility performance. The encircled energy reflects the energy concentration within the focal spot. A smaller multiple of the diffraction limit corresponding to the 80% or 95% encircled energy indicates a stronger laser focusing capability. The selection of 80% and 95% encircled energy is based on the standards in the field of high-power laser[
Reference Menapace, Davis, Steele, Hachkowski, Nelson and Xin34]. Figure 8(h) shows the encircled energy of the far-field focal spot depicted in Figure 8(g). The comparison suggests that the computational method yields a better focal-spot energy concentration, due to the large dynamic range offered by the proposed approach.
Comparison measurement results for a high-power laser of energy 3272 J and pulse width 3 ns. (a) Near-field intensity calculated using MCMI. (b) Near-field phase calculated using MCMI. (c) Far-field focal spot calculated using the MCMI method. (d) Encircled energy corresponding to the focal spot shown in (c). (e) Near-field intensity directly measured and captured by CCD4. (f) Near-field phase directly recorded by a Shack–Hartmann wavefront sensor. (g) Far-field intensity directly captured by CCD3. (h) Encircled energy corresponding to the focal spot shown in (g).
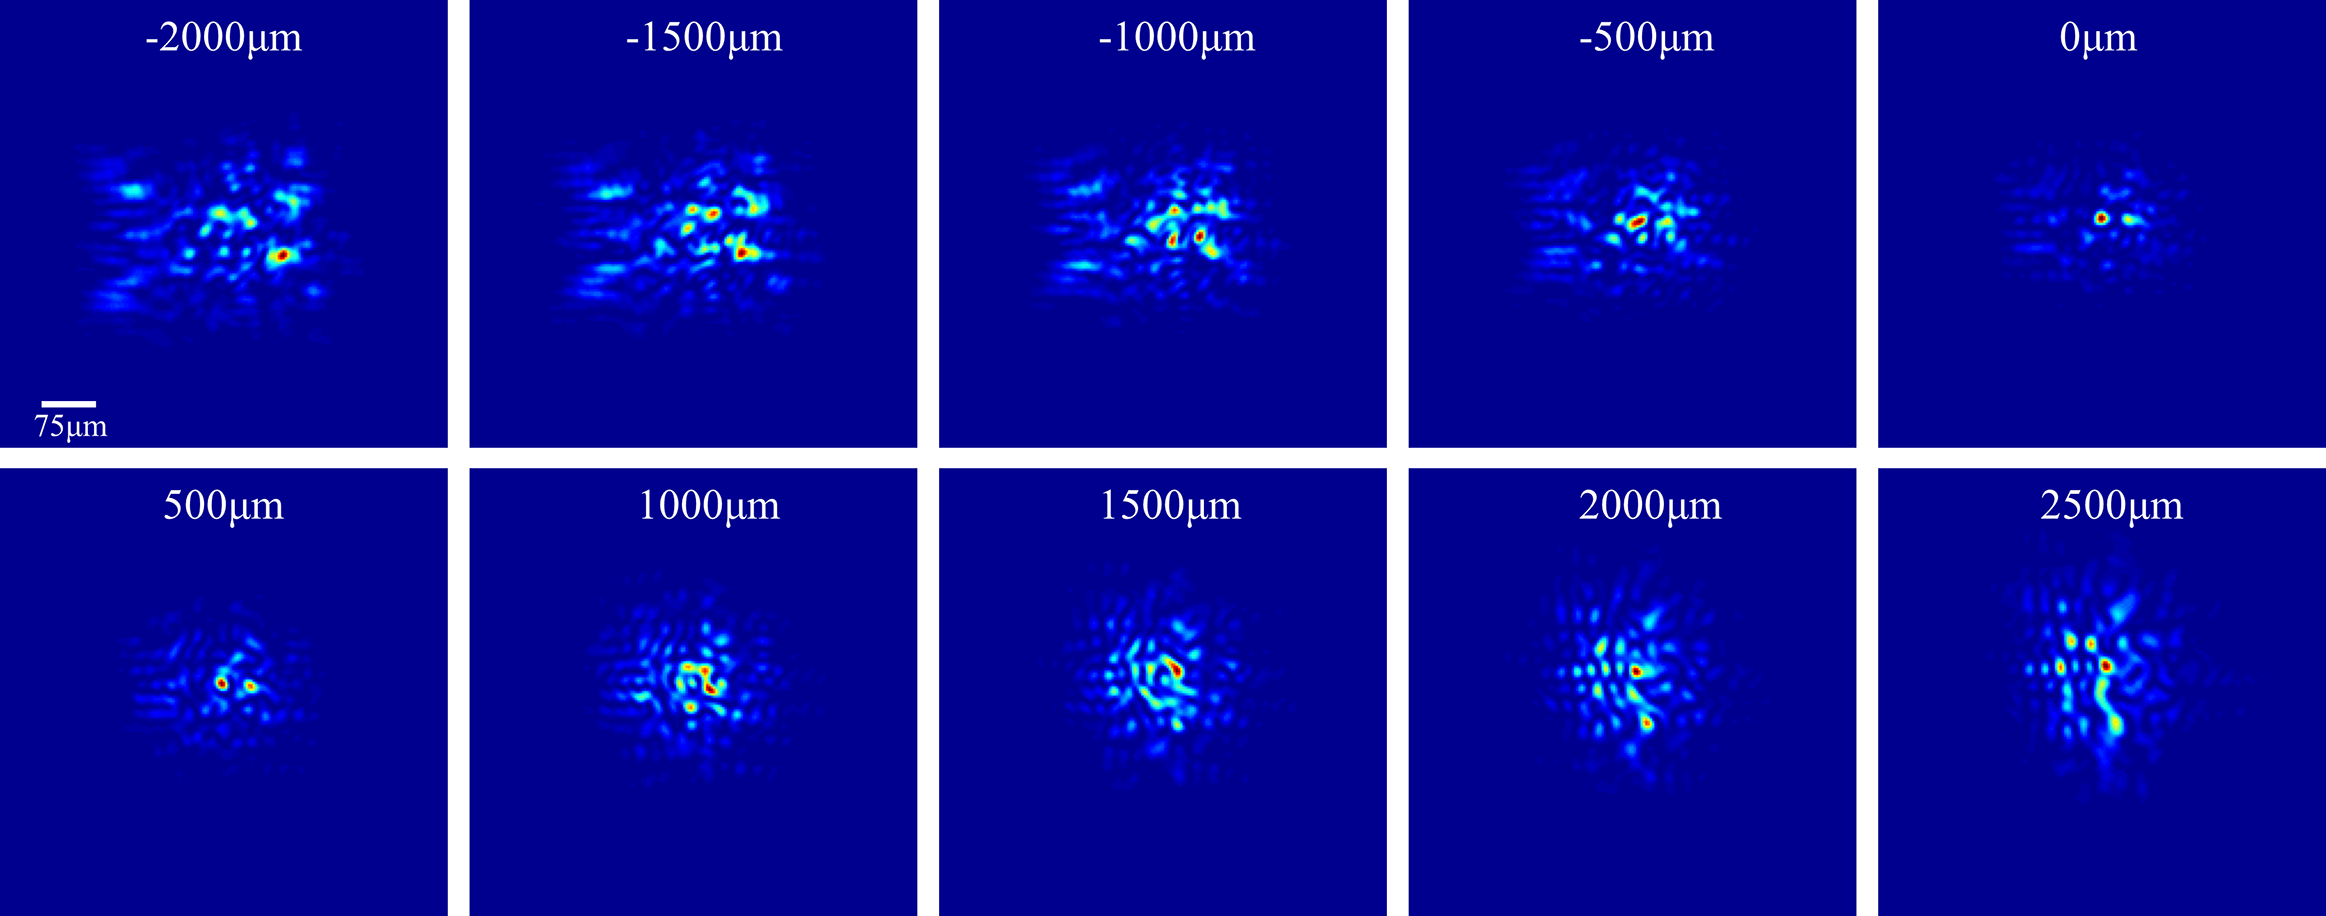
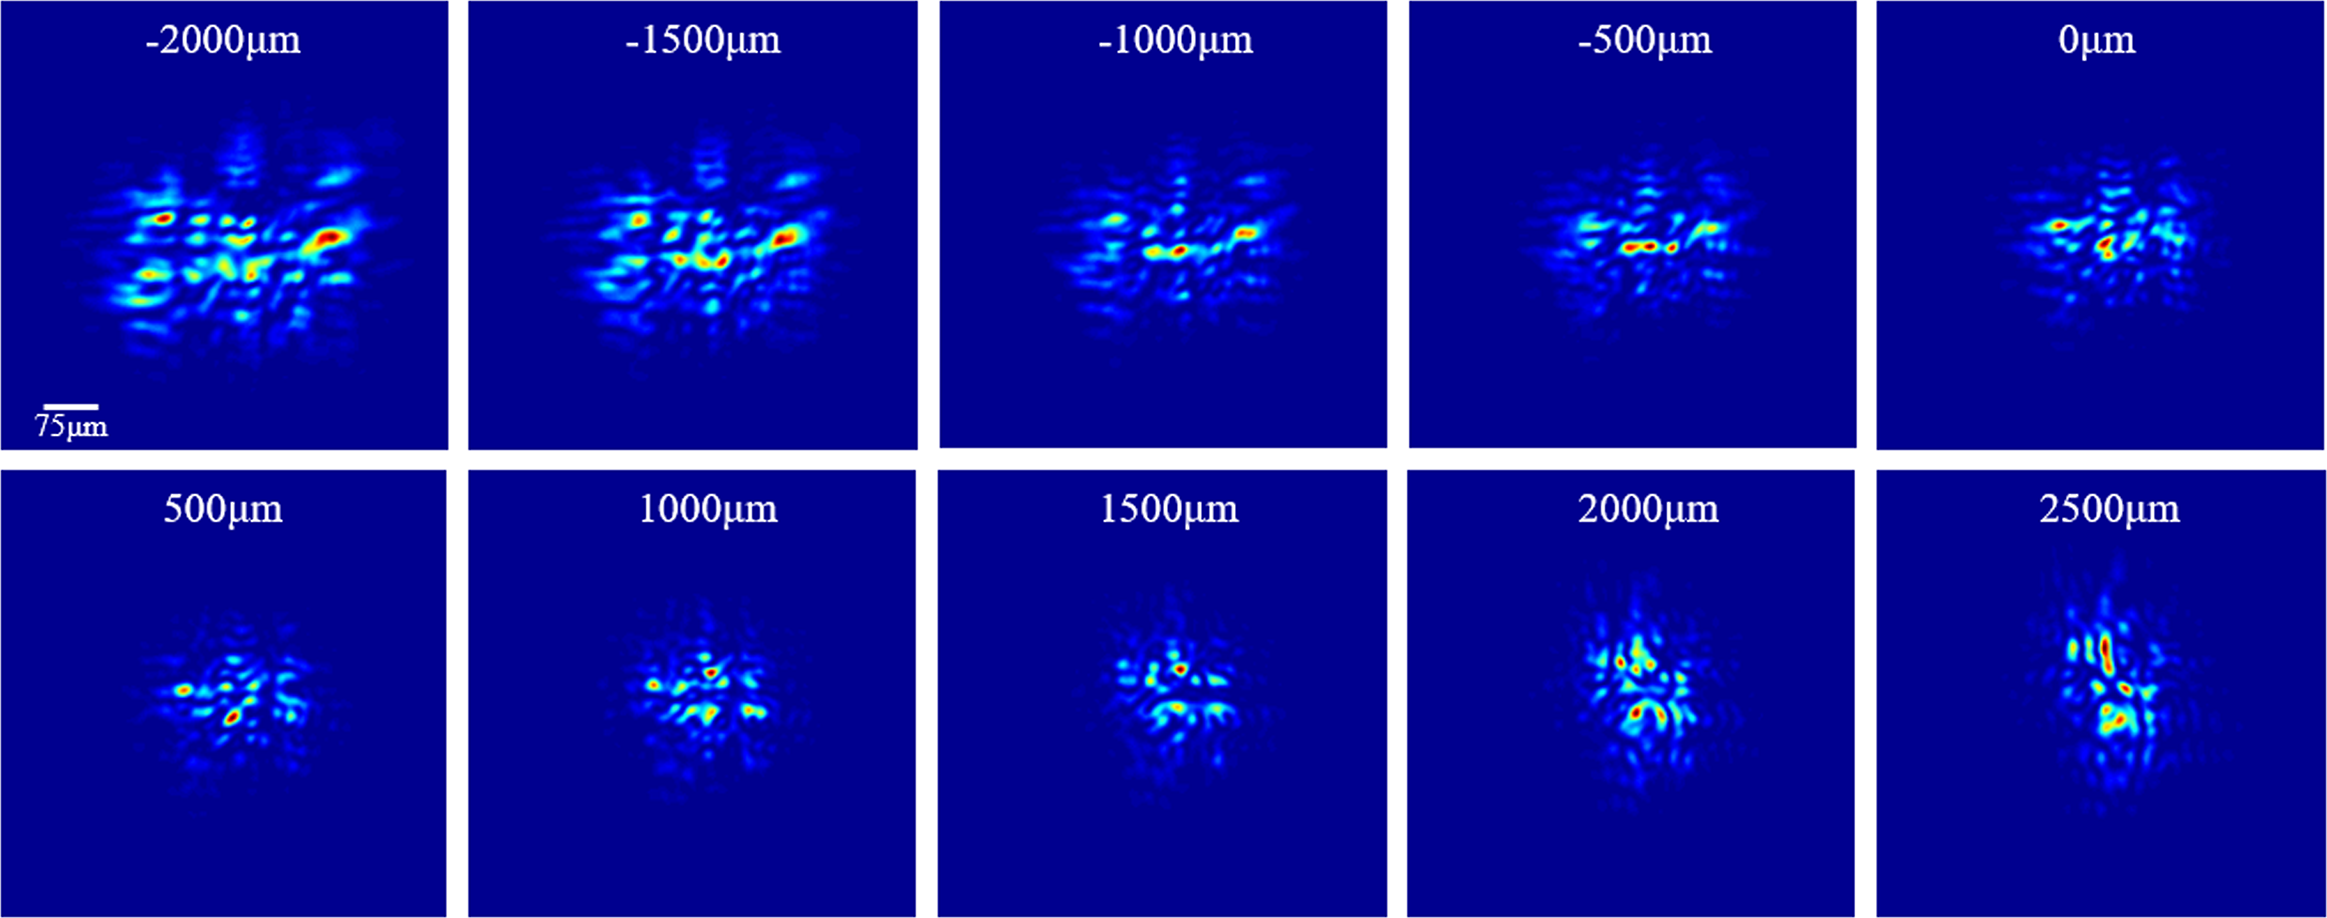
The traditional far-field direct imaging method, which is shown in Figure 2(a), uses CCD3 to image the focal spot of a certain plane and obtain the intensity distribution at that plane. The focal spot of a high-energy laser exhibits a complex distribution of side lobes, exerting substantial influence on physical experiments. However, measuring the focal spot of a pulsed laser with a high dynamic range in a single exposure is challenging due to the limited dynamic range of CCD cameras. By employing the proposed MCMI method, the reconstructed complex amplitude can be numerically propagated near the focal plane, enabling observation of the focal spot’s evolution. The propagation algorithm we used is based on the Fresnel diffraction integral formula shown in step (2) of the MCMI algorithm. Figure 9 illustrates the focal-spot intensity at various distances along the focal plane, revealing a rich distribution of focal side lobes and demonstrating a high dynamic range.
Computational evolution of the focal spot in proximity to the focal plane. These images were obtained through the computational propagation of the reconstructed complex amplitude along the optical axis. These images share the same scale bar.
The reliability of the proposed method was further corroborated by increasing the output laser energy and adjusting the pulse width. The computed measurement results of a high-power laser of energy 8558 J and pulse width 5 ns are displayed in Figure 10. By utilizing the intensity patterns captured by CCD1 and CCD2, as illustrated in Figures 10(a) and 10(b), the complex amplitude was successfully reconstructed. Figure 10(c) illustrates the reconstructed intensity profile on the RPP plane, while Figure 10(d) displays the reconstructed phase distribution on the same plane. Figure 10(e) presents the calculated near-field wavefront, including static aberrations.
Computational measurement of a high-power laser of energy 8558 J and pulse width of 5 ns. (a) Intensity pattern recorded by CCD1. (b) Intensity pattern recorded by CCD2. (c) Retrieved intensity on the RPP plane. (d) Retrieved phase on the RPP plane. (e) Calculated near-field wavefront including static aberrations.
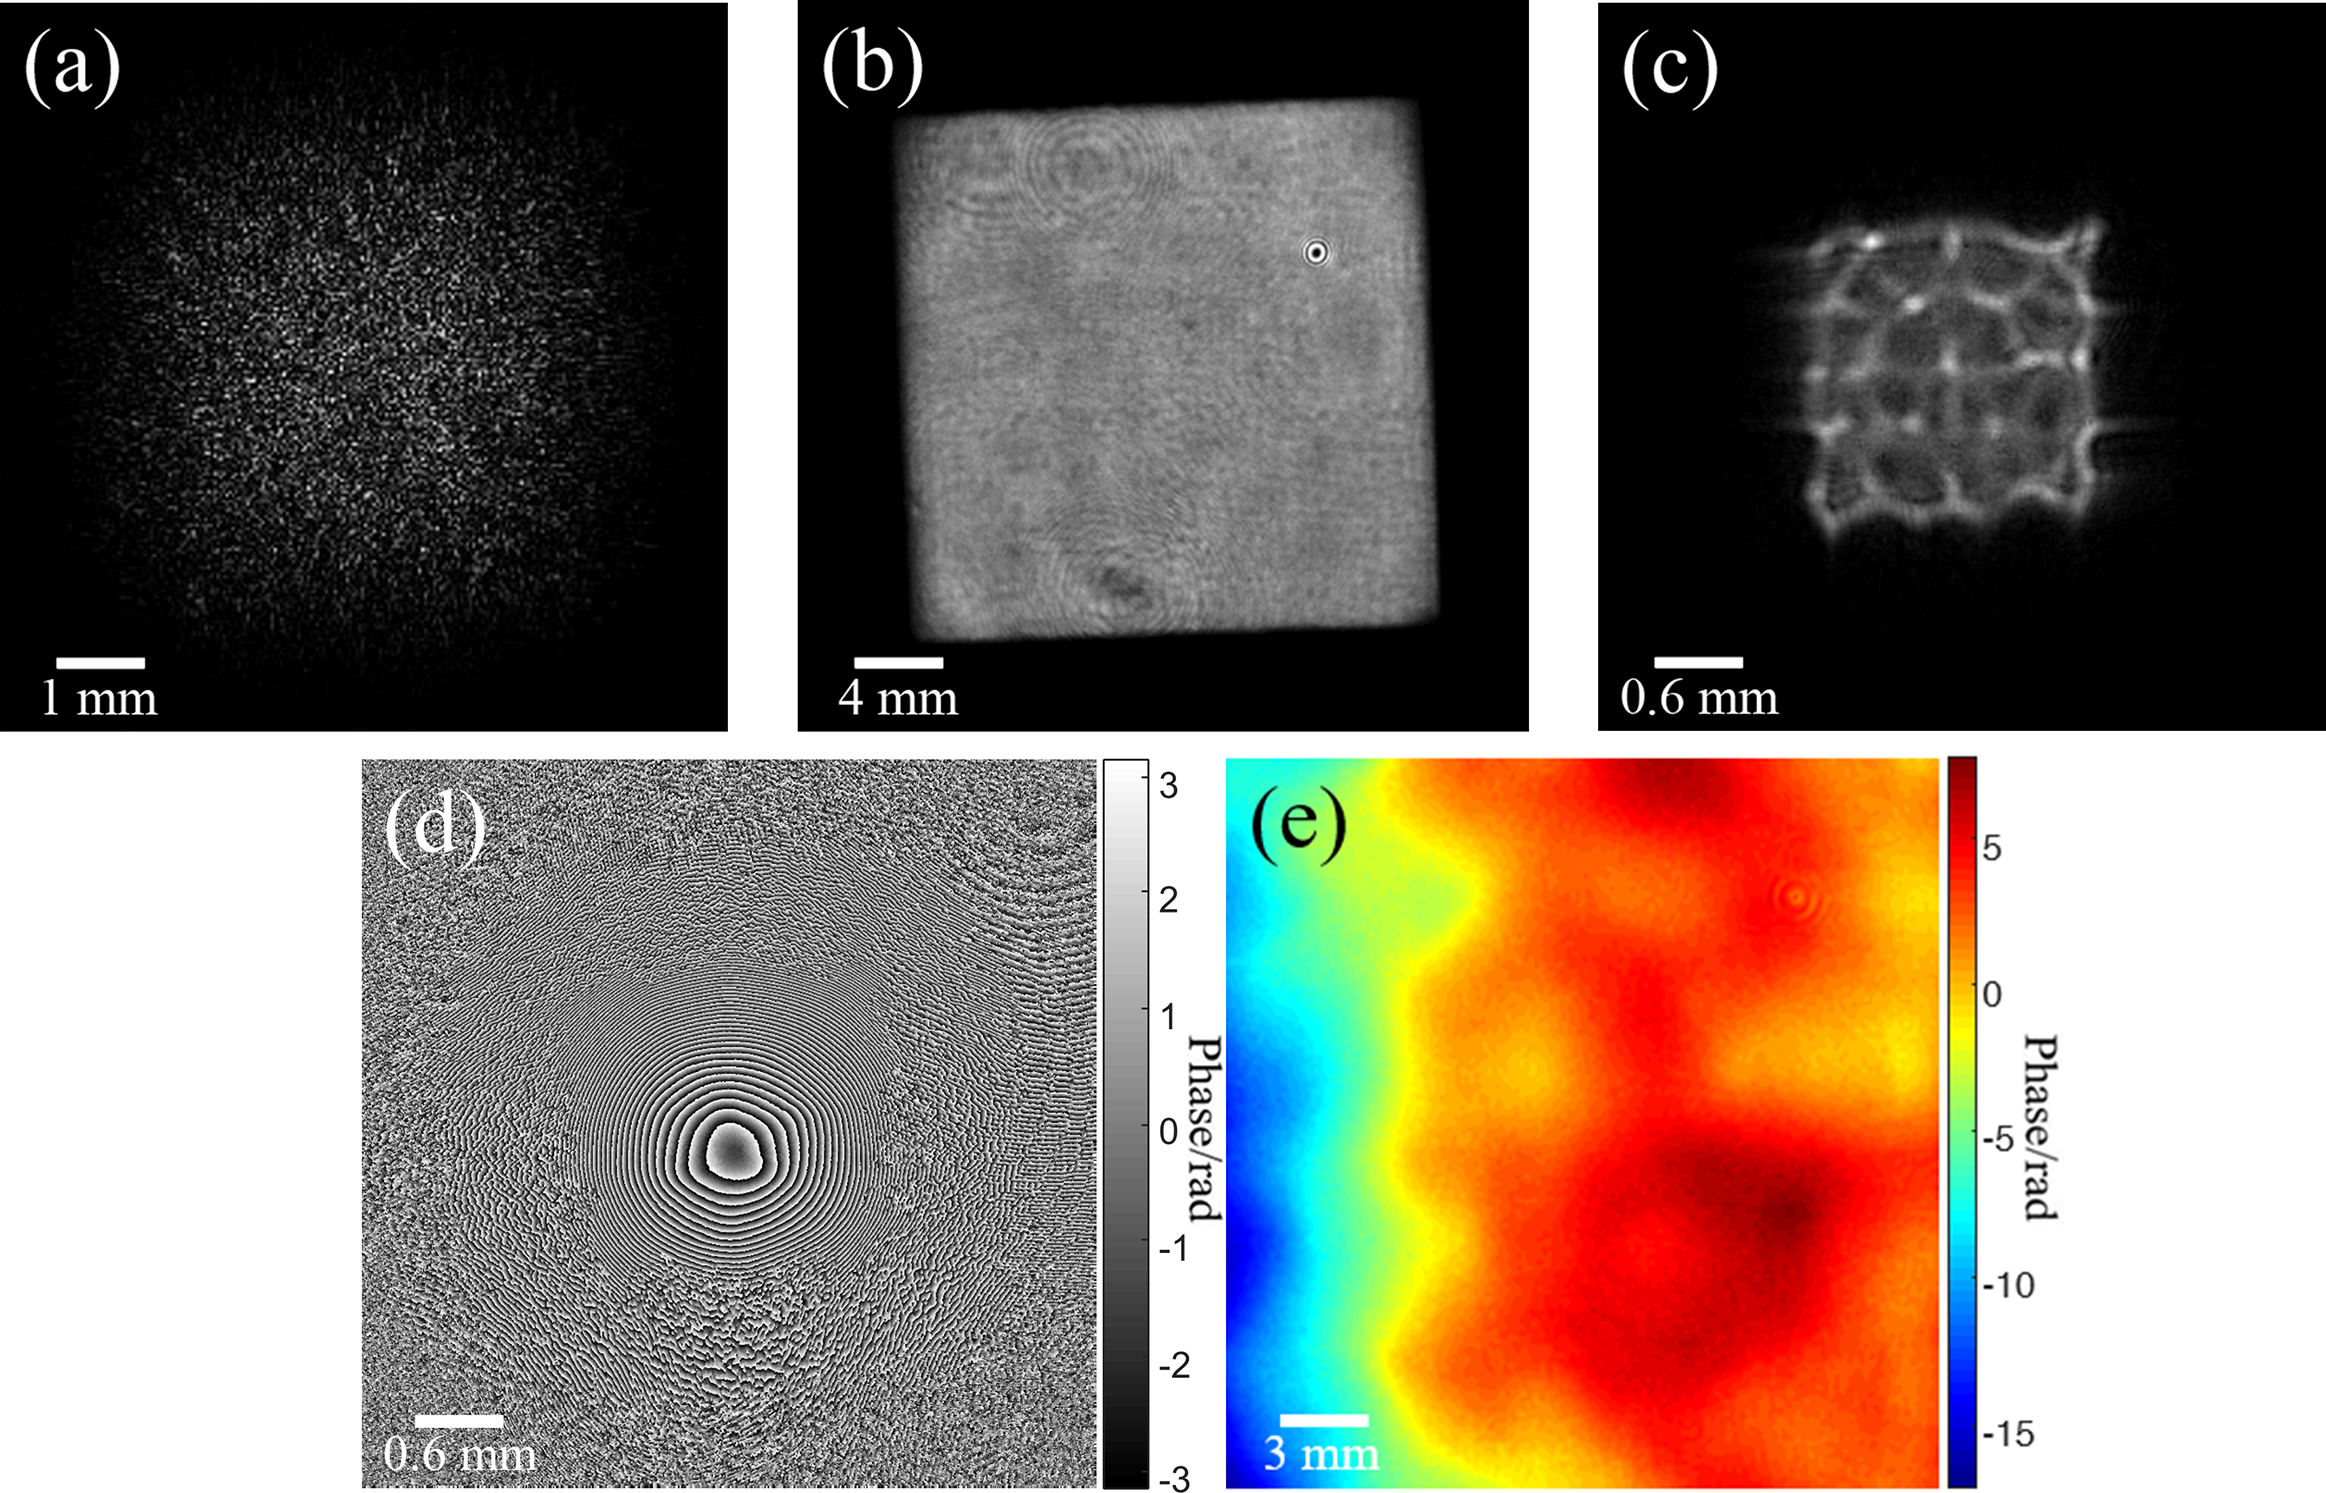
Figure 11 shows a comparison of measurement results for the laser of energy 8558 J and pulse width 5 ns. Figure 11(a) presents the near-field intensity reconstructed using the MCMI method, while Figure 11(e) displays the near-field intensity directly imaged by CCD4. The near-field F factors for these two methods are 0.723 and 0.702, respectively, as calculated using mathematical analysis. Figure 11(b) shows the actual high-energy near-field wavefront obtained by subtracting the static aberrations in Figure 5(f) from the calculated near-field wavefront in Figure 10(e), where the PV value is 10.55 rad (1.68λ) and the RMS value is 1.63 rad (0.26λ). Figure 11(f) depicts the near-field wavefront as measured by the Shack–Hartmann sensor. The PV value is 11.30 rad (1.80λ) and the RMS value is 2.01 rad (0.32λ). The phase modulation resulting from wavefront defects is evident in the computational measurement results. The MCMI method reconstructs the focal spot with the maximum gray value of 4.632 × 10⁶, as depicted in Figure 11(c). The calculated dynamic range is 167 dB. Figure 11(g) displays the focal spot with the maximum gray value of 2.145 × 10³, as measured by direct imaging, and the calculated dynamic range is 66 dB. It is apparent from Figure 11(c) that the focal-spot distribution appears more accurate and detailed due to the significantly larger dynamic range achieved by the computational method. Figure 11(d) depicts the encircled energy of the far-field focal spot featured in Figure 11(c). Similarly, Figure 11(h) illustrates the encircled energy of the far-field focal spot displayed in Figure 11(g). Upon comparing the diffraction limit multiples corresponding to the 80% or 95% encircled energy between Figures 11(d) and 11(h), it has been discovered that the focal spot determined by the computational method exhibits superior energy concentration, attributed to the large dynamic range of the proposed method.
Comparison measurement results for a high-power laser of energy 8558 J and pulse width 5 ns. (a) Near-field intensity calculated using MCMI. (b) Near-field phase calculated using MCMI. (c) Far-field focal spot calculated using the MCMI method. (d) Encircled energy corresponding to the focal spot shown in (c). (e) Near-field intensity directly measured and captured by CCD4. (f) Near-field phase directly recorded by a Shack–Hartmann wavefront sensor. (g) Far-field intensity directly measured and captured by CCD3. (h) Encircled energy corresponding to the focal spot shown in (g).
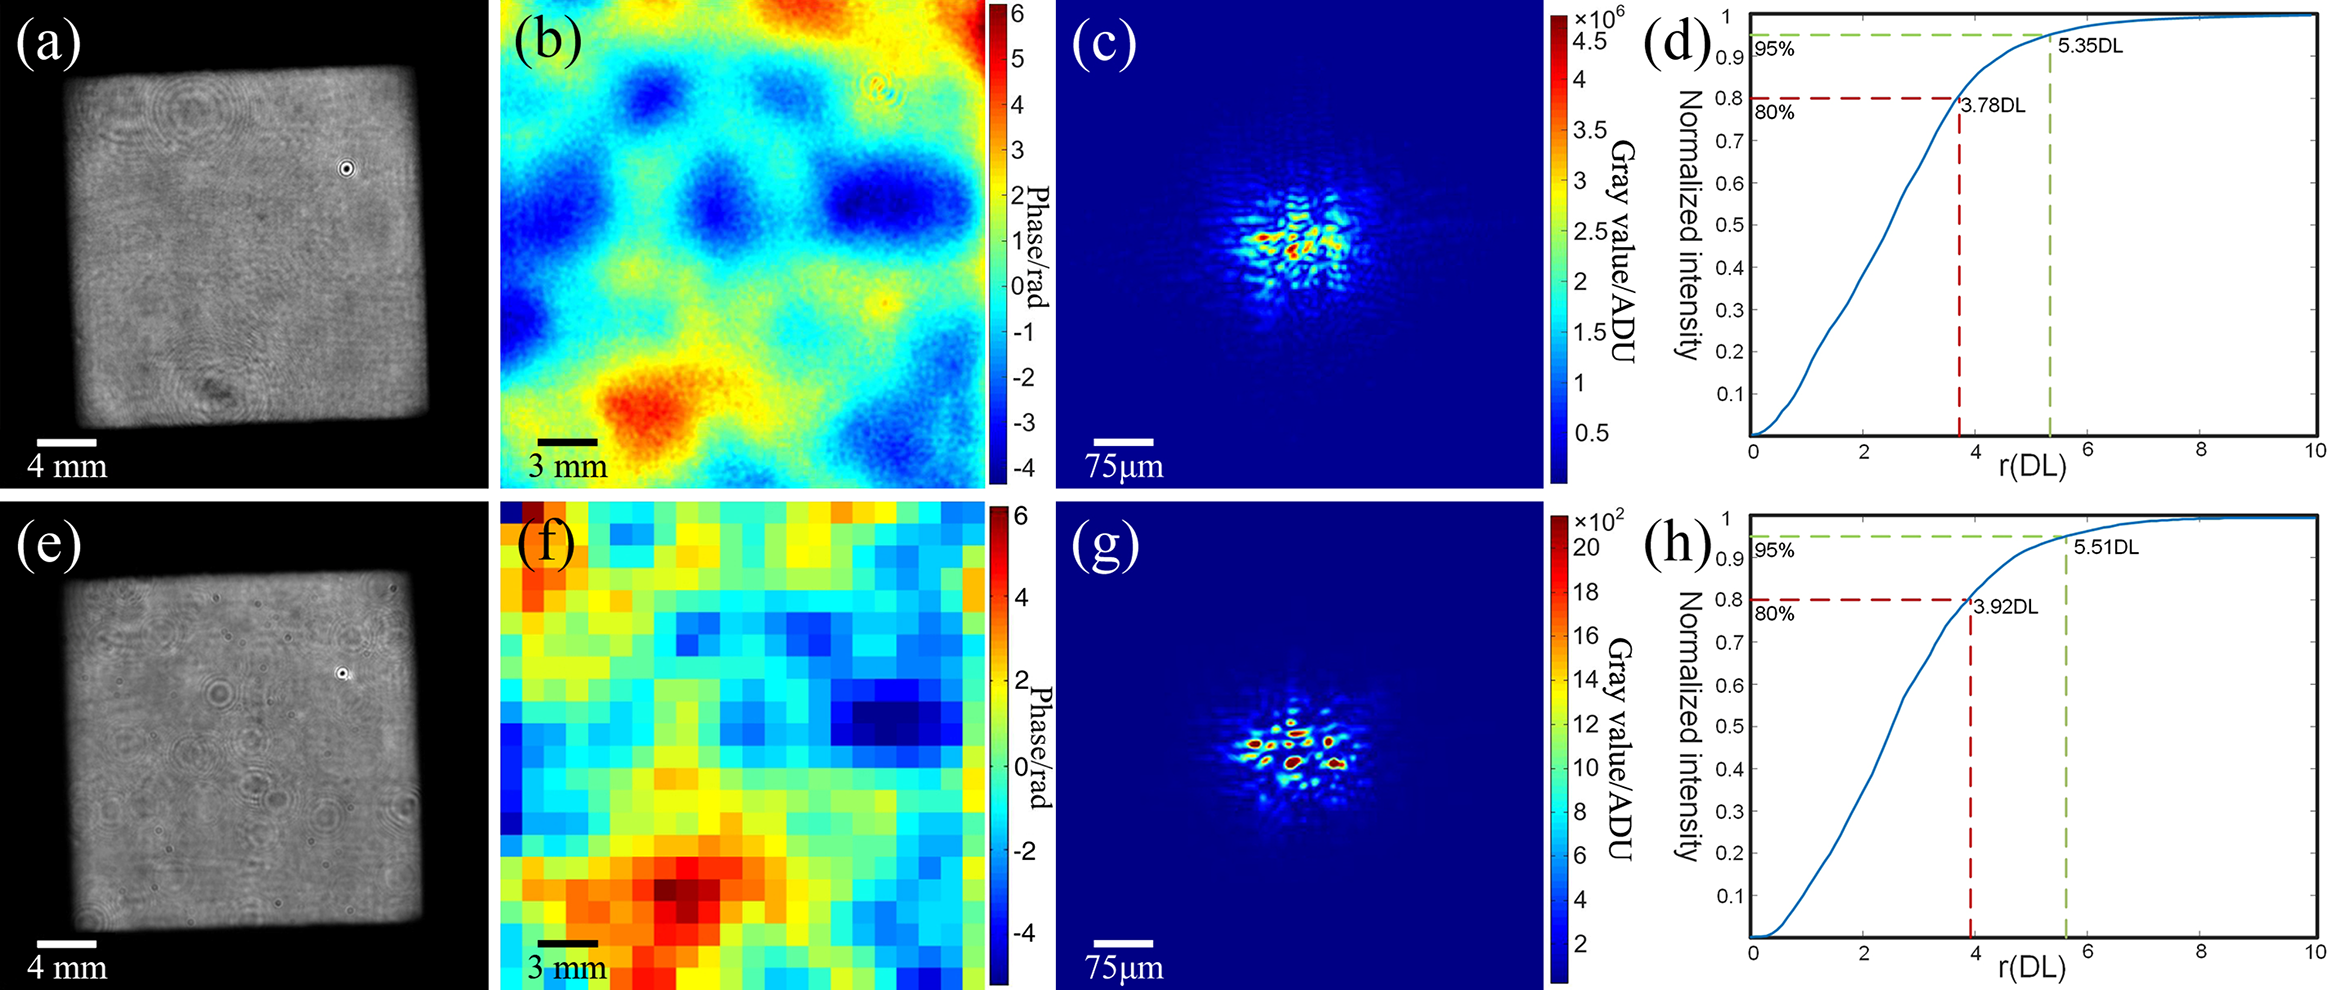
Figure 12 also shows the focal-spot intensity at different positions along the focal plane. A high dynamic range of the focal side lobes is displayed, which can aid in the analysis of laser–matter interaction in ICF experiments.
Computational evolution of the focal spot in proximity to the focal plane. These images were obtained through the computational propagation of the reconstructed complex amplitude along the optical axis. These images share the same scale bar.
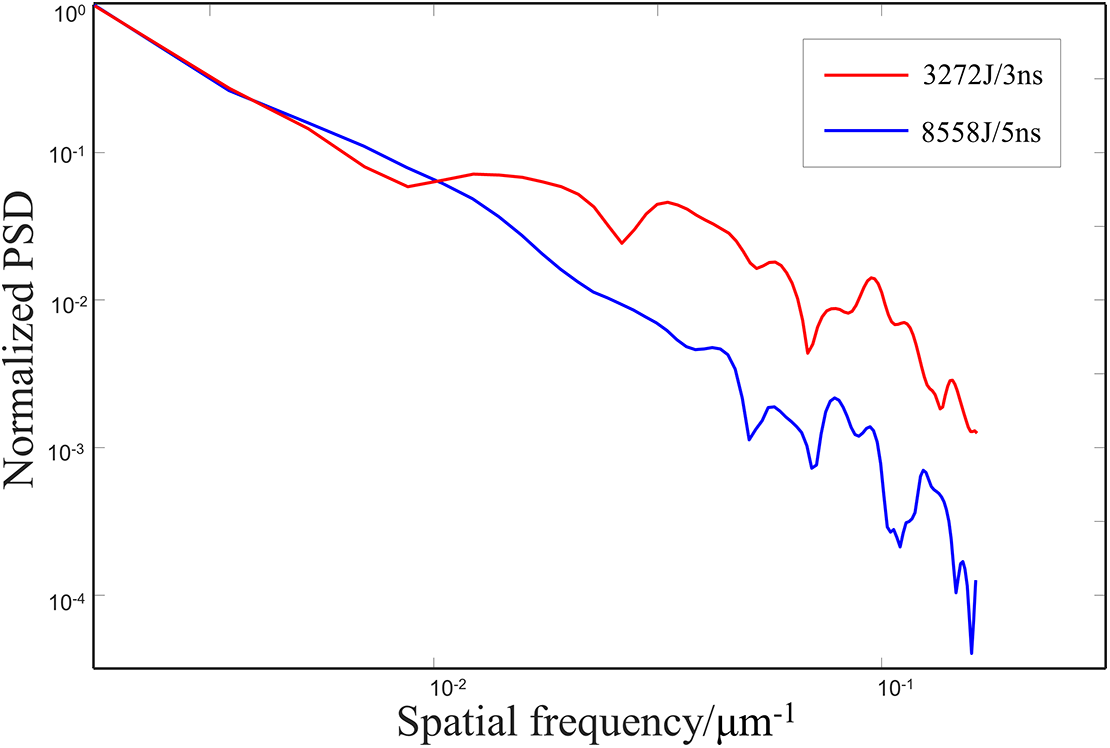
The calculation of spatial power spectral density (PSD) involves the transformation between the spatial domain and frequency domain of the far-field focal spot. The PSD can be calculated as $\mathrm{PSD}\left({f}_x,{f}_y\right)=\mathcal{F}\left\{{I}_\mathrm{ff}\left(x,y\right)\right\}/{S}_\mathrm{frequency}$
, where
$\mathrm{PSD}\left({f}_x,{f}_y\right)=\mathcal{F}\left\{{I}_\mathrm{ff}\left(x,y\right)\right\}/{S}_\mathrm{frequency}$
, where ${I}_\mathrm{ff}\left(x,y\right)$
represents the focal-spot intensity,
${I}_\mathrm{ff}\left(x,y\right)$
represents the focal-spot intensity, ${S}_\mathrm{frequency}$
denotes the calculation area in the frequency domain and
${S}_\mathrm{frequency}$
denotes the calculation area in the frequency domain and $\left({f}_x,{f}_y\right)$
are the coordinates in the frequency domain[
Reference Ginzburg, Kochetkov, Potemkin and Khazanov35–
Reference Bleotu, Wheeler, Mironov, Ginzburg, Masruri, Naziru, Secareanu, Ursescu, Perez, De Sousa, Badarau, Veuillot, Audebert, Khazanov and Mourou37]. Figure 13 shows the spatial frequency analysis on the focus with a defocus amount of 0 μm for the above two shots with different energy levels. The results show that the proportion of the focal spot in the mid-frequency range of 10–100 μm is relatively lower in the 8558 J/5 ns shot. We attribute this to the relatively uniform spatial intensity distribution of the focal spot in this shot.
$\left({f}_x,{f}_y\right)$
are the coordinates in the frequency domain[
Reference Ginzburg, Kochetkov, Potemkin and Khazanov35–
Reference Bleotu, Wheeler, Mironov, Ginzburg, Masruri, Naziru, Secareanu, Ursescu, Perez, De Sousa, Badarau, Veuillot, Audebert, Khazanov and Mourou37]. Figure 13 shows the spatial frequency analysis on the focus with a defocus amount of 0 μm for the above two shots with different energy levels. The results show that the proportion of the focal spot in the mid-frequency range of 10–100 μm is relatively lower in the 8558 J/5 ns shot. We attribute this to the relatively uniform spatial intensity distribution of the focal spot in this shot.
PSD curves of focal spots from the above two experimental shots.
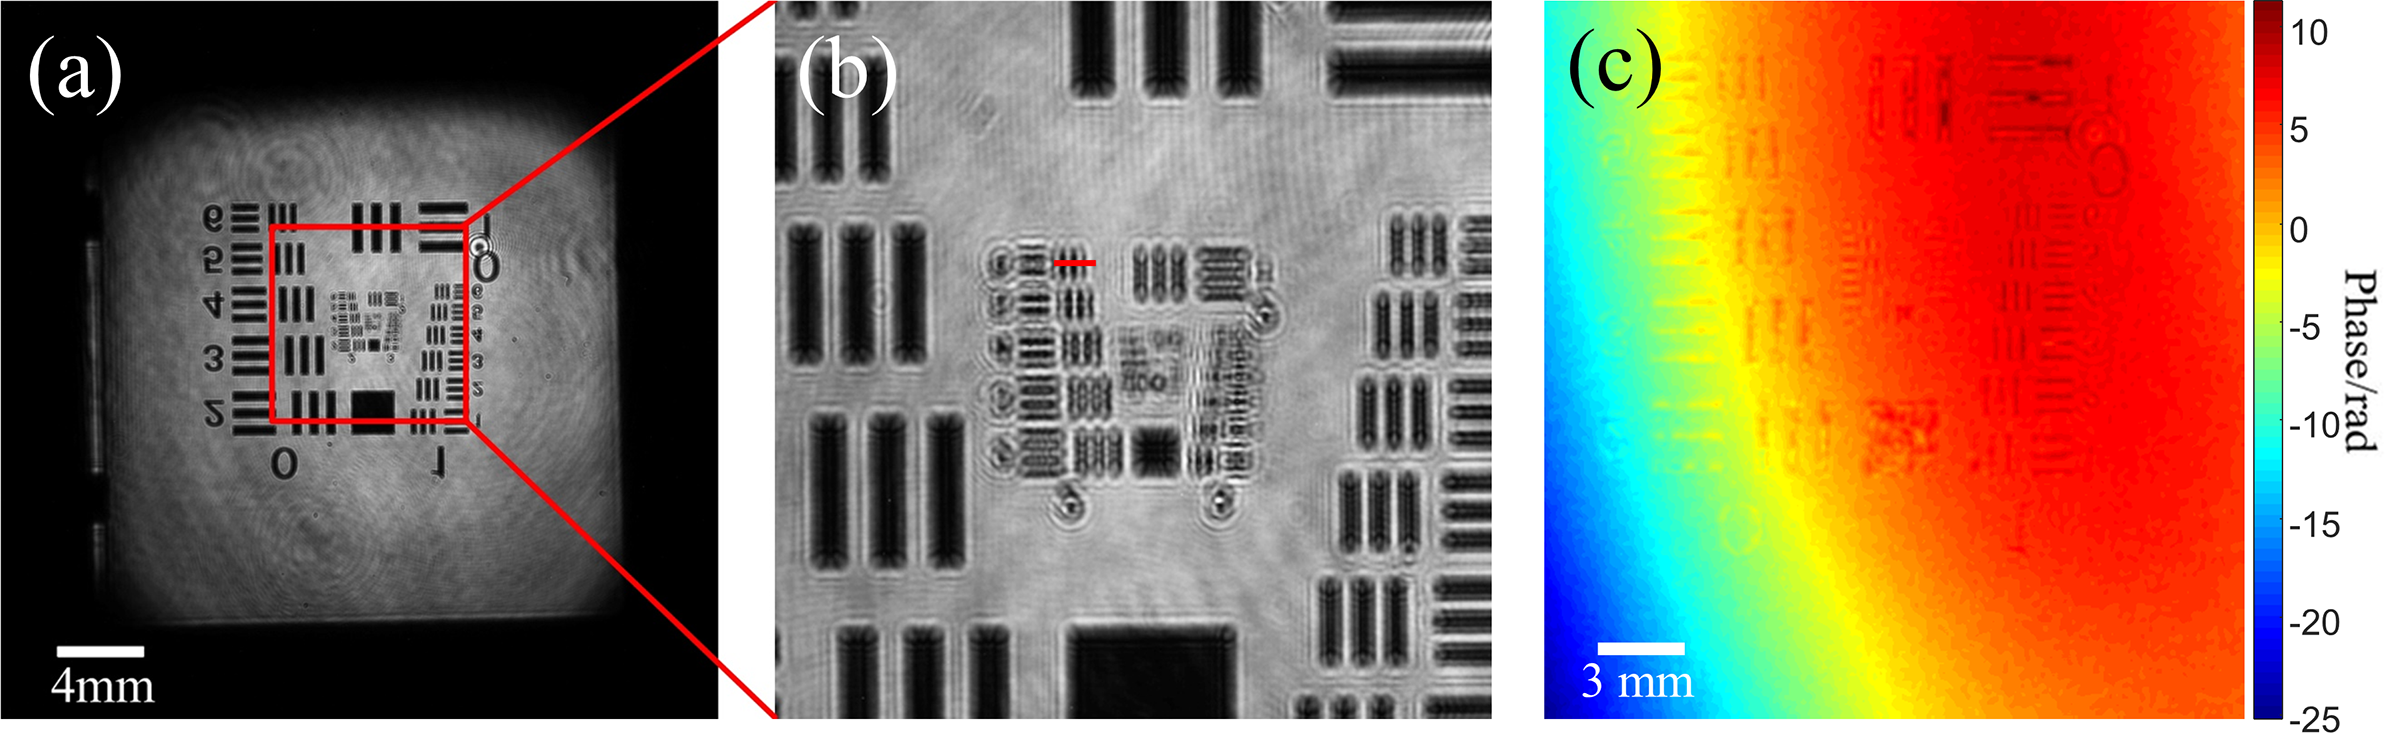
To assess the spatial resolution of the computational measurement for both near-field intensity and wavefront, we placed a USAF 1951 target on the imaging plane. Figure 14 displays the reconstruction results for the intensity and wavefront, which were obtained using an offline point laser source for illumination. Figure 14(a) depicts the reconstructed near-field intensity, while Figure 14(b) presents magnified images highlighted in Figure 14(a). In addition, Figure 14(c) showcases the reconstructed near-field wavefront corresponding to the laser beam displayed in Figure 14(a). By examining Figure 14(b), it is feasible to ascertain that the achieved resolution is approximately 70.15 μm (Group 2, Element 6). Considering the reduction of the beam aperture from 310 mm × 310 mm to 23.5 mm × 23.5 mm on the near-field imaging plane, the reduction ratio can be calculated as $310\;\mathrm{mm}/23.5\;\mathrm{mm}=13.19$
. For the high-power laser beam with a diameter of 310 mm across the full field, the separated resolved points can be obtained by
$310\;\mathrm{mm}/23.5\;\mathrm{mm}=13.19$
. For the high-power laser beam with a diameter of 310 mm across the full field, the separated resolved points can be obtained by $70.15\;\mu \mathrm{m}\times 13.19=925.28\;\mu \mathrm{m}$
. Using the data measured by the Shack–Hartmann sensor in these experiments, which correspond to the 22×22 array point data of the wavefront for a laser beam with a 310 mm diameter, it is possible to estimate the spatial resolution of the near-field wavefront as
$70.15\;\mu \mathrm{m}\times 13.19=925.28\;\mu \mathrm{m}$
. Using the data measured by the Shack–Hartmann sensor in these experiments, which correspond to the 22×22 array point data of the wavefront for a laser beam with a 310 mm diameter, it is possible to estimate the spatial resolution of the near-field wavefront as $310\;\mathrm{mm}/22=14.09\;\mathrm{mm}$
. When compared to the measurement results obtained with the Shack–Hartmann sensor, the spatial resolution of the near-field wavefront measurement is notably improved when utilizing the computational MCMI method.
$310\;\mathrm{mm}/22=14.09\;\mathrm{mm}$
. When compared to the measurement results obtained with the Shack–Hartmann sensor, the spatial resolution of the near-field wavefront measurement is notably improved when utilizing the computational MCMI method.
Near-field (intensity and wavefront) spatial resolution. (a) Reconstructed near-field intensity using MCMI. (b) Magnified image emphasized in (a). (c) Reconstructed near-field wavefront using MCMI.
4 Conclusion
In conclusion, we have introduced a computational approach for measuring near-field and far-field parameters of high-power lasers using the MCMI method across various output energy experiments. The near-field and focal-spot distributions were simultaneously calculated by reconstructing the complex amplitude. More importantly, by computing the complex amplitude, we can calculate the near-field wavefront and focal-spot distributions at different planes. During high-power pulsed laser experiments, a notable dynamic range of 176 dB was achieved for the characterization of the far-field focal spot. In addition, the spatial resolution of the wavefront measurement was considerably improved when compared to that of a Shack–Hartmann wavefront sensor. Accurate computational measurements of high-power laser parameters can substantially boost the overall performance of high-power laser facilities and enable more precise laser diagnostics in physical experiments. The proposed method simply involves recording two patterns using two CCDs, which feature a straightforward structure. By employing MCMI algorithms, it obtains the near-field (intensity and wavefront/phase) and far-field (focal-spot) distributions of the laser beam. It is also suitable for parameter measurement of ultra-short femtosecond high-power lasers.
Acknowledgements
This work was supported by the Project of the Ministry of Industry and Information Technology (Grant No. TC220H05L), the National Natural Science Foundation of China (NSFC) (Grant Nos. 61905261, 61827816 and 11875308), the Shanghai Sailing Program (Grant No. 18YF1426600) and the Strategic Priority Research Program of the Chinese Academy of Sciences (Grant No. XDA25020306).


 Open access