


Coeliac disease (CD), a chronic autoimmune enteropathy affecting approximately 1 % of the population worldwide, requires lifelong adherence to the gluten-free diet (GFD)(Reference Green and Cellier1). However, achieving a nutritionally balanced GFD is challenging. Commercial gluten-free (GF) products often contain higher added sugars and fats and lower fibre and micronutrients (e.g. folate and iron) compared with their gluten-containing counterparts(Reference Miranda, Lasa and Bustamante2). Children with CD show poor dietary quality (DQ), with over 50 % of energy intake from processed GF foods, increasing risks of micronutrient deficiencies and cardiometabolic dysregulation(Reference Nestares, Martín-Masot and Flor-Alemany3,Reference Anafy, Cohen and Ben Tov4) .
Effective nutritional management of CD requires strong nutrition literacy (NL) to identify healthy GF alternatives that support growth and development. While parents of children with CD demonstrate high NL(Reference Cyrkot, Gidrewicz and Anders5), the NL level remains unknown for children with CD. One study suggests adolescents with CD lack awareness of nutritious GF options, potentially influencing their dietary choices(Reference Pohoreski, Horwitz and Gidrewicz6). Limited access to registered dietitians (RD) may exacerbate this issue, leaving families with children with CD to rely on inconsistent and inaccurate online nutrition information(Reference Buseck, Lebwohl and Green7). The absence of evidence-based paediatric GFD guidelines further complicates informed GF food choices and may lead to unnecessary dietary restrictions and reduced DQ(Reference Mager, Cyrkot and Lirette8).
Nutrition education is a well-established strategy for promoting healthy eating, but studies in paediatric CD populations are limited and show inconsistent results. Multiple RD-led interventions have shown promise in the literature to improve DQ in youth on the GFD(Reference Suárez-González, Bousoño García and Jiménez Treviño9,Reference Perez-Junkera, Simón and Calvo10) . However, these approaches are resource-intensive and might be challenging to scale in clinical settings. Moreover, many existing nutrition education interventions in CD focus primarily on gluten avoidance due to limited access to RD, which may reduce the emphasis on the specific nutritional needs of the child(Reference Suárez-González, Bousoño García and Jiménez Treviño9,Reference Isaac, Wu and Mager11) .
This study evaluated the impact of dietary counselling using a newly developed Gluten-Free Food Guide (GFFG) on DQ and processed/ultra-processed food (UPF) intake in children newly diagnosed with CD. Secondary objectives included evaluating the potential associations of GFFG education with dietary adherence to the GFD, GFFG plate recommendations, Mediterranean diet (MD) pattern, dietary inflammation, parent NL and health-related quality of life. The primary hypothesis was that GFFG-based education, combined with standard of care diet counselling, would significantly improve children’s DQ and reduce processed/UPF intake compared with standard of care alone over 6 months.
Methods
Study population and design
This pilot, open-label, parallel-group randomised controlled trial was conducted between September 2021 and December 2023. Forty newly diagnosed children/youth (4–18 years) with CD and their parents were recruited from two Pediatric Gastroenterology clinics: Stollery Children’s Hospital (Edmonton, Alberta), Alberta Children’s Hospital (South Health Campus, Calgary, Alberta) and social media. Inclusion criteria included a clinical CD diagnosis (≤ 6 months) confirmed by biopsy and/or serological testing(Reference Mearin, Agardh and Antunes12). Exclusion criteria included a CD diagnosis exceeding 6 months, additional diagnosis (e.g. type 1 diabetes) or multiple food allergies. Eligible child–parent groups were randomly assigned to the control (CON: standard of care; n 20) or the intervention (INT: standard of care + GFFG teaching; n 20) group using randomizer.org.
The study collected data at three time points (baseline (BL), 3 months and 6 months) for both INT and CON groups through Zoom or phone calls (online Supplementary Figure 1). Before enrolment, all participants received a virtual standard of care dietary education session from RD within 1 month of their CD diagnosis. These sessions involve 2–3 families and cover topics of gluten identification (e.g. label reading and cross-contamination), meal planning and dietary guidance based on the Canada Food Guide (CFG) 2019 (online Supplementary Table 1). After study randomisation, INT participants received an additional virtual GFFG education session from trained research personnel at BL. The CON group did not receive GFFG education or additional dietary counselling during the study but were offered this using the GFFG at the end of the study (6 months) for equal access. At 6 months, all participants also completed a semi-structured exit interview to collect participants’ and their caregivers’ feedback on the GFFG (e.g. uncovered topics and future use).
Ethical statement
This study was conducted according to the guidelines laid down in the Declaration of Helsinki. All procedures involving research participants were approved by the University of Alberta (Pro00111071) and the University of Calgary (REB21-1116) Human Research Ethics Board. Written informed consent/assent was obtained from participants and their caregivers. The study was registered with ClinicalTrials.gov (NCT06038344). De-identified data were securely stored in encrypted REDCap® electronic databases(Reference Harris, Taylor and Thielke13).
Gluten-Free Food Guide dietary education session
The nutrition education intervention was based on an evidence-based paediatric GFFG(Reference Mager14). This resource includes a visual GF plate model and twenty-two educational materials to support children with CD in meeting their nutritional needs and navigating food environments (e.g. school and travel) (online Supplementary Figure 2)(Reference Mager14). The GF plate model recommends a diet consisting of > 50 % fruits and vegetables (F&V), 25 % protein and < 25 % GF grains(Reference Mager, Cyrkot and Lirette8). The protein group comprises plant-based (e.g. legumes) and animal (e.g. meat and dairy products)-based proteins(Reference Mager, Cyrkot and Lirette8). A strong emphasis is placed on consuming fortified (vitamin D and calcium) unsweetened cows’ milk or plant-based beverages as the primary beverage choice at mealtimes(Reference Mager, Cyrkot and Lirette8). This recommendation aims to address potential nutritional imbalances (protein, vitamin D and and calcium) that children with CD typically face when consuming GFD(Reference Mager, Cyrkot and Lirette8).
The GFFG education session, lasting 45–60 min, reflected the duration of standard clinical dietary education for newly diagnosed children with CD and provided instruction on the plate model and key nutritional considerations of the GFD. Trained study personnel (ZQ. J) provided individualised dietary counselling based on children’s 3-d food record and a review of two GFFG teaching materials to address individual nutritional concerns and adherence to GFFG recommendations. Children and parents completed a post-session questionnaire to assess knowledge retention.
Anthropometric, sociodemographic and clinical data
Anthropometric (weight/height z-scores), sociodemographic (sex, CD diagnosis age, CD duration, parent (education, ethnicity)), household characteristics (number of children (CD), number in households consuming the GFD and household income) and gastrointestinal (GI) symptoms were collected via parent self-report at BL and 6 months and verified against electronic medical record(Reference Mager, Marcon and Brill15). Clinical data (anti-tissue transglutaminase (ATTG) level) were retrieved from the medical record at BL and 6 months(Reference Mager, Marcon and Brill15).
Dietary intake
Dietary intake was assessed at BL and 6 months using a 3-d food record (2 weekdays/1 weekend day) and at 3 months using a 24-h food recall (weekday) with the multi-pass technique(Reference Gibson16,Reference Mager, Liu and Marcon17) . Recalls have been well established in assessing intake in children with CD, offering similar variability to 3–7 d food record and to reduce respondent burden(Reference Cyrkot, Gidrewicz and Anders5,Reference Alzaben, Turner and Shirton18) . To ensure portion size measurement accuracy, participants received an additional visual guide on portion/serving sizes(19). A trained researcher also reviewed the food record with families during collection to reduce omissions/errors in food identification and portion estimation. Brand names of commercial GF products were recorded. To account for potential under-/overreporting of food intake, the ratio of energy intake to estimated BMR was calculated. Values below or above than the 95th CI were considered under-/overreporting of intake(Reference Black20,Reference Livingstone, Robson and Black21) .
Primary outcome variables
Diet quality (Healthy Eating Index-Canadian)
DQ was assessed using the Healthy Eating Index-Canadian (HEI-C)(Reference Woodruff and Hanning22). The HEI-C evaluates DQ from three perspectives: dietary adequacy, moderation and variety(Reference Woodruff and Hanning22). Dietary adequacy was determined by comparing the number of servings of F&V, grains, dairy products, and meat and alternatives consumed to age- and sex-specific Alberta Nutrition Guidelines for Children and Youth recommendations(23,Reference Katamay, Esslinger and Vigneault24) . Moderation was assessed based on cholesterol, total fat, saturated fat and ‘other’ foods (dessert, snacks, sugary beverages and condiments (butter/oil, salad dressing)) intake(Reference Woodruff and Hanning22). Variety was assessed based on consuming at least one serving from each major food group: F&V, grains, dairy products, and meat and alternatives(Reference Woodruff and Hanning22). Total HEI-C scores classified DQ as good (> 80), needs improvement (51–80) or poor (< 50)(Reference Woodruff and Hanning22). Food group servings were calculated based on the 2007 CFG, as described previously(Reference Katamay, Esslinger and Vigneault24).
Quantification of processed/ultra-processed food intake and NOVA classification
The level of processed/UPF intake was determined using the validated NOVA classification system(Reference Monteiro, Cannon and Levy25). Foods were grouped into four NOVA categories: NOVA 1 (unprocessed/minimally processed), NOVA 2 (processed culinary ingredients), NOVA 3 (processed foods; e.g. canned F&V) and NOVA 4 (UPF)(Reference Monteiro, Cannon and Levy25). Most commercial GF bakery products fall into NOVA 4 due to industrial food additives (e.g. stabilisers and preservatives). The energy contribution of the four NOVA categories to food intake was calculated by adding the total energy intake of foods consumed in each NOVA category and expressing this as a percentage (%) of total energy.
Secondary outcome variables
Adherence to Gluten-Free Food Guide plate recommendations
To assess adherence to the GFFG plate recommendations, the proportion of each food group (F&V, grains, dairy products, meat and alternatives, and ‘other’) represented on a single GFFG plate model was calculated using the formula: (food group servings/total servings) × 100. These proportions were then compared with the recommended GFFG plate proportions for each food group: F&V > 50 % of total intake, protein 25 % and GF grains < 25 %(Reference Mager, Cyrkot and Lirette8). The protein component includes both plant and animal protein on the plate, along with unsweetened milk or plant-based beverages beside the plate. Adherence to consuming unsweetened milk or plant beverages as the primary mealtime beverage was assessed using a binary (yes/no) response.
Macronutrient and micronutrient intake
Energy and nutrient intake (macro- and micronutrient content) were analysed using dietary software (Food Processor® ESHA Research 2019; version 11.7.217), referencing the Canadian Nutrient File and manufacturer labels(26). Nutrient intakes were compared with Health Canada’s age- and sex-specific dietary reference intakes (DRI), which included acceptable macronutrient distribution range (AMDR), estimated average requirement (EAR), recommeded dietary allowance (RDA) and adequate intake (AI)(26). Saturated fat intake was assessed against the WHO recommendation of ≤ 10 % of daily energy(27).
Mediterranean diet and inflammation diet quality scores
Two additional validated DQ tools were used: (1) Mediterranean Diet Quality Index in Children and Adolescents Scores 2.0 (KIDMED 2.0) and (2) Children-Diet Inflammatory Index Score (C-DIITM). KIDMED 2.0, adapted as described previously, assesses twelve dietary components reflecting higher adherence to MD (e.g. F&V and legumes) and four reflecting lower adherence to MD (e.g. processed and fast food)(Reference López-Gajardo, Leo and Sánchez-Miguel28). Scores of ≥ 8 indicated a ‘good’, 4–7 indicated ‘average’ and ≤ 3 indicated ‘poor’ adherence(Reference López-Gajardo, Leo and Sánchez-Miguel28). The paediatric C-DII includes twenty-four nutrients (excluding alcohol) and is adjusted per 1000 kcal(Reference Khan, Wirth and Ortaglia29). Negative scores indicate an anti-inflammatory diet; positive scores reflect a pro-inflammatory diet(Reference Khan, Wirth and Ortaglia29).
Adherence to the gluten-free diet and health-related quality of life
Adherence to the GFD was assessed through self-report (validated CD-specific KINDL questionnaire®) and dietary gluten intake calculated using the Osborne method (safe threshold: < 10 mg/d)(Reference Assor, Davies-Shaw and Marcon30,Reference Bellini, Zanchi and Martelossi31) . KINDL® questionnaires evaluate factors influencing children’s health-related quality of life, including psychosocial well-being and social impact of the GFD (seven questions), adherence to GFD (one question) and repetition of the ATTG test and uncertified GF foods intake (two questions)(Reference Bellini, Zanchi and Martelossi31).
Parent nutrition literacy
Parent NL was measured using the validated Nutrition Literacy Assessment Tool for adults(Reference Gibbs, Ellerbeck and Gajewski32). This sixty-four-item tool contained six subdomains: ‘Nutrition and Health’, ‘Energy Sources in Food’, ‘Food Label & Numeracy’, ‘Household Food Measurement’ and ‘Food Groups and Consumer Skills’. Scores ≥ 58 indicated ‘likelihood of good NL’, 45–57 indicated ‘possibility of poor NL’ and ≤ 44 indicated ‘likelihood of poor NL’(Reference Gibbs, Ellerbeck and Gajewski32).
Statistical analysis
Data analyses were completed using the SAS 9.4 statistical software (SAS, version 9.4; SAS Institute Inc.). Both per-protocol and intention-to-treat (ITT) analyses were performed. For the ITT analysis, missing values at each time point were imputed using the median from the opposite group(Reference Mager, Jackson and Hoffmann33). Parametric and non-parametric variables are reported as mean (standard deviation) or median (interquartile range), respectively. Normality and homogeneity of variance were assessed using the Shapiro–Wilk and Levene’s tests. Two-way repeated-measures ANOVA was used to evaluate group (INT v. CON), time (BL, 3, and 6 months) and group × time interaction effects on primary outcomes (DQ and UPF intake). Post hoc pairwise comparisons were performed with Bonferroni correction. ANCOVA was performed to adjust for potential confounders (e.g. age, sex and ±GI symptoms) influencing primary outcomes. Statistical significance was defined as P ≤ 0·05; for post hoc comparisons, P ≤ 0·025 was applied. Weighted statistics were performed to account for differences in the number of participating children per family (i.e. single-child v. two-child households).
Categorical outcomes (adherence to GFFG in INT and GFD) were compared between groups and over 6 months using χ 2 or Fisher’s exact tests (cell frequency < 5). Pearson’s or Spearman’s correlation analyses were performed to examine associations between primary outcomes and parent NL. The study sample size was determined using HEI-C, with twenty participants/group providing 80 % power to detect a 1 sd difference in total scores. A 1 sd difference (12–16 points) in HEI-C total score is considered clinically meaningful, as it represents a shift in total HEI-C score from the ‘needs improvement’ DQ category (60–80) to the ‘good’ category (> 80), aligning with the target of the GFFG(Reference Mager, Cyrkot and Lirette8,Reference Mager, Liu and Marcon17,Reference Mager, Jiang and Rashke34) . To determine whether there was sufficient power to detect differences in the primary outcomes (β > 0·80), a post hoc power analysis was conducted.
Results
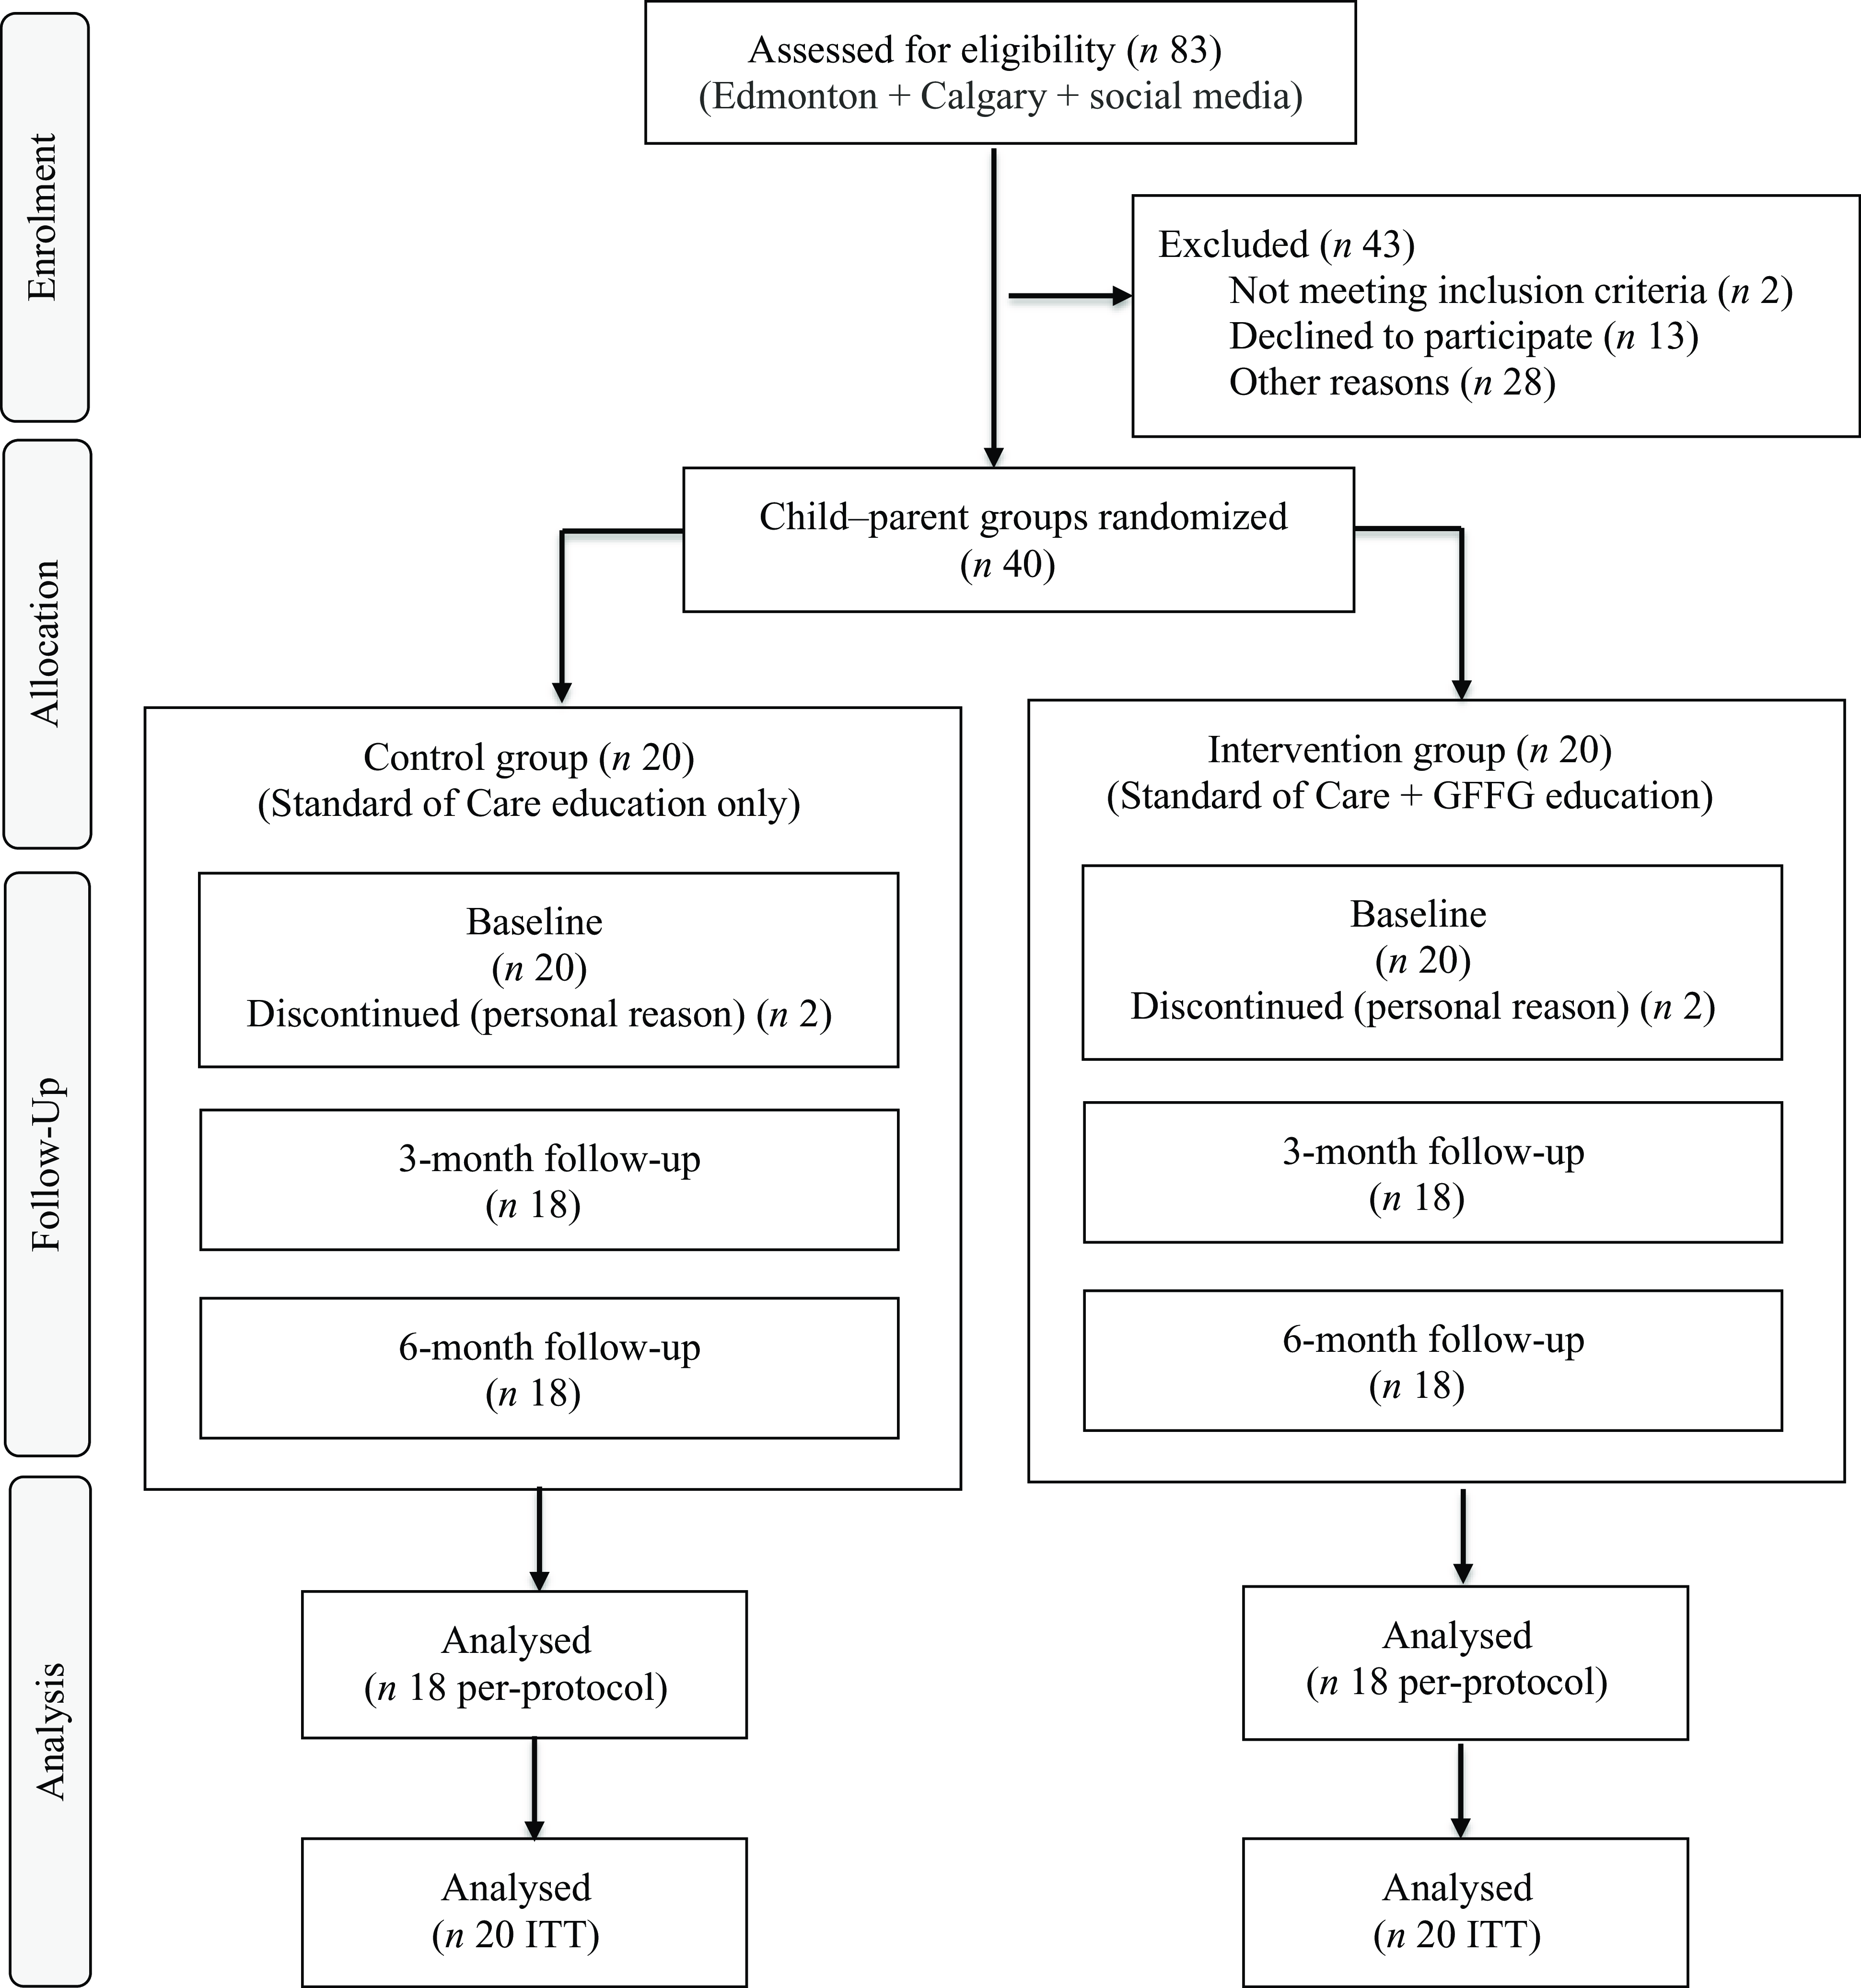
Eighty-three children newly diagnosed with CD were screened for study eligibility (Figure 1). Of these, forty child–parent groups were enrolled, comprising thirty-seven single-child–parent pairs and three two-child–parent groupings. Four parent–child groups withdrew at BL (n 2 INT, n 2 CON) for personal reasons, resulting in a final sample of thirty-six child–parent groups.
CONSORT participant recruitment and retention flow diagram. Edmonton, Stollery Children’s Hospital (Edmonton, Alberta); Calgary, Alberta Children’s Hospital (South Health Campus, Calgary, Alberta). Social media, Instagram; GFFG, Gluten-Free Food Guide; ITT, intention-to-treat analysis.

Anthropometric, sociodemographic and clinical data
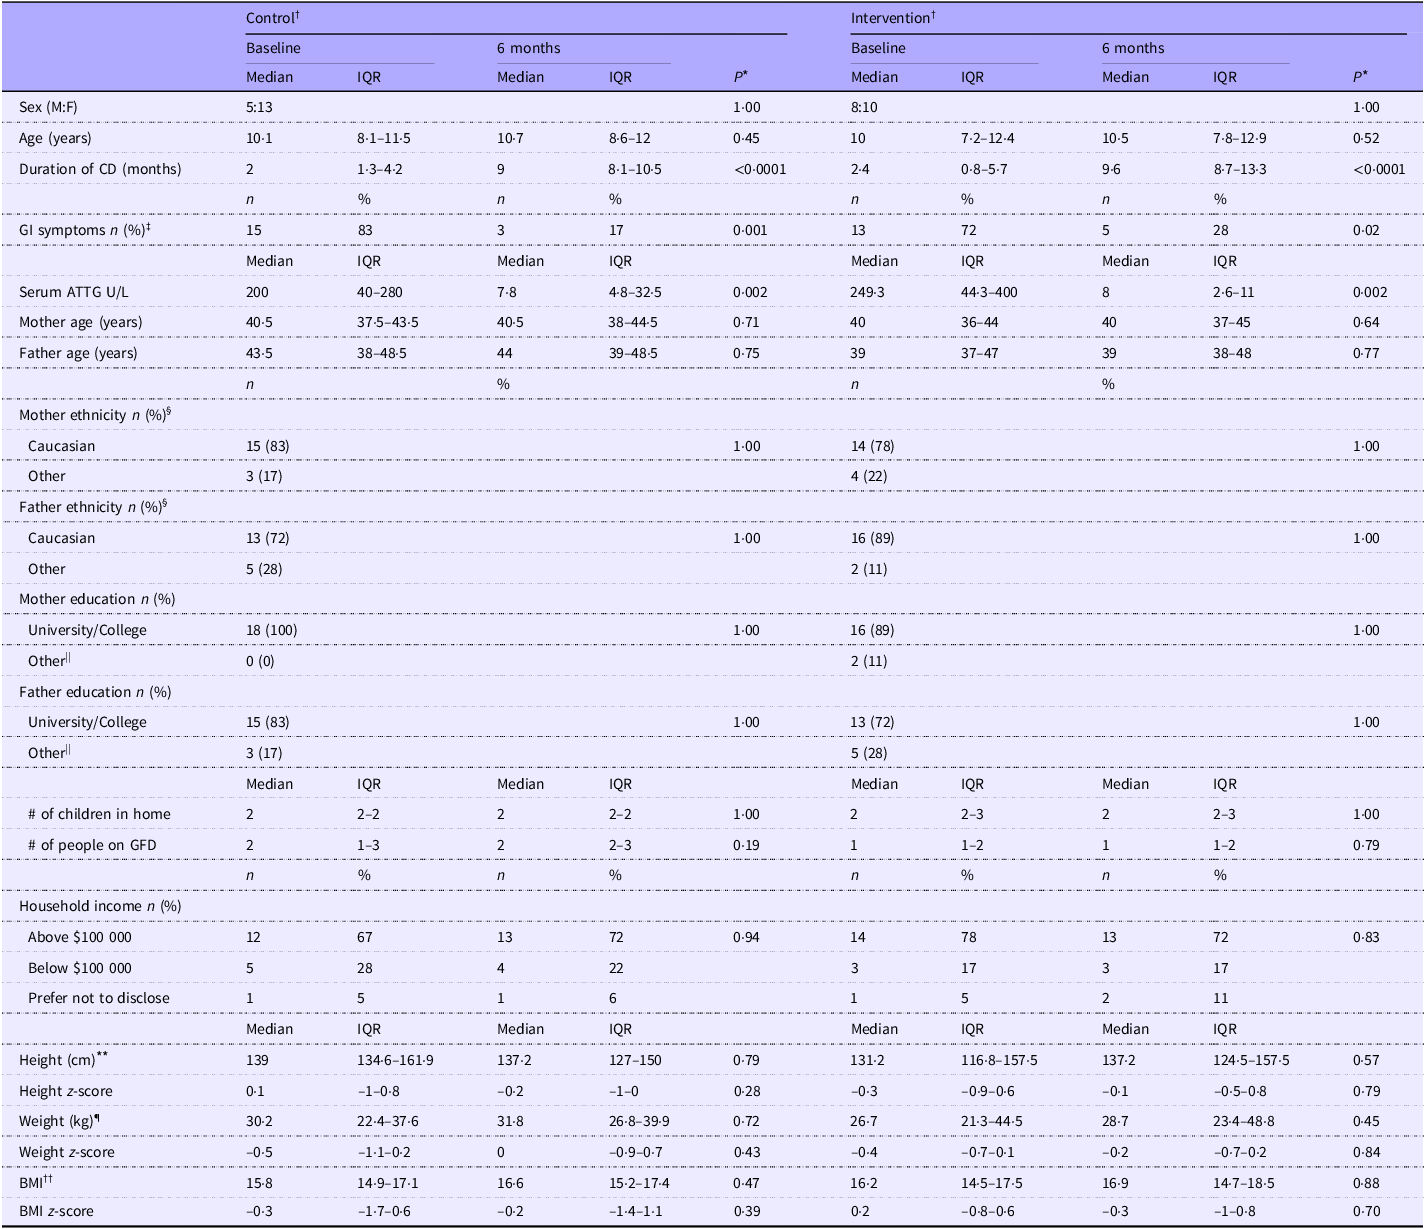
No significant differences in household sociodemographic, child anthropometric and serum ATTG levels were noted between groups (P > 0·05) at BL (Table 1). After 6 months, significant improvements in child GI symptoms (P < 0·001), serum ATTG (P < 0·001) and ferritin level (P = 0·04; data not shown) were observed in both groups.
Sociodemographic, anthropometric and clinical variables in children with coeliac disease

Control, standard of care education; intervention, standard of care + Gluten-Free Food Guide education; 6 months, 6-month follow-up visit; IQR, interquartile range (25th–75th percentile); F, female; M, male; CD, coeliac disease; GI, gastrointestinal; ATTG, anti-tissue transglutaminase; GFD, gluten-free diet.
Analysis was based on the study protocol. Data are presented as median (interquartile range (Q1–Q3)). Categorical variables are expressed as frequency (column percentage %).
* A P-value ≤ 0·025 was considered statistically significant. Between-group differences are denoted by different superscript letters (a, b), if observed.
† Participants were recruited as parent–child groups. After two groupings dropped out from each group at baseline, eighteen groupings per group remained. The CON group included sixteen single-child–parent pairs and two two-child–parent groups, totalling twenty children. The INT group included seventeen single-child–parent pairs and one two-child–parent group, totalling nineteen children.
‡ Percentage of parent-reported GI symptoms in their children at diagnosis.
§ Ethnicity is defined from Statistics Canada (https://www150.statcan.gc.ca/n1/daily-quotidien/221026/dq221026b-eng.htm ). ‘Other’ ethnic group includes non-Caucasian (e.g. Chinese, Indian) and Indigenous origin.
|| ‘Other’ education includes high school and registered apprenticeship.
¶ Weight data were available for 19/20 control group participants at both time points and for 17/19 (baseline) to 18/19 (6-month) intervention group participants.
** Height data were available for 15/20 control group participants at both time points and for 18/19 (baseline) to 19/19 (6-month) intervention group participants.
†† BMI was calculated by weight-to-height squared ratio (kg/m2). Weight-z, height-z and BMI-z were determined based on WHO standards.
Primary outcomes
Dietary quality: Healthy Eating Index-Canadian
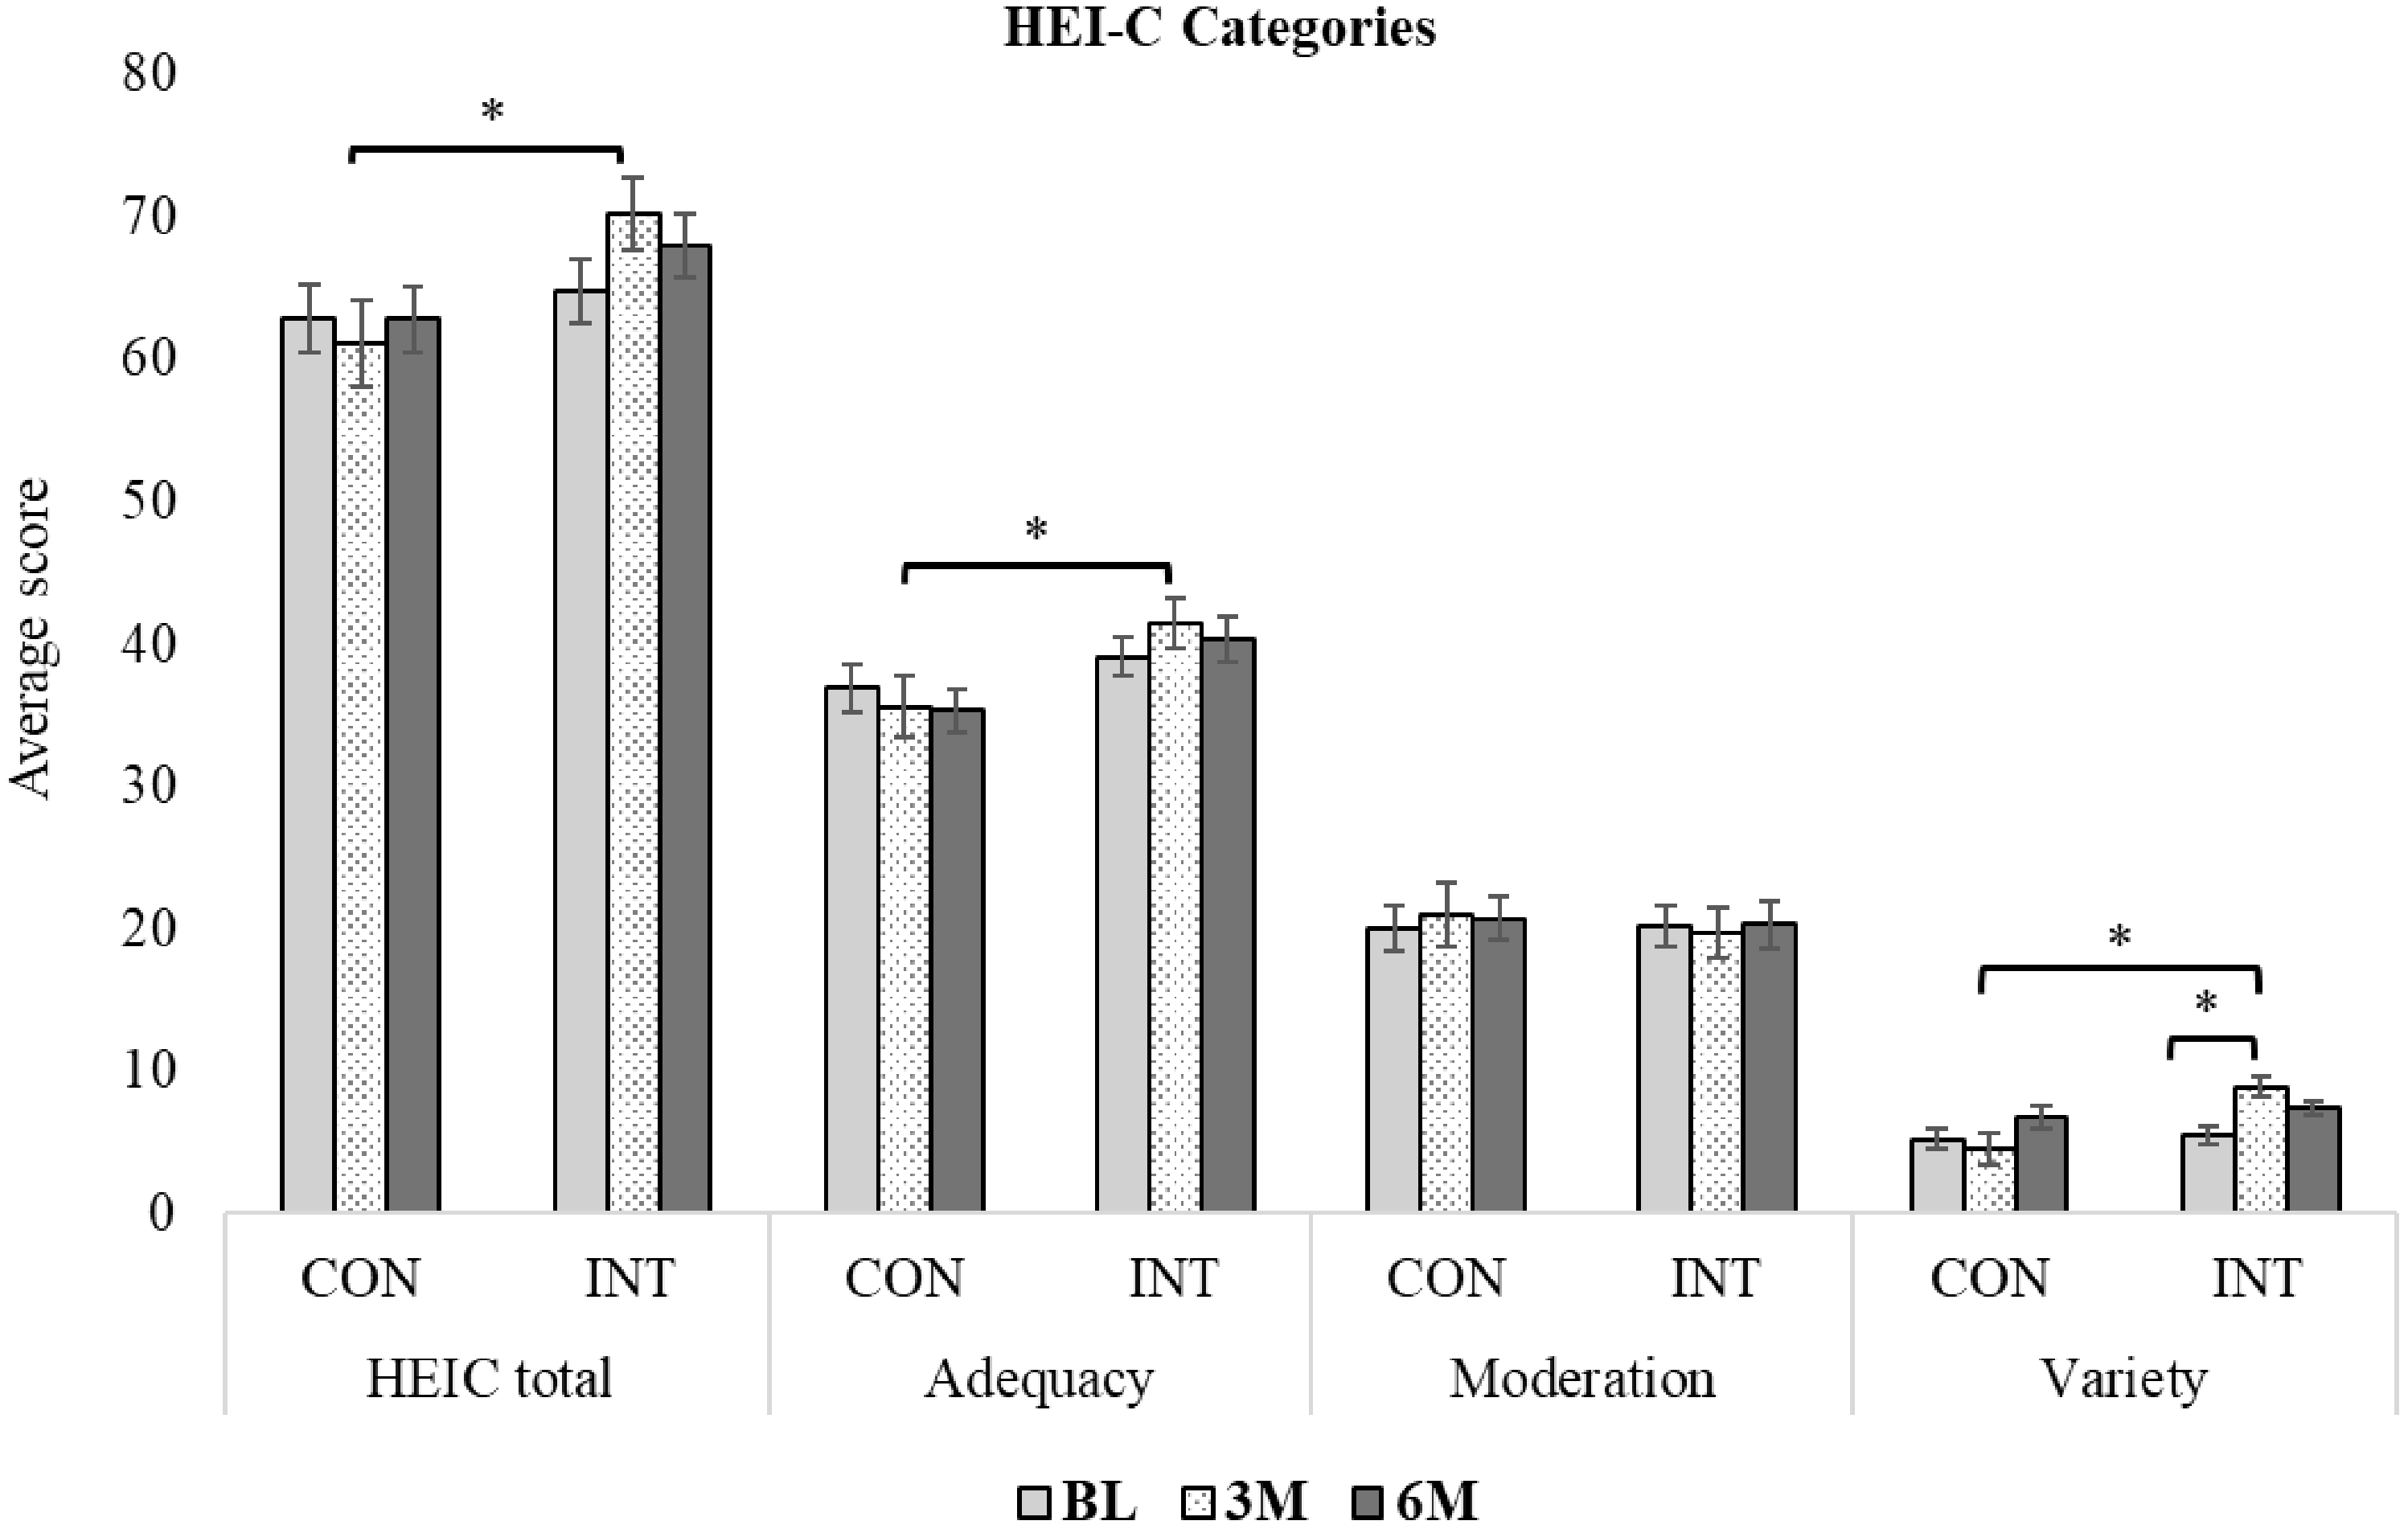
At BL, no significant differences were observed between groups in total HEI-C or its subdomain scores (adequacy, moderation and variety) (P > 0·05). The majority (92 %) of children had scores indicating ‘needs improvement’ or ‘poor’ DQ (≤ 80 scores). Dietary variety scores increased significantly in the INT group between BL and 3 months (absolute: BL: 6·7 (3·3–6·7) v. 3 months: 10 (10–10); P = 0·01) but remained unchanged between 3 and 6 months (Figure 2). Total DQ and the subset score of adequacy and variety were also significantly higher in the INT at 3 months v. CON groups (P ≤ 0·05), but not at 6 months (P > 0·05). No other within-group changes in INT or CON were found in total or subdomain scores over 6 months (P > 0·05). Sex, GI symptoms, parent NL, under-/overreporting dietary intake or annual household income (CAD$ > v. < 100 000) did not influence INT findings. Across all time points, younger children (< 10 years) had significantly higher total HEI-C (69·2 (sd 11·9) v. 61·2 (sd 9·0); P < 0·01), adequacy (41·5 (sd 7·3) v. 35·2 (sd 6·5); P < 0·0001) and variety scores (7·2 (sd 3·3) v. 5·7 (sd 3·8); P = 0·04) in both groups. ITT analysis did not show different results (data not shown).
Changes in dietary quality (DQ) measured by Healthy Eating Index-Canadian (HEI-C), over 6 months in children (4–18 years) with coeliac disease in control (CON) and intervention (INT) groups. Data are mean (standard error). Data analysis was per protocol. Asterisks (*) indicate significant differences (P ≤ 0·025) based on two-way repeated-measures ANOVA with Bonferroni-adjusted post hoc comparisons. BL drop-outs (CON: 2 groups; INT: 2 groups) were excluded. Data availability is shown as n/N: CON—BL: 18/20, 3M: 20/20, 6M: 18/20; INT—BL: 19/19, 3M: 19/19, 6M: 17/19. HEI-C evaluates dietary adequacy, moderation and variety based on food group servings and classifies DQ as good (> 80), needs improvement (51–80) or poor (< 50)(Reference Livingstone, Robson and Black21). HEI-C, Healthy Eating Index-Canadian; CON, control group (standard of care teaching); INT, intervention group (standard of care + Gluten-Free Food Guide teaching); BL, baseline; 3M, 3 months follow-up visit; 6M, 6 months follow-up visit.

NOVA classification
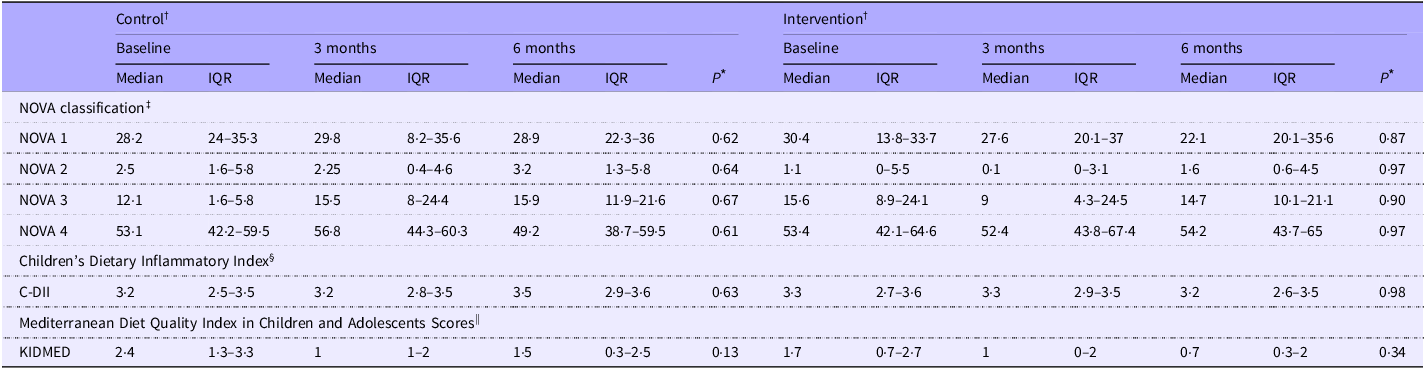
UPF (NOVA 4) contributed the largest proportion of total energy intake at BL (53 %), with no differences between groups (Table 2). After 3 months, the CON showed a greater percent increase in food classified under NOVA 3 (processed food: CON: + 42·9 % (–21·5–220·8) v. INT: −39·0 % (–73·5–41·1) decreases; P = 0·02) compared with the INT group. No other significant changes in NOVA food categories were noted over 6 months (P > 0·05). Findings were not influenced by age, sex, GI symptoms, parent NL, under-/overreporting dietary intake or household income (P > 0·05). Across all time points, children consuming UPF above the median (NOVA 4; > 53 % of energy) had lower scores of total HEI-C (62·2 (sd 10·3) v. 67·7 (sd 11·2); P = 0·01), KIDMED (0·9 (sd 1·4) v. 1·9 (sd 1·3); P = 0·0001) and higher scores of C-DII (2·9 (sd 1) v. 3·1 (sd 0·6); P = 0·01) than children consuming below the median. ITT analysis did not show different results (data not shown).
Changes in ultra-processed food intake, dietary inflammation and Mediterranean diet adherence over 6 months in control and intervention groups among children with coeliac disease

Control, standard of care education; Intervention, standard of care + Gluten-Free Food Guide education; 3 months, 3-month follow-up visit; 6 months, 6-month follow-up visit; IQR, interquartile range (25th–75th percentile); C-DII, children’s dietary inflammatory index; KIDMED, Mediterranean Diet Quality Index in Children and Adolescents Scores.
Analysis was based on the study protocol. Data are presented as median (interquartile range (Q1–Q3)).
* A P-value ≤ 0·025 was considered statistically significant. Between-group differences are denoted by different superscript letters (a, b), if observed.
† Baseline drop-outs (control (CON): two child–parent groups; intervention (INT): two child–parent groups) were excluded; eighteen child–parent groups per arm remained. The CON group included sixteen single-childparent pairs and 2 two-child–parent groups, totalling 20 children. The INT group included seventeen single-child–parent pairs and one two-child–parent group, totalling nineteen children. Data availability is shown as n/N: CON—BL: 18/20, 3M: 20/20, 6M: 18/20; INT—BL: 19/19, 3M: 19/19, 6M: 17/19.
‡ Data are presented as percentages of total energy intake based on the NOVA classification. NOVA 1: unprocessed/minimally processed (e.g. fruits, vegetables); NOVA 2: processed culinary ingredients (e.g. oils, salt); NOVA 3: processed foods (e.g. canned vegetables, cheese); NOVA 4: ultra-processed foods (e.g. sugary drinks, packaged snacks)(Reference Monteiro, Cannon and Levy25).
§ The Children’s Dietary Inflammatory Index estimates dietary inflammatory potential. Twenty-four of twenty-five parameters were included; alcohol was excluded. Intakes were standardised (z-scores), transformed and centred. Each score was computed by multiplying the centred value by its inflammatory effect score. Final scores were energy-adjusted per 1000 kcal. Negative scores indicate anti-inflammatory potential; positive scores indicate pro-inflammatory potential(Reference Khan, Wirth and Ortaglia29).
|| Mediterranean Diet Quality Index in Children and Adolescents Scores (range 0–12) were categorised as ‘optimal Mediterranean diet’ (> 8), ‘needs improvement’ (4–7) and ‘low diet quality’ (≤ 3)(Reference López-Gajardo, Leo and Sánchez-Miguel28).
Secondary outcomes
Food group servings consumed per day
From 3 to 6 months, the number of grain servings consumed per day significantly increased in the INT children (3 months: 4·5 (sd 1·5) v. 6 months: 6 (sd 1·9) servings per d; P = 0·02). No other significant changes were observed in the number of servings per day from the other food groups over 6 months in either INT or CON (P > 0·05). However, the INT group experienced a greater percentage change in the number of unsweetened milk servings per day over 3 months compared with CON (INT: +154·6 % (0–203·2) v. CON: 0 % (–100–18·8); P = 0·03). These results were not influenced by age, sex or GI symptoms (P > 0·05). Results remained the same in the ITT analysis.
Adherence to the Gluten-Free Food Guide plate recommendations
Across all time points, 86 % of children in both groups met the GFFG plate recommendation that grains comprise < 25 % of total intake and 9 % met the protein recommendation (∼25 % of the plate). In contrast, no children met the recommendation that F&V comprise > 50 % of total intake. In the INT group, the number of children meeting the protein food group recommendation significantly increased at 3 months (BL: n 0/19 v. 3 months: n 5/19; P = 0·01). Additionally, dairy products (BL: 7·5 (sd 3·6) % v. 3 months: 12·4 (sd 6·7) %; P = 0·01) and unsweetened milk (BL: 2·5 (sd 2·2) % v. 3 months: 4·7 (sd 3·0) %; P = 0·01) servings, consumed as a percentage of the total food groups consumed on the GFFG plate, increased at 3 months in the INT group only. These improvements were not observed at 6 months. Findings remained unchanged after adjusting for age, sex and GI symptoms (P > 0·05). ITT analysis showed the same results (data not shown).
Macronutrient intake and comparison with dietary reference intake
At BL, no significant differences were observed between the INT and CON groups in total energy intake (kcal/d), macronutrient intake (g/d or % kcal) or the number of children meeting DRI (AMDR/WHO/AI) (P > 0·05; online Supplementary Table 2). Most children met the AMDR for protein (97 %) and carbohydrates (73 %), while 57 % exceeded the AMDR for fat. Only 8 % met the AI for fibre, and 18 % met the WHO guideline for saturated fat. Over 6 months, no significant change was observed in the percentage of children meeting macronutrient DRI in both groups (P > 0·05). The INT group experienced a significant percentage increase in the amount of fibre consumed over 6 months (INT: 25·2 % (–6·8–37·3)). In contrast, the CON group experienced a percentage decrease in fibre intake (CON: −10·2 % (–41·8–11·6); P = 0·03). These findings persisted after adjusting for age and sex (P > 0·05). The fibre finding was no longer significant in the ITT analysis (P > 0·05).
Micronutrient intake and comparison to dietary reference intake
At BL, no significant differences were observed between the INT and CON groups in micronutrient intake (mg or µg/d) or the number of children meeting the DRI (EAR/RDA/AI) (P > 0·05; online Supplementary Table 2). Most children met the RDA for vitamin B6 (95 %), B12 (97 %) and C (84 %), while fewer met the RDA for iron (50 %), calcium (38 %), folate (32 %) and none for vitamin D (0 %). Over 6 months, with the exception of a decrease in the percentage of CON children meeting the RDA for folate (BL: 28 % v. 6 months: 0 %; P = 0·02), no significant changes in the number of children meeting the DRI for any other micronutrients were observed in both groups. However, the INT group experienced a significant percentage increase in the amount of vitamin A consumed over 6 months (INT: 39·4 % (3·8–92·3)). In contrast, the CON group experienced a significant percentage decrease in vitamin A intake (–15·5 % (–44·4–12·9); P = 0·01). These findings persisted after adjusting for age and sex (P > 0·05). The vitamin A finding was no longer significant in the ITT analysis. (P > 0·05).
Mediterranean diet and dietary inflammation scoring
No significant differences between groups were observed for KIDMED or C-DII scores at BL (P > 0·05) (Table 2). Overall, 81 % of children scored ‘poor adherence’ to the MD, and 97 % had a pro-inflammatory dietary pattern (C-DII score > 0). After 6 months, the proportion of children classified as having ‘poor adherence’ to the MD significantly increased in the CON group (BL: 67 % v. 6 months: 100 %, P = 0·02). Conversely, the INT group showed no significant change (P > 0·05). No changes in C-DII scores were observed in either group over 6 months (P > 0·05). Age, sex, GI symptoms, under-/overreporting dietary intake, parent NL and annual household income did not impact KIDMED and C-DII findings in either group over 6 months (P > 0·05). ITT analysis did not show different results (data not shown).
Adherence to the gluten-free diet and health-related quality of life
With the exception of more INT children reported difficulty accepting the GFD at BL (INT: 65 % v. CON: 25 %; P = 0·03), no significant differences in adherence to the GFD and other concepts related to health-related quality of life were observed between groups or over 6 months. Overall adherence to the GFD by self-reported and estimated gluten intake was 88 % and 100 % at 6 months, respectively. Self-reported adherence to the GFD was higher among younger children (< 10 years) (97 % v. 73 %; P < 0·01). Commonly cited challenges included feeling socially different (88 %), dissatisfaction with food options (64 %) and embarrassment when asking for GF accommodations outside (41 %). These challenges were not impacted by potential confounding variables such as sex, parent education/ethnicity, positive family CD history and/or the number of household members with CD. The findings did not change within the ITT analysis.
Parent nutrition literacy
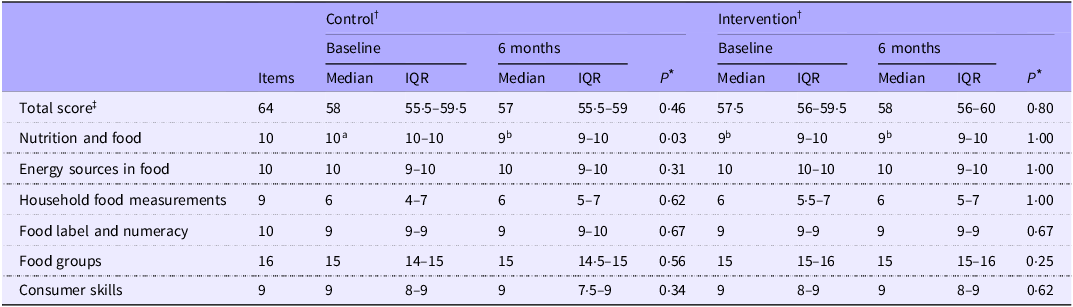
No significant differences in total parent NL scores were observed between groups or over 6 months (P > 0·05) (Table 3). Total parent NL fell within the ‘possibility of good NL’ category, with a median (interquartile range) score for the entire cohort of 58 (56–60). Parent NL was not found to be associated with their child’s DQ scores, NOVA classifications or macro-micronutrient intake levels over the entire cohort (all P > 0·05). The ITT analysis showed the same relationships (P > 0·05).
Changes in parent nutrition literacy over 6 months in control and intervention groups

Control, standard of care education; intervention, standard of care + Gluten-Free Food Guide education; 6 months (6M), 6-month follow-up visit; IQR, interquartile range (25th–75th percentile).
Analysis was based on the study protocol. Data are presented as median (interquartile range (Q1–Q3)).
* A P-value ≤ 0·025 was considered statistically significant. Between-group differences are denoted by different superscript letters (a, b).
† Nutrition literacy was collected from parents only. Baseline drop-outs (control (CON): two child–parent groups; intervention (INT): two child–parent groups) were excluded; eighteen child–parent groups per arm remained. Data availability is reported as n/N: CON—BL: 15/18, 6M: 15/18; INT—BL: 18/18, 6M: 16/18.
‡ Parent nutrition literacy was assessed using the validated sixty-four-item Nutrition Literacy Assessment Instrument® (NLit, Order #113874), covering six domains: nutrition and health, energy sources, household measurements, food labels/numeracy, food groups and consumer skills(Reference Gibbs, Ellerbeck and Gajewski32). Scores ≥ 58 indicated good literacy, 45–57 possible poor literacy and ≤ 44 poor literacy(Reference Gibbs, Ellerbeck and Gajewski32).
Discussion
This pilot randomized control trial (RCT) assessed the effectiveness of GFFG education combined with standard of care v. standard of care alone on DQ (HEI-C) and processed/UPF food intake over 6 months in newly diagnosed children with CD. Findings indicate that a single GFFG education session led to short-term improvements in dietary variety, a subcomponent of overall DQ, but did not significantly impact total DQ or UPF food intake. The increase in dietary variety was associated with coinciding increases in unsweetened milk consumption in children receiving dietary education with GFFG. Fibre and vitamin A intake also improved following the GFFG education but did not elicit any other substantial dietary improvements (e.g. adherence to GFFG recommendations) in children with CD. These findings suggest that a single educational session using the GFFG could promote some important dietary improvements to overall health. However, a single educational session by nutrition educators is unlikely to elicit major changes in the nutritional value of the diet in newly diagnosed CD children and youth.
The increase in dietary variety scores alongside higher unsweetened milk consumption suggests that the GFFG could support greater food variety, which may improve bone health in children with CD over the long term. Children newly diagnosed with CD are at risk for low bone mineral density due to chronic intestinal damage, impaired nutrient absorption, and inadequate calcium and vitamin D intake(Reference Zacay, Weintraub and Regev35,Reference Kondapalli and Walker36) . Although persistent lactose malabsorption is uncommon after mucosal healing, children with CD and their parents may continue to avoid dairy products due to perceived GI intolerance(Reference Kondapalli and Walker36,Reference Suárez-González, Bousoño-García and Jiménez-Treviño37) . Without appropriate dietary guidance, this unnecessary restriction may increase the risk of nutrient deficiencies and the potential for suboptimal bone health. Previous studies using general dietary guidelines (e.g. Harvard Healthy Eating Plate) have reported decreased milk intake and reduced calcium adequacy in children with CD following nutrition education(Reference Suárez-González, Bousoño García and Jiménez Treviño9,Reference Suárez-González, Bousoño-García and Jiménez-Treviño37) . These reductions were partly attributed to the guideline’s de-emphasis on stand-alone milk consumption with meals, a concern also raised with the CFG 2019(Reference Barr38). Fortified milk and alternatives are key calcium and vitamin D sources in children’s diets. The GFFG’s specific recommendation to include unsweetened milk or plant-based alternatives as primary beverage choices with meals may help address these common nutrient gaps and support bone health during critical periods of growth.
Despite these potential benefits, no significant improvements in total calcium or vitamin D intake were observed in the present study. An increase in vitamin A intake, a key nutrient for bone formation, was observed post-intervention and associated with higher dairy products intake and lower intake of foods high in added sugar and fat. The maintenance of folate intake may be attributed to the increased emphasis on folate-rich foods in the GFFG plate. The majority of participants (88 %) also reported regular use of multivitamins and/or single-nutrient supplements (e.g. iron and vitamin D), which may have complemented their dietary intake and helped to meet their nutrient needs. Ongoing surveillance of food intake following GFFG education, with a larger sample size (e.g. n 40 per group, β > 0·8), is needed to confirm the guide’s potential to improve nutrient intake in children with CD. Additionally, the only short-term improvements in dietary variety and unsweetened milk intake may suggest that stand-alone educational tools may have limited long-term effects on dietary behaviours in children with CD without ongoing support from RD(Reference Perez-Junkera, Vázquez-Polo and Eizagirre39). These findings underscore the need for ongoing, multi-modal dietary education that engages both children and parents.
The GFFG-based education was associated with increased fibre intake, which positively correlated with the intake of unprocessed foods and plant-based protein sources. Although no statistically significant changes were observed in the intake of these food groups, the positive association suggests that even modest improvements in food choices aligned with the GFFG recommendation may support better fibre intake. The increase in fibre intake may also reflect greater consumption of GF breads enriched with high-fibre ingredients (e.g. psyllium husk), commonly found in several brands consumed by participants. An increased intake of grain foods in children after the intervention further supports this finding. However, the fibre intake in most children continued below recommended levels, likely due to increasing reliance on low-fibre GF-UPF and lack of adherence to GFFG recommendations.
Low adherence to GFFG recommendations, especially for F&V and protein, mirrors patterns observed with other national dietary guidelines, including the CFG 2019, among healthy children(Reference Prowse, Doan and Philipneri40). A major barrier appears to be the persistent high consumption of GF-UPF. Rising prices of naturally GF foods (e.g. F&V) have made healthy GF food affordability a primary issue. A national survey reported that nearly half (49 %) of Canadian households with children with CD experience GF food insecurity(Reference Wang, Anders and Jiang41). Household food insecurity is associated with higher processed GF food intake and lower F&V consumption in children with CD(Reference Wang, Anders and Jiang41). Even when parents aim to offer healthier options, financial and time constraints often result in reliance on convenient, processed GF products, particularly in lower socio-economic households(Reference Bozorg, Lee and Mårild42). A recent study examining food environments in families managing CD confirmed abundant GF convenience foods and snacks at home and suboptimal DQ in children with CD(Reference Cyrkot, Gidrewicz and Anders5).
The GFFG-based education was not associated with improved adherence to the MD or shifts in pro-inflammatory dietary patterns. These findings may reflect limitations in the intervention’s scope and choice of DQ tools used to evaluate dietary changes. Specifically, the GFFG was not designed to promote core MD components such as increased olive oil and fatty fish consumption. Instead, the GFFG more emphasises reducing UPF by focusing on the intake of micronutrient-dense whole foods such as F&V, plant-based proteins and unsweetened, fortified milk or plant-based beverages(Reference Mager, Cyrkot and Lirette8). This was important since meal patterns in children with CD are historically high in saturated fat/added sugar and low in several micronutrients(Reference Alzaben, Turner and Shirton18). Comparing actual intake to GFFG recommendations allows for the evaluation of the tool’s feasibility in capturing real-world dietary patterns. It also highlights areas where children’s intake falls below or exceeds GFD-specific recommended proportions, which is beneficial for informing targeted nutrition education and future intervention strategies.
Studying the uptake of GFFG in children and youth diagnosed with CD for more than 1 year may provide important insights, as children and their families may have already adjusted to the lifestyle changes needed with a GFD. In contrast, newly diagnosed children with CD and their families are likely overwhelmed by adapting to the need to rapidly improve their gluten literacy level related to the GFD. These factors may hinder their readiness to engage in further DQ improvement. Over half of the children in this cohort expressed dissatisfaction with GF food options and unhappiness with following the GFD. These emotional and practical challenges may lead parents to prioritise food safety and acceptability over nutritional quality. A previous study with multiple RD-led educational sessions emphasising whole foods and dietary adherence to an MD pattern significantly reduced UPF intake and improved DQ in children on the GFD who had CD for over 2 years(Reference Suárez-González, Bousoño-García and Jiménez-Treviño37). Future studies could evaluate GFFG use at diagnosis, starting with foundational GFD education and advancing to individualised DQ guidance at 3 and 6 months to enhance retention and reduce information overload.
The GFFG-based education did not significantly influence self-reported GFD adherence and gluten intake due to high BL adherence (CON: 94 %; INT: 100 %) and consistently low gluten intake (< 10 mg) across all time points. Similarly, parent NL was high at BL, did not improve post-intervention, and was not associated with children’s DQ. This aligns with evidence that high levels of household NL and access to fresh and healthy produce do not necessarily translate to improved DQ in children with CD(Reference Cyrkot, Gidrewicz and Anders5). These findings are confirmed in this study, where children and parents receiving dietary education with the GFFG confirmed a good understanding of recommended GFFG plate proportions for each food group (> 98 % accuracy) at the end of the 6-month intervention (unpublished data). Other factors, such as evaluation of the food environment (external and internal), fear of gluten exposure leading to a restricted diet and selective eating behaviour, child and family motivation for dietary change, and food costs, are also important considerations in GFFG uptake(Reference Dwyer, Bolger and Laurenceau43).
Sustained, RD-led interventions that include practical skill-building may be more effective in supporting lasting behaviour change. Interventions lasting over 6 months with biweekly engagement and specific behavioural targets (e.g. increasing F&V intake by 20 %) have shown greater success in improving children’s dietary outcomes(Reference Murimi, Moyeda-Carabaza and Nguyen44). Supplementary tools like kid-friendly cookbooks, videos and hands-on workshops may improve food literacy and support GFFG adoption. Parent-targeted, home-based interventions that include strategies like parent modelling, repeated taste exposure and increased availability of ready-to-eat F&V have been shown to improve children’s F&V intake(Reference Touyz, Wakefield and Grech45). Providing clear guidance on reducing UPF intake, strategies to simplify meal preparation and education focusing on cost-effective and affordable food ingredient substitutions may help families overcome practical barriers. Education should be age-appropriate, as older children often have poorer DQ, likely due to greater independence in food choice selection. A strong emphasis on peer support for adolescents may help promote healthier GFD meal patterning. Technology-based interventions (e.g. social media or apps) and upstream strategies (e.g. GF-inclusive national school meal programmes) may offer additional support.
Study limitations include the lack of assessment of NL and motivation for dietary change in the affected child and adolescent, and potentially the use of a 24-h recall v. a 3-d food record at 3 months. DQ tends to be significantly lower in adolescents due to declining parent influence on food intake(Reference Alzaben, Turner and Shirton18). Notably, the use of a 24-h food recall at the midpoint in the study was chosen to reduce the respondent burden and increase adherence to study procedures, as adherence to dietary assessment is historically low in clinical nutrition research(Reference Collins, Watson and Burrows46). This likely had minimal impact on the primary outcomes of interest, as previous data in children with CD have shown similar variability in assessing food patterns between 24-h recalls and multiple-day food records when assessing dietary intake(Reference Cyrkot, Gidrewicz and Anders5). While we considered important confounding factors such as age, income and GI symptoms, other factors, such as employment and housing, were not assessed. Employment instability and housing costs affect disposable income for food, influencing food security and DQ(Reference Wang, Anders and Jiang41). GF food insecurity may still be a concern due to the high cost and limited availability of GF foods(Reference Wang, Anders and Jiang41). Lastly, there was a lack of ethnic diversity in the studied population with high education levels, which may limit the generalisability of study findings to culturally diverse and lower-literacy populations.
Conclusion
This pragmatic pilot RCT examined the effect of dietary counselling using the GFFG tool to promote improvements in DQ in children newly diagnosed with CD. Mirroring current clinical practice, nutrition education was provided only once following a CD diagnosis in addition to the standard of care group teaching by an RD. A single nutrition education session using the GFFG in newly diagnosed CD children resulted in some nutritional improvements, including diet variety and a higher intake of unsweetened milk, along with improvements in micronutrient intake that are important to overall health in the child. Ongoing education and exploring other factors influencing GFFG uptake (e.g. food environment) will be essential to eliciting overall improvements in DQ in youth with CD. The GFFG represents an evidence-based nutrition educational tool that can help educate children with CD and their families about consuming a healthy and nutritious GFD.
Supplementary material
For supplementary material/s referred to in this article, please visit https://doi.org/10.1017/S0007114525105618
Acknowledgements
The authors would like to gratefully acknowledge Christine Lirette, BSc, Wang Xinyi, MSc, and all volunteers for their assistance with data entry/data auditing and the children and families who participated in this study.
This work was supported by the Alberta Health Services – Maternal Newborn Child & Youth Strategic Clinical NetworkTM HOI-II (operational funding: RES0044287). Graduate and summer studentship funding provided by the Stollery Children’s Hospital Foundation through the Women and Children’s Health Research Institute (2023–2025), the Canadian Behavioral Interventions and Trials Network (2023–2024), the University of Alberta Graduate Recruitment Scholarship (2022) and the Alberta Diabetes Institute (2022–2023) to ZQ. J. Funders had no role in the design, analysis or writing of this article.
ZQ. J. contributed to data curation, formal analysis, funding acquisition, project administration, validation, and visualisation, co-wrote manuscript with D. R. M. and approved final manuscript prior to submission. D. G. contributed to data curation, methodology, resources, and writing – review/editing and approved final manuscript prior to submission. M. C. contributed to data curation, resources, and writing – review/editing and approved final manuscript prior to submission. J. W. contributed to data curation, resources, and writing – review/editing and approved final manuscript prior to submission. M. M. contributed to funding acquisition, methodology, and writing – review/editing and approved final manuscript prior to submission. R. N. contributed to funding acquisition, methodology, and writing – review/editing and approved final manuscript prior to submission. C. B-H. contributed to methodology and resources and approved final manuscript prior to submission. J. M. T. contributed to conceptualisation, data curation, methodology, resources, validation, and writing – review/editing and approved final manuscript prior to submission. D. R. M. lead role and responsible for all study aspects including design/inception of GFFG and conceptualisation of current study, supervision of data duration, formal analysis, funding acquisition, investigation, methodology, project administration, resources, software, validation, and visualisation, co-wrote manuscript with ZQ. J. and approved final manuscript prior to submission.
The authors declare no conflicts of Interest.


 Open access