

Hypertension is a major risk factor for fatal and non-fatal CVD events( Reference Roger, Go and Lloyd-Jones 1 – Reference Lewington, Clarke and Qizilbash 3 ). Hypertension may affect >90 % of individuals during their lifetimes( Reference Vasan, Beiser and Seshadri 4 ). Current estimates indicate that hypertension costs the USA almost $70 billion annually in direct medical expenses( Reference Heidenreich, Trogdon and Khavjou 5 ). Randomised clinical trials and meta-analyses indicate that blood pressure (BP) reductions lower the risk of myocardial infarction, stroke and other cardiovascular deaths( Reference Hansson, Lindholm and Niskanen 6 , Reference Gaciong, Sinski and Lewandowski 7 ). Therefore, adequate control of BP in the healthy range is of enormous individual and public health importance.
Pre-hypertension is a condition defined by a systolic BP (SBP) between 120 and 139 mmHg or a measured diastolic BP (DBP) between 80 and 89 mmHg( Reference Chobanian, Bakris and Black 8 ). The Framingham Heart Study showed that the 4-year incidence of hypertension increased between 17·6 and 37·3 % in individuals with pre-hypertension between 35 and 64 years of age( Reference Vasan, Larson and Leip 9 ). Current medical practice does not treat pre-hypertension per se; however, the importance of lifestyle modifications are emphasised in the Joint National Committee (JNC)-7 and JNC-8, which recommend weight control, regular exercise and following a healthy diet( Reference Chobanian, Bakris and Black 8 , Reference Eckel, Jakicic and Ard 10 , Reference James, Oparil and Carter 11 ).
Diet plays a significant role in maintaining healthy BP( Reference Eckel, Jakicic and Ard 10 ). In addition to the widely accepted attributes of the Dietary Approaches to Stop Hypertension eating plan, emerging evidence suggests that certain dietary factors may have BP-lowering effects, thus warranting inclusion in the diet, particularly when a condition is becoming apparent, such as the warning sign of pre-hypertension. Certain polyphenolic compounds/compositions promote BP regulation and improve vascular health( Reference Chong, Macdonald and Lovegrove 12 ). Grape and grape products contain an array of polyphenolic compounds, and grape seeds are a concentrated source of polyphenolic flavan-3-ols existing in varying concentrations of monomeric (catechin (CT) and epicatechin (EC)), dimeric, trimeric and polymeric tannin structures, depending on variety, processing, form, storage conditions and time( Reference Shi, Yu and Pohorly 13 ). Clinical trials supplementing with grape seed extracts (GSE) have shown clinically relevant reductions in BP in the order of 4·1–8·7 % for SBP and 3·4–9·0 % for DBP( Reference Sivaprakasapillai, Edirisinghe and Randolph 14 – Reference Robinson, Lu and Edirisinghe 17 ). In vitro and ex vivo data suggest that GSE improves or enhances endothelial function through NO-mediated pathways( Reference Edirisinghe, Burton-Freeman and Tissa Kappagoda 18 ).
GSE is currently available as a capsule at dietary supplement stores. GSE in a food/beverage format has not been tested, largely due to poor solubility and unfavourable organoleptic properties. However, functional foods are a growing market for health-conscious consumers, driving advances in technology to overcome these challenges. The present study tested a patented GSE product in a beverage to lower BP in individuals with pre-hypertension. The primary end point was the difference in the change in SBP after 6 weeks of GSE beverage supplementation compared with a Placebo beverage. Secondary end points aimed to assess changes in DBP, markers of endothelial function, insulin sensitivity, markers of oxidative stress and inflammation, as well as to characterise GSE plasma phenolic components relative to efficacy outcomes.
Methods
Study design
The presented clinical trial was a single-centre, randomised, double-blinded, placebo-controlled, parallel study performed at the Clinical Nutrition Research Center at the Illinois Institute of Technology (Chicago, IL, USA). The study was conducted according to the guidelines laid down in the Declaration of Helsinki and the International Conference on Harmonization-Good Clinical Practice, and all the procedures involving human subjects were approved by the Institutional Review Board at the Illinois Institute of Technology. Written informed consent was obtained from all subjects before the initiation of the study. This trial was registered at clinicaltrials.gov as NCT00979732. The study was conducted including analyses from 2010 to 2014.
Subjects
Eligible subjects were men and women with pre-hypertension (SBP between 120 and 139 mmHg or DBP between 80 and 89 mmHg) between the ages of 25 and 65 years who had no clinical evidence or documented history of CVD, respiratory, renal, gastrointestinal or hepatic disease. Subjects who reported unusual dietary habits (e.g. pica), were actively losing weight or trying to lose weight, addicted to drugs or alcohol or smoked, presented with significant psychiatric or neurological disturbances or who were taking over-the-counter antioxidant supplements or prescription medications that may interfere with study procedures or end points were not eligible for participation. Past smokers were allowed to participate in the study if cessation occurred more than 2 years ago. Each subject was studied once. A total of thirty-six subjects (nineteen men and seventeen women) were enrolled in the study; twenty-nine (fifteen men and fourteen women) completed all the protocol-specified procedures (Fig. 1).
Study progress: flow diagram of the participants in the 12-week grape seed extract (GSE) study. DM, diabetes mellitus; HTN, hypertension.

Beverage treatments
A purified GSE (MegaNatural® BP; Polyphenolics) with Generally Recognized as Safe (GRAS) status (FDA (GRAS Notice no. GRN 000125, dated 18 August 2003, FDA, USA)) was formulated in a fruit-based blend of apple, red grape, pomegranate and raspberry juices. The volume of the beverages was 12 fl oz. (355·0 ml) and contained 167 kJ (40 kcal). Beverages contained 0 g GSE (placebo) or 150 mg GSE with identical appearance and similar taste. The juice base contained 333 μg/ml total polyphenols, 0·5 mg/l gallic acid and non-detectable amounts of CT and EC (mg/l). Adding the GSE (150 mg) to the base beverage resulted in 744 μg/ml total polyphenols, 14 mg/l gallic acid, 18 mg/l CT and 14 mg/l EC. Total brix, acid and pH for the Placebo/control beverage and GSE-containing beverage was as follows: brix, 3·11 and 3·18; acidity, 5·92 and 5·88 g/l; and pH, 2·91 and 2·94, respectively (data provided by Polyphenolics Inc.( Reference Shen, Wu and Wang 19 , Reference Singleton and Rossi 20 )). Subjects drank the beverages twice per day for a total daily dose of 0 mg/d GSE (Placebo) or 300 mg/d GSE. Beverages were provided by Coca-Cola Company, on behalf of Polyphenolics. The use of 300 mg/d dose is based on our previous finding that inclusion of the same dose significantly reduced BP in the metabolic syndrome patients and pre-hypertension individuals( Reference Sivaprakasapillai, Edirisinghe and Randolph 14 , Reference Robinson, Lu and Edirisinghe 17 ). Beverages were prepared in three batches on three different occasions based on the dispensing plan of randomisation over the study period and stored in refrigerators with limited light exposure. The products were provided by the manufacturer with a unique randomisation code. Coded allocation envelopes for double-blinded randomisation were opened sequentially to assign subjects to respective treatments. Identity of the codes (Placebo or GSE) were kept in a sealed envelope until all the analyses were completed.
Study timeline
Eligible subjects started with a 2-week run-in period drinking the Placebo beverage twice per day. After the 2-week run-in period, subjects were randomised to one of the two groups (Placebo or GSE beverage), equally allocated to each treatment (1:1 randomisation ratio), according to a computer-generated randomisation scheduled by the study statistician. Subjects were counselled to consume their assigned beverages once in the morning and once in the evening preferably with meals. Subjects returned to the clinic biweekly to return all used and unused beverage bottles and to pick up their next 2-week supply. Compliance was documented by counting beverages consumed, and health status was assessed by documenting any adverse events. The follow-up phase was for 4 weeks with no treatment. Adequate allocation concealment remained until the study was concluded. Subjects were asked to maintain their usual level of physical activity and dietary habits throughout the study period. Dietary records were maintained by the subjects periodically throughout the study and reviewed by a staff dietitian to ensure compliance with usual dietary patterns.
Blood pressure measurement
BP was monitored using ambulatory BP monitors (Ambulo 2400; Tiba Medical, Inc.)( Reference Alpert 21 ) that were programmed to take BP and heart rate measurements automatically at 1-h intervals for a period of 24 h. BP measurements were scheduled at the screening visit (to determine eligibility) and at week 0, 6 and 10 of the intervention (for efficacy assessment). Day-time BP and night-time BP were divided based on the subject’s sleeping hours and hours awake, as indicated in their diaries, and were reviewed by the staff. Data were reviewed blinded, and when more than one measurement was recorded per hour the closest evaluable value to the hourly schedule was considered.
Metabolic responses
After 10–12 h of overnight fasting, fasting blood samples were collected at week 0 (baseline) and week 3, 6 and 10 of the intervention. Several analytical methods were used to assess the effects of GSE beverage consumption on plasma lipids, glucose, insulin, oxidised LDL (Ox-LDL) and soluble intercellular adhesion molecule-1 (sICAM-1). Plasma lipids and glucose concentrations were measured using standardised enzyme-based assay kits (Randox) using the Randox Daytona auto clinical analyser (Randox). Plasma insulin concentrations were measured using the AlphaLISA method (PerkinElmer). Plasma Ox-LDL concentrations were measured using ELISA assay kits (Mercodia Inc.). Plasma sICAM-1 concentration was measured by highly sensitive ELISA assays (R&D Systems). All assay protocols were performed according to the manufacturers’ instructions and appropriate quality controls were used as applicable. Homoeostasis model assessment for insulin resistance (HOMA-IR) was calculated using fasting insulin (μU/l) and fasting glucose (mmol/l) concentration divided by 22·5( Reference Matthews, Hosker and Rudenski 22 ).
Flow-mediated dilation
Flow-mediated vascular reactivity was studied in the brachial artery using methods recommended by the American College of Cardiology( Reference Corretti, Anderson and Benjamin 23 ). In brief, in a fasted state, the brachial artery was imaged by ultrasound (GE LOGIQ; GE Healthcare) and baseline measurements of vessel diameter (mm) were collected. A BP cuff was then applied below the elbow for cuff inflation to a pressure of 50 mmHg above SBP for 5 min. Immediately after cuff deflation, brachial artery vessel diameter was monitored and measured to obtain peak vessel relaxation. Ultrasound measurements were recorded as six individual measurements of vessel diameter. All measurements took place in the morning after an overnight fast and in a dim-lit, temperature-controlled room. Subjects refrained from intense physical activity and consuming caffeinated drinks, tea, coffee and wine for 24 h before their laboratory visit. Flow-mediated dilation (FMD) measurements were scheduled at week 0 and 6.
Height and weight
Height was measured to the nearest 0·5 cm using a wall-mounted stadiometer (Ayrton Corp.) and weight (light clothing only) was measured to the nearest 0·1 kg using digital scales. These data were used to derive BMI (kg/m2).
Analysis of plasma phenolic compound and metabolites
Chemicals
5-(4-Hydroxyphenyl) pentanoic acid (4-hydroxyphenylvaleric acid) was obtained from Alfa Aesar, 3-(3-hydroxyphenyl) propionic acid was purchased from Lancaster Synthesis Inc. and 3,4-dihydroxyphenylacetic acid, 3-hydroxyphenylacetic acid and 4-hydroxybenzoic acid were obtained from Acros Organics. Ferulic acid was obtained from Calbiochem, and hydroxyphenylpropionic acid, 3,4-dihydroxyphenylpropionic acid, 3-methoxy-4-hydroxyphenylacetic acid (homovanillic), 4-hydroxyphenylacetic acid, m-coumaric acid, p-coumaric acid, caffeic acid, gallic acid, benzoic acid, hippuric acid, methyl hippuric acid, protocatechuic acid, vanillic acid, 3-hydroxybenzoic acid, 4-hydroxyhippuric acid, 3-hydroxyhippuric acid, 3,6-dimethoxybenzoic acid, (−)-EC, (+)-CT and taxifolin were purchased from Sigma-Aldrich. 5-Phenylvaleric acid and syringic acid were obtained from the University of East Anglia (C Kay, personal communication). Water was prepared using a Milli Q system (EMD Millipore) to 18 MΩ resistance. All the solvents used for sample extraction and chromatography analysis as well as 0·22-μm syringe filters were obtained from Fisher Scientific.
Extraction of phenolic metabolites from plasma samples
Plasma samples were extracted using solid-phase extraction (SPE; Oasis HLB; Waters Corp.). In brief, the SPE cartridges were conditioned with 1 ml of MeOH followed by 1 ml of 1 % (v/v) formic acid. Taxifolin and 3, 5-dimethylbenzoic acid (10 μg/ml) as internal standards were spiked in 1 ml of plasma sample and were loaded into cartridges. The cartridges were then washed with 1 ml of 1 % (v/v) formic acid. The phenolic acids were eluted with 1 ml of MeOH. The eluate was evaporated to dryness using Eppendorf Vacufuge™ (Eppendorf North America) and residues were reconstituted with 100 μl of 0·1 % (v/v) formic acid in water.
Analysis of phenolic metabolites
The analysis of phenolic acid metabolites was carried out on a PerkinElmer Flexar HPLC. The analytical column used was a Phenomenex Kinetex PFP Column (4·6×100 mm, 2·6-μm particle size), operating at 40°C at a flow rate of 0·3 ml/min, and the mobile phases consisted of (A) water–formic acid (99·9:0·1, v/v) and (B) acetonitrile–formic acid (99·9:0·1, v/v). The separation was performed using the gradient elution programme: 0 min, 2 % B; 12 min, 20 % B; 17 min, 50 % B; and held for 3 min at 100 % B, followed by 5 min of re-equilibration of the column before the next run. The injection volume was 10 μl. The HPLC system was coupled with an AxION® 2 ToF Mass Spectrometer (PerkinElmer) equipped with an ESI interface operating in negative ion trap pulse mode. The MS parameters were as follows: flight tube: 10 kV; trap pulse mode: 100–450 m/z; IG exit low (D7): 18 μs, trap pulse delay (D8): 28 μs; capillary exit voltage: −80 V; drying gas heater: 350°C; drying gas flow: 15 litres/min; and nebulising gas pressure: 80 PSI. Liquid N2 was used as drying gas. Standard curves were prepared at six different concentrations (0·05–20 μg/ml) for quantitation of phenolics in plasma.
Statistical analysis
Subject characteristics were analysed using descriptive statistics from data collected at the screening visit. Group comparisons of continuous variables were carried out using independent (unpaired) Student’s t tests and categorical variables using a χ 2 test. Results were presented as numbers and percentages, as appropriate. Mixed model analysis of repeated measures was performed on each quantitative outcome variable to test main effects of beverage treatment (GSE, Placebo) and time (weeks) using PROC MIXED via Window PC-SAS (version 9.3; SAS Institute Inc.). For testing and selecting best covariance structure, model comparisons were examined using −2 log-likelihood scores and Akaike information criterion values from each structure. In the final analyses, treatment, time and interaction of treatment and time were included and the corresponding baseline value was included as a covariate. The Kenward–Roger correction and the method of restricted maximum likelihood were used in all mixed models. Independent sample two-tailed t tests were used to compare the magnitudes of change (Δ) from week 0 to week 6 and from week 6 to week 10 in SBP and DBP. Continuous variables were examined for normality, and data not conforming to normal distribution patterns were log-transformed before analysis. Outlier removal may have resulted in fewer evaluable subjects for secondary end points and were indicated accordingly. In a post hoc analysis of BP responses, median values of SBP and DBP at week 0 were used to split the subjects into groups with higher than or equal to the median value v. lower than median value and analyses were performed as noted above (mixed model and independent samples t tests).
Non-parametric Mann–Whitney test was performed to compare non-normally distributed total plasma concentration of phenolic compounds (GSE v. Placebo) at week 0, 6 and 10 using SPSS (version 19.0; IBM). Correlational analysis was conducted between total phenolic metabolites and changes in BP and metabolic outcome measurements using Spearman’s correlation in SAS. The results of the statistical analyses are presented as least squares means (LSM) with their standard errors unless indicated otherwise. Statistical significance was based on two-sided treatment comparison at the 5 % significance level under a null hypothesis of no difference between treatments.
Sample size estimates were based on the primary end point of SBP and the following assumptions: two treatments, mean difference in SBP between GSE and Placebo of 8 mmHg after 6 weeks of treatment and standard deviation of 8. Power calculations indicated a total sample size of thirty-four subjects (randomised in a 1:1 ratio to GSE or Placebo), assuming that 20 % attrition would provide >80 % power with a level of 0·05 to detect significant differences in SBP between GSE and Placebo beverages.
Results
Demographic and baseline characteristics
A total of thirty-six subjects were recruited into the study; twenty-nine subjects completed 6 weeks of GSE or Placebo (n 12 and n 17, respectively) and twenty-eight subjects completed the entire study, including the 4-week no beverage follow-up period (one subject from the Placebo group was lost to follow-up) (Fig. 1). The present study was conducted between July 2010 and June 2012.
Baseline characteristics of study subjects completing 6 weeks of GSE or Placebo (n 29) are presented in Table 1. Groups were well balanced; no statistical differences were observed between GSE and Placebo groups for age, BP, BMI, waist circumference, race/ethnicity or sex (GSE v. Placebo comparisons at baseline: all P>0·05). Body weights in both groups were maintained consistently throughout the study period.
Baseline characteristics of the study participantsFootnote * (Mean values and standard deviations; numbers and percentages)

GSE, grape seed extract.
* Independent (unpaired) samples t tests and χ 2 test showed no significant differences in baseline measures between groups.
Subjects’ dairy and returned bottle counts indicated that compliance of beverage consumption was between 80 and 100 % in both groups. Drinks were well liked and tolerated. GSE was found to be safe and no adverse events related to treatments were reported during the study.
Blood pressure
BP measurements were recorded for 24 h and split between day/awake-time and night/sleep-time for analysis (see ‘Methods’ section).
Day/awake-time blood pressure
SBP and DBP were not different between the GSE and Placebo groups at the screening or at baseline visits (week 0; P>0·05). BP did not significantly change in either group from screening to week 0 visits (P>0·05) or after the 2-week run-in with Placebo beverage.
Systolic blood pressure (mmHg)
Consumption of the GSE beverage for 6 weeks led to a significant reduction in SBP (week 0: 125·0 (sem 2·3) v. week 6: 118·0 (sem 2·3) mmHg; P=0·02, Table 2), whereas consumption of the Placebo beverage resulted in no change in SBP after 6 weeks (P>0·05, Table 2). The mean SBP of GSE- and Placebo-treated groups at week 6 was significantly different (118·0 (sem 2·3) v. 127·0 (sem 1·9) mmHg, respectively; P=0·003, Table 2). The magnitude of reduction in SBP after consumption of GSE v. Placebo beverage for 6 weeks was −7 (sem 3·2) v. 1·4 (sem 2·1) mmHg, respectively (P=0·03). After cessation of treatment beverages, mean SBP at week 10 increased in the GSE group to levels (mmHg) not different from baseline (125·0 (sem 2·3) at week 0 v. 124·1 (sem 2·0) mmHg at week 10, respectively (P>0·05)). No significant changes were observed in SBP in subjects assigned to the Placebo beverage.
Effect of beverage consumption on day-time and night-time blood pressure (Least squares means (LSM) with their standard errors)

GSE, grape seed extract.
a,b Mean values with unlike superscript letters were significantly different (P<0·05).
* P-value represents between-treatment comparison of Placebo v. GSE at each week based on the mixed model.
† Day-time results: GSE – week 0, 6, 10, n 12; Placebo – week 0, 6, n 17; week 10, n 16; night-time results: GSE – week 0, n 11; week 6, n 9; week 10, n 10; Placebo – week 0, n 15; week 6, n 13; week 10, n 14.
Diastolic blood pressure (mmHg)
Consumption of GSE beverage for 6 weeks lowered the mean DBP from 83·0 (sem 1·6) to 79·1 (sem 1·6) mmHg; however, this was not statistically significant (Table 2). The magnitude of reduction in DBP after consumption of GSE beverage for 6 weeks was −3·8 (sem 1·5) v. 0·7 (sem 1·8) mmHg after the Placebo beverage (P=0·08). No significant differences between groups in DBP were observed at week 10 (P>0·05).
In the subgroup analyses, subjects were categorically defined above or below the groups’ median BP values based on mean baseline (week 0) values (Table 3). The SBP median was 125 mmHg, and the DBP median was 83·5 mmHg.
Effect of beverage consumption on day-time blood pressure in the median blood pressure groups (Least squares means (LSM) with their standard errors)

GSE, grape seed extract; SBP, systolic blood pressure; DBP, diastolic blood pressure; sem, standard errors of the mean in subjects qualifying above or below the group median for corresponding blood pressure (mmHg).
a,b Mean values with unlike superscript letters were significantly different (P<0·05).
* Above the median SBP (GSE, n 6; Placebo, n 8); below the median SBP (GSE, n 6; Placebo, n 9). Above the median DBP (GSE, n 5; Placebo, n 9); below the median DBP (GSE, n 7; Placebo, n 8).
† P-value represents between-treatment comparison of Placebo v. GSE at each week, based on the mixed model.
Below the systolic blood pressure and diastolic blood pressure medians
There was no significant effect of consumption of the GSE or Placebo beverage for 6 weeks on SBP or DBP in the subgroup that fell below the group median (P>0·05).
Above the systolic blood pressure and diastolic blood pressure group medians (mmHg)
The mean treatment and treatment-by-week interaction for SPB was P=0·007 and 0·006, respectively. There was a significant effect of consumption of the GSE beverage for 6 weeks on SBP and DBP (P=0·0006 and 0·03, respectively), whereas no effect was observed with the Placebo beverage. The magnitude of SBP change from week 0 to week 6 was −13·6 (sem 3·9) mmHg for the GSE group and 0·01 (sem 2·8) mmHg for the Placebo group (P=0·01).
The mean treatment and treatment-by-week interaction for DBP was P=0·007 and 0·006, respectively. The magnitude of DBP change from week 0 was −5·8 (sem 2·0) mmHg for the GSE group and 1·0 (sem 2·2) mmHg for the Placebo group (P=0·06).
Night/sleep-time blood pressure
Data available for assessment of night/sleep-time BP were limited, averaging 5 (sem 2) (range 0–9) evaluable measurements during sleep due to error in readings, multiple measurement attempts and subject removal of cuff (complaints of sleep disturbance). Accordingly, variance and standard deviation was increased during night/sleep measurements. No significant differences between treatments at week 0, 6 or 10 were observed (Table 2; P>0·05).
Flow-mediated dilation
The mean percentage change in FMD from week 0 to week 6 after the GSE beverage was 7·4 (sem 1·5) v. 7·7 (sem 1·5) %, respectively (P>0·05). The mean percent change after the Placebo intervention was 9·9 (sem 1·3) v. 8·2 (sem 1·3) % (P>0·05). No significant differences were apparent between treatments on FMD at week 6 (data not shown).
Biochemical markers
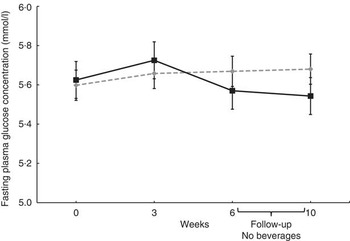
No significant effects of treatments on mean plasma concentrations of glucose, lipids, Ox-LDL or sICAM-1 were evident (Table 4). Fasting plasma insulin concentration and HOMA-IR at baseline indicated that most of subjects were hyperinsulinaemic or insulin resistant. No differences in glucose concentrations were evident (Fig. 2); however, fasting plasma insulin concentrations tended to be lower at week 6 after consuming the GSE beverage v. the Placebo beverage (P=0·09, Fig. 3), and improvements in insulin sensitivity as calculated by HOMA-IR were apparent (P=0·07, Fig. 4).
Effect of the grape seed extract (GSE) beverage on fasting glucose concentrations over the 6-week and 4-week follow-up period. Mixed model adjusted for the corresponding baseline value showed no significant differences between groups (week 0 to week 6, n 29; 4-week follow-up, n 28). Values are means (least squares means), with their standard errors. ![]() , Placebo;
, Placebo; ![]() , GSE.
, GSE.
Effect of grape seed extract (GSE) beverage on fasting insulin concentrations over the 6-week and 4-week follow-up. Mixed model was used and adjusted for the corresponding baseline value (week 0 to week 6, n 29; 4-week follow-up, n 28). Values are means (least squares means), with their standard errors. ![]() , Placebo;
, Placebo; ![]() , GSE.
, GSE.

Effect of grape seed extract (GSE) beverage on fasting homoeostasis model assessment for insulin resistance (HOMA-IR) over the 6-week and 4-week follow-up period. Mixed model was used and adjusted for the corresponding baseline value (week 0 to week 6, n 29; 4-week follow-up, n 28). Values are means (least squares means), with their standard errors. ![]() , Placebo;
, Placebo; ![]() , GSE.
, GSE.

Effects of grape seed extract (GSE) beverage consumption on metabolic profilesFootnote * (Least squares means (LSM) with their standard errors)

W, week; Ox-LDL, oxidised LDL; sICAM-1, soluble intercellular adhesion molecule-1.
* No significant differences were observed (P>0·05).
Phenolic metabolites
Fig. 5 shows the mean changes in total phenolic acid metabolite concentrations in plasma after Placebo and GSE beverages from week 0 to 6 and then week 10. The mean total plasma phenolic metabolite concentrations at week 0 was 5819·8 (sd 325·4) μg/l and increased to 138 317·2 (sd 37 977·2) μg/l after 6 week of GSE consumption, which was approximately 1·6 higher than the mean total phenolic acid concentrations after the Placebo beverage at week 6 (87 895·8 (sd 20 531·4) μg/l). Among the individual metabolites, the largest fold change was observed with hippuric acid, which resulted in an approximately 40-fold change from week 0 to week 6 after the GSE beverage and 25-fold change after the Placebo beverage (Table 5). Other distinguishing metabolites marking GSE consumption were 3-hydroxyphenylacetic acid, 4-hydroxyhippuric acid and homovanillic acid, which showed relative increases in plasma after 6 week of GSE consumption compared with the Placebo beverage (Table 5). Despite measurable changes, the changes in individual metabolites and total phenolic acid metabolites were not significantly different between GSE and Placebo beverages at 0 or 6 week (P>0·05). Likewise, no differences were observed between beverages at week 10, although a decline in total phenolic acid metabolites was observed after discontinuation of the beverages.
Effect of grape seed extract (GSE) beverage on changes in plasma concentrations of total phenolic acids over the 6-week and 4-week follow-up period. Non-parametric Mann–Whitney test showed no differences between groups and over time within group (week 0 to week 6, n 29; 4-week follow-up, n 28). Values are means and standard deviations. ![]() , Placebo;
, Placebo; ![]() , GSE.
, GSE.

Mean fasting plasma concentrations of phenolic acids after intake of grape seed extract (GSE) or PlaceboFootnote * (Mean values and standard deviations)

ND, not detected/below limit of detection; LOQ, limit of quantification.
* The non-parametric Mann–Whitney test showed no differences between and within groups over time.
No correlations were observed between the metabolites and any of the clinical measurements (data not shown).
Discussion
Functional foods are increasingly popular among consumers to maintain health and reduce the need for pharmacological intervention. The present study aimed to test GSE as a functional beverage to lower BP in people with pre-hypertension. Consumption of GSE included in a beverage for 6 weeks resulted in a mean reduction of day-time SBP and DBP by 5·6 and 4·7 %, respectively, compared with no change after consuming the same fruit juice-based beverage without GSE. Moreover, the BP-lowering effects of GSE were more pronounced in subjects with higher initial BP, which nearly doubled the effect size. After discontinuation of the GSE beverage for 4 weeks, BP increased back to baseline pressures, verifying the biological activity of GSE on BP.
Several studies have shown that GSE improves BP( Reference Sivaprakasapillai, Edirisinghe and Randolph 14 , Reference Barona, Aristizabal and Blesso 16 , Reference Robinson, Lu and Edirisinghe 17 , Reference Belcaro, Ledda and Hu 24 ). However, not all studies with GSE have produced significant or beneficial changes in BP( Reference Ras, Zock and Zebregs 15 , Reference Clifton 25 – Reference Sano, Uchida and Saito 27 ). This may be due to compositional differences between GSE products( Reference Sivaprakasapillai, Edirisinghe and Randolph 14 , Reference Robinson, Lu and Edirisinghe 17 , Reference Clifton 25 ), populations being studied (i.e. older adults may be less responsive due to the aged endothelium)( Reference Ras, Zock and Zebregs 15 ), or dosing issues, including too high of a dose based on percentage of monomers( Reference Clifton 25 , Reference Ward, Hodgson and Croft 26 ), combination with other therapies (e.g. diet and lifestyle management)( Reference Belcaro, Ledda and Hu 24 ) or incompatible dose combinations such as vitamin C+GSE( Reference Ward, Hodgson and Croft 26 ). Analysis of the plasma metabolites could also reveal important features related to efficacy. There are no data currently available characterising GSE phenolic metabolites in human plasma after chronic consumption. In the current study, fasting samples were analysed. These samples represent late phase metabolites generated from the microbes of the lower bowel. Total phenolic metabolite concentrations were approximately 1·6 times higher in the GSE group at 6 weeks compared with the Placebo group and reduced back to baseline after beverage discontinuation – an inverted pattern relative to mean changes in BP (i.e. decreased BP at 6 weeks and increased at 10 weeks). However, there was no significant correlation between the metabolites and BP response. The lack of significant correlation and differences between GSE and Placebo is likely due to the large inter-individual variability in plasma concentrations of all the phenolic acids, which have been demonstrated previously( Reference Urpi-Sarda, Monagas and Khan 28 , Reference Koli, Erlund and Jula 29 ). Differences in gut microbiota composition related to dietary, environmental and host genetic variance are among the reasonable and plausible explanations for the observed responses( Reference Mountzouris, McCartney and Gibson 30 , Reference Benson, Kelly and Legge 31 ). The most abundant phenolic acids identified with GSE intake were hippuric acid, 3-hydroxyphenylacetic acid, 4-hydroxyhippuric acid and homovanillic acid; however, these phenolic acids may also be microbial end products from sources other than grape seed( Reference Koli, Erlund and Jula 29 , Reference Rechner, Spencer and Kuhnle 32 ), explaining at least in part why some were also elevated in the Placebo beverage group, which had 333 μg/ml of total polyphenols from the fruit juice part of the beverage. Thus, although total and key phenolic metabolites increased with GSE supplementation, confirming compliance with drink consumption, there were no statistically definable metabolites to attribute the BP-lowering effects of GSE in this free-living population who were self-selecting their diets. Future investigations controlling all aspects of dietary intake (i.e. controlled feeding design) may reveal such information and unveil the role of dietary phenolic acids in cardiovascular health.
Possible mechanisms of action
MegaNatural® BP contains a mixture of monomers, oligomers and polymers of CT and EC. The composition ranges between 5·4 and 13·8 % monomers (US Patent No. 8,075,929). The composition of GSE is very similar to cocoa( Reference Natsume, Osakabe and Yamagishi 33 ). Research with cocoa suggests that the monomeric flavanols EC and CT are responsible for the BP and vasoactive effects( Reference Schroeter, Heiss and Balzer 34 ). These monomeric flavanols peak in the plasma within the first several hours following consumption and are cleared by 12 h( Reference Baba, Osakabe and Natsume 35 ). Similar to cocoa, the BP-lowering properties of GSE appear to be closely linked to the up-regulation of endothelial NO synthase (eNOS), resulting in increased endothelial NO and endothelial-dependent vasodilation( Reference Edirisinghe, Burton-Freeman and Tissa Kappagoda 18 ). In humans, FMD is a functional marker of endothelial function by assessing endothelial-dependent vasodilation. GSE consumption in the present study revealed no remarkable enhancing effect on FMD in the fasting state. The data are consistent with other research findings assessing effects of chronic GSE intake on vasodilation in the fasting state( Reference Ward, Hodgson and Croft 26 , Reference Kar, Laight and Rooprai 36 ). Several studies indicate that measuring enhanced vasodilation responses is best during peak concentrations of monomeric flavanols (CT and EC and their metabolites), which would occur 1–2 h after consumption( Reference Schroeter, Heiss and Balzer 34 , Reference Engler, Engler and Chen 37 , Reference Heiss, Kleinbongard and Dejam 38 ). The present study measured FMD 12–14 h after the last dose of GSE or Placebo, during which monomeric flavanols were cleared and not detected in plasma (Table 5). It is possible that an enhanced FMD response would have been apparent if the procedure had been conducted during peak CT/EC concentrations. Accordingly, the data do not allow a direct conclusion that changes in endothelial relaxation responses were responsible for the BP-lowering effects of GSE observed in this study. However, in contrast to our data, Barona et al.( Reference Barona, Aristizabal and Blesso 16 ) observed significantly higher FMD responses (P<0·0001) along with significantly decreased SBP (P<0·0025) in men with the metabolic syndrome after a 30-d treatment with freeze-dried grape polyphenolic powder equivalent to two servings of grapes per d. The structural differences of the compounds in GSE and freeze-dried grape polyphenolic powder may be responsible for the observed differences, although the product used in the present study delivered higher amounts of total phenolic compounds (approximately 528 v. 126 mg/d).
Other/additional mechanisms may be responsible for the effects of GSE on BP. These include inhibition of angiotensin-converting enzyme activity( Reference Ottaviani, Actis-Goretta and Villordo 39 ) or increasing endothelial NO bioavailability by inhibiting superoxide production from endothelial NADPH oxidase( Reference Alvarez, Rodino-Janeiro and Jerez 40 ). Vasorelaxation properties in response to GSE may also be achieved through insulin-mediated signalling pathways( Reference Addison, Stas and Hayden 41 ), which is of interest in the present study, given the observed trend in improvement in fasting insulin and insulin sensitivity calculated from the HOMA-IR. Evidence supports a link between hypertension and insulin resistance. The common mechanism, although not entirely understood and is often debated( Reference Hu and Stampfer 42 ), appears to rely on production and bioavailability of NO( Reference Kim, Montagnani and Koh 43 ). Under normal conditions, insulin interacts with its receptor and stimulates a phosphorylation cascade of proteins (e.g. insulin receptor substrate 1 (IRS-1), PI3/Akt kinase, eNOS) ultimately resulting in NO production causing relaxation of vascular smooth muscles. However, in the present study, data are not available to indicate increased NO or its by-products such as nitrate (NO3−) and nitrite (NO2−). The blood samples were collected after an overnight fast and 12–14 h since the last GSE beverage was consumed. Therefore, it is unlikely that significant changes in treatment-related markers of NO production would be observed in the fasting samples, unless microbial metabolites are effective in activating the eNOS signalling pathway, in which case significant changes in FMD might have been expected. Phenolic acids such as hippuric acid, hydroxyhippuric acid and homovanillic acid have been associated with FMD responses, but at markedly higher concentrations and not in the fasting state( Reference Rodriguez-Mateos, Rendeiro and Bergillos-Meca 44 ).
Insulin also participates in Ca-mediated vasodilation, which includes effective glucose transport and phosphorylation-enhancing Ca efflux and vasodilation. Alternatively, insulin resistance results in vascular resistance and elevated BP due to impaired PI3/Akt kinase activation and impaired Ca efflux( Reference Sowers 45 , Reference El-Atat, Aneja and McFarlane 46 ). Therefore, improving insulin sensitivity could presumably increase vasoreactivity and lower BP. Supportive epidemiology shows modest protective association between insulin sensitivity and risk of incident hypertension( Reference Goff, Zaccaro and Haffner 47 ) and higher risk of hypertension with higher fasting insulin concentrations in young women( Reference Forman, Choi and Curhan 48 ). GSE has been shown to improve postprandial glucose responses in people with the metabolic syndrome( Reference Edirisinghe, Randolph and Cheema 49 ) as well as prevent insulin resistance in fructose-fed rats by improving cellular insulin signalling( Reference Meeprom, Sompong and Suwannaphet 50 ). In a 15-d intervention with flavanol-rich chocolate, Grassi et al.( Reference Grassi, Desideri and Necozione 51 ) reported significantly decreased HOMA-IR, increased insulin sensitivity, increased FMD and decreased BP in men and women with essential hypertension and impaired glucose tolerance. In the present study, baseline insulin concentrations were elevated in most of the subjects (80 % had baseline fasting insulin over the 75th percentile cut-off of 13·13 μU/ml) and all subjects had baseline HOMA-IR values >2·5. Study results showed significantly reduced BP in the GSE group compared with the Placebo group and a possible trend to have improved fasting insulin levels and HOMA-IR, implying that changes in BP may have been related to changes in insulin sensitivity.
Strengths, limitations and future research
Overall, in the present study, GSE was successfully formulated in a low-energy functional beverage that was easily incorporated into the diets of people with pre-hypertension, resulting in lower BP. These data provide a promising dietary behaviour approach to achieve and maintain healthy BP. Strengths of the study design included a run-in period and a follow-up period without active intervention to clarify GSE-specific effects. The study also included measurement of polyphenol contents in the plasma along with measurements of biomarkers associated with improved insulin resistance, oxidative stress, inflammation and endothelial function, which have been suggested as possible mechanisms for reduction of BP. A limitation of the study, however, was that, despite sufficient power to detect statistical differences on the primary end point of SBP, the study was not sufficiently powered to detect significant differences on the secondary end points. Therefore, it is possible at least partly that some of the observed trends in decreased secondary end points, specifically DBP and insulin resistance, did not meet statistical significance due to insufficient sample size. Similar issues were apparent for the plasma phenolic compounds. We observed large inter-individual variability in plasma phenolic concentrations, requiring a greater sample size to address variability issues. Further, the complete absorption and metabolic kinetics of GSE constituents are not fully understood. Future investigations are warranted to address questions specific to efficacy, bioavailability and complete metabolite profiles. Finally, a strength and limitation of the study was that we did not control the diets of subjects. Therefore, effects of the GSE beverage were observed in a real-world situation: free-living group of people with pre-hypertension. However, this may also be a reason for some of the variability seen in secondary end points. Future studies with diet-controlled conditions or greater sample size would help address this point.
The present study supports the use of GSE as a functional ingredient in a low-energy beverage to reduce the risk of hypertension in an at-risk population. From a public health standpoint, every 1 mmHg reduction in the SBP could prevent approximately 10 000 CHD deaths each year in the USA( Reference Lewington, Clarke and Qizilbash 3 ). Moreover, a recent publication by Kishi et al.( Reference Kishi, Teixido-Tura and Ning 52 ), indicated that controlling BP in young adulthood has important implications for long-term heart health. Trends towards improvements in insulin and insulin sensitivity suggest that – but do not confirm – regular consumption of GSE beverages may offer metabolic benefits and warrant follow-up studies.
Acknowledgements
The authors are very grateful to Colin Kay from the University of East Anglia, UK, for kindly providing 5-phenylvaleric acid and syringic acid, Dirk M. Holstege and Paola Quifer-Rada from the Analytical Laboratory and Neil Willits, University of California Davis, for their technical assistance and the subjects who participated in this study.
This work was supported by Polyphenolics (grant number 2009-050).
The authors’ contributions were as follows: B. B.-F. designed the research, reviewed data and interpreted results; I. E. and E. P. conducted the research and acquired data; I. E. performed laboratory analysis and interpretation; Y. Y. C. and A. W. performed phenolic analysis and interpretation; E. P. conducted statistical analyses and drafted the manuscript; B. B.-F. had primary responsibility for the final content of the manuscript. All the authors contributed to critical review and revision of the manuscript for important intellectual content. All authors read and approved the final version of the manuscript. The sponsor was not involved in designing the study, data analysis or interpretation of results.
None of the authors has any conflicts of interest.


